interviewer and respondent psychologicaland ... of health interview statistics...
TRANSCRIPT

NATIONAL CENTER Series 2
For HEALTH STATISTICS “Number 26 “
PROPERTYOF THE : PUBLICATIONSBRANCH EDITORIAL LIBRARY
VITAL axacl HEALTH STATISTICS
DATA EVALUATION AND METHODS RESEARCH
the influence of
Interviewer and Respondent Psychologicaland Behavioral Variables on the Reporting in Household Interviews
A methodological study of the relationship of the behoviors, attitudes,
perceptions, and information levels of the respondent and the inter-
viewer to the levels of reporting health information in household inter-
views.
Washington, D.C. March 1968
U.S. DEPARTMENT OF
HEALTH, EDUCATION, AND WELFARE Public Heolth Service
John W. Gardner Wil Iiam H. Stewart
Secretary Surgeon General

Public Health Service lui)li.’ation \o. IOC)O-Series 2.s0. Z6
For sale by the Superintendent of Documents, U.S. rlovemment Printing Office, Washington, D. C., ‘20402- Price 45cents

NATIONAL CENTER FOR HEALTH STAT STICS
THEODORE D. VV’OOLSE~, hkCtoT
PHILIP S. LAWRENCE, SC.~.,: ‘:~.ssociateDirector
OSWALD K. SAGEN, PH.D.,, Assistant Director /or Health Statistics Development
WALT R. SIMMONS,M.A., Assistant Director for Research and Scientific Development
ALICE M. WATERHOUSE, M.D., Medical Consultant
JAMES E. KELLY, D. D. S., Dental Advisor
LOUIS R. STOLCIS, M.A., Executive O//icer
DONALD GREEN, 17Z/O~cZtifM o//iCf?r
D1V1S1ON OF HEALTH INTERVIEW STATISTICS
ELIJAH L. WHITE,Director
ROBERT R. FUCHSBERG, ChiefSwvey Methods Branrb
GERALDINE A. GLEESQN, Chief.Analysts and Reports Branch
COOPERATION OF THE BUREAU OF THE CENSUS
Under the legislation establishing the National Health
Survey, the Public Health Service is authorized to use, insofar as possible, the services or facilities of other Federal, State, or private agencies.
In accordance with specifications established by the
National Health Survey, the Bureau of the Census, under a contractual arrangement, participates in most aspects of survey planning, selects the sample, collects the data, and carries ou t certain parts of the statistical processing.
Public Health Service Publication No. 1000-Series 2 Ne. 26
Library of Congress Catalog Card Number 67-61847

FOREWORDIn attempting to develop procedures and devices which will increase
the accuracy and completeness of data collection in the Health Interview Survey, the National Center for Health Statistics has had a continuing program of methodological studies conducted by contractual arrangement with the Survey Research Center, Institute for Social Research, The University of Michigan. *
The present study, carried out with the cooperation of the U.S. Bureau of the Census, was undertaken for the purpose of identifying some of the major variables that may affect the degree of success with which health information can be collected by the interview method. Research in this area in the past has focused principally on the training and supervision of interviewers and on the development of a standard inter-viewing instrument which can be applied in a standard manner, namely, the questionnaire. There is little doubt that these two approaches have improved th& level and consistency of reporting, but no real break-through in methodology has been accomplished.
More recently researchers have begun to consider the respondent as a major source of reporting bias and have turned their efforts to gaining some understanding of the respondents attitudes and perceptions in relation to his demographic characteristics.
In the present study consideration has been given to many aspects of the interview, with particular emphasis on the individual attitudes, behaviors, and backgrounds of the respondent and the interviewer and the interaction of these characteristics during the course of the inter-view.
This study, which introduces a new dimension in NCHS survey re-search programs, suggests more effectively increased rather than by attempting levels of information.
The cooperative efforts have resulted in a better have made it possible to testing.
that interview reporting accuracy can be by changing the behavior in the interview to change basic attitudes or to increase
of the three agencies involved in the study understanding of the interview process and develop a series of hypotheses for further
Elijah L. WhiteDirectorDivision of Health Interview Statistics
. . . 111

------------------------------------------------------------
------------------------------------------------------------------------------------------------------------------
------------- -----------------------------------------------------------------------------------
-----------------------------------------
---------------------------------------------------------------------------------------------
------------------------------------------------------------------------------ ---------------------
------------------------------------------------------------------------------------------
----------------------------------------------------------------------------------
---------------------------------------
-------------------------------------------
----------------------------------------------------
-----------------------------------------------------------------------------------------------------------------
-------------------------------------------------------------------------------------------------
-----------------------------------------------------------------------------------------------------
----------------------------------------------------------
------------- --------------------- --------- --------- ---------
---------------------------------------------------------
CONTENTS
Foreword
Introduction Background Interview Variation Respondent Variation Sources of Data for theStudy
The Study Model ------------------------------------------------------
Methods of Investigation Observation Procedure HIS hterviewer Ratings Respondent’s Reactions to the HIS kterview Interviewerts Reactions to the HIS Interview
Principal Ftidings Summary of Principal Ftidings Respondent Characteristics Interviewer Characteristics Behavior During the Interview
The Study Design and Sample
Description of the Health Interview Survey General Orientation to the Health Interview Survey Objective Interviewers Interviewer Tratitig Type of hterviewThe Interview ProcessRespondentsSummary
Respondentts View of the Health Interview Survey Respondent’s Level of Information RespondentAttitudes and Perceptions Attitude Differences for Subparts of the Sample
Page
. . . 111
1 1 2 2 2
3
4 4 4 4 4
4 5 5 5 6
6
7 7 7 7 8 8 8 8 8
8 8
11 13
v

-------------------------------
-----------------------------------------------------------------
----------------------------------------------------
------------------------------------------------------------------------------
----------------------------------------------------------------------------------
-----------------------------------------------------------------------------------------
-------------------------------------------
-------------------------------------------------------------------------------
--------------------------------------------------------------------
-----------------------------------------------------------------
------------------------------------------------------------------------------
---------------------
---------------------------------------------------------------------------------------
------------------------------------------------------------------------------------------------------------------------------------------
-------------------------------------------------------------------------------
----- ----------------------------------------------------------------
------------------------------
----------------------------------------------------------------------------
---------------------------------------------------------------------
---------------------------------
-----------------------------------------------------------
CONTENTS—Con.
Page
Attitudes and Feelings of the Interviewers
Description of the Interview From Observation RecordsObservation TechniquesCharacteristics of the SRC Observation ProcedureObservation Item Pretesting and SelectionDescription of the Observation Form ContentObserver TraifingDescriptive Data From Observation RecordsInitial ContactQuestion-Answer BehaviorUnrelated ConversationReactions to Unrelated ConversationInterview Behaviors and Respondent Demographic Characteristics
Hypothesis TestingThe Dependent Variable, Reporting AccuracyDemographic Characteristics and ReportingBehavior ~ring the InterviewDemographic Characteristics and BehaviorsInterview Behavior and ReportingRelationship Among BehaviorsBehavior Similari~at EmremesFactor Analysis of Interview Observation Variables
Psychological Orientation of the RespondentBack~o~dRespondent OrientationsMotives for CmperatingPerceptions of the Task
Psychological Orientation of theInterviewerStyle of InterviewingInterviewer Feeling About Job and QuestiomaireIn~erviewer E~ectationsInterviewer Orientations on the Interview
Interpretationof the Findingsconclusions and Possible ImplicationsFurther Interpretations of the FindingsImplications for Future ResearchImplications for Interviewing Practice
I
References
13
15 15 15 16 16 16 17 18 18 19 20 21
22 22 22 23 23 24 24 26 27
28 28 29 30 31
32 32 33 33 34
34 34 35 36 37
37

----------------------------------------------------------
------------------------------------------
------------------------------------------------------------------------------------------------------------------------------------
----------------------------------------------------------------------
---------------------------------------------------------
------------------------------------------------------------------------------------------
----------------------------------------------------
--------------------------------------------------------
---------------------------------------------------------------------------------------
-----------------------------------------------------------------------------
------------------------------------------
---------------------------
CONTENTS-Con.
Page
Bibliography
Appendix I. Factortiadings
Appendix II. ~dex ConstructionThe Dependent Variable
Relation to AccuracyDiscriminability ------------------------------------------------:-UnderreportingInitial Attempts To Construct a Dependent VariableFinal hdexof Reporting AccuracyCharacteristics of the Final Index of Accuracy
Behavior hdexesConstruction of hitialhdexesConstruction of Major Behavioral Orientations Indexes
Indexes of Respondent OrientationIndexes of Respondent Feeling Ahut InterviewRespondent Motivation and Concern
Indexes of Interviewer OrientationValidity of hdexes
Appendix III. Description of the Coefficient GammaIntroductionSignificance Test of Gamma
Appendix IV. ~ehterview Observation Form
38
39
40 40 40 41 41 41 42 42 43 43 43 43 44 44 46 47
49 49 49
50
vii

IN THIS REPORT a methodological study is descvibed which was de-signed to identify some of the major variables velating to the level of the reporting of health information in a household interview. Procedures developed to evalwate the in.uence of despondent and interviewer vwigbles during an o bsevved interview sitwation include (1) a description in the form of a series of “snupshots” of the ongoing behavior of the participants during the interview, (2) the rating by the interviewer of her perceptions of and attitudes toward the despondent and the inter-view, (3) a reinterview to obtain respondent reactions to the interview, and (4) a discussion with the interview concerning her attitudes toward hev job, her reaction to specific aspects of hew work, and her feelings about the interview situation.
The model constructed for the study assumed that demographic characteristics, expem”ences, feelings, and attitwdes of the participants in the interview were the principal causal factors of reporting and tkzzt these factors were mediated by the behaviors exhibited. However, the findings of this study indicate that behaviors are the most important variables in determining the course of the interview, with psychological and demo-graphic characteristics having minimal predictive value.
. . .Vlll

THE INFLUENCE OF
INTERVIEWER AND RESPONDENT
PSYCHOLOGICAL AND BEHAVIORAL VARIABLES ON THE REPORTING IN HOUSEHOLD INTERVIEWS
Charles F. Cannell, Ph. D., FIoyd J. Fowler, Jr., Ph. D., and Kent H. Marquis, Ph.D.
Survey Reseavch Center, Institute fov Social Research, University of Michigan
INTRODUCTION
Background
For years survey practitioners and users of survey data have been concerned about problems of inaccuracies in interviews. For example, Myers f1study of age data obtained by interviewers in the 1940 Decennial Census found a marked “heaping” of ages ending in zero, such as 10, 20, and 30, Hanson~ and his colleagues at the U.S. Bureau of the Census conducted reinterviews of families regarding their status in the labor force. Significantly different responses were obtained fo$ about 40 percent of the items of the interview. Hyman8 reported a study conducted during World War II which showed that nearly half the respondents known to have cashed war bonds during the week previous to the interview failed to report this to the interviewer.
In attempts to isolate and provide tech~ques for overcoming these problems, early attention was centered upon the interviewer. In 1929 Stuart Rice published a pioneering article entitled “Contagious Bias in the Interview. f14Rice was working
with some interviewers who were collecting in-formation to determine reasons fcir destitution of men living. in cheap hotels and floph@U3e&In reading the interviews he discovered that various re. sponses received by one interviewer were sim
ilar to one another but different from those received by another interviewer. He also discovered that respondents of one interviewer consistently reported overindulgence in liquor as the cause of their destitution whiIe respondents of another interviewer tended to blame social and economic conditions. An investigation showed that the former interviewer was a prohibitionist and the latter a socialist.
Katz5 showed that interviewers from working-class backgrounds consistently obtained more radical social and political opinions from respondents than did interviewers from the middle class.
Since early studies have demonstrated significant differences between interviewers, it is not surprising that much attention has been devoted to measuring the effect of interviewers on re-search results and to seeking a means of over-coming potential bias. Two main lines of activity have resulted. First, greater emphasis has been placed on the adequate training and super-vision of interviewers, and, second, research workers have given more attention to the wording of questions in order to provide the interviewer with a standard instrument which can be applied in a standard manner. The objective is to obtain greater control over interviewer participation. However, interview studies still report sizable interviewer variance, the antecedents of which are largely unknown.
1

Interview Variation
Several factors may be responsible for inter-view variation. The interviewer’s attitudes, her expectations of the respondent, her motives, her social and occupational class, and even her physi. cal appearance have all at times been shown to be related to the results she obtains in interviews. Such findings were considered at one time to be relevant only when the subject matter of the survey was psychological (perceptions, attitudes, and motives) as contrasted with cognitive inquiries (level of information, descriptive data, and ,SO forth). It becomes clear as more research is done that the “attitude” versus “fact” dichotomy is not valid. The reason appears to be that even though the subject matter of the inquiry may be nonattitudinal, the interviewer and the respondent have perceptions, attitudes, and motives about the in-formation, interview, and each other which may affect the accuracy of the responses which are obtained during the interview. A respondent’s in-come is an objective, nonattitudinal variable, but feelings about one’s income and about reporting it are very strong among some people. Almost any descriptive data may be influenced on occasion by strong emotional feelings.
There is no question but that better training of interviewers results in more accurate data, but even now not too much is actually known about factors underlying and leading to inaccurate re-porting, although speculation abounds. If the problem could be solved simply, the solution probably would have been discovered long ago. Although small advances have been made toward improvement, no real breakthrough in methodology has occurred.
Respondent Variation
Recently, researchers have begun to turn their attention from the interviewer as the sole source of bias to the other participant in the interview—the respondent. Research is being focused more specifically on the respondent’s in-
formation, perceptions, attitudes, and motives, Even more important, however, is the growing realization that the product of an interview is not solely the result of either person, but rather it is the outcome of the interaction between the two-. each with his individual attitudes, perceptions, and motives and each with his own personal characteristics.
Studies such as those cited above provide a basis for speculating alxmt where some of the sources of inaccurate data may be and for considering various theoretical bases for understanding the problems.
It was against this background that the Survey Research Center (SRC) and the Health Interview Survey (HIS) planned the present study. The hypotheses which were stated were at a broad, general level, and for the most part it was felt that systematic and controlled exploration of the interview would be a profitable first step. From this study it was hoped that the researchers could select, sharpen, or generate hypotheses or identify variables which showed sufficient promise to be worth further testing. This study, then, is an exploration to provide a better understanding of the Health Interview Survey interview and to develop a series of hypotheses for further testing.
Sources of Data for the Study
Five sources of data were used in the study— the reported health information and demographic characteristics obtained in the HIS interview; questionnaires measuring the personal and social characteristics of the interviewer; questionnaires tapping respondents feelings, motives, attitudes, and information about the interview; an inter-viewer rating form describing the respondent, the interview, and the interviewer’s impressions and feelings; and a procedure which recorded the on-going behavior in the interview. Basic to the study was the intention that the results should be indicative of specific changes which would improve reporting in the HIS.
2

—. I
THE STUDY MODELa I
As a basis for considering some of the relevant variables in this exploratory research, the following model of the interview is presented:
RFSPONDh?lZ INTERVIEWER
Demographic Demographicc Personall.ty Personality XnfonnatSon Training
rl Interviewingexperience
* u[ Attitudes
m
The model assumes that the outcome of the interview is a joint product of background characteristics, psychological attributes, perceptions, and behaviors of both persons taking part in the interview. The emphasis is on the psychological characteristics of persons, the effects these per-sons have on each other, and the resultant effects on reporting accuracy. According to this conception, knowing only about one set of variables or knowing only about one of the persons in the situation will not provide enough information to predict completely the course and outcome of the inter-view.
The first set of variables consists of the basic characteristics of the individuals such as their demographic characteristics, abilities, personalities, beliefs, levels of knowledge, normative standards, and effects of experience and other learning situations. It is assumed that these characteristics form the basis for the more flexible attitudes and expectations which are important in the interview.
At the next level, it is assumed that attitudes, expectations, and emotions based on these psycho
aThis model is taken from R. L. Kahn and C. F. Cannell, The Dynamios of Interviewing, New York, John Wiley and Sons, Ino., 1957.
logical characteristics play a major part in determining how the interviewer and respondent perceive the interview situation. In this study a major attempt was made to measure a wide range of attitudes, expectations, and motives which were relevant to the interview. For example, this re-search measures attitudes toward health, respondent attitudes toward the whole interview experience, and interviewer attitudes toward her job. Possible respondent motives for cooperating, such as a citizen orientation or hopes of deriving personal benefit from participation, are measured. Interviewers were asked questions concerning how they expect their respondents to react to different aspects of the interview.
For purposes of presenting this model in a simplified form, it is arbitrarily assumed that the behavior of each person is based on what are called here her “perceptions” (how she interprets the situation). Her interpretations are based on what she already believes and knows and on what she learns from the behavior of the respondent. The determinants of perceptions are undoubtedly much more complex than this since they are probably also arrived at on the basis of nonbehavioral cues about the respondent’s social class or ability that are obtained from her physical appearance, her type of neighborhood, her manner of speech, and from other sources. In this study, attention was primarily focused on how well the respondent understood what she was supposed to do as a respondent (e.g., did she know that she was supposed to report all health ailments and the use of health facilities for all relevant members of the house-hold). Interviewers were asked to describe, using a check list, how they perceived each of their respondents on several dimensions.
The perceptions of persons are assumed to be the final determining link with behavior, and be
havior in the interview determines how accurately health information is reported. This study measured a wide range of behaviors in as great detail as possible.
Reporting accuracy is hypothesized to be de-pendent not on the behavior of only one of the interview participants during interview but on both. The choice of dependent variables will be discussed in detail later. They consist of reports of health from the HIS interview.
3

-
. ..
METHODS OF INVESTIGATION
Since the present study was designed primarily as a basis for identifying some of the major variables relating to the accuracy of re-porting health informsJion in the Health Interview Survey, it might be described as a search for hypotheses upon which to base further studies within the framework of the model specified above. Meeting this objective required the development of procedures which would focus attention on the behaviors, attitudes, perceptions, and information level of both the respondent and the interviewer and obtain some insights into the interaction be-tween the two participants in the HIS interview. To do this, questionnaires were constructed for both the respondent and the interviewer, and special observational techniques were developed to permit a standardized and reliable method of measuring the behavior of both the interviewer and the respondent during the course of the HIS inter-view. A description of these instruments and the procedures follows. The Interview Observation Form is reproduced in Appendix IV, and other forms used are available on request from the Survey Research Center.
Observation Procedure
A special observation technique was designed to provide a permanent record, in the form of a series of “snapshots, ” of the behavior of the interviewer and the respondent at intervals during the interview.
Of the several techniques used previously to record ongoing behaviors, two were found to be relevant to the present study. 6!7Although the procedures developed for this study used some of the techniques of both these systems, they are unique in most respects, Items were selected which it was felt would best describe the significant behaviors of both participants in the interview and which could be observed and recorded reliably. The procedures and forms are described in more detail in a later section of this report.
HIS Interviewer Ratings
Following the HIS interview, the interviewer made several ratings of her perceptions Qf and
attitudes toward both the respondent and the interview. These ratings were similar to ratings made by the observers at the end of each inter-view.
Respondent’s Reactions to the HIS Interview
To obtain respondent reactions to being interviewed, a second group of interviewers from the Survey Research Center were sent out to re-interview the respondents on the day following the HIS interview. The questionnaire used for this interview contained a large number of open questions that covered such topics as the respondent’s information and perceptions of the HIS, her motives for cooperating, and her reactions to various aspects of the interview. Probing for negative feelings was emphasized, and some semiprojective techniques were used to make it easier for the respondent to make critical remarks.
Interviewer’s Reactions to the HIS Interview
Each of the 35 HIS interviewers was inter-viewed by Survey Research Center interviewers after all of her observed interviews were completed. Questions were asked about her attitudes toWard her job, about how she felt about inter-viewing different types of respondents, about her reactions to specific aspects of her work, and about her reactions to the questions on the HIS questionnaire.
Information from the HIS was used as a source of data for respondent demographic characteristics as well as for her reports of health information,
PRINCIPAL FINDINGS
According to the model, respondent and inter-viewer characteristics such as experiences, feelings, motives, and attitudes are the principal causal factors of reporting in the interview. They are. mediated by behaviors and perceptions of the other person’s behaviors. The results of this study cast doubt on the causal links postulated in the model and suggest a different ordering of the variables with respect to importance. Specifically, it appears that the psychological characteristics and demographic characteristics measured are of
4

minimal predictive importance. The behaviors and possibly the mutual perceptions of these behaviors have appeared as the variables of greatest importance in determining the course of the interview,
Summary of Principal Findings
The data from this study may be cast into four main findings which have direct relevance to understanding the dynamics of the information-gathering household interview.
1, Respondent feelings, level of information about the survey, motives, attitudes, and perceptions when measured the day after the interview are not directly related to health reporting behavior.
2. Interviewer attitudes, preferences, styles of interviewing, or expectations as measured here are not related to the reporting of conditions she obtained from her respondents.
3. Respondent demographic characteristics showed no important systematic associations with the reporting index.
4’. The amount of behavior in the interview shows a strong association with reporting. Both the task and interpersonal behavior indexes of the interviewer and the respondent were positively related to the re-porting index. The higher the level of behavioral activity in the interview the better the overall reporting on the part&f therespondent.
Respondent Characteristics
Several things were learned from the reinterview of the respondent which took place the day after she participated in the health interview. The general level of knowledge about the purpose and sponsorship of the interview was low; and even though the respondent was sent a letter explaining the purpose of the household interview survey and telling her that an interviewer would call on her, there was almost no improvement in this knowledge. The major predictor of respondent’s information level was her general level of
education—higher educated respondents had more relevant information than did those with lesser education.
Two major attempts were made to assess the respondent’s overall reaction to the interview. When questioned directly, about one-third of the respondents reacted positively to the interview, more than half were “neutral, and the remainder were classified as reacting negatively. Using a semiproj ective technique in which the respondent was asked to “describe the feelings of the per-son in the picture, ” almost half of the respondents were classified as reacting at least somewhat negatively to the interview.
The reason given most frequently for cooperating in the survey was that it is a citizen’s duty to do so. The next most frequently given reason was that the respondent merely enjoyed being interviewed or enjoyed having a chance to talk to someone.
The most frequently given reason for not cooperating was that the respondent did not know the purpose of the surveyor that she felt that surveys in general were not worthwhile.
There were practically no criticisms of the interviewer. Respondents see the interviewer as highly educated, highly trained, and as a professional rather than a clerical or neighborly person. Although respondents were divided in their preferences for a businesslike or friendly interviewer, almost all of them said that their interviewer was just right.
Some criticism of the questions was given; there was slightly more among the higher income respondents. The major complaints were that the questions were too personal or too detailed.
Interviewer Characteristics
The 35 HIS interviewers employed on this study were interviewed after they had completed all of their assignments. Most of them expressed very favorable attitudes toward their jobs. The main appeal was the chance to come in contact with other people; however, they did not like the idea of going into dirty homes or bad neighbor-hoods.
They stated preferences for interviewing respondents who were demographically similar to themselves or who, on the basis of other attri-
5

butes, were easy to interview. Most interviewers felt respondents enjoyed the interview. Very few said respondents reacted negatively.
Behavior During the Interview
A description of the HIS interview was obtained by counting and recording the behaviors which took place. It appears that the interviewer gave a short introduction to the HIS and that respondents took most of the initiative in inviting the interviewer in and setting the stage for the interview. Respondents usually appeared polite and receptive at the door.
The question and answer process generally followed the programed procedures specified in the Inte?wieweYfS ManmL8 As a rule, interviewer activity was confined to asking questions and probing for answers. Respondents usually answered the questions adequately, but they often volunteered extra information not needed by the interviewer to fill out the questionnaire. Radical departures such as the respondent asking the interviewer to clarify a question or a respondent consulting records were seldom noted.
Irrelevant conversation was more frequent than might have been expected and was initiated primarily by the respondent rather than the inter-viewer. Respondents usually talked abut them-selves or about those for whom they were re-porting, or they laughed and joked. The very few instances of nonquestion-related conversation initiated by interviewers were primarily concerned with the respondent or were instances of laughter or joking. Respondents reacted more favorably to irrelevant initiations than did the interviewers.
In general, older respondents showed a higher level of behavior than did the younger ones. Inter-viewers did a little more initiating of irrelevant conversation for the higher educated and higher income respondents but showed more specific initiative of a directive sort for the lower educated, the lower income, and older respondents.
originally, based on previous research and theory, it was felt that the behaviors in the inter-view could be classified on at least two dimensions, interpersonal and task oriented behaviors. It was possible to make this distinction in devising the recording form, but the data indicated that
behaviors classified by this system were, in fact, highly related to each other or nonorthogonal, In an attempt to understand how the interview behaviors should be classified with respect to eacl other, the behavior data were subjected to factor analysis (see Appendix I). In spite of the emergence of two orthogonal or independent factors, one ir which task behaviors loaded highly and the other in which interpersonal behaviors showed exclusively high loadings, a plot of the actual behaviors in the factor space suggested that if the two dimensions existed psychologically, they were better described as oblique (not independent). In addition, one of the most surprising findings was that the interviewer and respondent usually behaved on the same level of task and interpersonal behavior, especially when the level of behavior in the interview was either very high or very low. Hence, according to these data, the best way to classify behavior in the HIS interview is on a single dimension of activity rather than by trying to make distinctions between the quality of the behaviors or distinctions between the behavior levels of the interviewer and respondent,
THE STUDY DESIGN AND SAMPLE
Health Interview Survey interviews are supervised by the 12 regional offices of the Bureau of the Census. Between 7 and 10 interviewers work out of each regional office, receiving assignments each week or every other week. Each assignment calls for interviews at about 18 households in the same primary sampling unit (PSU). The inter-viewers are expected to complete their assignments as early in the week as possible, and they usually interview 10 or 12 respondents by Tuesday of the week in which an assignment is received,
In order to save travel costs, the sample for this study was drawn from areas serviced by six of the regional offices and included all of the United States east of the Mississippi River with the exception of a small section of the Northeast. It was felt that six regions were needed to insure an adequate sample spread of lmth urban and rural and northern and southern areas.
Within each region, a sample of six inter-viewers was chosen, one for each week Qf the study. Observers attended all of the interviews
6

---------------------
------------------------------------------------------------
---------------
---------------------
-------- -------- -------- ---------------------------
---------------------
-------- ------- ------- ---------------------------------
---------------------
------------------
---------------------
taken on Monday and Tuesday of each week. The reinterviewers for the followup interviews were told to reinterview only those respondents who could be contacted in the 2 days following the original interview. Even with this restriction, 90 percent of the respondents were reinterviewed. Only 13 respondents (3 percent) refused to be re-interviewed.
In all, 412 respondents were observed and reinterviewed. Table 1 shows the composition of the sample.
Eligible respondents in the health interview—that is, people who could report for them-selves as well as for other members of their families—were adults 19 years of age andover or married residents of the household. However, single people 17 or 18 years of age could respond for themselves but not for other people. Adults not related to the head of the household were required to answer for themselves. As shown in table 1, a high proportion of respondents were women.
DESCRIPTION OF THE HEALTH INTERVIEW SURVEY
Genera! Orientation to the
Health Interview Survey
Before discussing the descriptions of the HIS from the point of view of respondents, inter-viewers, and behavioral records, a brief outline of the general characteristics of the Health Inter-view Survey will be given. In addition to providing a brief overview of HIS procedures, this description points out that the HIS represents one of several possible types of household interviews. Therefore the findings of this study cannot be applied to all household interviews automatically,
A complete description of the aims and methods of the HIS may be found in three earlier publications. ‘-1 1 The information in these publications is applicable to current operation and goals.
Obiective
The main objective istoprovide data on illnesses, impairments, accidents, and injuries of persons; on use of medical, dental, and hospital facilities; and on allied health-related topics.
Table 1. percent distribution of demo-graphic characteristics of 412 respondents in the sample
Percent Demographic characteristics distri
bution
Age
Total 100
Under 35 years 27 35-54 years 39 55-74 years 28 75 years and over 6
Race I Total 100
l===== White 85 Nonwhite 15
Sex I Total
G
Male 20 Female 80
Family income I Total 100
$0-$1,999----------------------- 14 $2,000-$3,999------------------- 21 $4,000- 6,999------------------- 2.5 $7,000- $ 9,999------------------- 20 $10,000 ormore--.-----.-------- 14 Income unknown 6
r Education I
Total x
Interviewers
The interviewers are female, part-time employees of the Bureau of the Census. Most have graduated from high school and a few have had
7

some college education. Compared with other interviewer jobs in the United States, the HIS inter-viewer’s job is fairly demanding. She must carry out 15 or 16 extremely complicated interviews as early in the week as possible, often calling at a household several times before information is obtained. Her workload varies, depending upon the population density of the area to which she is assigned. Her task is largely repetitive, but it changes enough from time to time that she must be adaptive. She is aware that extensive quality control records are being kept on her performance; and she is required to fill out “homework” tests throughout her term of employment.
Interviewer Training
An explicit assumption of Health Interview Survey planners was that interviewers can represent a large potential source of bias in data collection. Anyone familiar with the early research on interviewing techniques will recognize the validity of such an assumption: The Bureau of the Census has concentrated on creating a detailed job procedure description and, in addition, has provided for extensive training and continuous supervision of interviewer performance.
Type of Interview
The HIS is a survey sponsored by the U.S.
Government and therefore carries a high degree of legitimacy for the majority of respondents.
The questionnaire contains a large number of detailed questions about demographic and health characteristics. The questions call for the reporting of largely factual information. The health questions emphasize recall of past conditions, the impact of these conditions, the utilization of health services and facilities. The task is undoubtedly difficult and taxing for many respondents. At-tempts are made to minimize the effects of the respondent’s personal perception of his own state of health in collecting objective health information.
The Interview Process
A letter explaining the sponsorship, general purpose of the survey, and the confidential nature of reported information is sent to each household prior to the interviewer’s arrival. When the inter-viewer arrives, she is instructed to introduce her-
self, mention why she is there, and then to begin the interview without volunteering further ex-planation. The interviewer proceeds through the questionnaire, adhering to the printed format exactly. Irrelevant conversation is expected to be minimal, and a respondent who deviates from the subject is quickly brought back to the questions. Instructions in the Intewiewer’$ Mm.d define how the interviewer should answer certain respondent questions and how to handle other specific problems with respondents. In general, the iriteraction is task oriented, with only a minimum of attention paid to respondent behavior,
Respondents
The HIS is based on a national sample, but most respondents are housewives and must report information both for themselves and related members of the household if the latter are not present, Respondents are informed only generally about the purposes and content of the interview. Some re. spondents receive almost no information and many others do not remember anything about the information they did receive,
Summary
This brief description of HIS is intended to call attention to features in which this type of h’tterview differs from other household interview projects, Differences occur in such areas as objectives of the planners, type of interviewer, demands made on the interviewer, type of inter-view content, legitimacy of sponsor, construction of the interview, and eligibility of respondents. It is necessary to take such factors into account when considering how these data might be applied to other types of interviews.
RESPONDENT’S VIEW OF THE HEALTH INTERVIEW SURVEY
This section of the report summarizes the highlights of the reinterviews with regard to the respondents’ perceptions of and feelings akdut the HIS interview.
Respondent’s Level of Information
There is a common assumption that it is necessary for the responderit to have some information about the interview in order to report health
8

--
�
events accurately—the more information avail- however, it is impossible to identify the sources able, the better the reporting can be, To gather of a respondent’s information, since the reinter-data to test this assumption, one of the objectives view was conducted after the respondent could of the reinterview was to ascertain the amount have been exposed to all three sources. and accuracy of information which respondents Adequate addresses are often not available had about the HIS interview, to researchers. Therefore theletterandbrochure
Respondent information about the survey may not have reached al.lof the households to be comes mainly from three potential sources. The interviewed. Even. if the information did reach first is his general level of sophistication about the correct address, itmaynot have reached the the U.S. Public Health Service and about research correct family in a multifamily dwelling or the and surveys in general. Having such information person who eventually served asa respondent in may be useful if it provides a positive reason for a single-familyd welling. It was estimated that noreporting, It may also be indicative of how read- more than 73percent of theletters weredeliveredily the respondent understands and assimilates to the intended family. Even where the addressnew information. The second source of information appeared adequate, 42 percent of the respondentsis the printed materials from HIS-a letter and reported reading neither the letter nor the brobrochure mailed to the respondents home prior chure (table 2). Not surprisingly, when the ad-to the interview from the Bureau of the Census. dress was unclear, reported readership wasveryThe third source is the interviewer, in mention- low.ing why she is there and in answering questions A comparison of level of readership by char-
which arise during the interview. acteristics of respondents showed surprising
Ideally one would analyze data separately for similarities. Respondents of all age, educational,
the three sources of information. In this study, and income groups reported similar readership. There was a slight tendency for women to have read more than men.
The main interest in this analysis is to dis-Table 2. Number and percent
bydis txibut ion cover the level of respondent information aboutof persons in the sample, readership
of advance materials according to ade- the task he is being asked to perform, i.e., to bequacy of address a respondent in the Health Interview Survey. Sev-
I ‘eta’””-l===@41
eral questions were asked in the reinterview to Total ascertain the leveI of information about the Pub-
Materials read Pe:ps
sample
a;$%:s $K-address
lic Health Service, surveys in general, and the HIS in particular,
In general the results indicated a low level of
Number of persons 412 301 78
information in all areas questioned. Those who reported reading the letter and brochure were slightly better informed than the nonreaders. More
Percent distribution important than readership was educational level of the respondent. The high educational group was better informed than the lower educated. Even‘OO1
Both letter 100within the higher educational group, however, the
and brochure. 28 3.5 Letter only-.. 21 23 1: Nef.ther letter
nor brochure- ij~l 42 85 r ,
NOTE: 33 cases where the adequacy of the address was unclear are excluded.
information level was low. Data on the information level for different educational groups are shown in tables 3, 4, and 5,
Advance materials were not effective in communicating information even though they were especially prepared for that purpose. The main factor in the amount of information was the re-

--------------------------
--------------------------------- -----
----------------------------------------------
---------------------------------------------------------------
------------
--------------------------
--------------------------------------
-------------------------------------------
-----------------------------------
Table 3. Number and percent distribution of persons in the samPle, by resPonse ‘o ‘hequestion ‘Who did the interviewers work for?” according to education of respondent
Education of respondent
Total
Response persons
Not Highin high school
sample school graduategraduate and above
Number of persons 412 1222 190
Percent distribution
Total 100 100 100
Interviewer works for:U.S. Bureau of the Census 11 5’ 161A Federal health agency 20 11 29A health agency 17 17 1/“The Government’’Did not know or was not ascertained 4; 6! 2:
lIncludes 4 responses for which education was not ascertained.
Table 4. Number and percent distribution of persons in the sample, by response-to thequestion “Why is the information being collected?” according to educat~on of;espondent
Response
Number of persons
Total
Information being collected:For statistical purposesTo help the Nation’s healthTo find answers to specific health problems----For legislative purposesGave vague response or did not know
Totalpersons
insample
412
Education of respondent
Not Highhigh schoolschool graduate
graduate and above
1222 I
Percent distribution
+! 100 I 100 I
34 26 425 62 1 :
5; 6; 5:
lIncludes 4 responses for which education was not ascertained.
10
190

--------------------------
--------------------------------------
-----------------------------------------
------------
--------------------------------
Table 5. Number and percent distribution of persons in the sample, by response to the question “What does the U.S. Public Health Service do?” according to education of,
respondent
Education of respondent
Total Response persons
Not Highin high schoolsample school graduategraduate and above
I
Number of persons 412 1222 190
I Percent distribution
Total l=====
Knowledge of Public Health Service: Specific or general, indicating some knowledge Y
of Public Health Service 35 Vague or obviously incorrect Heard of it, but did not know its function 3! Never heard of the Public Health Service 20 Not ascertained 2
I
lIncludes 4 responses for which education was not ascertained.
spondent’s educational level. Respondents generally did not have much information about the survey purpose orsponsorship. Manyrespondents participated in the interview with little knowledge of the organization conducting the survey or of why it was being conducted. Withthisbackground, it is interesting to see how respondents react to being interviewed in the HIS.
Respondent Attitudes and Perceptions
In the reinterview, respondents were asked questions to obtain their general reactions tothe HIS interview. Their reactions might have been influenced by such factors as how busy therespondent was, how she felt about her health, how she liked the interviewer, or how much health information she hadto report.
Previous studies have shown that somereapondents tend to respond more positively than they actually feel when asked direct questions about any interview; this is probablybecausethey do not want to say anything which might reflect unfavorably on the interviewer, For this reason, indirect questions were also asked. Respondents
were shown three pictures,one ning of an interview with the door, a second showingtwopeople showing the interviewer leaving ing the interview. Respondents
showingthebegininterviewer at the
sitting,thethird the housefollowwere asked how
the person in the picture was feeling. In addition, direct questions were asked later about therespondent’s general reactions to the interview. Responsesto both the direct and indirect questions, categorized as positive and negativeaffect, are.shown in table 6.
The proportion of respondents with positive reactions was about the same for both typesof questions, but, as wasexpected, theindirectquestions brought outa significantlyhigherproportion of negative reactions. It must be pointed out that ttnegativet!was broadly interpreted and did not
necessarily imply major unhappiness or criticism. For example, among the 50 percent who gave anegative reaction to the picture of the end of the interview are many who simply said that the respondent was glad the interview was over.
When asked for reasons for a positive response, respondents mostoftensaid thattheywere glad to be of service in a worthwhile activity. The
11

-------- -------- --------
-------- -------- ---------- ---------------------------------
--------- -----------------------------
Table 6. Percent distribution of the 412 from indirect and direct question about interview
Respondent affect
Total . ..-.*.
Positive . .Qualified posi.ti.veNeutral or equally posit%ve and negati.ve--Quali.fied negative-.--.--..-.--.- . ...---”-Negative . . . . . . . ----------- -.Depends, did not knowNot ascertained --.----- . . . . . . . . . . ...”-----
next most frequent responsewasthat therespondent enjoyed the interview itself—either enjoyed responding to the questions or enjoyed talking to the interviewer,
The most common reasons givenfor negative reactions were that the respondent did not know enough about why she was being interviewed,i,e., she did not know the purpose of the survey, and she had a feeling that the survey was not worth-while. Some mentioned specific problemswiththe questionnaireor the@estions, There werevirtually no negative reactions tothe interviewer,Only 3 percent had any specific criticism to makeof her, while 68 percent of respondents had positive statements to make about the interviewer,
Several questions were asked about therespondent’s perception of the interviewer since it was felt that these perceptions might influence how conscientiously the respondent role wouldbe performed. ofparticular interest was the levelof expertise and professional status attached to the interviewer. In general, respondents saw inter-viewers as being somewhat better educated than they actually were: 53 percent thought the inter-viewers hadat least some college. Further, over half thought that the interviewers must have had
persons in che sample, by respondent affect the i.ntervi-ew according ~0 phase of the
I IIIndirect questions about how Overallthe person feels-- reaction
tm directAt In After qlM&onbeginning middle interviewofl-- of
I
is over interviewinterview interview
Percent distribution
100 LL#LH
20 11 25 19 } 30 { 10
1! 34 6 31
2: :: } 50 { ; 23 1;
2 6 1:
at least 6 months of special training for her job, When presented with a list of possible profe ssional and nonprofessional roles—ranging from doctor, teacher, to clerk, salesman, neighbor, etc.— nearly half thought that the interviewers role most closely resembled that of a social worker, aprofessional role. Overall, 60 percent selected a professional role asmostresembling that of the interviewer while 19 percent thought she most resembled someone in clerical or sales occupations. The remainder considered her role more personal, resembling that of a neighlmr or friend,
Respondents did not agree as to whether the interview should be strictly businesslike and efficient or whether it should allow for’ ‘visiting” and friendly interaction, About 40 percent voted for a strict businesslike interview while another equal percentage wanted visiting, This question was followed by one asking whether the respondent would have preferred the interviewer to have been more businesslike or more friendly. Nearly 90 percent said that they preferred the interviewer to behave just as she did, only 8 percent wished she had been more friendly, and 2 percent wished she had been more businesslike.
12

---------------------
------------------
---------------
-----
---------------
---------------------
-------- ---------
-----------
-----------------------------------
----------------------------
-----------
!f’able 7. Frequency distribution of most and least preferred aspects of inter-viewer job
INumberof
Reasons given inter-viewers
Total 35
l====
Most preferred aspects:Enjoy meeting peopleFlexible working hoursOther (traveling, money, etc.)No~ ascertained
Least preferred aspects: Dirty homes, bad neighborhoods 10 Physical hardship (bad roads,
long hours, etc.)------------Tiine production pressures Other (imposing on
respondents, too much or too li.?xle work, etc.)----------- 12
Not ascertained 1
Attitude Differences for Subparts of the
Sample
When the da~awere analyzed in reference m specific demographic groups, a few differences appeared. Older respondents had somewhat more favorable attitudes toward the imerviewt handid the younger, This positive attitude was not connected withan accurateperception oftherespondent role—older respondents were more likelyto report that the interviewer wanted only general rather than exact answers,
Better educated respondents tended tomention more specificnegativefactors—reluctanceto give up time, inconvenience of the time of the call-and they were more likely to prefer. the interviewer tobe businesslikeinher approach.Although somewhat more negative generally, they had a clearer perception of their role asarespondent, and they were more likely to think that the interviewer wanted exact answers. They also more often reported the desire to be of public service as apositive reason for participationin the interview.
ATTITUDES AND FEELINGS OF THE INTERVIEWERS
On completion of her assignments for this
study, the HIS interviewer was interviewed bya
staff member of the Survey Research Centerto measure her attitudes, feelings, and perceptions. In tables 7-9several questionsfrom thisinterview
have been selected togive apicture ofhowthe35
HIS interviewers reacted to the job of beingan
interviewer, how they felt about thequestionnaire with which they were currently working, and how they felt about their respondents.
It appears that the main attraction ofthe job
was that it offered the interviewer a chance to
Table 8. Frequency distribution of inter-viewer feelings about the cmestionnaire and interview
—
Question and response
Total
5. Are there any things that the respondents find too personal or embarrassing to re-port?
Response:Yes-----------------------No------------------------
22. . . are there some sectionsof the questionnaire with whichrespondents have particulartrouble?
Response:Yes --.,----Depends on the respondent-No------------------------Not ascertained
15. Do you feel that the interviews are too long or not?
Response:Too longQualifiedNot too longDid not knowNot ascertained
Numberof
inter-viewers
35
29 6
31 2
:
16 7
; 1
13

--------
-------------------
--------
------------------
-------- -------- -----
-----------
-----------------
----------
----------
--------------
-----------
-------------------
meet differentpeople.Thisreasonwasgivenfirstby most oftheinterviewers tootherinpreferencepossibleresponsessuch as gettinga chanceto
havingextramoney,ordoingapublictravel, service.As major reasonsfordislikingthejob,interviewersmentionedhavingtogo intodirtyhomesor undesirable havingto endureneighborhoods,
Table 9. Frequency distributions of interviewer orientations to respondents
— Numberof
Question and response inter-viewers
Total---------------------
1. In general, how do respondents feel about being inter-viewed? Do they like it, notlike, or what?
Response:Generally positiveGenerally neutral---------Some like it, some do not-Generally negati.veNot ascertained
2. What things do respondentsusually enjoy most about beinginterviewed?
Response:Chatting, visitingBeing good ci,tizen, helping
;~:~;ered at being chosen-
Nothing enjoyed
9. Here Ls a list of kinds ofrespondents;which would youprefer to interview? (Inter-viewer was allowed to selectmore than one kind of respondent.)
Most chosen type:Concerned about health----Quiet---------------------Friendly------------------Middle income ($3,500-
$10,000) Middle aged (30-60 years)-College educatedWomen---------------------
Least chosen type:Low income (under $3,500)Grade school education----Over 60 years of age------Men---.---.----.---.------
35
1211462
23
4
:3
262422
19191716
11
:
Table 10. Gamma coefficients showing thedirection and degree of association between how hard the interviewer had towork in the interview and her ratingsof the respondent
Directionand
degree ofassocia-
Rating of respondent tion withhow hardthe interviewerworked
Respondent tenseness +.62Respondent ability to understand questions -.72Respondent cooperativeness---- -.58Respondentwillingness togive time-------------------- -.48Respondent accuracy -.57How much interviewer likedrespondent -,48
Other comments (negative signindicates more critical thanpositive comments)----------- -,61
1A description of the statistic gamma,a nonparametric coefficient of association, is given in Appendix III.
conditions hardshipsuchas drivinginofphysicalbad weatherand puttingin longhours,or beingaway from home overnight 7).(table
Interviewers asensitivityindicated toproblems which theirrespondentshadwiththequestionnaire 8}.Most interviewers(table feltthatthequestionnaire itemswhichweretoopercontainedsonalorembarrassingfortherespondenttoreporteasilyand thattherewere some sectionsofthequestionnaire respondentswhichweredifficultfortocopewithforvariousotherreasons.Abouthalf
thoughtthe interviewsof theinterviewers weretoolong.
HIS interviewersportrayedrespondentsingeneralas eitherenjoyingorbeingneutraltowardtheinterview althoughexperience, asmallminorityof theinterviewersfeltthatrespondentsingeneraltendedtoreactnegativelytobeinginterviewed.Most interviewersfeltthatrespondentsenjoyeda chancetotalkwithsomeonenewand thatthiswas probablythemost enjoyableaspectofthe interviewfor therespondent.Interviewers
14

themselves tended to prefer certain types of respondents. In table 9 it can be seen that inter-viewers preferred to interview respondents who were interested in the topic of the interview, who behaved in such a way as to make conducting the interview easier (a preference for quiet rather than talkative respondents), and who were friendly rather than businesslike. They also preferred interviewees who were demographically similar to themselves (moderate income, middle aged, higher education, and female). They tended not to prefer respondents who had low income, low educat ion level, who were over 60 years of age, or who were male.
From the ratings which each interviewer made of each of her respondents after the HIS interview, it would seem that the harder the inter-viewer had to work, the less she liked the respondent and the greater the likelihood that she would rate the respondent as tense, inaccurate, uncooperative, and unwilling to give of her time. Furthermore, the interviewer was more likely to make a negative rather than positive comment about such a respondent at the end of her rating form. Table 10 shows the degree of association between the interviewer’s rating of each respondent and her rating of how hard she had to work in each inter-view.
From these data it appears that interviewers like the opportunity to get out and meet other people, and they feel that respondents like to meet them and are willing at least to put up with the business part of the interview. Interviewers do not like to interview respondents who are demographically different from themselves. Interviewers react negatively to difficult respondents in the ratings and yet are sensitive to respondent problems in the interview. Since these interviewer rating and preference data will not be discussed further in this report, it should be pointed out here that there is no evidence from this study to indicate any relationship between interviewer preferences or interviewer feelings and the measure of respondent reporting accuracy employed. Preferences and feelings may exist but they do not produce a discernible effect on the data.
DESCRIPTION OF THE INTERVIEW
FROM OBSERVATION RECORDS
Observation Techniques
One of the principal instruments used to collect data in this study was the Behavior Observation Form, a technique for recording what went on during the interview. Since this technique was developed especially for this study, a detailed description is provided here.
For the purposes of this study, the observation procedure had to meet three general criteria:
1. It should describe as much of the significant behavior which takes place during the interview as possible
2. It should obtain reliable and valid measures of the concepts of interest
3. It should be simple enough that people not acquainted with observation techniques could be taught the procedure in a relatively short period of time and could use it in the field without difficulty
A search of the literature revealed several procedures for observing and recording inter-action between two persons or more. However, it was found that none combined the criteria of comprehensiveness, reliability, validity, and economy required for this particular study; therefore it was necessary to design a new procedure specifically for this study.
Characteristics of the SRC Observation
Procedure
The observation procedure was designed to obtain measures of a wide range of behaviors of both interviewer and respondent while keeping the observer’s job simple so that it could be done adequately with relatively little training. The various activities of interviewer and respondent were broken down into small segments of easily identifiable behaviors. The observer’s job was to make tallies or checkmarks when the specific behaviors were observed.
15

To record a wide variety of behaviors, the interview was divided into segments, each containing a specific set of questions from the HIS questionnaire. For each segment, several types of behaviors were observed. By sampling segments of the interview in this way, observation could be focused on different kinds of interviewer and respondent activity, with measures obtained on a variety of behaviors while keeping the task within the observer’s capability.
Problems of validity were resolved partially by recording only directly observable behavior, i.e., words spoken or gestures used rather than inferred behavior. Inferences about the psychological meaning of the data were made after the objective data were recorded. These inferences were made both by the observers in the form of a set of ratings made at the end of the interview and by the experimenters in the data analysis presented in this report.
Observation Item Pretesting and Selection
A set of initial items was developed and subjected to intensive laboratory and field testing. Laboratory testing involved actual and simulated interviews observed simultaneously by three members of the research staff. Fieldtesting consisted of observation of actual HIS interviews by members of the research staff.
If any one of the staff judged an item or procedure difficult or impossible, it was eliminated or simplified. An item was also discarded if agreement between observers was consistently low in the staged interviews,
On the basis of these pretests, many items were eliminated and others simplified. Items which were eliminated were those for which reliability was low and could not be improved easily as well as those which required too much time to record. A number of the items involving complex judgments were deleted or shifted to the last section of the observation form so that the observer could have time to think about them after the inter-view, For example, observers tried to rate whether the respondent “shows lack of under-standing” after each respondent answer. Because this judgment took too much time and was unreliable, it was moved to the end of the observation form and the observer was asked to make a rating
on: “How well did the respondent grasp the mean. ing of the questions?” Most judgments which re. quired the observer to use visual cues (e.g., pos. ture and facial expressions) proved unreliable an{i were discarded.
Also eliminated were codings of long sequences of interaction, indicating what was said, who said it, what was the reaction of the other person, and so forth. Finally, most of the t imt: recordings were eliminated— both measures 01 duration (e.g., amount of time spent answering t. particular question or explaining the survey) ancl actual times (e.g., when the interviewer enterec[ the house, when the first question was asked), Several efforts were made to get an objective indication of the pace of the interview (e.g., how fast the questions were being asked or answers being given), but all proved impossible and subjective ratings had to be used. Use of a stop watch was found to be of no great value.
Description of the Observation Form
Content
The observation form is divided into four major sections. The first section includes behaviors occurring during the first minutes of contact between the interviewer and respondent, both at the door and inside the house, as the preparation for the interview takes place; the next section focuses on the interview itself, including the question and answer exchanges between interviewer and respondent; the third section concentrates on events taking place after the last interview question has been answered; and in the final section, the observer records general impressions of the interview.
Different behaviors were recorded within each of the major sections of the interview,
Observer Training
For this study the U.S. Bureau of the Census, the agency which collects the data for the Health Interview Survey, selected six HIS interviewers to be trained as observers.
During the week before the field work began, the six observers were trained at the Survey Re-search Center. Training sessions were primarily concerned with the goals of the study, a detailed explanation of the Interview Observation Manual,
16

----------------
------------------------------------------------
Table J.L. Percent of interviews in whichselected explanationswere used by interviewers to introduce the survey
Percentof inter-views inTopic used in introduction which itwas mentioned
U.S. Bureau of the Census----- 96U,S, Public Health Service----interview process2------------ i:H13 (specifically)------------Advance letter f?;0ther3------------------------ 41
lNumber of interviews= 412.
‘Anythingwhich describes the inter-view for example, “I want to ask samequestions about your health,” or “Itshould take about 20 minutes,”
~Usually indicates interviewer showedher credentials to respondent, but neglected to mention either of the sponsoring agencies,
and practice in observing and recording staged interviews. The staged interviews followed care-fully prepared scripm covering all aspects of the form and stressing difficult items. Furthermore, each simulated interview was taperecorded while it was inprogress. Differences among observers concerning any verbal behavior were resolved by listening to the tape recordings.
To supplementtherole-playedinterviews,twotrainingfilmswere madeof stagedHISinter.views.For thesefilms,an experiencedHISinterviewer questionedtwo respondentswho had noconnectionwithtbeHISorwith SRC. The moviesprovedvaluable ofusinginconveyingthesubtletiesthe observationform, and theycouldbe rerunwhen questionsarose,
One halfdayoftrainingwas devotedtoactualfieldexperience, wouldbavesothatthe-trainersanopportunity andtodealwithtoanswer questionsproblemsthatdidnotappearinthecontrolledsetting.
Trainingperformancerecordswere keptforeachobserveron sixstagedinterviews,including
thetwo movies,and servedas acheckupon theamountofinterobserver efiected.reliabilitytobe
In ordertoeliminate sourceofonepotentialbias,itwas continually observemphasizedtotheersthatthestudywas notdesignedto“checkup”on theircolleagueswhorntheywouldbeobserving.Itwas stressedthatrespondentperformancewasofprimaryinterest,
Descriptive Data From Observation Records
ofthereportisa descriptionThissection oftheHIS interviewasitwasobservedusingtheob
proceduredescribedabove.servation Thedataarepresentedtoprovidea generaldescriptionofwhatHIS interviewlookslikeas observedbythistech-nique.The dataarebasedontbeobservationof412HISinterviews.
Table 12. Average frequency of interviewer and respondent behaviors at the beginning of each interview and percentage of interviews in which the bebavior occurred
Behavior
Number of different topics mentioned by interviewer inintroduction-.--.----“---.----------------------.-------------
Number of respondents’ questionsNumber of polite acts initiated by respondentsNumber of times interviewer takes initiative (getting in door,selecting a chair, and so forth)------------------------------
Percent ofAverage interviewsfrequency in whichperinterview behavior
occurred
2,45 100 20.51 40
1.22 73
0.55 41
lRecorded from the time interviewer knocked on door until first question from ciuestionnai,rewas asked,
‘Approximate;if respondent asked more than two questions, this was treated as if she had asked only two.
17

-----------
---------------
---------------------
-------------
------------
-----------
-----------------
-------
Initial Contact
Table 11 shows the distribution of explanations used by the interviewers at the beginning of the interview. From this table it can be seen that most frequently the interviewer mentioned that she was from the Bureau of the Census and that she was taking a survey for the Public Health Service. If she said anything beyond this minimum identificat icm, it was usually something about the inter-view process, such as how long it would take or that the questions pertained to health issues.
On the average, the interviewer mentioned about 2?4 introductory topics at the beginning of the interview (table 12).
In about 40 percent of the interviews the respondent asked some questions before he permitted the interviewer to enter the house. A count was kept of the number of behaviors indicating polite-
Table 13. Average number and percent distribution of task related behavior in sampled segments of the interview
Average Percent number of total
Behavior per recorded inter- task
view behavior
Interviewer
To’cal 6.2 100
Repeats question as worded 0.7 11
Other nondirective probes
Directive probesClarifies meaning of
2.4 2.2 :;
question 0.8 13
Suggests other sources of information be consulted 0.1 2
Respondent
Total 53.4 100
Acceptable answers---- 39.0 7: Inadequate answers----Elaborated answers---- 1::: 21 Requests clarifica-
tion 1.0 2 Consults other information sources 0.2 (1)
Questions adequacy of answer-----------k--- 0.2 (1,
lLess than .5 percent.
18
ness by the respondent, such asinvitingtheinter. viewer inside or offering her a chair. Another count was kept of the number of times the inter. viewer had to take theintiative inaskingtobe let into the home, finding a chair for herself, and s{) forth. The average respondent made 1.2 polite gestures at the beginning ofthe interview ,and7:l percent ofthe respondents madeatleastone Palit(: gesture. The interviewer took some initiative in 41 percent of the interviews.
Question-Answer Behavi,or
Table 13 containsa description of behavior$: in the interview relevant either togainingorgiving information necessary to fill out the health questionnaire. These are the main behaviors relating directly to the task. The behaviorswererecordecl for three sections of the interview andcombinec into single scores. The results are presented in terms of the average frequency of each behavior in the three sampled sections of the interview and its frequency relative totheothertask related behaviors. The latter is expressed as a percent of the total task related behavior recorded in the three selected sections.
Table 13 shows the kinds of behavior used by the interviewer in obtaining health information after the initial question had beenasked. Probes— directive, nondirective, and repeating the question-made up 85 percent of the interviewer’s task behavior. The average interview contained five probes in the three sampled sections. Non-directive probes were slightly more frequent than directive probes. While nondirective probes are generally more acceptable techniques, the reader should not conclude that the directive probes necessarily produce biased information. Frequently they merely check on what the respondent is thought to have said, for example,’ ‘You said that was within the last six months, didn’t you Mrs. Smith?”) lt is clear from the table that the interviewer took little initiative in suggesting that medical records, hospital bills, and other sources of information be consulted.
Table 13 also shows the behavior of the respondent in answering questions for the same three sections of the interview. The major activity was the giving of acceptable answers, those for which the interviewer did not need to probe further, One surprising finding is the high frequency with which respondents elaborated or voluntarily furnished

------------
--------------
----------
----------------------------
------------
----------------
----------
----------------------------
more information than required by the question. Such elaborations characterize 21 percent of the answers in the average interview.
An average of 2 answers were given by the respondent which were inadequate to meet the objective of the question. For an answer to qualify as inadequate, it had to be probed by the inter-viewer, and the observer had to concur that probing was required to obtain the needed information. In the table it appears that interviewers probed an average Iof about 5 times in the sampled parts of the interview. The discrepancy may reflect both conflicting definitions of probing and also “superfluous” probing by interviewers.
The other respondent behavior categories show a low frequency of initiative on the part of the respondent in requesting clarification of a question, consulting other sources of information, and questioning the adequacy of an answer.
The overall picture from this table is of a reasonably cooperative respondent who seldom gave inadequate information and who often volunteered additional information and of an interviewer who did not probe excessively and who incorporated a variety of techniques when she did use probes. Neither takes special initiative in searching for other sources of information beyond the question and answer process.
Unrelated Conversation
Table 13 deals with those behaviors which are an intrinsic part of the questionnaire and thus anticipated by the designers of the interview. Regardless of how well designed and well engineered an interview schedule and procedure may be, behaviors which are not relevant to the questions and answers do occur. Because these behaviors may play an important part in determining the accuracy of information gathered from an interview, they received special attention in this study. Rather than record them from particular parts of the interview, observers attempted to record every instance of behavior which was not directly related to the task outlined by the questionnaire. Each such behavior was categorized by whether it was initiated by the interviewer or by the respondent as well as by content. Finally, the observers recorded the reaction of the other person to this behavior. Table 14 shows the content and frequency of behavior initiations which are not directly related to health information, For ease
of reference this is called “unrelated conversation” or “interpersonal behavior.”
Throughout the average interview, the inter-viewer initiated 1.7 instances of unrelated conversation (table 14). About half of these are classified as humor—the classification includes anything from a short chuckle to the telling of a funny story. Nearly all of the remaining initiations-40 percent of the total— were directly concerned with the re
spondent and took the form of flattery, praise, non-health questions, and suggestions. The respondent initiated nearly 16 instances of unrelated conversation during the average interview. These are divided about equally between “humor” and “talking about self, family, friends. ” Only rarely was the respondent observed to have initiated conversation directly “almut the interviewer or about the interview. The high frequency of “talking about self, family, or friends” was an unexpected finding. This category did not appear in other descriptions of task oriented interaction, and it proved valuable in further analysis of the data from this study.
Table 14. Average number and perca-t distribution of unrelated convezsa~i,orh initiations by interviewer and respondent during entire interview
Interviewer I Total
l=== Talks about the re
spondent 0.68 Talks about self, fam
ily, friends 0.19 Talks about the inter-
view 0.00 Laughs, jokes 0.81
Respondent I Total
U=
Talks about the inter-viewer 0.34
Talks about self, family, friends 7.58
Talks about the inter-view 0.69
Laughs, jokes 7.26
Percent of
total initia
tions
100
40
11
4:
100
2
48
4 46
19

--------------
--------------------------------------
--------------------------------------------------------
-------------
---------------------------------------
--------------------------------------------------------
Table 15. Number and percent distribution of unrelated conversation initiations, by interviewer and respondent reaction according — to content of initiation
Content of initiation
Total respondent initiation
Talks about interviewerTalks about self, family, friendsTalks about the interviaLaughs, jokes
Content of initiation
Total interviewer initiation
Talks about respond~tTalks about self, familyi friendsTalks about the titerviwLaughs, jokes
These findings suggest that the interviewer and responded haddifferent orientationsto theinterviewsituation ingeneraI.
Generalizing from the conversation data,it may be suggested that respondents were more active than interviewers in initiating tmrelated comments ‘and were more preoccupied with their Own interests. The use of humor is particularly interesting since some research finds thathumor is frequentlya reactiontotension.12 Thusthedata presentedheremay indicate thatthe respondents, especially, were under sotne tension.
Interviewers appeared to be somewhat less active, more task oriented, more preoccupied with the respondent than with themselves, and under less tension. The special emphasiswhich interviewers placed on comments about therespondent may reinterpreted ashehaviordesigned to gain or maintain rapport with the respondent.
Interviewer reaction
Number
~
Percent distribution
6,516 100 21 78 1
146 100 34 4 3,121 100 % 1
284 100 E 2,965 100 ;2 85 :
Respondent reaction
Nimber
Percent distribution
705 100 55 44 1
100 70 100 60 :: ‘ ; 100 100 :: % :
1
Reactions te Unrelated Conversation
The observers recorded the nature of the verkdresponse following initiations ofunrelated conversation. Each response was rated as to whether it encouraged furtherunrelated behavior, wasneutral,or whetheritdiscouraged suchbehavior.
Interviewer reactions to the various kinds of unrelated conversation initiated bythe respondent are shown intable 15.
In total, about 78 percent of the intefview& reactions were classified as “neutral,” and nearly all of theremaining reactions wereinthe’’encourages” category. The interviewer tended to react encouragingly when the respondent talked about the interview. Shewasahnost as Iikelytobeencouraging when the respondent initiated conversation about the interviewer. The neutral reactions were
20

most prevalent when the respondent talked about himself or Ms family and when he laughed or joked. These two categories, “talking about self or family” and “jokes,” represented the large pro-portion of respondent initiation of irrelevant conversation,
Also shown in table 15 are data on how respondents reacted to interviewer initiations of unrelated conversation. The respondents divided their reactions to interviewer initiations about equally between “encourages” and “neutral” (55 and 44 percent, respectively). “Encouraging” reactions were most frequent when the interviewer talked about the respondent, or the purpose of the survey, use of results, and other topics related to the interview. “Neutral” reactions were most frequent when the interviewer laughed or joked and when she talked about herself. “Discouraging” reactions were seldom recorded, they were most frequent when the interviewer initiated conversation about the respondent,
The major difference between interviewer reactions and respondent reactions to unreIated conversation was that interviewer reactions were likely to be neutral while respondent reactions were about evenly divided between neutral and encouraging, with the latter slightly more frequent. Respondent and interviewer responded in
about the same ways to the different content areas. Both were more likely to respond encouragingly to initiations about the other person or to “humor.” Neither interviewer nor respondent gave many reactions classified as “discouraging,”
It appears therefore that the atmosphere of the interview was neither overly friendly nor overly businesslike.
Interview Behaviors and Respondent
Demographic Characteristics
The several hundred variables arising from the observation form have been related to respondent demographic characteristics (age, education, family income, race, and sex) and have been inspected for patterns of relations. In general, the magnitude of the relations between objectively counted behaviors and demographic characteristics was very small, while the magnitude of th’e relations to s~bjectively rated items was a little larger. Both types of measures suggest that three
demographic characteristics (age, income, and education) showed some association with counts or ratings of respondent behavior. Furthermore, a consistent pattern of relations was found.
Generally, of the three demographic variables age, income, and education, the one most closely associated with respondent behavior was age. Older persons tended to engage in many different types of behaviors and in large quantities; younger respondents exhibited- less variability in behavior. Like younger respondents, persons with high income or high education exhibited less behavior. Further qualitative distinctions can be made. Older respondents showed much less discrimination in the types of behavior— they elaborated more and engaged in more irrelevant conversation; they were rated as wanting to talk a lot, trying hard to communicate, and as being not fully accurate. Because of these types of behaviors, the interviewer had to use mpre probes for them, read the specialist card more often, and frequently help them ascertain family income. The pace of the interaction was rated as slow and not smooth.
Respondents with high education or high in-come elaborated less, and they initiated an average amount of unrelated conversatiorq they were rated as understanding the questions well and reporting relatively accurately. They gave fewer answers that required probing, they considered the questions more carefully, and they needed less help in figuring family income. Although their IXhaviors occurred less often, they appeared to be consistent with the giving of accurate information.
One hypothesis about the relation between ‘ respondent demographic characteristics and behavior is that a different pattern of interaction takes place when interviewer and respondent are of the same social class than when they are from different social classes. Specifically, when a higher status person communicates with a lower status person, he tends to take more initiative, to be more active in directing the interaction, and to stick to the job, while the lower status person exhibits a deference pattern of compliance and often initiates conversation of an irrelevant nature.
In the interview situation, this dominance-deference pattern may also hold. If it can be assumed that the less educated, lower income, and
21

older respondents represent persons who are of a relatively lower social class than the average interviewer, then it can be assumed that for these respondents, interviewer behavior will show more initiative, directiveness, and task orientation while respondent behavior will show deference and nontask orientation.
To test this hypothesis, the observed inter-viewer behaviors were divided into three groups: programed-task behavior (probes on the routine health questions), initiation of unrelated conversation, and opportunities for specific task initiative (reading the specialist card, giving help on the income question, and adjusting the pace of reading the chronic and acute conditions lists).
The data indicate that interviewers did not engage in more of the programed-task activity (probes to health questions) for any group of respondents. This finding suggests that little variance in the main interviewer-task activity is determined by status differences between inter-viewer and respondent, and it probably reflects a successful training procedure.
On the other hand, interviewer initiations of irrelevant conversation support the dominance-deference hypothesis to some degree. Interviewer initiation of almost all types of irrelevant conversation (praise, suggestions, talking about herself, and jokes) shows a low but positive relationship to both respondent education and income.
Finally, interviewers showed much more initiative in guiding the response for older, less educated, and lower income persons. The inter-viewer was more likely to read the specialist card to these respondents rather than letting them fill it out themselves; she was more likely to read the chronic and acute conditions list slowly enough to make sure the respondent under-stood and considered each of the items; and she was more likely to help the respondent arrive at the correct family income figure. These findings are supplemented by the two observer ratings of interviewer initiative. According to these initiative ratings, the interviewer clarified more and tried harder to communicate for older, less educated, and lower income respondents.
In summary, interviewers initiated somewhat more unrelated conversation to the higher educated and higher income respondents, thereby indicating an interviewer-deference pattern. Second,
there were no differences in frequency of initiatillg the main task activity of probing answers to the principal, repetitive health questions for respondents of different demographic characteristics. In terviewer-probing behavior on these question:; was given careful and extensive attention durinf: interviewer training, and it is possible that this training reflected itself in the lack of variation of effort for the respondent groups of concern here. The third pattern shows the expected differences to a slight degree in interviewer initiative with respect to respondent demographic groups. These items consisted of observer ratings of the amount of interviewer initiative and some non-routine behavior items where interviewer initiative can make a dramatic difference in reporting quality.
HYPOTHESIS TESTING
This section examines the relationship be-tween the main variables of the study. A detailed discussion of how the variables were constructed is given in Appendix II.
The Dependent Variable,
Reporting Accuracy
Because of the lack of good, independent validation criteria, the most difficult variable to construct in this study was an index representing the accuracy of reported health information. For reasons discussed in Appendix II, the main dependent variable used is an index based on the number of chronic and acute conditions which the respondent reported for himself, corrected for the age of the respondent and hereafter referred to as the “reporting index. ” It is assumed on the basis of the’ evidence presented in this appendix that within a certain range the number of chronic and acute conditions reported for oneself reflects the general degree to which all information in the interview is reported accurately.
Demographic Characteristics and Reporting
It may be hypothesized that certain demo-graphically defined groups of respondents will report more accurately than others. Specifically, on the basis of previous SRC research, the follow-
22

--------------------------------------
--------------------------
--------
----------
--------
ing demographic groups were thought to represent the highest potential for good reporting: the highly educated, high income, female, and white groups. Conversely, groups thought to have the lowest potential for good reporting were the less educated, low income. male, and nonwhite groups.
Table 16 shows the amount and direction of the association between these demographic variables and the reporting index. There are no significant relations between the demographic characteristics and the measure of reporting accuracy.
Behav~or During the Interview
h was hypothesized that behavior in the interview could be classified on three independent dimensions: (1) behavior directly related to the task, (2) behavior related to the maintenance of the relationship between the interviewer and respondent, and (3) behavior oriented essentially toward the rapid completion of or escape from the interview. These are referred to as “task,” “interpersonal, 1I and t!Completionttbehaviors, re
spectively. Indexes of these behaviors were constructed for both the interviewer and respondent for every interview, according to the procedures described in Appendix 11, and were related to the reporting accuracy index. As it turned out, completion behavior could be identified only as the absence of task and interpersonal behavior. Be-cause of this, no further consideration is given to a completion-behavior index.
To test the validity of the classification of interview behaviors, a factor an?lysis was per-
Table 16. Gamma coefficients showing the direction and degree of association be-tween respondent demographic characteristics and the reporting index
Respondent demographic Report ing, characteristic index
1
Education -.12 Family income -.03 Race .11 Sex--------------------------- -.03
Table ~7. Gamma coefficients showing the direction and degree of association be-tween respondent demographic characteristics and observation indexes of respondent and interviewer behavior
Respondent demographic
Observation characteristics
indexes Age Educa- Incometion
Respondent inter-personal behav-ior------------- 1.22 -.03 -.02
Respondentbehavior 1.21 -.06 � 04
Interviewer in-terpersonal be-havior .07 .09 .15
Intervisver task behavior .09 -.18 -.09
task
lSignificant, p = .05 or less.
formed using the items from the interviewobservation records which discriminated well between respondents. The appearance of one factor made up largely of laskrelated,behaviors and another made up of interpersonal behaviors tends toprovide some confidence in the validity of the a priori classification. A further examination of the behavioral dimensions of interview behavior is made in the sections to follow.
Demographic Characteristics and Behaviors
Initially it was felt that certain behaviors would be more frequent among respondents with certain demographic characteristics. It washypothesized that more highlyeducated respondents would show more task oriented behavior than lower educated respondents and that older respondents would show more interpersonal behavior than younger respondents.
The data indicate that older respondents are more likely to score higher both onthe task and interpersonal indexes (table 17).
Task behavior was not found to bemorefrequent for higher educated or higher income respondents; there is a nonsignificant trend for interviewer task behavior to be comparatively lower correspondents with thesecharacteristics.
23

---------------------------------
---------------
-----------------------
-------------------------------
Table 18. Gamma coefficients s,howing the directicm and degree of association between interview behavior indexes and four measures of health reporting
Measures of health reporting
Interview behavior indexes Respondent T:::;=:U Total RU Total RU comlicions doctor hospi,tml
index tions 1 visitsl izationsl
Respondent task behavior ;,56 ;:;; ‘.23 Interviewer task behavior .46 5.40 Respondent interpersonal behavior 9.22 ;.30 ,04 Interviewer interpersonal behavior .18 “.20 ,02
lRu is an abbreviation for the total household re~ortin~ unit (all Persons in the household for whom the principal respondent reported filly in pa~t), “
2Significant, p = .05 or less,
Interview Behavior and Reporting
One of the major hypothe~es of this study was that interviewers andrespondents whoengage in a high level of task behavior during the inter-view would produce imerviewsh avingahighdegree of accuracy and completeness. It was also thought that even though interpersonal behavior was essentiallyindependentofreportingaccuracy, it would correlate with length of the interview, These hypotheses and relevant data ar,ediscussed below.
Table 18 shows the gamma coefficients be-tween theinterview behaviorsand reporting,lnadditionto the reporting index, severalothermeasures of reporting frequency have been includedto demonstrate the generality of the findings.
The table indicates a positive relationship between each behavior index and the various measures of reporting frequency—the more task behavior engaged in by the interviewer or respondent, the better the reportin~ the more interpersonal behavior engaged in by the inter-viewer or respondent, the better the quality of reporting, The task behavior indexes appear to be more strongly related to reporting than the indexes of interpersonal behavior,
interpersonal behavior is not independentof reporting accuracy as originally hypothesized, With respect to the hypothesis concerning inter-
o;
personal behavior and length of the interview, table 19 shows that both interpersonal and task behavior arepositively relatedtothelength oftime thr? interview lasted. Again, the relation holds for both interviewer and respondent behavior,
Re[ationsh!p Among Behav~ors
Initially, it was hypothesized that interview behaviors would formtwoclusters (taskbehaviors and interpersonal behaviors) and that them clusters would be statistically independent of each other, Essentially, behaviors in the inter-
Table 19. Ganma coefficients showing the direction and degree of association be-Ween behavior indexes and length of the interview
Behavior index
I
Respondent interpersonalbehavior 1,26
Interviewer interpersonalbehavior 1,20
Respondent task behavior 1,51InCerv@wer task behavior -...-.. 1.51
I
significant, p = ,05 or less,
24

Table 20. Number and percent d$stxibution of the incervtews, by reqxmden~ cask, ttem havior accmrding tm ~esponclent incerpersmal behavior
Reqvandent task behav?or . . .. . . . . .......” .--~.,
Respondent MEarpersanal behav%~r Nlxuber Sslle; S:cl:
TQtx%l liQw M@ Lx? high
.
l%lxexlt dislW*lW19@n
Lw-.-...n.....-m........-......mm= 102 loo 40 39 M
Somewhat high Somewha&low. . . . . . . . . . . . . . . . . . . . . . . 129 MN) 3(3 J
. . . . . . . . ..s *...-”..-.=. M) ?$ :! M High m...””.”.-” . ..-..”..-. .-...===” :; MM 28 ::
-.. . .
view do form two chwtera$ but there. Ls some evidence that these clusters are not independent. Tables 20 and 21 shawindatail therelati~ns be-tween the task behavior indexes and the inter. personal behavior indexes separately for therespcmdent and for the interviewer, Afairly strong positive relationshipoccursb~tweentheresp~ndent behaviors? indicating that a reaptmdent who is ptxrfortning at a high level of task !mbavior is also likely to be engaging in a gcmddealof interpersonal bhavi9r. The relation between in. terviewcx ta~k behavior and intervi~wer inter-
Low--u.-------...-..m . . . . . . . . ..m.mm !.00 34 SomawhaE LOW- . . . . . . . . . . . . . . . . . . ...= Ji 1(-)0 24 Somewhat high . . . . . . . . . . . . . . . . . . . . . . I,QQ 15 High ..-- . ...””. . . . . . . . . . . . “....*-”= 11? MM 17
—..
NOTE: Gamma = ,26 (Mgniflmmt, p = ,05 o% less),

--------- -----
------------------------------- -------- -------- ------
-------- -------- -----
------------------------------ ----------------
Table 22. Number and percent distribution of the interviews, by interviewer task behavior according to respondent task behavior
I I Interviewer task behavior
Respondent task behavior Number Some- Some-
Total Low what what Highlow high
Percent distribution
Low--------- ------.-- 102 100 46 25 Somewhat low----------------------- 115 100 29 % IiSomewhat high 10J 100 7 22 ::High 100 2 8 37 :;
NOTE: Gamma = .64 (significant, p = .05 or less).
to be high in task behavior if the respondentis high in task behavior .Thesame istrue for inter-personal behavior.
Taking into account the above empirical relations between the behaviors which occur inthe interview, ahighdegree ofinterdependenceisobserved both between qualities of behavior andbetweenthe persons doing the behavior. It appears, then, that using these apriori indexes of behavior each interview canbe ranked ona single behavioral dimension ’and on a general behavioral activity level and that this behavior level isposi-
Behavior Similarity at Extremes
The data do not permit discovery ofwhois primarily responsible for setting this common general activity level—the interviewer, the respondent, or some interaction of the two. Suchan analysis must await further experimentation in which variables are experimentally manipulated rather than merely observed, (Such a study is being carried out by SRC in conjunction withHIS.) However, one interesting dynamic of behavioral balance maybe studiedwithexisting data.
tively relatedto reporting accuracy.
Table 23. Number and percent distribution sonal behavior according to
Respondent interpersonal behavior
Low-------- --., Somewhat low-----------------------Somewhat highHigh “------
of the interviews, by interviewer interperrespondent interpersonal behavior
I Interviewer interpersonal behavior
I Percent distribution
102 100 46 10 129 100 14 H 2;
95 100 4 20 :: 36 86 100 2 10 27 61
NOTE: Gamna = .65 (significant, p = .05 or less).
26

-----------
----------
---------
I
1’
I
I ~“
I I
I
I
Table 24. Relationship of interviewer interpersonal behavior to respondent interpersonal behavior
Interviewer interpersonalRespondent I behavior
Ratio of obtained to expected cell frequencies
Ilow Somewhat low--Somewhat high-High w
lBased on data shown in table 23. oilRatio = q-’
n,. x n.jwhere ‘%]= N
n,. = row frequency
n. I = column frequency
Eij = expected frequency in cell ij
0,,= obtained frequency in celljj
N = total number of cases
The number of persons who score low, or high, or at any other point on an index isofno intrinsic interest since the distributions were arbitrarily constructed. (See Appendix II.) It is possible, however, to compute thenumber oftiterviews in which behavioral balanceis expected “on the basis of chance” by the chi-square procedure of multiplying marginal totals anddividing by total N. Expected cell frequencies canthen be compared with obtained cell freque~cies, in-dependent of spurious effects in the,&bitrarily constructed distributions on single indexes. This procedure was used to construct tables 24and25, which show the ratio of observedto expec~ed cell frequencies for task behavior and interpersonal behavior. Both of these tablesindicatet&tbehavioral balanceis most likely at the behavioral exmemes. In other words, the interviewer andrespondent are most likely to behave similarlyhigh or similarly low, and the probability of balance
at some intermediate level of effort is not as great. These tables as well as some others indicate that behavioral balance at any level is more likely than behavioral imbalance.
The reasons for this phenomenon are not clear. It may be that behavioral balance is achieved only when one or both of the interacting persons furnish. obvious cues shut their “preferred” levels of behavior. Themostobviouscues are probably those associated with the extreme rather than intermediate levels of behavior.
Factor Analysis of
Interview Observation Variables
In an attempt to test the validity of the a priori index construction procedure, a factor analysis was performed using most of the variables from the interview observation recording form.
Table 25. Relationship of interviewer task behavior to respondent task behavior
1
Ratio of obtained to expected cell frequencies
Low-= 1.2 0.8 0.0 Somewhat low-- 2; 1.5 0.8 0.5 Somewhathigh- 0.9 1.4 1.2 High---------- ::? 0.3 1.2 2.4
lBased on data shown in table 22.
Oij ,Ratio = — Eij
where Eij = ni. xn. i N
ni. = row frequency
‘“J = column frequency
Eij=expected frequency in Cellij
Oij =obtained frequency in cell ij
N = total number of cases
27

kerns which represented actu@ coums or ratings of behavior, which provided a reason. able Wcriminat?on between respondents (fewer than 90 percent of the individuals were coded in the most frequent category), were intercurrelateti arid factor analyzed afid the factors subjected to orthogonal rotation. (Principal Axis Factor Awilysis and Hotelling Varimax Rotation with mmmalized solution, Missing dam, which existed fof a small number of the ratings only, were treated by assigning the individual a rating score at the mode of the overall chstrikttion on the rating,)
Five significant factors were found, four of which could be interpreted rneaningfuily, The four faemrs were labeled interperstm?l behavior, task behavio~$ task ratings, and respondent receptiveness, A more detailed presentation of the content of each factor is in Appendix 1. ‘
The facto? wmiysis confirmed the Mtial CHS. Irintxion ‘made between interpersonal a~d task tMetIt&l behaviors, ifidi~ating that these factors can be made orthogonal ifi rn?tihematit%l spzme. )+iowever, data from the a priori indexes and ftwther Work with the factor data indicated that the%%!two behaviors were best de8eribed by two obliqueWnendcm rather than by orthogonal dimttnsiomii fcm thbs study and that one dimetwion z@ctmfit$for “mostof the variance iti the repMting index,
The factor armlysig also tmfifirmed the above fintihig concerning the high degree of dependence between the behaviors of the respondent and interviewer, The two factors heavily loaded with behavioral variables, the task and interpersonal behavior factors} contained both interviewer and respondent Items. Interviewer and respondem task behaviors were not separated, nor were interviewer and respotident interpersonal behavitm$,
A third factor &mtained most of the observers’ rating~ of both interviewer and respondent task oriented behaviorb w’hichsuggests that these ratings are made largely with respect to a Single tlhmmsitm and are nobhighly corre-Iatt?d with the objectively measured task behaviors even though they were designed to be.
In the ififtial analysis of the observation data, an attempt waa made to cmmtruct an itidex of re. Bpondtmtreceptivityy to the imerview based largely upofi objective behavior recorded at the begin
ning of the interview, This index did not meet the criteria necessary for its inclusion in further afialysi~, The fourth factor from the factor analysis contained a number of subjective ratings which appeared to represent the degree to which therespondent wwswilling to admit the interviewer and to provide time for the interview. However, there were no items indicative of the quality or degree of effort put into the performance, Although an index of receptivity could not be constructed by u~ing objective behaviors, it seems that it is possible to capture essentially the same idea by using the subjective ratings which the observers made at the beginning and end of the interview,
A further analysis of the characteristics of this receptivity factor was obtained, but it was not possible to demonstrate any relationship be-tween it and either respondent demographic characteristics respondent task and interpersonal behaviors, respondent attitudes, or quality of repofting, If the factor correctly identifies respondent receptivity, the data suggest that respondent. reporting performance cannot be predicted by superficial indications of cooperativeness and friendliness.
PSYUKXC)GICAL ORIENTATION OF . . THE RESPONDENT
Btmkground
Earlier in this report two general hypotheses were implied concerning the effects ofpsychological orientations of the respondents, The first was that the quality of the~e orientations (her attitudes, expectations+ motives, and perception) would be, at least partially, related to the respondent’s characteristic~ and that favorable dispositions would be related to goodreporting,
In this study a high degree of correlation was expected between respondent demographic charticteristice and respondent psychological orientations, OrI the other hand~ it was assumed that interviewers would be reasonably homogeneous with respect m background characteristics and also with respect to training and further experience with respondents. It was felt that this homogeneity precluded finding any relationships at this level of analysis for interviewers,
28

The ~econd general hypothesis was that psychological orientations are the main causal variables indetermining behavior intheinterviewmid reporting accuracy, Specifically, it was assumed that positive attitudes or feelings toward the iriterview would be related to good reporting. It was further assumed that attitudes, motives, expectations, and perceptions relevant tci specific aspects of the interview would determine specific behaviors during the interview.
In the following sections specific interviewer and respondent psychological orientations are examined for their relations to demographic characteristics, behavior in the interview, and the re-porting index, The general results indicate a lack of any of the expected relationships, a finding which implies that the model hypothesized above is not especially useful for understanding this particular type of interview.
Respondent Orientations
Two scales of respondent attitude or feeling toward the interview experience were cmlst rutted—one based on questions of an indirect
,nature and the other based on questions which asked the respondent how she felt about the imerview, The details of the construction of these scales is given in Appendix 11,
Contrary to the initial hypotheses, there is nu significant association between the feeling of the respondent about the interview and her demu-
Tuble 26, Gamma coeffi-ctents showing the direction and degree of association be-tween respondent attitude and respondent demographic characters tics
Respondent attitude
Feeling about Lnterview (in:::r; ques
t--------Feeling about
interview (di. rect questions)
Respondent dernographi.e characteristics
Educa-I
Age I tion Inc!ome
-*O3 -.11 -,09
,08 -*13 -.15
Table 27. Gamma coefficients showing the direction and degree of association be-tween respondent attitude and the re-porting index, respondent interpersonal behavior. and respondent task behavior indexes “
Respondent behavior
Re- indexesRespondent p;;:ggattitude lnterper- Task
sonal
Feeling about in-terview (indirect questions )------- ,03 ,00 .07
Feeling about in-terview (direct questions)------- ,01 .01 .06
f
graphic characteristics, either for the director indirect measure of overall feeling (table 26).
These data indicate that respondents ofhigh education and income status donothaveas positive a feeling toward theinterviewas wouldbehypothesized on the basis of previous data. In fact, the data indicate atrendfor these respondents to be more critical of the interview, although thistrend is not statistically significant. Indirectly these data also indicate that having information abut the HIS or about surveys in general does not, in it-self, result in a positive evaluation of the inter-view experience.
To test thehypothesis that positive attitudes or feelings are necessary conditions for behavior which will lead to inaccurate interview, the two respondent attitude scales are related to the indexes of respondent interpersonal and task behavior and to the index of reporting accuracy, The data in table 27 indicate that no systematic relations exist.
In this particular study, having a positive (or negative) feeling about theinterview experience is not related to background characteristics nor does it have any direct effect on behavior or reporting during the interview. It appears that respondents, like good interviewers, do not let their feelings about the situation bias the inter-view. Data presented in Appendix II indicate, however, that these feelings arenotalwayshidden from the observer.
29

------
------
------
------
---------
-------
-------
-------
-------
Table 28. Gamma coefficients showing the direction and degree of association be-tween respondent motive for cooperating and respondent demographic characteristics
Respondentmotive for cooperating
Good ci izen motivatx .2 n--------
Chance to talk motivation
Personal benefit motivation
Chance to rest motivation
Like talking about health motivation
~espondent demographic characteristics
Age Educa- Incometion
.04 .14 .03
.06 .02 -.03
.03 -.35 -.16
I-27 .00 1-,26
-.18 -.18 .00
‘Significant, p = .05 or less,
Motives for Cooperating
Respondents say they cooperate for one or more of many possible reasons. The data from this study identify five such reasons: the willingness to perform the duties ofacitizen,the feeling that cooperation will result in personal benefit, a desire to talkto someone,adesire totake abreak from usual activities, and satisfactionindiscussing health.
Initially it was felt that the distribution of these motivesin the sample would berandomwith respect to demographic characteristics with the possible exception of age.Itwasfelt thatolderrespondents, because of social isolationandgeneral lack ofactivi~ ,would show more indicationsthat they enjoyed the interview because itgave thema chance to talk to someone. In table 28, the five motives for cooperating are relatedtorespondent demographic characteristics. The coefficients of association are all small, and the only statistically significant associations are between age and chance to rest and between income and chanceto rest. ‘l%erefor etheolderrespondents andthosein low income groups are morelikely tomentionthat the interview affordsachance totakeabreak from usual activities than are other groups.
It was further hypothesized (1) that the existence of these motives forcooperation would correlate positively with reporting; (2) that the qualities of a good citizen, personal benefit, and desire to talk about health would correlate with respondent task behavior; and (3) that the willingness to talk to anyone andthechance torestfromusual activities would show a positive association to inter-personal behavior of the respondent. The data indicate that none of these motives correlates significantly with the reporting index (table 29), None of theexpected correlations with behavior is found, although some trends may exist.
It was felt that certain negative feelings may be generated in the interview situation. Two such forces were identified in this study: respondent concern about the time the interview took andrespondent concern about thenatureofthe questions. Only a very fewrespondents voiced any concern about the interviewer and the way she conducted herself. Therefore this concern is excluded from further analysis.
The mention of time pressure and question concern in the followup interview is correlated with respondent demographic characteristics. Four of the six possible relations are statistically significant although still rather weak (table 30).
Table 29. Gamma coefficients showing the direction and degree of association be-tween respondent motives for cooperating and reporting index, respondent interpersonal behavior. and respondent task behavior indexes -
Respondent behavior
Respondent motive indexes for cooperating
Interper- rask
sonal
Good citizen mo-tivation .08 .00 .03
Like talking motivation -.05 .12 .02
Personal benefit motivation -.13 .14 .21
Chance to rest motivation .08 � 20 -.06
Like talking about health motivation -.07 -.20 -.14
30

-------------
--------
--------
---------
---------
The younger, higher educated, and higher income Tab le 31. G+ coef f i.cients showing the respondents are more likely to mention time direction and degree of association be-
tween respondent concern and report&g pressure. ‘The higher income groups are slightly index, respondent interpersonal -more likely to mention a concern about the nature havior, and respondent task behavior in-of the questions. dexes
Contrary to expectations, the existence of
reporting accuracy. Although the coefficients of association reported in table 31 are not signifi-cantly different from zero, there is a tendency for
Respondent concern
Re -p::;gg
behavior indexes
Inter- I
question concern to be positively related to task per-s onal Task
behavior and the reporting index.
Perceptions of the Task Concern about time -.01
+ .00 .00
It can be hypothesized that accurate percep-Concern about
questions .15 tion or understanding of the task is a necessary * condition for accurate and complete reporting and that a misunderstanding of what is wanted can lead
negative forces or feelings does not act to suppress Respondent
to poor performance. Respondents were asked two viewer wanted exact rather than general answers specific questions almut the conduct of the inter- and more likely to give at least one accurate view: Did the interviewer want exact or general reason why the health information was being colanswers? Did the interviewer want everything or lected (for compilation of statistics). While the only the important things? In addition, an under- other coefficients of association are not signifistanding of why information about health was being cant, there is a trend for the older respondents collected (respondent information level) also more often to say thattheinterviewer wanted genserves as an indirect indication of how accurately eral answers and to have a less clear idea of the the respondent understood the task. There is some indication from the data presented in table 32 that respondents in the higher educational groups have Table 32. Gamma coefficients showing the
direction and degree of association be-a more accurate understanding of what the inter- tween respondent understanding and re-viewer wanted than do other demographic groups. spondent demographic characteristics They are also more likely to say that the inter-
Respondent demographic characteristics
Table direction and degree of association be- understand ing tween respondent concern demographic characteristics
and respondent Age Educa-tion Income
Interviewer
Respondent wanted exact answers -.21 1.43 .17
30. Gamma coefficients showing the Respondent
Interviewer wanted every-ConcernE=Rsl= be re-thing to ported .06 -.10 -.09
Respondent knew why informa-tion being col-lected -.25 .13 .11
*Significant, p = . 05 or less, +.significant, p = . 05 or less.
31

----------
----------
-------
Table 33, Gamma coefficient~ showing the direction and degree of a~tmciation be. tween respondent understanding and re. po%tifig index, respondent interpersonal behaviar~ and respondent tagk behavior ittdexe~
I Respondent behavior
Respondent ufldemtaflthg
‘Zig= per.
s ona 1 Task
Interviewer wanted exact ariswers .06 .07
Interviaver wanted every-thing to be re-ported .10 -,02 -.13
Responderit knewwhy the information was beingcollected ,22 ,02 ,13
purpose for which the information was being collected.
The da_taintable33 showthedirecteffectsof having knowledge abouttherequirements andgoals of the survey on reporting accuracy and on the majorreqxmdent behavior indexes .Althoughnone of the gamma coefficients is significantly greater Ithan zero, there is atrendinthe directlonindicat-Iing that increased understanding doeshaveapositive effect on reporting.
One other finding which, inretrospect ,seems to be relevant totherespondents ‘understanding of the requirements of the surveyis thetmexpected (and not quite significant) positive relationship be-tween the respondent conditions index and therespondents’ saying that the interviewer did fiotget all the information abut the family’s health during the interview~Ofthe27 respondents who said the interviewer missed something, about half scored high on the conditions index. The remaining 385 respondents either avoidedansweringthe question
(“lgaveherwhat sheaskedfor’’)or said the inter. viewer did not miss anything. Onlyahutaquarter of this group scored high on the reporting index, The gamma coefficient is-621,
It would seem that inorder fora respondent tosay thatthe interviewerdid notgetallthe infer. mation about the family’s health during theinter. view, she must have understood what the inter. viewer wanted to know, Granting this assumption, it maybea little lesssurprisingtofind that those who have reported well are a little more likely to understand what was required andalittlemore likely to say that the interviewer didnot get all the required information.
The data presented essentially point to a lack of relationship between respondent psychological orientation and the behavior or accuracy-corn. pleteness outcome m! the interview. While a few of the measured orientations show a slight correlation with rtwpondent demographic characteristics, the orientations themselves are of little value in predicting directly the level or quality of respondent behavior during the interview or in predicting reporting accuracy, Of the various categories of respondent orientations mentioned, the mom promising to be followed up are the respondent “perceptions, ” or her understanding of the task requirements, Fowler13~iscusges and
analyzes these data further inhis doctoral thesis,
PSYCHOLOGICAL ORIENTATION
OF THE INTERVIEWER
Interviewer data collectedin a separate inter-view after the Census interviewer had completed her work for this study are grouped into three major categories—the interviewers style of in. terviewing, her feelings about her job, and her general expectations about respondents, Data are presented, again, in terms of gamma coefficients, This was accomplished bytreating the35 inter-viewers as 412 independent interviewers, one for each interview taken, Because of this artificial procedure, nosignificant tests have been applied to the data, The conclusions reached from these data are based on what appear to be consistent patterns of data rather than statistically significant coefficients of association.
style of Infw’vfewing
The interviewers were asked to state their preferences for’ types ofrespo~dents from aliat of respondents grouped according todemographic
32

---------
-------
-----------
------
Table 34, Gmma coeffi,ci.ents showing the direction and degree of association be-tween intervi,ewe? style and reportingindex, interviewer interpersonal, and triterviewer task behavior indexes
I Interviewer behavior
Re- indexes pc):)gg
I
5
Ctmcernwi.th ttccuracy ,09 -,16 -.08
Ctmcern w$th #peed and eff%21ency ,01 .06 � 01
Ccmcernwith afftlf.ation.----= .00 .00 -.07
tmd personality characteristics .Aftereachchoice was made interviewers were asked to state the reasons for the choice (or’in many cases forrefusing tomakea choice).Thesereasons werecontent analyzed (see Appendix II) forthree dimensicms of interviewing style: the interviewer’s concern with accm’acy,herconeernwith speedand efficiency, and her concern with affiliation.Itwas initially hypothesized thatinterviewers withaconcern for accuracy would get more accurate data tmcl~howmcme task behavior, Itwasalsofelt that interviewer concerned with the pleasantnessof the relathwwhip would show more interpersonal behavior, but that the data obtained wouldnot differ significantly inaccuracy, Finally, itwashypothesized that interviewers whowereoriented tospeed and efficiency would obtain poor reporting and would show low levels of both task and interpersonal behavior. The data in table 34 indicate not only that the hypotheses were wrong but also that there iseemsto bea clear lack ofrelationship be-tween these indexes ofinterviewer style andactual behavior and production in the interview,
Intw’viowsr Feeling About Job
tand Questionhatre
Interviewers were asked a series of direct questions ontheir feelings about their jobs,about the importance they attached to the HIS survey effort, and aboutthe efficiencyofthequestionnaire
anti other data-collection instruments. Initially it was hypothesized that interviewers with favorable attitudes toward their job and witharealizationof the importance of the data-gathering function of the interview would be better interviewers—they would obtain better reporting and show more task behavior, Recognition that there are problems associated with using therather coniplicated HIS questionnaire andother materials was thought to be an indication of interviewer sensitivity to the possible difficulties inherent in getting accurate data with the given instruments. Hence, the mentioning of problems with the questionnaire and procedures was hypothesized to be associated with the obtaining of accurate information. The data again show a lack of any relationship be-tween the interviewer orientations and either reporting accuracy or interviewer behavior (table 35),
Ifiterviewer Expedationt
Each of the 35 Census interviewers responded to a series of direct questions about the reaction of respondents to the interview situation. The answers to these questions were made into seven indexes representing different types of expectations. Inspection of the data in table 36 leads to the conclusion that expectations as they are mess= ured here are not related to the performance variables, although it is interesting that the great
Table 35, Gammacoeff%c~ents showing tihe direction and deg~ee of association betweeti j ob,.related attitude and report, index, interviewer interpersonal %~avior3 and iritetiviewer task behavior indexes
Interviewer behavioz
Job-related Re- indexes attitude por;:g ~~
lnterper. Tasksonal
Attittide toward jOb-------------- -609
Importance of s~cvev .07 -.10 -*L5
,05 II-,17
Problehs with ins Wuments ,09 .16 -*O3

---------
-------
-------
-----------
-------
Table 36. Gamna coefficients showing the direction and degree of association be-tween interviewer expectation and re-porting index, interviewer interpersonal behaviors. and interviewer task behavior indexes’
Interviewer expectation
Expect posi.ti.ve attitude
Expect citizen motivation
Expect affi.li.ati.on motivation
Expect personal benefit motivation
Expect respondents to be busy
Expect respondent to think survey is worthwhile----
Expect respondent to have problems with questions---
Interviewer behavior
Re- indexes porr:g.
Inter-per- Task
s ona 1
.01 -.18 .05
-.04 -.20 -.02
.02 -.01 -.05
-.32 -.04 .01
-.08 .08 -.06
-.13 -.16 -.05
-.08 .04 .03
majority of the gamma coefficient signs are negative. Further analysis of these data (notpresented here) suggested that this “negative effect” may be “real” and has led to the hypothesis that interviewers who do not expect problems or who predict that their respondents will have some positive orientation to the interview are not as effective as the interviewers who anticipate some trouble.
Interviewer Orientations on the Interview
As with the data on the effects of respondent orientations, the interviewer orientations did not show any associations” with interviewer behavior or productivity. Her interviewing style orientations, her evaluation ofher job, and her general expectations about respondents did not give any direct insight into how she behaves in the interviewor how accurate and complete her interview data tend to be. Further analysis ofthesedata has not revealed anydefiniteareaswhere associations”
occur, but these expostfactoanalyseshaveled to the hypothesis that interviewers whoexpectrespondent cooperation and a general lack ofproblems may not obtain asmuchdataas interviewers who do expect problems and lack of cooperation. In addition,data analysis(notpresented here)suggeststhatif thereis any variation in interviewer behavior which is related tointerviewer orientations, it seems to be intheinterpersonal behavior of the interviewer. Unfortunately adequate exploration of this area is precluded in this study be-cause there is really little general variation be-tween interviewers or withininterviewersintheir interpersonal behavior. In approximately 90per-cent of the interviews, theonlyinterviewer initiations of irrelevant “conversation’’ w?reinitiations of laughter. On the other hand, this aspect of the interview receives relatively little emphasis in training, in theinstructionmanual,in supervision, or in the feedback evaluations which interviewers get. In the absence of such trainingandcontrol, it is reasonable to expect variation attributable to individual differences in psychological orientation in the interpersonal behavior area.
INTERPRETATION OF THE FINDINGS
Conclusions and Possible Implications
As stated at the beginning of thereport, this investigation was planned as a broad exploration of the HIS interview to provide insights andto develop hypotheses almut techniques of improving reporting in the household interview which could be investigated in future research. In the section below afurther discussion of the most important findings of this study andsorn etentativ einterpretations are presented.
A model of the antecedents of good reporting was offered at the beginning of this report. It was this model which dictated the overall design of the study.
Twogeneral interpretations of the pattern of results may be made: one is thatthehypothesized model of the dynamics of theinterview needs to be revised; the other is that the initial madel is essentially correct but thatitdidnot receive an adequate test in this study.
The question may be raised as to whether the lack of expected relationships between theclemo-
34

graphic or attitude-type variables and reporting was not due to the inadequacy and omission of measurement of the important variables. Because the question is a crucial one, this report contains a detailed description of the operational definition of each of the main variables used in the analysis (see Appendix II). The following two points can be made:
1. This study was especially comprehensive in including measures of demographic and attitude-type variables.
2. The operational definitions of these variables have at least face validity, and, in addition, the variables do show patterns of acceptable reliability and internal consistency in places where this type of analysis could be performed.
It appears reasonable to conclude, therefore, thot the variables were comprehensive enough to test the hypothesized model and that, while the variables may contain some “error” variance, they should be considered moderately acceptable opetwtions for the concepts they were designed to represent.
If the measures of the variables of interest are valid, some explanation is needed of why the expected relationships of the social and psycho-logical variables to reporting were not found. Two complementary explanations for the findings are offered here and developed further in the next section. First, it seems highly likely that, even though respondents do possess attitudes, feelings, and motives which are potentially relevant to the household interview situation, the strength of these characteristics is such as to make them relatively unimportant in determining the outcome of the interview once the respondent has made the commitment to be interviewed. Apparently other variables become paramount in guiding behavior once the interview has started.
Second, with respect to the interviewer, the lack of relationship between preferences for type of respondents, preferred styles of interviewing, demographic characteristics, expectations about respondents, or rated feelings toward individual respondents is a little less surprising. The most cogent explanation of these data is that the inter-viewers are well trained and are successful in keeping their personal feelings from biasing the data,
One hypothesis which may have merit for future research is that a household interview maybe a unique experience for respondents. It maybe so out of the ordinary stream of daily events that respondents really have no cognitive “set” which they bring to the situation. The situation is so new that it is difficult to generalize their associated feelings, attitudes, and expectations. Therefore exist ing attitudes, expectations, and feelings do not provide a basis for behavior, and the respondent must look to the interviewer or some other source for cues as to her expected behavior.
On the other hand, the interviewer may be in somewhat the same situation. She has been trained in how to ask questions and fill in the spaces on the questionnaire, but she has learned from experience that respondents are different: some will enjoy the interview, others will be amoyed with it; some will have trouble with certain sections, others will not; some will be rushed or pressed for time, others will want to talk about many irrelevancies. Therefore the interviewer too will beattentive to subtle cues from the respondent to supplement her training and to arrive at a strategy for dealing with this particular respondent.
This hypothesis implies that both interviewer and respondent search for cues from each other on appropriate behavior. It maybe this cue-searching process which accounts for the very strong tendency of interviewer and respondent to behave at thesame level of activity in the interview. This heavyreliance on cues from the other person to set thebehavior pattern may also account for the fact thatorientations measured in this study were not predictive of behavior. In addition the reciprocal cue-searching process may explain why it is not possible to determine that one person sets thebehavior activity level and the other follows. An .experiment which purposefully manipulates thecues given by either the interviewer or the respondent or lmth should yield predictable behaviorchanges, provided relevant cues are discoveredand then experimentally varied.
Further Interpretations of the Findings
Initially, it was felt that g~d reporting would come from respondents who were positively inclined in their attitudes, expectations, and motives. The empirical data have suggested these factors are not relevant to reporting. The data do demon-
35

strate, however, that there is a strcmg associaticm between behavior levels in the interview and in the quality of information reported, Althoughthe cue-searching procem may be responsible for behav. ior levels, it is unclear whybehavior levels are so strongly related coreporting, Before any extensive speculation is attempted on the basis for this rela. tionship, it is necessary to list the varioufi causal possibilities which may exist between behavior level and reporting level and to discover through research which is correct, Since relationship is correlational, the following four causal possibilities exist:
1. Behavior level causm reporting level. 2, Reporting level causes behavior level. 3, There is reciprocal causality -e.g,, hav
ing more to report causes higher behavior levels which in turn cause even further xeporting,
4. BcIthreporting level and behavior level are caused by some third variable andhave no direct effect on each other. Anexample of this last possibility would be the case where the respondent reports well because he likes the interviewer and also does a lot of behaving for the same r~ascm. If, somehow, this respondent could be made to behave at a high level without liking the interviewer, he would not show any accompanying increase in the accuracy-frequency of his repcming.
As was shown earlier, activity level of an individual consists of two conceptually distinct types of behavior: task and interpersonal irrelevant behaviors, The data from this study suggest ~ome difficulty in making a psychologically meaningful yet statistically acceptable differentiation between these behavior qualities, Qne can hypothesize that there is no meaningful distinction between these behaviors or that there is a qualitative distinction to be made between them but that they both “naturally” occur at the same levels in this type of interview. For example, the rapport hypothesis might suggest that a high degree of personal affiliative attention (encouraging respondent to engage in irrelevant behavior) causes the respondent to engage in a great deal of task oriented behavior. The reverse ordering hypothesis may also hold, It maybe that tension increases in a respond. em whois engaging in much task oriented behavior;
and in order to maintain this level of output, he must engage in a higher quantity of irrelevant behavior as a means of relieving the built-up tension, If tension release is not obtained, both behavior types will fall to a low level,
Implications for Future Research
The data from this study have led away from the traditional social psychological interpretation that actions are based on enduring psychological characteristics measured by the attitude-type variables and have suggested that research he directed more in the area of social behaviorism for a better understanding of certain interview situa. tions. The interpretations offered abomhave Euggested that research proceed at several levels,
First, since the major findings were unexpected, a thorough replication ~f these findings is needed. A replication of this type of study need not involve the wide diversity of measurements used, Fewer and more refined measures of attitudes, motives, and behaviors should suffice. Although the attitude to behavior and behavior to behavior findings are interesting in themselves, the inter. view practitioner should be especially interested in employing a dependent variable ofhigher valid. ity in a replication than the one used in this etudy, The feasibility of obtaining and using healtb record data in such studies has already been demon. strated. (Areview of some of these studies appears at the beginning of this report,)
Next, the above discussion has pointed to the need for future research on the direction of causality between several of the important variablea in this study. The nature of the relaticmhip bem tween the various qualities of behavior aa well as between behavior level and reporting should be discovered before meaningful theoretical interpretations or practical suggestions can be made,
Finally, it appears that future research work could proceed to test certain aspects of the cue-search model mentioned almve as well aa some of the underlying assumptions which led to its formulation. Such research could focus not only on identifying what are the behavioral cues present in the interview but also the subsequent effect of these cues on different types of behavior, on general be.
havioral level, and on reporting accuracy.
36

Implications for Interviewing Practice
It was the implicit assumption of the writers prim? tQ this study that the way tQturn respondents into good reporters was tminduce positive attitudes taward the various aspects of the Interview (the interviewer, the questions, and the purpose). It naw appears that the most promising point of leverage for change is in the behavioral interaction procewses of the interview itself, Ifthi6 conclusion is correct, two courses of action appear open to the applied researcher; he may take advantage of the present experimental work and theory dealing with behavior change in the sacial setting or he may wish m perform his awn studies to identify the crucial variables affecting interview behavior,
Research in experimental, clinical, and social psychology can be translated direc~ly into attempts to change behavior in the interview, For example, relevant work would ipclude that in the areas of
verbal crmditicming2 ncmdirective therapeutic techniques, speech and silence durations in the inter+iew, social influence, social facilitation, suggestion, and conformity,
In summary, the data from this study suggest that one potentially effective way to influence in. terview reporting accuracy is by changing the be.havior in the interview, Effective ways of bringingabout behavior change involve manipulating cuesin the immediate situation rather than trying tochange basic attitudes or increase level of infor. ..mation. Research is possible along two lines. Onepossibility is basic research into the importantdimensions of interview behavior, their causal relation tQ one another, Bnd their immediate antecedents, me other possibility appears to beapplied research which attempts to adapt alreadyexisting behavior-change techiques to the house-hold interview setting.
REFERENCES
1 Myww, FL J,’I Error and bias in t-he reporting of age in
cmrtius finta. Trmwacthna o~the .40tMadal thiotyofiherica,
Jf, 10ML pp. 39ii-41i3,
%mwm, R. H,, and hlarks, E. S.’: Influence of the intervlower on the acauraoy of survey results. J.4ra ,Statist..4. M:ti3K.llFill,I!lriR!
3 Hyman, H. H., Cahb, W. J., I%ldnran, J, J,, Hart, C. W.,
find Nornher, C, H. IInterviewing in Souia? @esearch. Chicago. University of Chioaga Presti, 1954,
4Rico, S. A. I Contagious bias in the interview, -4m.J. S, I(+(J, XXXV’:HO.423,1929,
5Mtz, t). I The funotkmi approaoh tQ the study Qf atti
turlos, Pub,@, Quart, X~IV@): 163.204, 1960,
0 lkltw, IL F.’: Interaction Process Anatywk. Cambridge,
M*ss.. Wesley Press, Ino., 1950, 7’Hnyns, R. W,, and Lippitt, R.’: Systematic observational
toohniquefi, in Cl. Lindzey, ed,, Handbook of Sooial Psy(hulo~y, Rending, Mass. Addisrm~Wrwley, Ino,, 1954. pp. 370-404.
~~l,$i, RUNWU of the CNMWS’:NHS /nteroi@wer’s Mawa?, 1,’ormNfIS.IJiS- 100. (rcwised peri~dically)
9Nntional Center for Health Statistics: Health survey pro[~wtur~,,conoepts, questionnaire development, and definitions
~n the Health Interview Survey, Vital and i/eaWi Statistics. PHS Pub, No, 1000.Series l.Ncr, 2. P~blio Health Servioe. Wn~hington, Government Printing Office, hfay 1964.
10NatiQnal Cen@r for Health Statistics: Origin, program,
and aper~tipn of the U,S, National Health Survey, Vital and HeraLthStat\stias, PHS Pub. No, 1000-Series I.No. 1. Publio Health Servioe. Wasbingtm. Government Printing Offioe, Aug. 1963.
11 U.S. National Health Survey: The statistical design of
the health household .interview survey. tiealth Statistics, PHt3 Pub, No, Mi4.A% Public Health Service. Washington, D.C., July 1958,
12Flugel, J. C.: Humor and laughter, oh. 20, Vol. H in G. Lindzey, cd., Hmdb~okof Sociat Psychology, Reading, bfass. Addison-Wesley, Inc., 1954. pp. 709-734.
13 Fowler, F, J,: Education, [ntoraction, and Iaterview
performance. Ann Arbor, Miuh. University of Michigan, 1965, (unpublished dootoral thesis)
l’%ational Center for Health Statistics’: Interview data on ohronic conditions compared with information derived from medical records. Vita? and t/eu2th Statistics. PHSPub. No. 10t30,Series 2-No. %3, Puhlio Health Servioe. Wash@cur.
Government Printing Offioe, hlay 19M.
~b~ati~nal Center for Health Statistics; Comparison of hospitalization reporting in three survey procedures. Vita? and I/ealth Statistics, IWS Pub. No, 1000-Series 2.No, 8, Publio Health Service, Washington, Government Printing office, July 1965,
‘6National Center for Health Statistics; Health interview responses compared with medical records, Vitai and Hea2th
37

Statistics. PHS Pub. No. 1000-Series 2-No. 7. PubIic Health
Service. Washington. Government Printing Office, July 1965.
17National Center for Health Statistics: Reporting of hos
pitalization in the Health Interview Survey. Vital and Heuttlt Statistics. PHS Pub. No. 1000 -Seriee 2-No. 6. Public Health Service. Washington. Government Printing Office, July 1965.
18Survey Research Centet: A Study of the Reporting of
Visits to Doctors in the National Health Sureey. Ann lrbor.
The University of Michigan, Oct. 1963. (mimeo. )
19National Center for Health Statistics’: Cycle I of the
Herd th Examination Survey’: sample and response, United
States, 1960-1962. Vital and Health Statistics. PHS Pub. No. lCCO-Series 11-No. 1. Public Health Service. Washington. LI.% Government Printing Office, Apr. 1964.
20 Wilcox, K. Ft., Jr.’: Comparison of Three Methods for the
Collection of Morbidity Data by Household Survey. Ann Arbor.
University of hiichigan, School of Public Health, Department of Epidemiology and the Tecumseh Community Health Study,
1963.
91hlooney, H. W.: Methodology in Two California Health
Surtieys. Public Health hionograph No. 70, PHS Pub. No. 94!2. Public Health Service. Washington. U.S. Government Printing
Office, 1962. 22
Goodman, L. H. and Kruskal, W. H.’: kieasures of asso
ciation for cross classifications. J. Arn.Statist.A. 49:732-764. 23
hfcCartby, P. J.’: Analysis of Data From Complex Sample Surveys. (unpublished paper)
24 Goodman, L. H. and Kruskal, W. H.: Measures of associ
ation, HI. Approximate sampling theory. J. Arn.Statist.A. fi~: 310-364, 1963.
BIBLIOGRAPHY
Lamale, H. H.’: Study of Consumer Expenditures, Incomes, and Savings. Philadelphia. University of Pennsylvania, 1959.
Lansing, J. B., and Blood, D. hi.’: The Changing Travel
Market. Survey Research Center hlonograph No. 38, pt. 3, 2179
ISR. Ann Arbor. The University of Michigan, 1964. ,Neter, J., and Waksberg, J.: Response Errors in Collec
tion of Ezjm?nditures Done by Household Interviews: An Experimental Study. Washing@n. U.S. Department of Commerce,
1965.
Parry, H., and Crossley, H.: Validation of responses @
survey questions. Pub. Op. Quart. XIV(1) :61-80, 1950. Survey Research Center: Observation of NHS-HIS lnter
views. Ann Arbor. The University of Michigan, May 1965.
U.S. National Health Survey: 4 study of special purpose
medical-history techniques. Health Statistics. PHS Pub. No.
584-D 1. Fublic Heaith Service. Washington, D. C., Jan. 1960.
000
38

APPENDIX 1
FACTOR LOADINGS
A list of items and their loadings on the factors discussed in the body of this report (items with loadings less than ,50 are not listed)
I. Interpersonal Behavior
Respondent Characteristics Interviewer Characteristics
Talks about himself .73 Talks about respondent Laughs, jokes .63 Laughs, jokes “Encourages reactions to interviewer .unre- “Encourages” reactions to respondent, unre-
lated conversation .74 lated conversation
“Neutral” reactions to interviewer unrelated “Neutral” reactions to respondent unrelated conversation .51 conversation
Rating of the amount of respondent talking .57 Rating of how much the respondent wanted
to chat about unrelated matters .61
H. Task Behavior
Respondent Characteristics Interviewer Characteristics
Acceptable answers .58 Directive probes Elaborated answers .53 Question clarifications Asks for clarification .71 Length of interview .61
HI. Task Orientation Ratings
Respondent Characteristics Interviewer Characteristics
Degree of effort put into communicating .59 Amount of clarification of questions given
Ability of respondent to understand the ques- Degree of effort put into communicating tions -.67
Furnishing additional information on List A items .54
Srn.,othness of the interview -.68 Pace of the interview -.50
IV. Respondent Receptiveness
Respondent Characteristics
Rating of initial politeness .70
Rating of initial friendliness .69
Rating of cooperativeness .61 Rating of willingness to give time for inter-
view .54
V. Miscellaneous Factor
(no loadings greater than .50)
.65
.6o
.79
.70
.55
.71
.72
.72
39

-----------------
APPENDIX II
INDEX CONSTRUCTION
The Dependent Variable
The basic aim of this study was to make statements abut the correlates of accurate and complete reporting of health information, The purpose of this section is to describe the rationale for choosing, as the major operation for accurate and complete reporting, an index based on the number of chronic and acute conditions the respondent reported for himself.
Sevefal ways of assessing the accuracy of a re-ported health condition or event are available, The fes.sibili~ of using medical records as a check on accuracy of respondent reporting has been demonstrated in several studies. 1+18 NCHS has instituted an extensive survey using actual health examinations to assess the accuracy of health conditions reported in the’ household interview. 19
Since it was decided that neither of these methods was feasible for validation of data in this study, it was decided to use a less precise but standardized and readily available indicator of health reporting accuracy—the index based on the number of conditions the respondent reported for himself.
This index has three im~rtant characteristics, It has been found to correlate with accuracy of reporting health information in record check studies, it has sta-
Table 1. PruporKLonof underreportingof knownhospital episodes for the sample person, bythe number of chronic or acute conditionsreported for sampleperson$excludtnghospitalizations for deliveries
Number ofNumber of chronic or Percent episodesacute condi.eions of under- excludingreported for the reported deliveriessampleperson episodes in hospital
records
O conditions ;~;1 or 2 conditions :;3 conditionsor more--- 6 322
lThe “sampleperson” is the person for whomthe hospitalrecordwas selected.Since the in
tistical characteristics permitting good discrimination between respondents on the basis of accuracy of reporting, and the reporting of chronic and acute conditions itself is subject to a large underreporting bias. These three properties are discussed below.
Relat~orifo Accuracy
Previousstudiesdemonstratethatthenumberofreportedinthehealthchronicand acwteconditions in
terviewisaroughindicator ofotherinofthevalidityformation reported and probably an indication of the extent to wltich the respondent is being cooperative. In two studies of the accuracy of reporting hospitalization episodes, underreporting ofhospital episodes wasfound to be inversely related to the number of chronic and acute conditions reported (tables 117and If15).
In these studies a sample of hospital discharges was drawn. Tables I and II show the proportion of known hospitalizations which were underreported and indicate the tendency for underreporting of hospitalizationsto be associatedwith reportingasmaller numberofchronic and acute conditions. Rtrtheranalysesreportedinthese studies show that the number of conditions wisich the respondent reports for himself iscorrelatedw ithhow weIl he reports hospitalizations either for other mem. hers of the family or for himself. Thus the effect M not entirely due to the respondent’s lack of knowledge of
Table II. Proportionof underreportingof knownhospital episodes for sampleperson, by thenumber of chronicoracute conditionsreportedfor the sample person, excludingoverreportedhospitalizations
,
Number of chronic or Percent Number ofacu&a condi~ions of undez- episodesreported for the reported ‘inr~;;~al.sample person episodes
r) cond~tfons....--...-. I or 2 condition5------3 conditionsor more---
I terviewreport could be given by another fam%l.ymember, the respondentmay or may not be the NOTE: Table combinesdaea from three datasampleperson, collectionprocedures.

----------------------------------------
-----
the health characteristics of the sample person but probably reflects an overall willingness to cooperate with the interviewer to furnish therequiredinformation.
A study of theaccuracy of thereportingof visits to physicians reveals the same relation between the re-porting of chronic and acute conditions and accuracy of reporting other health information (table 11118).
Table 111. Propor&i.onof underreporting of phy sidan viaits by number of chronic or acute conditions reported
Number of chronic or Percent Number of acute conditions re- ef under- visits inported for the reported recordssample person visits
O conditions 50 54 1 condf.ti.on 24 136 2 conditions 10 106 3 conditions or more 20 108
The same association is found with reapect to the number of conditions reported by the respondent for himself and his accuracy inreporting physician visits either for other household members or for himself.
In summary, the number ofconditions reportedby thereqxmdent either for himself or for another person is related to how accurately the respondent reports hospitalization or doctor visits data both for himself and for other family members. The relation to doctor visit andhospitalization reporting is not due entirelyto the effects of a lack of knowledge almutthe sample per~onon the part of the respcutdent. Ratherthe number of chronic and acute conditions reported seems to reflect a general willingness tocooperate intheinterview.
Discriminabiiity
Reporting of chronic and acute conditions isespecially useful asadependentvariable because of tie large between-res~ndent variation in the number reparked. Conditions are more frequent in thepopulation thanare other health events asked about inthe HIS, such as visits tocioctors orhospitalizations. Ifitcan reassumed that amount reported reflects accuracy, then theprobability of statistical discrimination of reporing accuracy among persons on the basis of reported conditions is greater than for other health events.
Underreporting
Because evidence from several studies indicates that conditions areprobably underreported at a higher rare than either visits to doctors or hospitalizations, there is agreater chance that the number of conditions
reported reflects a general level of reporting accuracy as well as an indication of the respondents’ real health status. In addition studies by Wilcox20andMooney~ Imth show that keeping day-by-day diaries of illnesses results in substantially more conditions being reported than were obtained by personal interviews. In comparing interview reports with medical records, Madow14 demonstrates a substantial underreporting of chronic conditions in interviews.
Initial Attempts to Construct a
Dependent Variable
On the basis of the above data, it appeared that the number of chronic and acute conditions reported could be used as a basis of constructing a variable which would reflect, albeit imprecisely, the accwvacy with which health information was reported. To construct such a variable, variations in actual morbidity must be minimized.
Since consistent data on morbidity rates which were independent of underreporting effects could not be obtained from previous studies, an alternative method of minimizing the effects of real health was used. This method involved dividing the interviews from this study into six categories based on age and sex of each per-son for whom health information was obtained. It was assumed that the average number of conditions reported within each age-sex category represented a rough estimate of the actual morbidity rates for that group and that aggregate deviations below this mean were more likely to contain underreports.
An accuracy of reporting index was constructed for each family by computing a reporting accuracy score based on data for each family member. An expected number of conditions was computed for each family by multiplying the number of persons in each age-sex category by the expected number of conditions for that category, summing overall categories, and subtracting this sum from the number of reported conditions, Since the variance in morbidity rates varies from category to category, the resulting difference score was divided by a correction term that was based on the number of persons in each category and the rep’ting variance for that category. Thus each family received a score representing how far its reporting deviated in standardized units from that which would have been expected. Even with the age-sex correction, it is assumed that some of the deviation variance is still a result of real health.
It was expected that this procedure would minimize the contribution which real health would make to the dependent variable. Preliminary analysis revealed that respondent age and family size were significantly correlated with this index: older respondents and those respmdents with small families appeared as the most
41

-------
---------------
-------------- ------
--------------
-----------------------------------
---------
--------------
--------------------------------
---------
---------------------
---------------------------
--------------
-----------------------------------
accurate reporters. Recent data from Madow 1~ lend support to the findings that older respondents do tend to report their chronic conditions more accurately than middle-aged or younger respondents. The negative association of family size and reporting accuracy is not surprising since numerous reports indicate that re-porting for others is less accurate than reporting for self. The larger the family size, in general, the larger the number of proxy reports.
Because of these findings, it seems likely that the
index based on total family members minimized the systematic variations in real health, but it also placed too much emphasis on age and family size as determinants of the reporting index score.
Final Index of Reporting Accuracy
To focus more precisely on the forces other than those due to age or family size that affect only the respondents, a new index of reporting accuracy was constructed using as its base the total number of chronic and acute conditions reported by the respondent only for himself. To minimize the effects of real health, an age correction was made and is described below. Family size corrections were umecessary because only respondent conditions were used in the index. Since most respondents were female, adjustments based on respondent sex were not used.
The sample of respondents was divided into four age groups; under 35 years, 35-54, 55-74, and 75 and over. Each group was then divided into thirds on the basis of the number of conditions reported (table IV).
Table IV. Assigned classification on reporting index based upon age of respondent and number of conditions reported for respondent
Age of respondent Number of conditions F-
reported for Under 35-54 55-74 75+self 35 years years years years
0 conditions--- Low Low Low Low 1 condition---- Medium Medium Low Low 2 conditions--- High Medium Medium Medium 3 conditions--- High High Medium Medium 4 condi.tions---5 conditions
High High High Medium
or more High High High High
Characteristics of the Final Index of Accuracy
The revised accuracy of reporting index, referred to either as the respondent conditions index or simply as the “reporting index,” is related to the probability that other health events will be reported even though the
systematic contribution of real health has been mini
mized somewhat. The data in table V show how the respondent conditions index score relates to the reporting of hospitalizations, doctor visits, visits to specialists, visits to dentists, and total family conditions for the whole family. The tables indicate small to moderate degrees of positive association.
There are no strong relations between the reporting index and respondent demographic characteristics. These data are discussed more fully in the section “Demographic Characteristics and Reporting” on page 22.
Table V. Number and percent distribution of reporting index, by number of doctor visits, hospitalizations, visits to specialists, dentist visits, and total conditions reported for reporting unit according to reporting indexes
Total number 138 162 I 112
Numberof hospitalizations for reporting unxt Percent distribution
Total---------------
O hospitalizations 1 hospitalization 2 hospitalizations or more
Number of doctor visits for reporting unit
Total
0 visits1 visit2 visits or more
Number of specialist visxts for reporting unit
Total
0 visits1-2 visits3 visits or more
Number of dentist visits for reporting urmt
Total
0 viaita 1 visit or more
Total conditions reported tor reportxng unit
Total
0 conditions1-2 conditions3-5 conditions6 conditions or more-----
100 100 100
77 72 59 17 20 22
6 8 19
100 100 100
75 65 53 15 22 29 10 13 18’
100 100 100
49 43 R 23 ;; 2:
100 100 100
96 85 85 4 15 15
100 100 100
0 :; 17 4;
4 48
42

------------------
---------------------------
-------------------------
-----------
---------------------------------------
---------------------------
------------------
--------------------------
---------------------------------------------------
-----------
-----------------------
------------------------------
----------------------------------------
------------
------------------
Behavior Indexes
Construction of Initial Indexes
When the observation procedure was developed, items were included which could be expected to beat least partial measures of one of six major behavioral concepts. Although items explicitly designed to reflect the completion orientations of the interviewer and respondent were included in the data observed, they could not, for various reasons, be used to form indexes of completion orientation. Therefore attempts to form an index of this orientation were abandoned.
Construction of Maior
Behavioral Orientations Indexes
T& remaining items were classified as measuring one of the four remaining concepts: interviewer task behavior, respondent task behavior, interviewer inter-personal behavior, and respondent interpersonal behavior. Items hypothesized as measuring each single concept were then intercorrelated. Any item which did not exhibit the expected pattern of correlation with other items hypothesized as measuring the same concept was discarded from further consideration. Because all behaviors tend to reflect a general activity level (a finding which became obvious only later in the analysis) it should be noted that few items were discarded be-cause they did not meet the intercorrelation requirements.
Each item was then examined for its power to differentiate among interviewers or respondents and re-coded onto collapsed scales. Those items which provided good discrimination (i.e., large variance) were made into four-point scales, those with relatively poor discrimination power were put onto two-point scales and those which provided an intermediate amount of discrimination were assigned to three-point scales.
The recoded item scales for each concept were then added together to form a total index. In order to present results in tabular form, each of the total indexes was again recoded into four almost equal categories. Thesp collapsed indexes are used throughout this report, even where coefficients of association rather than tables are presented.
Item composition and item weight are shown below for each of the four behavior indexes. The number following each item, labeled as scale length, refers to the number of categories for that item used in the total index construction. These numbers give a rough idea of the potential relative weight of each item in each index.
1. Respondent interpersonal behavior
Asks questions about the interviewerTalks about self, family, friendsLaughs, jokesRating: how much did respondent want
to chat --------------------------------Number of “encourages” reactions +
total reactions
11. Interviewer interpersonal behavior
Flatters or praises respondent Asks nonhealrh questions of
respondent Talks about self, family, friends Laughs, jokes Rated as wanting to continue post-
interview conversation hlumber of “encourages’t reactions + total reactions
111. Respondent task behavior
Elaborations Asks clarification Consults other sources of information Questions the adequacy of an answer Pauses to consider itemson chronic and acute conditions list
Considers the specialists card carefully
Iv. Interviewer task behavior
Number of inadequate answers (those interviewer probed)
Repeats question exactly as worded Other nondirective probes Directive probes Clar\fies meaning of a question Suggests respondent consult other
sources of information Probes, chronic and acute conditions list---
Indexes of Respondent Orientation
The followup interview with the respondent
Scale length
2 4 3
3
2
2
2 2 2
2
3
3 2’ 2 2
2 2
3
3
3
3
3
2
3
containeda lar~e number of questions, usually of the open-ended nature, designed to elicit information in three general areas.
1. The basic psychological characteristics ofrespondents that apply to the interview (e.g., the
43

2.
3,
amount of information he has about surveys, his general feelings abut government surveys, and his motives, such as willingness to perform citizen duties, applicable to the interview situation).
The presence and effects of specific situational factors such as strong reactions to the type of questions asked or effects of competing demands for time and attention.
The demees to which respondents understood what fi~y were expected ~o do in their role as respondents.
An initial list of specific variables of hypothesized importance was formulated at the beginning of the study. Once the data were collected, a sample of interviews was selected and content analyzed to ascertain whether or not the answers to the questions contained relevant in-formation for each variable. On the basis of the initial content analysis, certain variables were excluded from further consideration and a standard content analysis procedure was constructed and used to code all the re-interview data.
The analysis was further divided into two parts on the basis of the type of question from which the information came. Two types of questions were asked: a set of indirect questions asking the respondent to describe the feelings of two persons portrayed in pictures representing the interview setting and a set of open-ended questions (with subsequent probes) asking the respondent how he felt about the health interview he had had the previous day.
Indexes of Respondent Feeling About Interview
For each question in which the respondent had the opportunity to express a feeling about the interview, a positive point was assigned:
Each time he stated a positive feeling or reaction or Each time he avoided stating a negative feeling;
a negative point was assigned
Each time the respondent stated a negative feeling or reaction or
Each time he avoided stating a positive feeling.
This coding procedure was applied to two sets of questions, yielding an index based on indirect questions and an index based on direct questions. The queatfon sets are listed below with the question number and an abbreviated version of the exact wording.
~Projective Index
(to picture of interviewer at door)
Question 2a. “How does the person in the picture feel now?’1
Question 2b. “Why does she feel that way?”
44
(to picture of interview taking place)
Question 3. “How does the person in the picture feel now?”
Question 3a. “Why is that?” Question 4. “What does the respondent enjoy
abut the interview?” (scored only for stating and avoid
ing positive comments)
Question 5. “What does the respondent not en-joy about the interview?”
(scored only for stating and avoiding negative comments)
(to picture of interviewer leaving)
Question 6. “How does the respondent feel now that the interview is over?”
Direct Index
Question 9. “In general, how do you feel about the interview you had yesterday?”
Question llb. (if respondent talked to anyone about the interview)
“What did you talk about?” Question 14. “What did you like about the inter.
view?” (scored only for stating positive
and avoiding negative)
Question 16. “How did you feel about her coming just then?”
Question 17. “How did you feel about giving up your time for the interview?” -
Respondent Motivation and Concern
Scales reflecting respondent motives and negative concerns were constructed from answers to both direct and projective questions. Each scale, with the exceptions listed below, has a range of O-7 with three possible Wints coming from the projective questions and four points based on answers to the direct question as noted below.
Time Concern (?’ange O-7)
Up to three points for mentioning time concern in answer to the projective questions and one point for each mention of it in the direct ones.
Projective Questions-
Question 2. (Showing Picture 1, an interviewer at the door)’ ‘What does the woman (man) of the house think when the

person says that she is an inter-viewer?”
Question 3. (Showing Picture 2, interviewer and respondent in the house)
“How is the woman (man) of the house feellng now?”
Question 5, (Picture 2) “IS there anything about being interviewed which she (he) doesn’t like?”
Direct Questions-
Question 15-16. “How did you feel about the inter-viewer coming just then?”
QuestIon 17, “How did you feel abut giving up your time to answer question?”
Quet%ion 17EL “Do you usually have some free time during the day?”
Quetxion 23. “During the interview did you feel rushed or hurried?”
QUesliOn Concern (vange O-6)
Up to three points for the projective questions and one point, for mentioning question concern in each of the direct questions,
Questions 2,3,5 (see above)
Direct Quwim&..-
Question 9, “How do you feel about the health interview you had yesterday’”
Question 13, “Were there any things the in. terviewer asked about that you thought were too personal or embarrassing?”
Qwtion 27a,b, “IS everything too much to expect a person to be able to answer?”
Good Clttzen MoMation (vange O-7)
Up to four points for the projective items and one point for mentioning motivation to be a good citizen in each of the direct questions.
Projective queMions -
Quemicm 2,3, (me dxwe) Question 4, (Picture 2) “Is there anything about
being interviewed that he (she) enjoys?”
@emion 6, (Showing Picture 3, the interviewer leaving the house) “How does the woman (man) of the house feel now?”
Direct Questions-
Question 9. “How do you feel abut the health interview you had yesterday?”
Question 14, “Were there any things alxmt the interview you especially liked’?”
Question 22. “Why do you think people cooperate on these health surveys?”
Ckance to Talk Motivdion (vange O-8)
Up to four points for the projective questions and one point for mentioning chance to talk motivation in each of the direct questions.
Projective Questions-
Question 2. ~ (Picture 1) “What doea the woman (man) of the house think when the person says that she is an inter. viewer?”
Question 3. (Picture 2) “How is the woman (man) of the house feeling now?” -.
Question 4. (Picture 2) “Is there anything about being interviewed that she (he) enjoys?”
Direct Questions-
Question 9. “How do you feel about the health interview you had yesterday?”
Question 14, “Were there any things about theinterview you especially liked?”
Question 34. “What kind of person do you thinkthe interviewer was?”
(Interviewer seen as a friend or neighimr rather than professional)
Personal Benefit Motivation (vange O-4)
Up to three points for the projective and one point for mentioning personal benefit as motivation in the direct question.
Projective Questions—
Questions 2,3,4 (see above)
Direct Question-
Question 9. “How do you feel about the health interview you had yesterday?”
Ckance to Rest Motivation {range O-6)
Up to three points for the projective items and one each for mentioning chance to rest as motivation in each of the direct questions.
45

Projective Questions—
Questions 2,3,4 (see almve)
Direct Questions—
Questions 15.16. “How did you feel about the inter-viewer coming just then?”
Question 17. “How did you feel about giving up time to answer questions?”
Question 17a. t!Do you usually have some ‘ree
time during the day?”
Talking About Health Motivation (vange O-3)
One point possible for the projective question and one each for the direct questions for mentioning thdt motivation was a chance to talk alxmt the health.
Projective Question—
Question 4. (Picture 2) “How is the woman (man) of the house feeling now?”
Direct Questions—
Question 9. “How do you feel about the health interview you had yesterday?”
Question 14. “Were there any things about the interview you especially liked?”
Indexes of Interviewer Orientation
A number of answers to questions in the interview with the interviewer were coded into indexes of inter-viewer attitudes. The first three indexes are based primarily on a content analysis of the interviewer’s reasons for preferring particular kinds of respondents. The ranges vary widely according to the number of possible index items in which the interviewer could express the particular orientation.
Accuracy Imagery (vange O-8)
One point for every indication of preferring accurate, complete performance or more accurate answers from respondents to the following questions:
Question 8. “Can you describe picture of the ‘ideal’ respondent— what would she (he) be like?”
Question 9. “Here is a list of kinds of respondents, which would you rather interview?” (Interviewer indicates that preference is because this kind of respondent is more ac
curate, gives more complete responses.)
Question 12,12a. “why do you think most respondents would prefer that you stick right to your job, or that you visit a little?”
Inte?@?’sonal Imagery (range O-4)
One point for each time the interviewer prefers a respondent because she (he) is more pleasant, less hostile, or more relaxed, plus one point for every time the interviewer advocates a given approach to respondents because it produces these results. Same questions as above.
Efficiency-Speed Imagery (range O-4)
One point for each time the interviewer prefers a given type of respondent because he (she) is more efficient or doesn’t take as much time. Also one point for every time the interviewer prefers a given procedure for the same reasons. Same questions as almve.
Worthwhile Work (range O-3)
One point for saying that HIS is important to the Nation, or fof saying that one of the things she liked abut her job was that it was important, worthwhile, or constructive.
Question 18. “Why do you or don’t you feel that it is important for res~ndents to know that the survey is being done for the Public Health Service?”
Question 26. “All jobs have some things that are enjoyable and some things that we don’t like, what things do you like best almut interviewing?”
Question 27b. “How important do you think the in-formation from the survey is to the nation’s health?”
Like To Intwact (~ange O-2)
One point for saying that one of the things she likes about her job is talking to people, plus one point for saying that she preferred to visit (rather than be businesslike) because she likes to talk to people.
Question 13. “Do you prefer to stick right to your job or visit a little?”
I IA1l jobs have some things that areQuestion 26. enjoyable and other things we don’t like, what things do you like best about interviewing work?”
46

----------
----------
-----------------
-----------------
Does Not Like To Impose (vange O-5) Validity of Indexes
One pint for saying that one of the things she does This study was designed to test the validity of an not like about her job is imposing, plus one point for ~ overall model rather than that of specific components. saying that she liked to be businesslike because it doesn’t take up too much of the respondents time, plus one point for thinking that interviews are too long be-cause of imposing.
Question 12a, “Why do you think that most respondents would prefer that you be businesslike?”
Question 13. “Which do you pref.er—businesslike or visiting?”
Question 26a. “What things do you like least about interviewing work?”
Question 26b. “If you were to make changes to make your job better, what would you change?”
Question 15. “Do you feel that interviews are usually too long or not ?“
Perceived Respondent’s Attitude
Taken directly from Question 1
Question 1. “How do respondents feel about being interviewed—like it, not like it, or what?”
problems with Questions (vange O-5)
One point for saying that people do not like some-thing in the questionnaire, plus one for mentioning something which is hard for respondents in the questionnaire; a ‘yes’ answer to question 5 gained the inter-viewer another point, and one point for each change suggested in the questionnaire.
C@estion 3, “What things do respondents not like akmutbeing interviewed?”
Question 4. “What are the hardest things in the questionnaire for people to answer?”
Question 5, “Are there things the respondent finds too personal or embarrassing to report?”
Question 22a,b, “How almt the questionnaire, are there some sections with which respondents have particular troubles?”
a, “What parts?” b, “Why do they have trouble?”
However, some comments may be made almut the validity of the indexes used, based on available data.
There is some doubt about what the task and inter-personal indexes are measuring, that is, whether task and interpersonal behavior are empirically different phenomena in the HIS. The task behavior index shows a low level of correlation with an index of observer ratings of task orientation as follows:
observer task ratings of: Task behavior
indexes Respondent Interviewer
Gamma coefficient
Respondent task behavior
Interviewer task behavior x
The low degree of intercorrelation is also present in the factor analysis where the task orientation rating items appeared on a dimension orthogonal to one made up of task behavior items.
A suggestion has been made that the task and inter-personal scales are actually reflections of a more general activity level in the interview. The characteristics of general activity level are discussed above.
The interpersonal behavior indexes seem some-what valid since they relate to the length of conversation between interviewer and respondent after the inter
lnt erpex;~;e;ehavior Post interview conversation length
I Gam coefficient
Respondent interpersonalbehavior ,34
Interviewer interpersonalbehavior � 44
47

-----
view is over, llmy are not related very strongly to any of the interpersonal attitudes or orientations measured by other instruments.
The projective and direct indexes of respondent feeling are assumed to be somewhat valid since they correlate with an observer rating of respondent affect during the interview as follows:
Obsexver ratingof respondentRespondent affect affect during che interview
Gamma coefficient
ZndWect que~tion index-.. ,1$
DirecC ques~ion index ,33
—ooo—
The gamma coefficient between thedirect and indirect indexes is ,37’.
Each indirect and direct indexofre8pondent feelit’v discussed in this report is actually made up of four sub.acales-number of positive comments ,numberofnegative”comments, number of times therespondent avoidec Eaying something Nsitive (includes neutralandnegative comments), and number of timestherespondentavoided saying ~ornething negative (includes neutral andpasitive comments), The expected intercorrelations were obtained atnongthe subscales within each index, partly due to the definition of each subscale with respectto others, The intercorrelations of each projective sub-scales with its paired direct index subacales ranged from ,31 to ,46, yielding additional evidence of validit y,
Unfortunately, few independent validating criteria are available for either the indexes of specific respndent concerns and motives or for the interviewer orienta. tions,
48

APPENDIX Ill
DESCRIPTION OF THE COEFFICIENT GAMMA
Introduction
Throughout this report gamma, a measure of the degree of association between two variables, has been used in place of the presentation of detailed tables of marginal interest.
Gamma is an index of association for two-way classifications which was proposed by Goodman and IWwkal in 1%54.29The measure is appropriate to data where both classifications have inherent and meaningful order. (Both variables are in categorical form, and the categories are ordered in some way @ interest.)
The coefficient gamma is the difference in conditional probabilities of like and unlike order, given no ties; it indicates how much more likely two individuals are to agree than to disagree with respect to their order in two classifications.
When estimated from a sample, the index is defined as ~-Pd
G=— 1 -Pt
where P’ is the probability that two randomly chosen individuals will have the same ordering in the two classifications;
~ is the probability that they will have a different ordering; and
Pt is the probability that one or both classifications will be identical (a tie) so that a definite order cannot be stated.
~+~+~=1
Signlficanc@ Test of Gamma
Several problems arise in testing the significance of gamma, First, the data in this study are based on a sample of six census regions located east of the Mis-
—000
sissippi. A sample of the entire U.S, population would include data for all census regions. Therefore any .aignificant tests on data from this study are not intended to be exact population estimates.
Second, the available methods of estimating the standard error of gamma are based on the assumption that the data come from a simple random sample rather than from clustered samples, Empirical methods have been developed to estimate standard errors of clustered samples )23 but these methods were judged too expensive
to use on these data because of the other limitations on interpretation which are discussed above.
On the other hand, in spite of the inability to make true population estimates or to estimate variance on the basis of clustered samples, some indication af the probability that obtained findings where not due to “chance” was desired, Therefore a conservative estimate of the standard error of gamma, proposed by Goodman and Kruskal,24 based on the asymptotic upper bound of the variance has been used as a means of get. ting a “ball park” estimate:
where Nc=total number of cases;
q =probability of ties (1- F“- @; and
G = obtained gamma coefficient
The ,95 confidence interval is then given by G k 2 x S.E~when the statement is made that the relation be-tween two variables is significant, the confidence interval defined above did not include zero.
49

APPENDIX IV
THE INTERVIEW OBSERVATION FORM
The interview observation booklet used in this study consisted of nine sections designed to obtain in-formation on the actual processes of the interview. The first two sections were filled out before the inter-view actually began (see pp. 52 and 53). Most of the re
. maining sections were related to specific questions on the basic questionnaire. Forms in these sections had the specific question(s) printed in a box at the top of the page and were completed only when the particular questions were being asked or answered.
One form, “Conversation not related directly to the interview questions” (see page 55), was used re. peatedly as the right-hand page throughout the observation booklet. These pages were filled out when conversation unrelated to the content of the questionnaire caused major changes in the interview format. This page, which is shown only once in this appendix, actually appeared eight times in the observation booklet.
The final two pages of the booklet, devoted to the overall rating of the respondent and the observer’s impressions of the interview, were filled out after the interview had been completed and the interviewer and the observer had left the dwelling unit.
The observation form was designed to apply to only one respondent. The observer chose as the prin. cipal respnfent the person who answered for herself and for other family members. If two persons or more were responding equally often, the observer selected the female respondent; if two females were reporting equally, she chose the younger person (18 years of age or over).
—ooo —
50

Bureau of the BudM.t NO. 68-6412 -Approvalexpires June 30, 1965
SURVBYRSSEARCHCENTER€THS UNIVERSITYOF MICHIGAN€
IN COOPERATIONWITH THE UNITEDSTATES PURLICHEALTH SERVICE
AND THE UNITED STATES BUREAU OF THE CENSUS
CONFIDENTIAL- All informationwhich would permit identificationof the inditid’ual will be heId strictlyconfidential,will be used only by personsengaged in and for the purposesof the survey,and will not be disclosedor releasedto others for any other purposes. (42 CFR 1.101-1.108)
Miss Name of Principalrespondent: Mrs.
Mr.
Address: Street
IdentificationCode:� PSU No.
SegmentNo.
SerialNo.
Interviewer’sName
Instructionsfor reachingDU, if rural:
Age:
City State
Time of Calls: A.M.: I ,m,
I Date of Interview: i: I
Name of observer:
PHS-T274-1 4-64
51

BEFORETHR INTERVISW- AT THR DOOR
m 1. The time the interviewerknockscm the door is o‘clock
m
2. Check numberof secondswaiting for door to open.
~ o- 9 seconds
� 10-29 seconds
� 30-60 #econds
� Over 60 seconds
3. How far was door opened at first?
4. HtIwmany questionsdid theRESPONDENTask?
� None
D one
� 2 or more
~mmlm-~
5. Check those thingsINTSRVIRWERmentionsat che door.
,
PublicHealth Service
CensusBureau
The “DearFriend!’ \letterto respondents \or the brochure 1
The interview
Other (specify)
52
I

-BEI’OSETHE INTERV’IRW INSIDE‘ME HOUSE,
6. What occurs? Who takes the initiative?
Respondent.Interviewer
Getting in the door
Suggestw chair
Suggeststable
Other (specify)
Specifieations: (Describeanythingelse which occurs to affect the settingorphysicalatmosphereof the ifiterview.)
\
)
7. Who sits first? [RespondentI
8. Are the respondentand ifiterviewetsittingclose to each othar?
m m
GENERhLRATTNGS
9, Flowpolite has the respondentbeen to the interviewer?
� Particularlypolite
~ Slightlypolite
� Average � Slightlyimpolite
Q Particularlyimpolite
10.How warm and friendlyhas the respondentbeen to the interviewer?
Q Very warm and friendly
� 9omewhatwarm and friendly
� Average - Impersonal
5 somewhatunfriendly
� Very unfriendly
53

Q. 3. How old were you on your last birthday?€Q. 4. Race€Q. 5. Sex€Q. 6. Are you now married, widowed, divorced, separated, or€
never married? Q. i’. (a) What were you doing most of the past 12 months ...?
(b) Are you retired?
GENERAL RATINGS
11.� Which of the following describes the respondent now? (Check one or more)
� Enthusiastic � Bored
� Attentive � Irritated
� Neutral � Can’ t rate
12. How loud is each speaking?
Interviewer Can’ t hear 1 mlXzzzlm-
Respondent /Can;t hear m-mm
54

CONVERSATIONNOT RELATEDDIRECTLYTO THE INTERVIEWOUESTIONS
(Use this form only for MAJOR changes)
Who brings the topic UP? Code Talks (tally) Reactionof about: j Respondent Interviewerother person
Flattersor praises [
Other Questionsabout the Iperson other person I
Gives suggestions ~to other I
1
Talks about self, ;family,friends,etc.
Talks about thingsSelf she would ratherbe
doing now
Talks about things \she is avoidingnow ;(likeironing) :
!
Asks purposeof I 1!study or of question~
Inter-Asks aboutHealth ~view
Service,Census i
Other,
Humor Laughs,jokes,triesto relievetension
Other Specify
Interviewercallsrespondent
I,
I!
I1
1
II
REACTION
CODE
A =Encouragesor answersadequately
B =Allows,evades
c =Discourages,no answer
~m
DISTRACTIONS& INTERRUPTIONS(check)
Childrenpresent � 131x3mm Adults present lx!1311zla@l
TV, radio lxl13@l@lm
Other lzlmlz3 @l@
55
~~m
Respondentcalls Interviewer First name
DISTRACTIONCODE
A. Inhibits,causes to withholdinformation
B. Distractsbut does not cause aninterruption
c. Causa8 an interruption
D. Helps respondentgive answers
E. No effect

Q. 8. Were yo. sick at any time IASTWEEK OR THSWSEK BEFORE? Q. 9, Last week or the week before did you take sny medicineor treatmentfor
any condition? Q.1O. Last week or the week before did you have any accidentsor injuries? Q.Il. Did you ever have an accidentor injurythat still bothersyou or affects
you in any way?
(Including (a) and (b) for each question)
13, How does RESPONDENTrespond to 14, What does IWTERVISWERdo in -questions?(tally)
ANSWERS IMMEDIATELY
Givee adequate answer
Elaborateresponse
Answers inadequately1DELAYSANSWER
Asks for clarification or repetition
Consultsanother personor records
Consultscalendar
attemptto get adequateanswers? (tally)
Repeatsquestionfrom schedule
Asks questionnot from schedulewhich DOESNtTSUGGESI an answer (e,g,, could you explainthat,please?)
Asks questionnot from schedulewhich MAY SUGGESTa specificanswer,or asks respondentif she agrees to a specifican8wer
Clarifiesthe ~aoing of the questionfrom the schedule
Suggestsrecgrds,calendar, other peoplebe consulted
Other (specify)
56
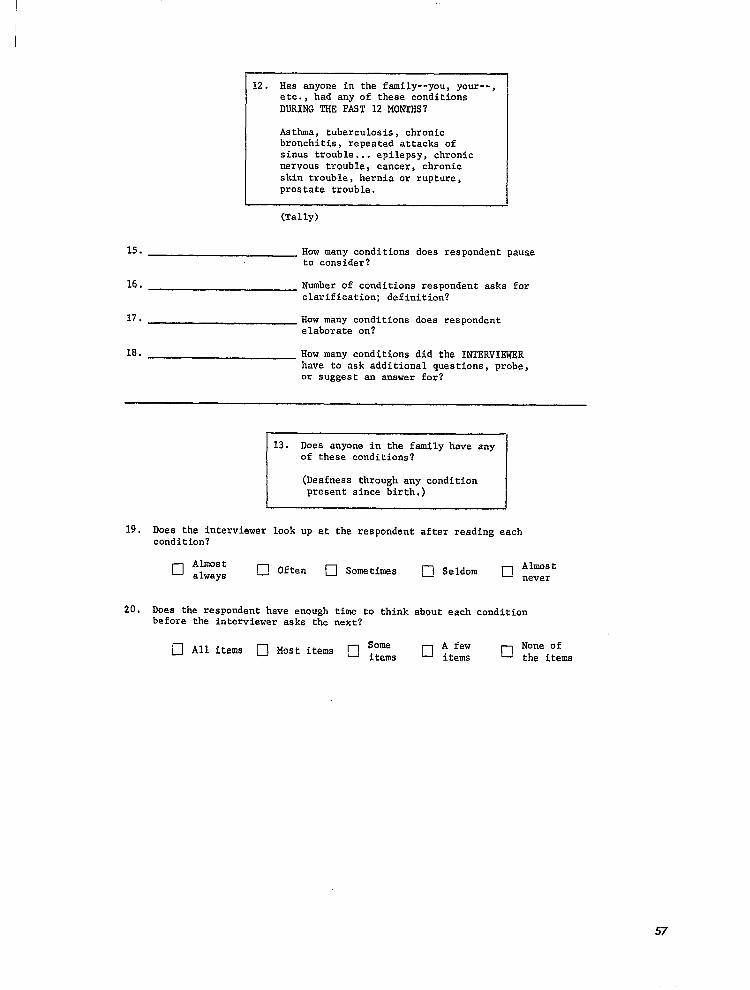
12.Has anyone in the family--you,your--,etc., had any of these conditionsDURINGTHE PAST 12 MONTHS?
Asthma, tuberculosis,chronicbronchitis,repeatedattacksofsinus trouble... epilepsy,chronicnervoustrouble,cancer,chronicskin trouble,herniaor rupture,prostatetrouble.
(Tally)
15. How many conditionsdoes respondentpauseto consider?
16. Number of conditionsrespondentasks for clarification;definition?
17. How many conditionsdoes respondentelaborateon?
18. How many conditionsdid the INTERVIEWERhave to ask additionalquestions,probe,or suggestan answerfor?
. Does anyone in the familyhave any
(Deafnessthroughany conditionK19, Does the interviewerlook up at the respondentafter readingeach /-
condition?
Almost� always @ Often � Sometimes
20. Does the respondenthave enough time to think about each conditionbefore the interviewerasks the next?
57
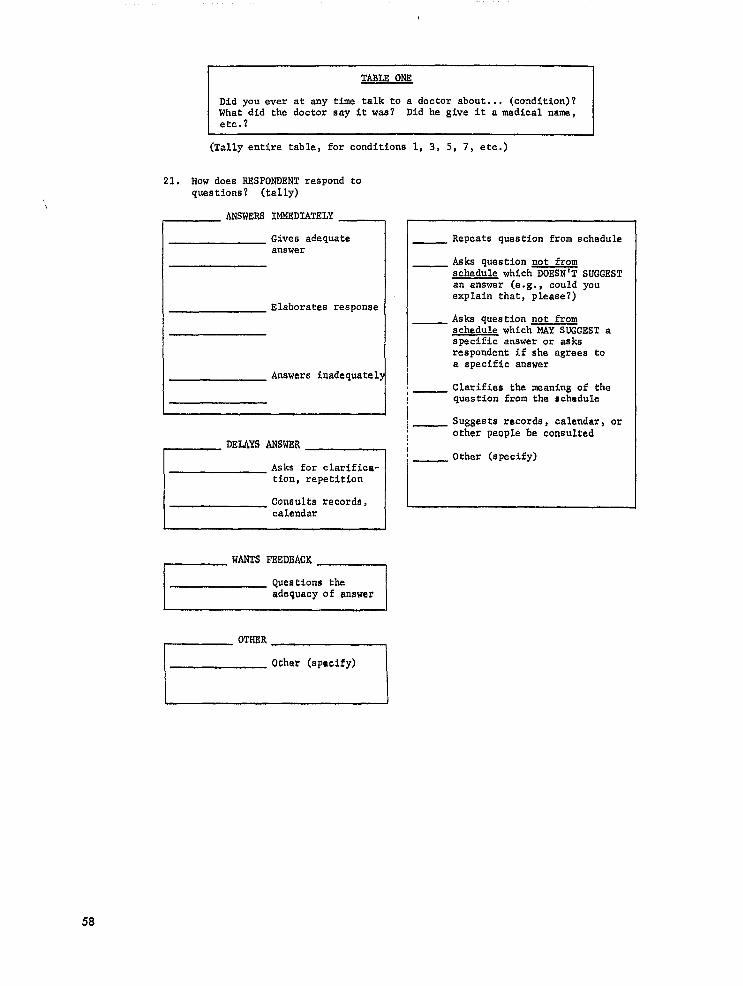
I TAELE ONE
Did you ever at any time talk to a doctorabout... (condition)?What did the doctorsay it was? Did he give it a medicalname,etc,?
(Tallyentire table,for conditions1, 3, 5, 7, etc.)
21. How does RESPONDENTrespondtoquestions? (tally)
_ ANSWERSIMMEDIATELY
Gives adequateanswer
Elaboratesresponse
Answers inadequate
DELAYSANSWER
Asks for clarification,repetition
Consultsrecords,calendar
wANTSFEEDBACK. I
Repeatsquestionfrom schedule
Asks questionnot fromschedulewhich DOESN‘T SUGGESTan answer (e.g., couldyouexplainthat,please?)
Asks questionnot fromschedulewhich MAY SUGGESTaspecificansweror asksrespondentif she agreestoa specificanswer
Clarifiesthe maaningof thequestionfrom the schedule
Suggestsrecords,calendar,orother people be coneulted
Other (specify)
I Qwstions theadequacy of answer I
OTHER
r’ Other (mcify)
58

Q. 18. LAST WEEI( OR THE WBEK BEFORE did anyone in the family go to a dentist?
Q. 19. If “no,” ask: About how long has it been since you went to a dentist?
GENERAL RATINGS ,—~
(Whila “interviewer is asking questions 18 and 19 rate the respondenton his general behavior up to now. )
23. How we 11 does this respondent grasp the meaning of the questions?
l_J Perfectly
� Very well
� Fairly well
� Not too well
� Not well at all
24. How much talking is this respondent doing.?
� A great deal--lots of elaboration; unusually talkative
� Quite a bit
� A moderate amount
� Not too much
� Very little--gives minimum answers; unusually reticent
25. How smoothly are interviewer and respondent working together?
� Extremely smoothly--no strain
� Very smoothly
� Fairly smoothly
� Not too smoothly
� Not smoothly at all--working at cross -purposes
59

Q, 20. I&l’ WEEK OR THE WEEK BEFORR did anyonein the familygo to adoctoror to a doctor’sofficeor clinic? (Include(a) - (f))
Q. 21. About how longhas it been sinceyou have seen or talkedto adoctor?
26. How does RESPONDENTrespond toqueationa? (tally)
ANSWERSIMMEDIATELY
Gives adequateanswer
Elaboratesreeponse
Answers inadequately
DEIAYSANSWER
Asks for clarification,repetition
Consultsanotherperson
Consultsrecords,calendar
WANTS FEEDBACKI [
Questionstheadequacyof answer
r
27. What does INTERVIEWERdo in attemptto get adequateanswers. (tally)
Repeatequestionfrom schedule
Asks questionnot fromschedulewhich DOESN’T SUGGESTan answer (e.g., couldyouexplainthat,please?)
Asks questionnot from schedulewhich MAY SUGGESTa specificansweror asks respondentif she agrees to ‘aspecificanswer
Clarifiesthe meaningof thequestionfrom the echedule
Suggestsrecords,calendar,orother peoplebe consulted
Other (specify)
60

SPECIALISTSCARD
Q. 23. DURINGTHE PAST 12 MONTHS has ANYONE in the family--thatis, you, your , etc.--receivedany servicesfrom any of the persons listedon this card? Please check ‘Yes”or ‘No” for each one listed.
28. Did respondentask for definitions,clarificacion,or meaningof any of theitem-son the card?
❑ Yes n No
la. (If yes) What did the interviewerdo?
Gave thoroughinformation(accordingto instructionmanual)
Gave partialinformation
Other (specify)
29. Did respondentask any other question?
❑ Yes ❑ No
30. How did respondentrespondto the card?
a Consideredthe items carefully
O Rushed throughit
a Other (specify)
31. Did the interviewerhave to read any of the list to respondent?
❑ All of it a Some of it ❑ None of it
Check nothingfor the probeswhich may follow
61

Q. 25. (a) What is the highest grade you attended in school?
Q. 26. Did you work at any time last week or the week before?If “no”, aslc Even though you did not work last week or the weekbefore, do you have a job or business? Were YOU looking for workor on layoff?
GENERAL RATINGS
32. Which of the following describes the respondent now? (Check one or more)
� Enthusiastic � Bored
� Attentive � Irritated
� Neutral ~ Can’t rate
33. How loud is each speaking?
‘interviewer s m m m m
Respondent ~! ~1 -l H F!
Q. 27. Which of these income groupa represents your total combined familyincome ...?
34. Did respondent ask the reason for the question?
Yes No� •135. Did the interviewer help the respondent arrive at an answer?
Yes No� n
62
I

CLOSE OF INTERVIEW
36. TinE last question(’Whatis the telephonenumber here?”)answered:
o’clock.
37. Was there some conversationafter the last questionwas answered?(Excludingstandardthankyou Ietterstatement)
Yes NoD �
If yes:
38. Who wanted to continuethe conversation?
@Qmm
Time leavehouse: O ‘clock
63

YOUH OVESALLRATINGSOF THE RESPONDENT
1. How cooperativewas this respondent?
Much less Somewhat Somewhat Much more � than � less than •1
About � more than � than averageaverage
average average average
2. How well did this respondentgrasp the meaningof the queetions?
Not too Not well .� Perfectly � Very well •1 Fairly
•1 well � at allwell
3. How much talkingdid this respondentdo during the interview?
� A great deal--lots of elaboration;unusuallytalkative
� Quite a bit
� A moderateauwunt � Not too much IJ Very little--givesminimumanswers;unusuallyreticent
4. How willingwa$ the respondentto give all the time necesearyfor thisinterview?
� Very willing � Somewhatwilling � Not too willing � ~~~lling
5. How much did the respondentwant to chatwith the intervieweraboutmatters?unrelatedto the schedule
� Very much � Somewhat � Almostnot at all
6. How much did the interviewerhave to clarifyand interpretfor this respondent?
� Much more than average
� Somewhatmore than average
•1 Average� Somewhatless than average
c1 Much lees than average
64

YOUH OVERALLTMFHSSSIONSOF THE INTERVIEW
1. How smoothlydid interviewerand respondentwork together?
� Extremelysmoothly--nostrain� Very smoothly
� Fairly smothly
� Not too smoothly
� Not smsothlyat all--workingat cross-purposes
2. How hard did aach try to communicate? (Checkone box for each)
Interviewer � Very much � ‘$&t � ~j~rt � ~~fl �
Almost none
effort at all
Respondent � Very much � ~f~rt � ~~rt � ~~~t �
Almost none ..
effort at all
3. In general,what was the pace of this interview?
Much faster than average
Somewhatfaster than average
About average
Somewhatslower than average
Much slower than average
4. How much did the distractionsand interruptionsaffeet the interview?
� Very much � Much � Somewhat � Little � Very little
5. To what extentdo you fee1 that the information obtainedwas accurateandcomplete?
65

OUTLINE OF REPORT SERIES FOR VITAL AND HEALTH STATISTICS
Public Health Service Publi~ation No. 1000
Series 1.
Series 2.
Series 3.
Series 4.
Series 10.
Se7ies 11.
Series 12.
Series 13.
Series 20.
Series 21.
Series 22.
Programs and collection pYocedures.— Reports which describe the general programs of the National Center for Health Statistics and its offices and divisions, data collection methods used, definitions, and other material necessary for understanding the data.
Data evaluation and methods research. —Studies of new statistical methodology including: experimental tests of new survey methods, studies of vital statistics collection methods, new analytical techniques, objective evaluations of reliability of collected data, contributions to statistical theory.
Analytical studies. — Reports presenting analytical or interpretive studies based on vital and health statist ics, carrying the analysis further than the expository types of reports in the other series.
Documents and committee Yeports. — Final reports of major committees concerned with vital and health statistics, and documents such as recommended model vital registration laws and revised birth and death certificates.
Data from the Health InteYview SuYuey. —Statistics on illness, accidental injuries, disability, use of hospital, medical, dental, and other services, and other health-related topics, based on data coHected in a continuing national household interview survey.
Data from the Health Examination Su?wey. — Data from direct examination, testing, and measurement of national samples of the population provide the basis for two types of reports: (1) estimates of the medically defined prevalence of specific diseases in the United States and the distributions of the population with respect to physical, physiological, and psychological characteristics; and (2) anal ys is of relationships among the various measurements without reference to an explicit finite universe of persons.
Data from the Institutional Population SuYveys. —Statistics relating to the health characteristics of persons in institutions, and on medical, nursing, and personal care received, based on national samples of establishments providing these services and samples of the residents or patients.
Data from the Hospital DischaYge Suraey. —Statistics relating to discharged patients in short-stay hospitals, based on a sample of patient records in a national sample of hospitals.
Data on mortality .-Various statistics on mortality other than as included in annual or monthly reports— special analyses by cause of death, age, and other demographic variables, also geographic and time series analyses.
Data on natality, mar~iage, artddivoyce. —Various statistics on natality, marriage, and divorce other than as included in annual or monthly reports— special analyses by demographic variables, also geographic and time series analyses, studies of fertility.
Data from the National Natality and Mortality Surueys. —Statistics on characteristics of births and deaths not available from the vital records, based on sample surveys stemming fkom these records, including such topics as mortality by socioeconomic class, medical experience in the last year of life, characteristics of pregnancy, etc.
For a list of titles of reports published in these series, write to: Office of Information
N?tional Center for Health Statistics U.S. Public Health Service Washington, D.C. 20201