interviewing insights regarding the fatalities inflicted by ... · mw =8.3 sanriku earthquake and...
TRANSCRIPT

Nat. Hazards Earth Syst. Sci., 13, 2173–2187, 2013www.nat-hazards-earth-syst-sci.net/13/2173/2013/doi:10.5194/nhess-13-2173-2013© Author(s) 2013. CC Attribution 3.0 License.
EGU Journal Logos (RGB)
Advances in Geosciences
Open A
ccess
Natural Hazards and Earth System
SciencesO
pen Access
Annales Geophysicae
Open A
ccess
Nonlinear Processes in Geophysics
Open A
ccess
Atmospheric Chemistry
and Physics
Open A
ccess
Atmospheric Chemistry
and Physics
Open A
ccess
Discussions
Atmospheric Measurement
Techniques
Open A
ccess
Atmospheric Measurement
Techniques
Open A
ccess
Discussions
Biogeosciences
Open A
ccess
Open A
ccess
BiogeosciencesDiscussions
Climate of the Past
Open A
ccess
Open A
ccess
Climate of the Past
Discussions
Earth System Dynamics
Open A
ccess
Open A
ccess
Earth System Dynamics
Discussions
GeoscientificInstrumentation
Methods andData Systems
Open A
ccess
GeoscientificInstrumentation
Methods andData Systems
Open A
ccess
Discussions
GeoscientificModel Development
Open A
ccess
Open A
ccess
GeoscientificModel Development
Discussions
Hydrology and Earth System
Sciences
Open A
ccess
Hydrology and Earth System
Sciences
Open A
ccess
Discussions
Ocean Science
Open A
ccess
Open A
ccess
Ocean ScienceDiscussions
Solid Earth
Open A
ccess
Open A
ccess
Solid EarthDiscussions
The Cryosphere
Open A
ccess
Open A
ccess
The CryosphereDiscussions
Natural Hazards and Earth System
Sciences
Open A
ccess
Discussions
Interviewing insights regarding the fatalities inflicted by the 2011Great East Japan Earthquake
M. Ando1, M. Ishida2, Y. Hayashi3, C. Mizuki 4, Y. Nishikawa5, and Y. Tu1
1Institute of Earth Sciences, Academia Sinica, 128 Academia Rd. 2Sec., Nankang, Taipei, Taiwan2Japan Agency Marine-Earth Science Technology, 3173-25 Showa, Kanazawa, Yokohama, Japan3Faculty of Safety Sciences, Kansai University, 7-1 Shiraume, Takatsuki, Osaka, Japan4Graduate School of Sciences, Hokkaido University, N10-W8, Kita, Sapporo, Japan5Dept. Life Science, National Taiwan University, 4 Roosevelt Rd., Taipei, Taiwan
Correspondence to:M. Ando ([email protected])
Received: 25 July 2012 – Published in Nat. Hazards Earth Syst. Sci. Discuss.: –Revised: 8 May 2013 – Accepted: 23 June 2013 – Published: 6 September 2013
Abstract. One hundred fifty survivors of the 11 March2011 Great East Japan Earthquake (Tohoku-oki earthquake)(Mw = 9.0) were interviewed to study the causes of deathsfrom the associated tsunami in coastal areas of Tohoku. Thefirst official tsunami warning underestimated the height ofthe tsunami and 40 % of the interviewees did not obtain thiswarning due to immediate blackouts and a lack of commu-nication after the earthquake. Many chose to remain in dan-gerous locations based on the underestimated warning andtheir experiences with previous smaller tsunamis and/or dueto misunderstanding the mitigating effects of nearby break-waters in blocking incoming tsunamis. Some delayed theirevacuation to perform family safety checks, and in many sit-uations, the people affected misunderstood the risks involvedin tsunamis. In this area, three large tsunamis have struck inthe 115 yr preceding the 2011 tsunami. These tsunamis re-mained in the collective memory of communities, and nu-merous measures against future tsunami damage, such asbreakwaters and tsunami evacuation drills, had been imple-mented. Despite these preparedness efforts, approximately18 500 deaths and cases of missing persons occurred. Thedeath rate with the age of 65 and above was particularlyhigh, four times higher than that with other age groups.These interviews indicate that deaths resulted from a vari-ety of reasons, but if residents had taken immediate actionafter the major ground motion stopped, most residents mighthave been saved. Education about the science behind earth-quakes and tsunamis could help save more lives in the future.
1 Introduction
The 11 March 2011 Great East Japan Earthquake (Mw = 9.0)was the largest earthquake in the region; a possible previ-ous event with an equivalent magnitude is the Jogan earth-quake of 869 (Minoura et al., 2001; Sawai et al., 2012).In the 400 yr before this event, eight near-field tsunamisstruck the region (Hatori, 1976). Among them and somefar-field tsunamis, four were major tsunamis: those result-ing from the 1611Mt = 8.4 Sanriku earthquake (Mt is themagnitude defined by tsunami height following Abe, 1999),the 1896Mw = 7.2–Mt = 8.2 Sanriku earthquake, the 1933Mw = 8.3 Sanriku earthquake and the 1960Mw = 9.5 Chileearthquake.
The 1611 earthquake was located near the Japan trench(Hatori, 1976; Sawai et al., 2006). The 1896 tsunami wasclassified as a tsunami earthquake because its seismic waveradiation was significantly lower than the size of the tsunamigenerated by the earthquake (Kanamori, 1972). This tsunamiresulted in a death toll of 22 915 for the Tohoku coast (Us-ami, 2003; Yamashita, 2005). The 1933 tsunami was an in-traslab normal fault near the trench axis (Kanamori, 1971).This tsunami caused a death toll of 3064 for the Tohoku coast(Usami, 2003). The most recent tsunami before the Tohoku-oki earthquake was the one that was generated by the 1960Chilean earthquake and propagated over a distance of 20,000km to Japan. This tsunami caused a death toll of 110 forthe Tohoku coast (Usami, 2003). Since these tsunamis, nu-merous breakwaters were constructed along the northeastern
Published by Copernicus Publications on behalf of the European Geosciences Union.

2174 M. Ando et al.: Interviewing insights
coasts, tsunami evacuation drills were performed, and hazardmaps were distributed to local residents in many communi-ties. However, despite these constructions and preparednessefforts, the 11 March Tohoku earthquake caused numerousfatalities. The Great East Japan Earthquake produced seri-ous tsunamis as well as strong shaking, which caused 18 564deaths, including missing persons (Fire and Disaster Man-agement Agency, FDMA, see the number 1 in Table 1). Here-after the number in curly brackets denotes the number of acorresponding URL site in Table 1.
Studies concerning the rupture process of theMw = 9.0Great East Japan Earthquake have been performed inten-sively based on seismic waves (Lay et al., 2011; Ide et al.,2011; Simons et al., 2011), geodetic data (Sato et al., 2011;Ozawa et al., 2011), tsunami data (Fujii et al., 2011) and in-tegrated datasets (Lee et al., 2011; Koketsu et al., 2011). Fig-ure 1 indicates that the rupture area of the Great East JapanEarthquake covered the offshore Tohoku area with 5 m and30 m fault slip contours on the fault plane (Fig. 1; Lee et al.,2011). The shaking intensity in the devastated area was atleast lower-VI on the Japan Meteorological Agency (JMA)intensity scale8, a degree that is VIII or higher on themodified Mercalli scale. The strong shaking lasted at least2–3 min and was described by local residents as the strongestand longest that they had ever experienced. Inundation andrun-up heights of the tsunami reached up to approximately40 m and exceeded 10 m at many devastated areas. The re-sulting tsunami affected more than 23 cities in which morethan 10 persons drowned (Table A in Supplement).
Although 95–97 % of the estimated population who werein the areas severely affected by the tsunami evacuated to safeplaces, 3–5 % were not so fortunate (Text A in Supplement).To understand why some people evacuated in time whileothers did not, we interviewed the survivors. Following ourprevious brief report (Ando et al., 2011), this paper analy-ses further details of the evacuation behaviours and humanthinking behind the evacuation actions by providing addi-tional data. The statistical data such as population, tsunamifatalities and damaged houses were acquired from the Statis-tics Bureau and the Director General for Policy Planning ofJapan (DGPPJ)4; the names, addresses and ages of the de-ceased were provided by the NPA2. The number of deathtolls by small areas in devastated cities are summarized bythe Tani laboratory, Saitama University3. The number ofdeaths including missing persons and three death rates arediscussed in the Supplement: (1) for the population for eachmunicipality, (2) for the inundation population provided bythe DGPPJ, and (3) for the inundation population estimatedfrom the number of collapsed houses. The death rate of thecase 2 for each coastal city is shown in Fig. 1e. The tsunamiheight data was obtained from the 2011 Tohoku EarthquakeTsunami Joint Survey Group5whose joint efforts are de-scribed by Mori et al. (2011). The data of the tsunami inun-dation area was provided by the Tsunami Damage MappingTeam, Association of Japanese Geographers6.
2 Interviewees
To understand the causes of the high number of deaths, sur-vivors were interviewed at public evacuation shelters withpermission or at select houses of the survivors in 6 citiesin mid-April and early June 2011 (Fig. 2). Each interviewwas conducted for approximately 30 min and focused on theevacuation behaviours of the interviewees and others thatthey had observed. Some interviewees spoke freely in re-sponding to our questions, with some interviews lasting morethan 1 h. However, some interviewees did not provide asmuch detail. In this survey, we did not emphasize the num-ber of interviews and statistics were not the first priority. Be-cause the number of interviewees is not sufficiently large, ourresults are not statistically significant to represent the entiredevastated area of the 2011 tsunami. The interviewee sto-ries were itemized into 25 questions by the authors; selectquestions are provided in Table 2. These questions were de-veloped after the interviews, and thus, the responses wereselected from the interview transcripts by the authors. Ac-cordingly, all the questions were not necessarily answeredby each interviewee.
Three prefectures, Iwate, Miyagi and Fukushima fromnorth to south, suffered the most severe damage from thetsunami (Fig. 1). Iwate predominantly consists of bay andheadland areas, and Miyagi and Fukushima predominantlyconsist of coastal plain areas. 90 % of the interviewees livedin bay and headland areas prior to the 2011 tsunami. We in-terviewed 125 people in the Iwate prefecture (Yamada, Ot-suki, Kamaishi, Ofunato, and Rikuzen-Takada cities) and 25people in the Miyagi prefecture (Ishinomaki city) (Fig. 2).The tsunami with amplitudes higher than 10–20 m arrived onthe shore of our interviewed areas approximately 30–40 minafter the end of the strong shaking of the main shock. Thearrival times of the large tsunami waves at tide gauge sta-tions are depicted in Fig. 1. These waves inundated inner-baytowns 3–5 min later.
2.1 Interviewees
The interviewees were made up of 55 % male and 45 % fe-male participants, and the age distribution is shown in Fig. 3.This distribution is biased to senior ages compared with thedistribution of the population in the devastated areas, where31 % of the population is 65 yr or older. However, the deathratio of people 65 yr or older was 65 % of the total deaths,four times higher than that for people below 65 yr of age(Fig. 3; see also the age distribution in Table B of Supple-ment). Because the deaths in the 65 and above age group arevery high compared to other groups, our interviews are moresuitable to understanding the reasons behind the tragedy. Inthe Tohoku earthquake, more than 90 % deaths were drown-ings due to the tsunami (NPA). 83 % of the interviewees werein the inundated areas and the 17 % of them that were in
Nat. Hazards Earth Syst. Sci., 13, 2173–2187, 2013 www.nat-hazards-earth-syst-sci.net/13/2173/2013/

M. Ando et al.: Interviewing insights 2175
Tabl
e1.
UR
Lsi
tes
used
inth
ete
xt.L
ine
num
bers
corr
espo
ndto
thos
ere
ferr
edin
the
text
as“N
o.n
ofTa
ble
1”.T
hesi
tes
belo
ww
ere
acce
ssed
on1
Apr
il20
13,e
xcep
tfor
Nos
.2an
d14
whi
chw
ere
avai
labl
ein
2012
butc
lose
das
of1
Apr
il20
13.
No.
Sub
ject
Upl
oade
dda
teIn
stitu
tion
UR
Lsi
te
2011GreatEastJapanEarthquakeandtsunami
1S
tatis
tics
ofea
rthq
uake
and
14F
eb20
12F
irean
dD
isas
ter
Man
agem
ent
http
://w
ww
.fdm
a.go
.jp/b
n/hi
gaih
ou/p
df/ji
shin
/144
tsun
amid
amag
eA
genc
y(F
DM
A)
2N
ames
and
addr
esse
sof
deat
hs17
Jul2
012,
Nat
iona
lPol
ice
Age
ncy
(NP
A)
http
://w
ww
.npa
.go.
jp/h
akus
yo/h
23/y
ouya
kuba
n/yo
uyak
uban
n.pd
fno
wcl
osed
3D
eath
tolls
bysm
alla
reas
1M
ar20
12K
.Tan
iLab
o,S
aita
ma
Uni
v.ht
tp://
ktgi
s.ne
t/toh
okud
ata/
smal
lare
am
ap/
inde
vast
ated
citie
s
4S
tatis
tics
ofde
vast
ated
citie
s29
Mar
2012
Sta
tistic
sB
urea
uan
dth
eD
irect
orht
tp://
ww
w.s
tat.g
o.jp
/info
/shi
nsai
/inde
x.ht
m#ke
kka
Gen
eral
for
Pol
icy
Pla
nnin
gof
Japa
n(D
GP
PJ)
5H
eigh
toft
he20
11ts
unam
iR
enew
edto
date
Toho
kuE
arth
quak
eT
suna
mi
http
://w
ww
.coa
stal
.jp/ts
unam
i201
1/al
ong
the
coas
tofJ
apan
Join
tSur
vey
Gro
up
6T
suna
mii
nund
atio
nor
11D
ec20
11T
suna
miD
amag
eM
appi
ngTe
am, h
ttp://
dans
o.en
v.na
goya
-u.a
c.jp
/201
1031
1/m
ap/in
dex
e.ht
ml
dam
age
area
map
sA
ssoc
iatio
nof
Japa
nese
Geo
grap
hers
7H
eigh
tofb
reak
wat
ers
–M
inis
try
ofLa
nd,I
nfra
stru
ctur
e,ht
tp://
ww
w.m
lit.g
o.jp
/com
mon
/000
1655
81.p
dfan
d20
11ts
unam
iT
rans
port
and
Tour
ism
(MIL
T)
8M
onth
lyR
epor
ton
Apr
2011
Japa
nM
eteo
rolo
gica
lAge
ncy
(JM
A)ht
tp://
ww
w.s
eisv
ol.k
isho
u.go
.jp/e
q/ga
ikyo
/mon
thly
2011
03/2
0110
3ind
ex.h
tml
Ear
thqu
akes
and
Volc
anoe
sin
Japa
nM
arch
2011
9Im
prov
emen
tsin
tsun
ami
23Ju
n20
11Ja
pan
Met
eoro
logi
calA
genc
y(J
MA
)ht
tp://
ww
w.s
eisv
ol.k
isho
u.go
.jp/e
q/ts
unam
ika
izen
benk
yoka
i/ben
kyok
ai1/
siry
ou1.
fore
cast
and
wan
ing
inre
spon
seof
Toho
ku-o
kiE
q.
10Iw
ate
Pre
fect
ure
Rec
onst
ruct
ion
Pla
nA
ug20
11Iw
ate
pref
ectu
reof
fice
http
://w
ww
.pre
f.iw
ate.
jp/∼hp
0212
/fukk
oune
t/pdf
doc/
kiho
nkei
kaku
11Le
sson
sLe
arne
dfr
omth
eG
reat
Eas
t30
Sep
2011
Cen
tral
Dis
aste
rP
reve
ntio
nC
ounc
il,ht
tp://
ww
w.b
ousa
i.go.
jp/ji
shin
/chu
bou/
higa
shin
ihon
/12/
3.pd
fJa
pan
Ear
thqu
ake,
2011
Cab
inet
Offi
ce
Pre-2011evaluation
12P
re-2
011
tsun
amih
azar
dm
apN
ov20
04Iw
ate
pref
ectu
reof
fice
http
://w
ww
.pre
f.iw
ate.
jp/∼hp
0108
01/ts
unam
i/yos
okuz
u/ho
ukok
usyo
for
Iwat
ean
dM
ar20
04M
iyag
ipre
fect
ure
offic
eht
tp://
ww
w.p
ref.m
iyag
i.jp/
sosh
iki/k
ikita
isak
u/ks
-san
zihi
gai-
top.
htm
lM
iyag
ipre
fect
ures
13E
arth
quak
efo
reca
stof
27N
ov20
00,
Hea
dqua
rter
sfo
rE
arth
quak
eht
tp://
ww
w.ji
shin
.go.
jp/m
ain/
phyo
ka02
.htm
,su
bduc
tion
regi
ons
inJa
pan
31Ju
l200
2R
esea
rch
Pro
mot
ion
(HE
RP
)ht
tp://
ww
w.ji
shin
.go.
jp/m
ain/
chou
sa/0
2juls
anrik
u/in
dex.
htm
14P
re20
11ev
alua
tion
onN
owcl
osed
Bre
akw
ater
onsi
teof
fice
ofth
eM
ILThttp
://w
ww
.pa.
thr.m
lit.g
o.jp
/kam
aish
i/por
t/pdf
/km
0404.
bay-
mou
thbr
eakw
ater
Others
15T
suna
mif
orec
astin
gm
etho
ds–
Japa
nM
eteo
rolo
gica
lAge
ncy
(JM
A)
http
://w
ww
.sei
svol
.kis
hou.
go.jp
/eq/
know
/tsun
ami/r
yote
ki.h
tml
#
yoho
kuta
kasa
16M
anua
loft
suna
mi
Mar
2012
Kam
aish
icity
offic
e,ht
tp://
ww
w.c
e.gu
nma-
u.ac
.jp/k
amai
shi
tool
/inde
x.ht
ml
disa
ster
educ
atio
nIw
ate
pref
ectu
re
17U
Sts
unam
ipro
gram
and
2011
Com
mitt
eeon
the
Rev
iew
http
://w
ww
.nap
.edu
/cat
alog
.php
?rec
ord
id=
1262
8th
ena
tion’
spr
epar
edne
ssof
the
Tsu
nam
iWar
ning
and
For
ecas
tSys
tem
and
Ove
rvie
w,U
SA
gove
rnm
ent
www.nat-hazards-earth-syst-sci.net/13/2173/2013/ Nat. Hazards Earth Syst. Sci., 13, 2173–2187, 2013

2176 M. Ando et al.: Interviewing insights
a) Rupture area
5m
30m
0 100 200km
Iwate
Fuku-Shima
c) Tsunami height
Miyagi
b) Tsunami height d) Death rate
(m) (m) (%) (m)
e) Breakwater/tsunami
height
1896 1933 1960
2011 Breakwater
2011
15:50
16:51
15:21
15:21
15:15
15:20
40°N
38°N
36°N
140°E 142°E 144°E
Fig. 1. (a)The rupture area of the 11 March 2011 Great East Japan Earthquake, including 5 m and 30 m fault slip contours (Lee et al., 2011).The epicenter of the main shock (star) and the area in which people were interviewed (red rectangle) are shown. The arrival times of the largetsunami waves at tide gauge stations (black circles) are shown in local time (UT+9 h). These waves arrived at inner-bay towns 3–5 min later.(b) Inundation heights (m) along the Tohoku coast for the 16 June 1896Mt = 8.2, 3 March 1933Mw = 8.3, and 23 May 1960Mw = 9.5(Chile) tsunamis (Usami, 2003).(c) The wave heights of the tsunami following the 11 March 2011Mw = 9.0 earthquake (2011 TohokuEarthquake Tsunami Joint Survey Group, No. 4 in Table 1).(d) The estimated death rate (%) in the inundated areas of each municipality,following the 2011 Great East Japan Earthquake. The number of deaths and missing persons in each municipality and the inundation areasare provided by the Statistics Bureau and the Director General for Policy Planning of Japan (DGPPJ) (No. 4 in Table 1).(e) The heights ofbreakwaters and tsunami waves at the corresponding sites (the Central Disaster Prevention Council, Cabinet Office, No. 11 in Table 1). Onlyin the northernmost areas were the breakwaters higher than the incoming tsunami waves, but the tsunami still flooded through gaps in thebreakwaters (Iwate prefecture office).
a deep inland areas or high lands were proved to be safe[see the questionnaire 1 in Table 2]. Hereafter the numberin square brackets [ ] denotes the number of a correspondingquestionnaire in Table 2.
2.2 Six interviewed cities
Figure 2 shows the six cities in which we conducted inter-views. The five cities in Iwate prefecture (Fig. 2a–f) werelocated in typical bay and headland areas. Ishinomaki inMiyagi prefecture was located in a peripheral coastal plainarea, but near a bay and headland area (Fig. 2g). The pre-2011 forecast tsunami inundation limits from the tsunamihazard maps are shown by red lines (after the Iwate andMiyagi prefecture offices12), and the 2011 inundation ar-eas are coloured in blue (after the Tsunami Damage MappingTeam, Association of Japanese Geographers6) in whichthe tsunami heights are shown in meters. Each map shows thepercentages of the population (left bar) and the deaths (rightbar) for three age groups (0–15, 16–64, and 65 and above),
where the data were collected from Tani (2012). The deathtolls and inundation populations are summarized in Table 3.The affected populations were concentrated in the coastalareas. Because the major cities further inland are far fromthe coastal municipalities, commuting, travelling to schooland shopping are generally limited within each city or in theneighbouring coastal cities. The numbers of interviewees areshown in Fig. A in Supplement.
3 Evacuation behaviours
In the bay and headland areas, highlands and safer groundsare within 5–20 min by foot at a normal speed from thetsunami-affected areas. In many locations, sometimes, hillsare present just behind dwellings. In contrast, in the coastalplain areas, the tsunami inundated 2–4 km (Sawai et al.,2012), unlike what was observed in the bay and headlandareas. This survey focuses mostly on tsunami evacuation be-haviours in the former areas, as mentioned above.
Nat. Hazards Earth Syst. Sci., 13, 2173–2187, 2013 www.nat-hazards-earth-syst-sci.net/13/2173/2013/

M. Ando et al.: Interviewing insights 2177
Table 2. Interviewee responses.
No. Question items No. of interviewees No. of replies Replies, %
1 Where were you during the strong shaking? 150 150
1. At an area to be inundated 118 832. At a deep inland or high land 29 153. N/A 3 2
2 Did you evacuate safely? 150 150
1. Safely 52 352. Slightly dangerous 39 263.Very risky, chased by tsunami 26 174. Submerged by tsunami 8 55. Safe or proved to be safe places 25 17
3 Was the shaking strongest and of the longest durationthat you had experienced? 150 150
1. Yes 145 972. Not so much 3 23. N/A 2 2
4 How did you obtain the tsunami warning information? 150 150
1. None 63 422. Bosai Musen(Local outdoor loud speakers) 47 313. Media (TV, Radio, etc.) 19 134. Someone else 13 95. N/A 8 5
5 What did you do first after the shaking stopped? 150 150
1. Evacuated to a higher place 47 312. Verified the safety of family or neighbors 41 273. Cleaned things that were scattered 22 144. Provided public support for the evacuation of others 8 55. Prepared for evacuation 10 66. Talked with neighbors 6 47. Went to see the incoming tsunami 6 48. Other 10 6
6 For those who did not select 5.1,why didn’t you evacuate immediately?(a maximum of 2 replies for each interviewee) 103 138
1. Expected the incoming tsunami to be small 47 462. Verified the safety of family or neighbors 40 393. Believed that current location was high enough 19 184. The incoming tsunami would not reach my place 11 115. No consideration of tsunami possibility 5 56. Other 4 4
7 What was the motivation to decide to evacuate? 150 150
1. Own decision based on the strong shaking 44 292. Someone else’s confirmation 49 333. Seeing the incoming tsunami 27 184. Safe place, no need to move 13 95. Bosai Musen(local outdoor announcement) 10 76. Public media 5 37. Other 2 1
www.nat-hazards-earth-syst-sci.net/13/2173/2013/ Nat. Hazards Earth Syst. Sci., 13, 2173–2187, 2013
2178 M. Ando et al.: Interviewing insights
Table 2.Continued.
No. Question items No. of interviewees No. of replies Replies, %
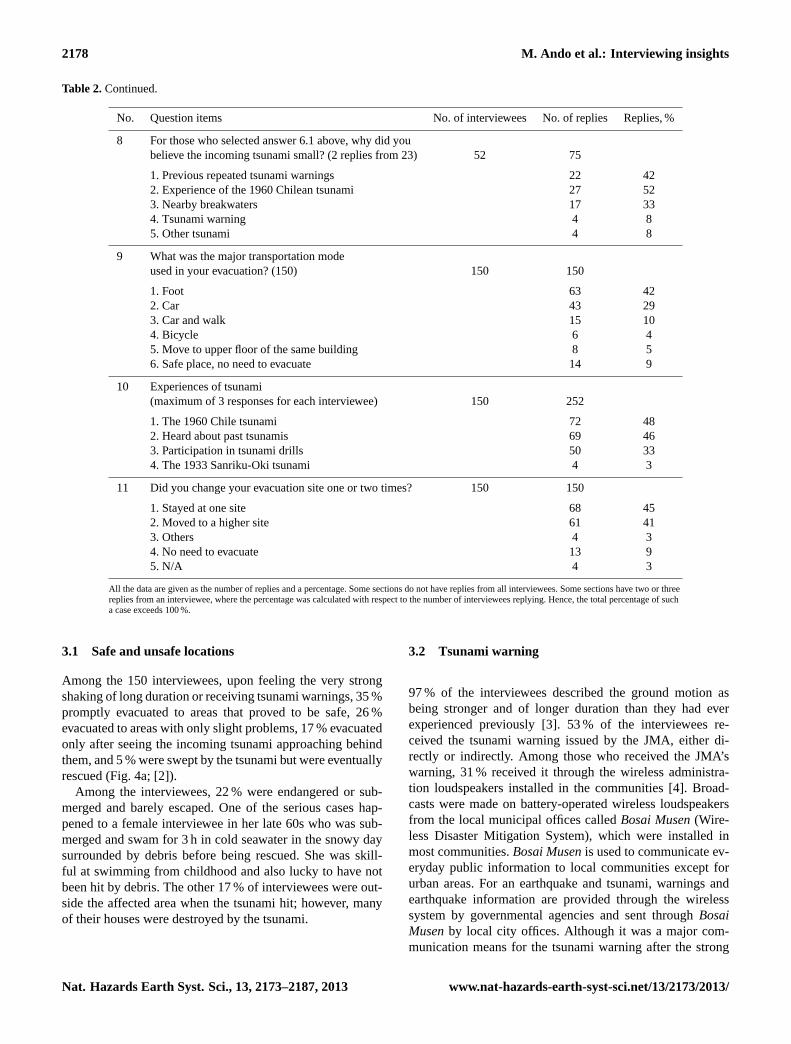
8 For those who selected answer 6.1 above, why did youbelieve the incoming tsunami small? (2 replies from 23) 52 75
1. Previous repeated tsunami warnings 22 422. Experience of the 1960 Chilean tsunami 27 523. Nearby breakwaters 17 334. Tsunami warning 4 85. Other tsunami 4 8
9 What was the major transportation modeused in your evacuation? (150) 150 150
1. Foot 63 422. Car 43 293. Car and walk 15 104. Bicycle 6 45. Move to upper floor of the same building 8 56. Safe place, no need to evacuate 14 9
10 Experiences of tsunami(maximum of 3 responses for each interviewee) 150 252
1. The 1960 Chile tsunami 72 482. Heard about past tsunamis 69 463. Participation in tsunami drills 50 334. The 1933 Sanriku-Oki tsunami 4 3
11 Did you change your evacuation site one or two times? 150 150
1. Stayed at one site 68 452. Moved to a higher site 61 413. Others 4 34. No need to evacuate 13 95. N/A 4 3
All the data are given as the number of replies and a percentage. Some sections do not have replies from all interviewees. Some sections have two or threereplies from an interviewee, where the percentage was calculated with respect to the number of interviewees replying. Hence, the total percentage of sucha case exceeds 100 %.
3.1 Safe and unsafe locations
Among the 150 interviewees, upon feeling the very strongshaking of long duration or receiving tsunami warnings, 35 %promptly evacuated to areas that proved to be safe, 26 %evacuated to areas with only slight problems, 17 % evacuatedonly after seeing the incoming tsunami approaching behindthem, and 5 % were swept by the tsunami but were eventuallyrescued (Fig. 4a; [2]).
Among the interviewees, 22 % were endangered or sub-merged and barely escaped. One of the serious cases hap-pened to a female interviewee in her late 60s who was sub-merged and swam for 3 h in cold seawater in the snowy daysurrounded by debris before being rescued. She was skill-ful at swimming from childhood and also lucky to have notbeen hit by debris. The other 17 % of interviewees were out-side the affected area when the tsunami hit; however, manyof their houses were destroyed by the tsunami.
3.2 Tsunami warning
97 % of the interviewees described the ground motion asbeing stronger and of longer duration than they had everexperienced previously [3]. 53 % of the interviewees re-ceived the tsunami warning issued by the JMA, either di-rectly or indirectly. Among those who received the JMA’swarning, 31 % received it through the wireless administra-tion loudspeakers installed in the communities [4]. Broad-casts were made on battery-operated wireless loudspeakersfrom the local municipal offices calledBosai Musen(Wire-less Disaster Mitigation System), which were installed inmost communities.Bosai Musenis used to communicate ev-eryday public information to local communities except forurban areas. For an earthquake and tsunami, warnings andearthquake information are provided through the wirelesssystem by governmental agencies and sent throughBosaiMusenby local city offices. Although it was a major com-munication means for the tsunami warning after the strong
Nat. Hazards Earth Syst. Sci., 13, 2173–2187, 2013 www.nat-hazards-earth-syst-sci.net/13/2173/2013/

M. Ando et al.: Interviewing insights 2179
Fig. 2.The six cities in which interviews were conducted.(a)–(g)the map of he interviewed area of each city shown with topographic contourlines at 50 m intervals. The inundation areas of the 2011 Great East Japan Earthquake (light blue) are provided by the Association of JapaneseGeographers (6, No. 6 in Table 1). The red lines show the tsunami inundation limits that were forecasted in 2006 by the Iwate and Miyagiprefecture offices, based on the scenario earthquakes A, B, and C in Fig. 7 (Iwate and Miyagi prefecture offices12, No. 12 in Table 1). Theforecast inundation limits at each site were taken as the highest values among the three models. Numerals are inundation or runup heightsof the observed 2011 tsunami in meter (Tohoku Earthquake Tsunami Joint Survey Group5, No. 5 in Table 1). The major difference is inheight; the 2011 tsunami wave heights were 2–5 times higher than the forecasted heights. Each map shows the percentages of the population(left bar) and the deaths (right bar) for three age groups (0–15, 16–64, and 65 and above from bottom to top), where the data were collectedfrom Tani (2012). Subdivision maps Takada and Hirota of Rikuzen-Takada city are depicted separately to compare evacuation behavioursbetween the two divisions, where the tsunami has wave heights of 12–15 m. Takada is the main subdivision of the city of Rikuzen-Takada, acommercial and business town lying in a wide lowland sand dune. Hirota is also in Rikuzen-Takada and is located in narrow lowlands, whereslopes have developed between hills and the seawater is visible almost everywhere. Topographic profiles along Takada(h) and Hirota(i) areshown with a line of 15 m. The number of interviewees who felt the 2011 Great East Japan Earthquake at each location is depicted in Fig. Ain Supplement on the same map as Fig. 2.
www.nat-hazards-earth-syst-sci.net/13/2173/2013/ Nat. Hazards Earth Syst. Sci., 13, 2173–2187, 2013
2180 M. Ando et al.: Interviewing insights
55% 43%
2%
37%
5%
58% 58%
12% 30%
Interviewees
N=150
Inundation deaths
N=7,056
Inundation population
N=239,000
0-14
15-64
65-
Age group
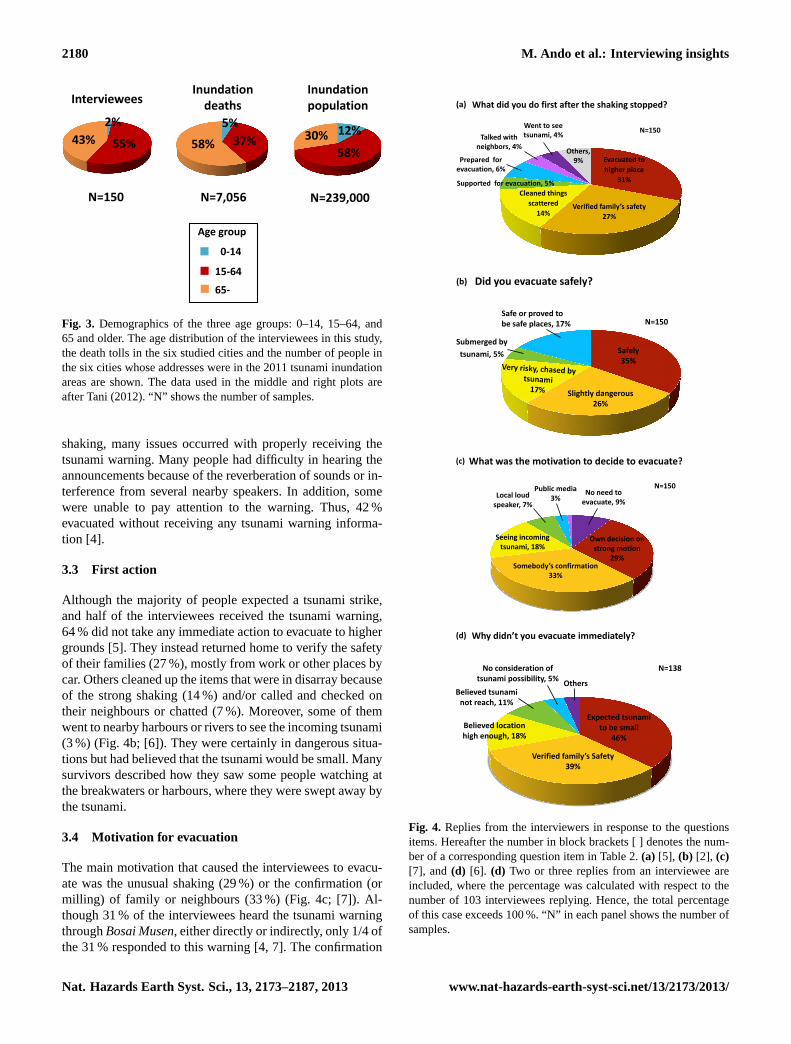
Fig. 3. Demographics of the three age groups: 0–14, 15–64, and65 and older. The age distribution of the interviewees in this study,the death tolls in the six studied cities and the number of people inthe six cities whose addresses were in the 2011 tsunami inundationareas are shown. The data used in the middle and right plots areafter Tani (2012). “N” shows the number of samples.
shaking, many issues occurred with properly receiving thetsunami warning. Many people had difficulty in hearing theannouncements because of the reverberation of sounds or in-terference from several nearby speakers. In addition, somewere unable to pay attention to the warning. Thus, 42 %evacuated without receiving any tsunami warning informa-tion [4].
3.3 First action
Although the majority of people expected a tsunami strike,and half of the interviewees received the tsunami warning,64 % did not take any immediate action to evacuate to highergrounds [5]. They instead returned home to verify the safetyof their families (27 %), mostly from work or other places bycar. Others cleaned up the items that were in disarray becauseof the strong shaking (14 %) and/or called and checked ontheir neighbours or chatted (7 %). Moreover, some of themwent to nearby harbours or rivers to see the incoming tsunami(3 %) (Fig. 4b; [6]). They were certainly in dangerous situa-tions but had believed that the tsunami would be small. Manysurvivors described how they saw some people watching atthe breakwaters or harbours, where they were swept away bythe tsunami.
3.4 Motivation for evacuation
The main motivation that caused the interviewees to evacu-ate was the unusual shaking (29 %) or the confirmation (ormilling) of family or neighbours (33 %) (Fig. 4c; [7]). Al-though 31 % of the interviewees heard the tsunami warningthroughBosai Musen, either directly or indirectly, only 1/4 ofthe 31 % responded to this warning [4, 7]. The confirmation
Supported for evacuation, 5%
(a) What did you do first after the shaking stopped?
Verified family’s safety
27%
Evacuated to
higher place
31%
Prepared for evacuation, 6%
Talked with neighbors, 4%
Cleaned things
scattered
14%
Went to see tsunami, 4%
Others, 9%
N=150
Did you evacuate safely?(b)
Safely 35%
Slightly dangerous 26%
Submerged by
tsunami, 5%
Safe or proved to be safe places, 17% N=150
Own decision on strong motion
29% Somebody’s confirmation
33%
Seeing incoming tsunami, 18%
Local loud speaker, 7%
Public media 3%
No need to evacuate, 9%
(c) What was the motivation to decide to evacuate?
N=150
Expected tsunami to be small
46%
Verified family’s Safety 39%
Believed location high enough, 18%
Believed tsunami not reach, 11%
No consideration of tsunami possibility, 5%
Others
(d) Why didn’t you evacuate immediately?
N=138
Fig. 4. Replies from the interviewers in response to the questionsitems. Hereafter the number in block brackets [ ] denotes the num-ber of a corresponding question item in Table 2.(a) [5], (b) [2], (c)[7], and (d) [6]. (d) Two or three replies from an interviewee areincluded, where the percentage was calculated with respect to thenumber of 103 interviewees replying. Hence, the total percentageof this case exceeds 100 %. “N” in each panel shows the number ofsamples.
Nat. Hazards Earth Syst. Sci., 13, 2173–2187, 2013 www.nat-hazards-earth-syst-sci.net/13/2173/2013/

M. Ando et al.: Interviewing insights 2181
or milling of others is what led them to evacuate. This is awell-known and effective way of evacuating people in manycases (e.g. JMA8). However, actually seeing the incomingtsunami was the most direct information that prompted inter-viewees to evacuate (17 %). They saw from afar the smok-ing muddy floods and/or heard loud crashing sounds as thetsunami destroyed the houses and structures along its path.They also saw the actual tsunami front, which caused manypeople to flee and run for safety while simultaneously hear-ing the shouting voices of neighbours or the announcementof Bosai Musen. When one of the evacuees in his 50s turnedinto one of cross streets from a main street and looked backbehind him approximately 10 m from the corner where hehad turned, he had seen “the cross-section” of the tsunamiflow containing many cars and miscellaneous debris. Fortu-nately, the water did not flow into the cross street at that mo-ment and only passed by, and he was able to escape fromthe tsunami. He is grouped in the category of having escapedunder an extremely dangerous situation.
3.5 Reasons not to immediately evacuate
The 103 interviewees (65 %) who did not take an immediateevacuation action to higher grounds provided the followingreasons (32 produced two replies, resulting in a total of 138replies): 46 % imagined that the incoming tsunami would besmall, 39 % needed to return home to verify the safety of theirfamily regardless of the size of tsunami, 18 % believed thatthe nearby breakwaters were high enough, 11 % believed thatthey were in a safe place for various reasons, and 5 % neverthought about the possibility of a tsunami occurring after theearthquake (Fig. 4d; [6]).
A total of 52 interviewees provided reasons why they hadimagined that the incoming tsunami would be small or wouldhave little effect on them. Each interviewee selected 1 or2 reasons, and a total of 75 reasons were counted. Amongthem, 52 % interviewees cited direct or indirect experiencewith the 1960 Chile tsunami, 33 % mentioned the nearbybreakwaters, and 42 % mentioned previous JMA tsunamiwarnings [8]. These reasons will be discussed later.
3.6 Transportation
Cars are used in the rural areas on a daily basis much morethan in the urban areas in Japan. This factor has produced acar-dependent society, and thus, the use of a car became nat-ural even for tsunami evacuation. Among the interviewees,39 % evacuated using cars, and among them, 10 % walked orran after driving; 42 % evacuated by foot either by walking orrunning; 4 % evacuated using a bicycle; and 5 % remained athome or in an office [9]. In the most devastated areas, peoplecould reach the highlands in several min to 20 min on foot ata normal speed. Nevertheless, many chose to use their car toevacuate. Thus, all cars rushed into the streets that led to thehighlands, which caused extreme traffic jams. Moreover, this
situation became worse when the power shutdown and lefteveryone in vehicles without traffic lights. In the end, thesecars were washed away by the tsunami. It should be notedthat in our survey, we did not meet any survivors who escapedor were rescued from a vehicle once it was submerged by thetsunami. This car-dependent tendency of the local popula-tion might further increase in the future unless some actionsor changes are taken concerning evacuation procedures andinstructions.
4 Discussion
Based on the above interviews and observations, several is-sues influenced the local residents’ decision “not to evacuateimmediately”. Most interviewees believed that the incomingtsunami would be small and would not reach their location.The major reasons were that the previous tsunamis were lowcompared with most communities, and the emergency evac-uation sites were not high. Although some reasons were notobvious to the interviewees and not realized by them, sev-eral issues were related to earthquake science. Throughoutour survey, it was observed that recent earth science or tech-nology did not help in reducing the death rate. Instead, theincorrect earthquake forecast may have increased the deathrate to some extent due to the underestimate of the size of thetsunami.
4.1 Blackout and improper tsunami warning issue
As mentioned above, approximately half of the people didnot receive the tsunami warning. Immediately after the strongground shaking started, many power plants, substations andsupply systems were damaged, and thus, regional electricitywas not supplied immediately after the shaking started. Peo-ple were unable to obtain the tsunami information throughTV, which generally provides tsunami warning informationto the local residents. In addition, battery-operated radioswere not available to most families. Nevertheless, those whowere driving their cars were able to listen to the warning fromthe radio.
The origin time of the earthquake was 14:46 LT (localtime = UT + 9 h). The magnitude calculated by the JMAat 14:49 LT was only 7.9, with estimated tsunami heights of3 m in Iwate and Fukushima and 6 m in Miyagi. Tsunamiwarnings issued by the JMA are assigned based on seis-mic waves: they first used P waves from local seismogramswithin 3 min for an immediate warning and then within15 min local broad-band seismograms were used to revisethe warning. The JMA had tried to shorten the delay in is-suing a tsunami warning to three minutes after an earth-quake occurred. This goal of the 3 min warning was real-ized at the 2011 Great East Japan Earthquake. However, theP waves within the first 3 min of this earthquake were ex-tremely complicated, making it difficult to estimate the size
www.nat-hazards-earth-syst-sci.net/13/2173/2013/ Nat. Hazards Earth Syst. Sci., 13, 2173–2187, 2013

2182 M. Ando et al.: Interviewing insights
(a) Age 12 - 64 (b) Age above 64
Safely
Slightly dangerous
Very risky
Submerged
Difference between age groups on evacuation situation
N=85 N=65
42%
34%
18% 6%
41%
28%
24% 7%
Fig. 5. Replies from the interviewers with the two age groups: 12–64 (a) and 65 and above (b) in response to the question item No. 6in Table 2. “N” in each panel shows the number of samples.
of the earthquake from local strong-motion records (Hoshibaet al., 2011). This tsunami warning was followed by an up-dated warnings at 15:14 and 15:30 LT9 (Fig. 6). How-ever, these warnings never reached the majority of the localpopulace. Thus, some residents went to the nearest evacu-ation sites expecting a relatively small tsunami, while oth-ers thought that the tsunami would cause only a small floodand took time to clear fallen debris before evacuating on footor by car. In fact, the 10 to 20 m high-tsunami struck mostof the interviewed areas between approximately 15:20 and15:35 LT.
As a result of the first warning, some people turned to in-formation for security. Nevertheless, considering the mini-mal information that the local inhabitants had received, even-tually 95–97 % of the local residents, even in the severely in-undated areas, were able to evacuate in time (Supplement).We questioned some of the interviewees about how theywould have reacted if a warning of a 10–15 m high tsunamihad been initially issued. Among the interviewees, 30 re-sponded that they would have evacuated immediately. Al-though it is an ex post facto question, these answers im-ply that a more timely warning giving a more accurate esti-mate of the tsunami height may have effectively saved humanlives.
Regarding the tsunami early warning system, the data fromreal-time pressure gauges installed 46 and 76 km off the coast(Fig. 6) were unfortunately not used in real time, although thedata were transmitted continuously in real time to the JMAand the University of Tokyo. As shown in Fig. 6, the TM1water pressure gauge, located in the area of major coseismiccrustal deformation, had detected a tsunami with a height of2 m at 14:55 LT and of 5.2 m at 15:00 LT. These parts of thewave arrived at the coast approximately 25 and 20 min later,respectively, and its height was amplified 6 times (12 m and
2m
Fig. 6. Tsunami waveforms recorded at ocean-bottom pressuregauges (TM1 and TM2), five GPS buoy wave meters and two tidalgauge stations. The solid lines show the time ranges during whichthe data were monitored in real time, and the dashed lines showthose for which data were stored at onshore stations and recov-ered later due to the blackout. At the top, the vertical strong-motionrecord from station HTKD of the National Institute of Disaster Mit-igation and Science (NIED) is shown. HTKD was located near thetide gauge station Ofunato (solid triangle). 5 min after the origintime of the 2011 Great East Japan Earthquake. The gray boxesshow the forecasted tsunami heights for Iwate (upper) and Miyako(lower) prefectures, issued by the first warning at 14:49 LT, the sec-ond at 15:14 LT, and the third at 15:30 LT. The major tsunami wavesstruck the interviewed towns at approximately 15:20–15:30 LT. The5 m and 30 m fault slip contours for the Great East Japan Earthquakeare also shown (Lee et al., 2011). The epicenter of the main shockis indicated by the star.
30 m, respectively) at the coastal areas, according to an es-timate of tsunami height based on Green’s law (JMA15,accessed on 13 April 2013). The wave was recorded at TM25 min after it was recorded at TM1. 10 min later, the offshoreKamaishi GPS wave meter recorded the same tsunami wave.If the data recorded at the pressure gauges had been used inreal time for tsunami warning, more lives would have beensaved, although many communication systems had alreadybeen damaged by that time. Eventually, this record was uti-lized at 15:30 LT for the third tsunami warning from the JMA(Fig. 4), which was too late to be delivered to most people. Atthe time of the earthquake, the JMA used the pressure gauges
Nat. Hazards Earth Syst. Sci., 13, 2173–2187, 2013 www.nat-hazards-earth-syst-sci.net/13/2173/2013/

M. Ando et al.: Interviewing insights 2183
as a secondary data source for tsunami warnings. The use ofwater pressure gauges for tsunami warnings was authorizedon 9 March 2012, a year after the earthquake, at which pointthe JMA explained that technical concerns with the pressuregauges had been largely solved.
The Geographical Survey Institute (GSI) received data inreal time from onshore GPS sites at the time of the Great EastJapan Earthquake, but it had not started using real-time kine-matic GPS (RTK-GPS) for tsunami warnings. If it had beenused for tsunami warnings, it would have revealed that theearthquake was much larger thanM = 7.9. The GSI startedusing RTK-GPS, following Ohta et al. (2012). However, theJMA has not yet used this for tsunami warning. Because onlythe JMA is allowed to issue a tsunami warning by law, theRTK-GPS is not yet used for tsunami warning.
4.2 Previous tsunami experience [10]
Residents over 85 yr of age (10 % of the population) had ex-perience with the 1933 tsunami. Although they did not leadthe evacuation efforts, they were able to transfer their knowl-edge to their descendants. In addition, residents over 55 yrof age (50 % in population) experienced and remembered the1960 Chile tsunami [10] and transferred their knowledge tothe younger generations. As mentioned in a previous section,some of experience led to assumptions concerning the in-coming tsunami height or its inundation area in their commu-nities based on the heights of the 1960 tsunami. Some clearlyremembered that in 1960, the sea level slowly raised as if fill-ing the water in a swimming pool. This sense of “knowing”that “the tsunami will be small” based on their previous ex-perience put their lives at a very high risk. They did not antic-ipate at all that the tsunami would approach and rise rapidlyand violently.
Similarly, the residents had used to the JMA’s previoustsunami warning. JMA had issued 15 warnings or alerts ofa tsunami in the preceding 4 yr in Japan. In many cases, thetsunamis that affected the coasts were relatively small or neg-ligible. These frequent warnings, coupled with an overesti-mated tsunami height, produced a false sense of security tothe residents. Unfortunately, in contrast, the 11 March warn-ings issued at 14:49 and 15:14 LT by JMA was underesti-mated in terms of both the magnitude and tsunami heights,which resulted in inaction, improper decisions and/or de-layed evacuation. Many interviewees underrated the tsunamiwarning as usual and did not take it seriously for immediateevacuation [8].
4.3 Incorrect earthquake forecast
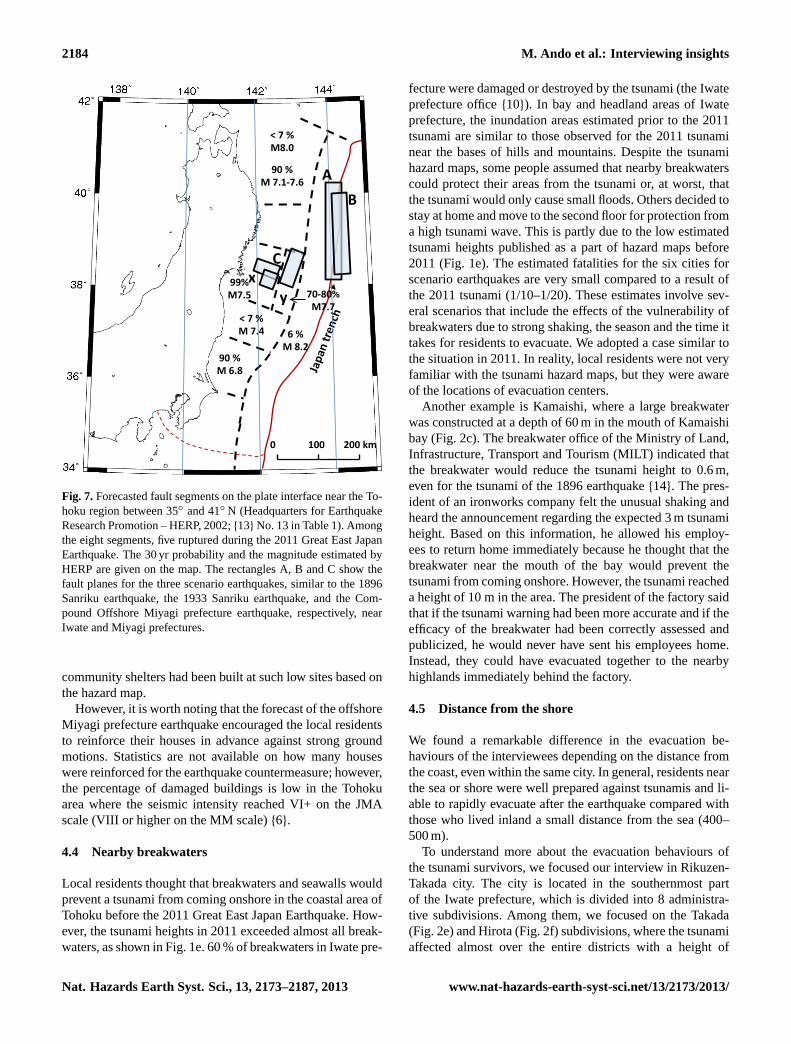
Earthquake forecasting is based on the study of earth-quakes. The Headquarters for Earthquake Research Promo-tion (HERP), a governmental office, issued an earthquakeforecast with earthquake magnitudes and probabilities for theentire plate boundaries and active faults in Japan13. The
forecast events for the Tohoku region were also provided butproved to be much smaller than that of the actual magnitudeof the 2011 Tohoku earthquake (Fig. 7). The reason behindthis is that the committee divided the seismogenic zone offthe Tohoku region along the Japan trench into 10 segmentsbased on the last 400 yr earthquake history. The HERP alsoassumed that these segments would generate earthquakes al-most independently. Based on these assumptions, the earth-quake magnitude calculations could provide estimates of thecorresponding hazards. As a result, the maximum magnitudeestimate for the segment of the offshore Miyagi prefecture(Segment “x” in Fig. 7) was 7.5, with a 99 % probability ofoccurrence in the next 30 yr. This probability of “99%” waswell known through the media, and many interviewees wereaware of the “offshore Miyagi prefecture earthquake”.
Iwate and Miyagi prefecture offices developed tsunamihazard maps based on the forecast by the HERP. There werethree scenario earthquakes, of which faults are shown byrectangles of A–C (Fig. 6): (A) an earthquake similar tothe 1896 earthquake, (B) an earthquake similar to the 1933earthquake, and (C) theMw = 8.0 hypothetical compoundoffshore Miyagi prefecture earthquake (three rectangles insegments “x” and “y”). The tsunami inundation limit wasconsidered to be the highest estimate at each site for thethree scenario earthquakes. In Iwate prefecture, the highesttsunami estimates were mostly from the 1896 tsunami, whilein Miyagi prefecture, the highest tsunami estimates werefrom the compound offshore Miyagi prefecture earthquake.However, due to the small anticipated magnitudes of theseearthquakes, the expected tsunami heights were much lowerthan the actual heights for the 2011 tsunami. The red linesin Fig. 2 show tsunami inundation limits obtained from theseassumptions. In the bay and headland areas, the estimatedtsunami limits were similar to those of the 2011 tsunami(Fig. 2a–f), while the height of the estimated incoming waveswere 1/3 to 1/10 of those of the 2011 tsunami. The estimationof fatalities from the scenario earthquakes (the Iwate prefec-ture office 7) are much smaller by 1/6 to 1/10 than thatassociated with the 2011 Great East Japan Earthquake.
Many evacuation shelters were constructed even in thepre-2011 tsunami hazard areas in Fig. 2. 48 % of the inter-viewees initially evacuated to these designated evacuationsites [11]. However, the Tohoku earthquake was much largerthan expected, affected a broader area, and produced a muchhigher tsunami than the anticipated earthquakes, and manyevacuees moved from their initial evacuation sites after see-ing the height of the incoming tsunami. However, some peo-ple were not as lucky and were swept away while still inthe evacuation shelters. The evacuation centers were deter-mined based on the study of the scenario earthquakes, whichinvolved risk assessments and either indirectly or directly af-fected the preparedness of the residents. In short, the inac-curate forecast resulted in increased casualties in the localpopulations. A councilman in a small town regretted that the
www.nat-hazards-earth-syst-sci.net/13/2173/2013/ Nat. Hazards Earth Syst. Sci., 13, 2173–2187, 2013
2184 M. Ando et al.: Interviewing insights
0 100 200 km
90 % M 7.1-7.6
6 % M 8.2
99% M7.5
< 7 % M 7.4
90 % M 6.8
70-80% M7.7
A
B
C
< 7 % M8.0
y x
Fig. 7.Forecasted fault segments on the plate interface near the To-hoku region between 35 and 41 N (Headquarters for EarthquakeResearch Promotion – HERP, 2002;13 No. 13 in Table 1). Amongthe eight segments, five ruptured during the 2011 Great East JapanEarthquake. The 30 yr probability and the magnitude estimated byHERP are given on the map. The rectangles A, B and C show thefault planes for the three scenario earthquakes, similar to the 1896Sanriku earthquake, the 1933 Sanriku earthquake, and the Com-pound Offshore Miyagi prefecture earthquake, respectively, nearIwate and Miyagi prefectures.
community shelters had been built at such low sites based onthe hazard map.
However, it is worth noting that the forecast of the offshoreMiyagi prefecture earthquake encouraged the local residentsto reinforce their houses in advance against strong groundmotions. Statistics are not available on how many houseswere reinforced for the earthquake countermeasure; however,the percentage of damaged buildings is low in the Tohokuarea where the seismic intensity reached VI+ on the JMAscale (VIII or higher on the MM scale)6.
4.4 Nearby breakwaters
Local residents thought that breakwaters and seawalls wouldprevent a tsunami from coming onshore in the coastal area ofTohoku before the 2011 Great East Japan Earthquake. How-ever, the tsunami heights in 2011 exceeded almost all break-waters, as shown in Fig. 1e. 60 % of breakwaters in Iwate pre-
fecture were damaged or destroyed by the tsunami (the Iwateprefecture office10). In bay and headland areas of Iwateprefecture, the inundation areas estimated prior to the 2011tsunami are similar to those observed for the 2011 tsunaminear the bases of hills and mountains. Despite the tsunamihazard maps, some people assumed that nearby breakwaterscould protect their areas from the tsunami or, at worst, thatthe tsunami would only cause small floods. Others decided tostay at home and move to the second floor for protection froma high tsunami wave. This is partly due to the low estimatedtsunami heights published as a part of hazard maps before2011 (Fig. 1e). The estimated fatalities for the six cities forscenario earthquakes are very small compared to a result ofthe 2011 tsunami (1/10–1/20). These estimates involve sev-eral scenarios that include the effects of the vulnerability ofbreakwaters due to strong shaking, the season and the time ittakes for residents to evacuate. We adopted a case similar tothe situation in 2011. In reality, local residents were not veryfamiliar with the tsunami hazard maps, but they were awareof the locations of evacuation centers.
Another example is Kamaishi, where a large breakwaterwas constructed at a depth of 60 m in the mouth of Kamaishibay (Fig. 2c). The breakwater office of the Ministry of Land,Infrastructure, Transport and Tourism (MILT) indicated thatthe breakwater would reduce the tsunami height to 0.6 m,even for the tsunami of the 1896 earthquake14. The pres-ident of an ironworks company felt the unusual shaking andheard the announcement regarding the expected 3 m tsunamiheight. Based on this information, he allowed his employ-ees to return home immediately because he thought that thebreakwater near the mouth of the bay would prevent thetsunami from coming onshore. However, the tsunami reacheda height of 10 m in the area. The president of the factory saidthat if the tsunami warning had been more accurate and if theefficacy of the breakwater had been correctly assessed andpublicized, he would never have sent his employees home.Instead, they could have evacuated together to the nearbyhighlands immediately behind the factory.
4.5 Distance from the shore
We found a remarkable difference in the evacuation be-haviours of the interviewees depending on the distance fromthe coast, even within the same city. In general, residents nearthe sea or shore were well prepared against tsunamis and li-able to rapidly evacuate after the earthquake compared withthose who lived inland a small distance from the sea (400–500 m).
To understand more about the evacuation behaviours ofthe tsunami survivors, we focused our interview in Rikuzen-Takada city. The city is located in the southernmost partof the Iwate prefecture, which is divided into 8 administra-tive subdivisions. Among them, we focused on the Takada(Fig. 2e) and Hirota (Fig. 2f) subdivisions, where the tsunamiaffected almost over the entire districts with a height of
Nat. Hazards Earth Syst. Sci., 13, 2173–2187, 2013 www.nat-hazards-earth-syst-sci.net/13/2173/2013/
M. Ando et al.: Interviewing insights 2185
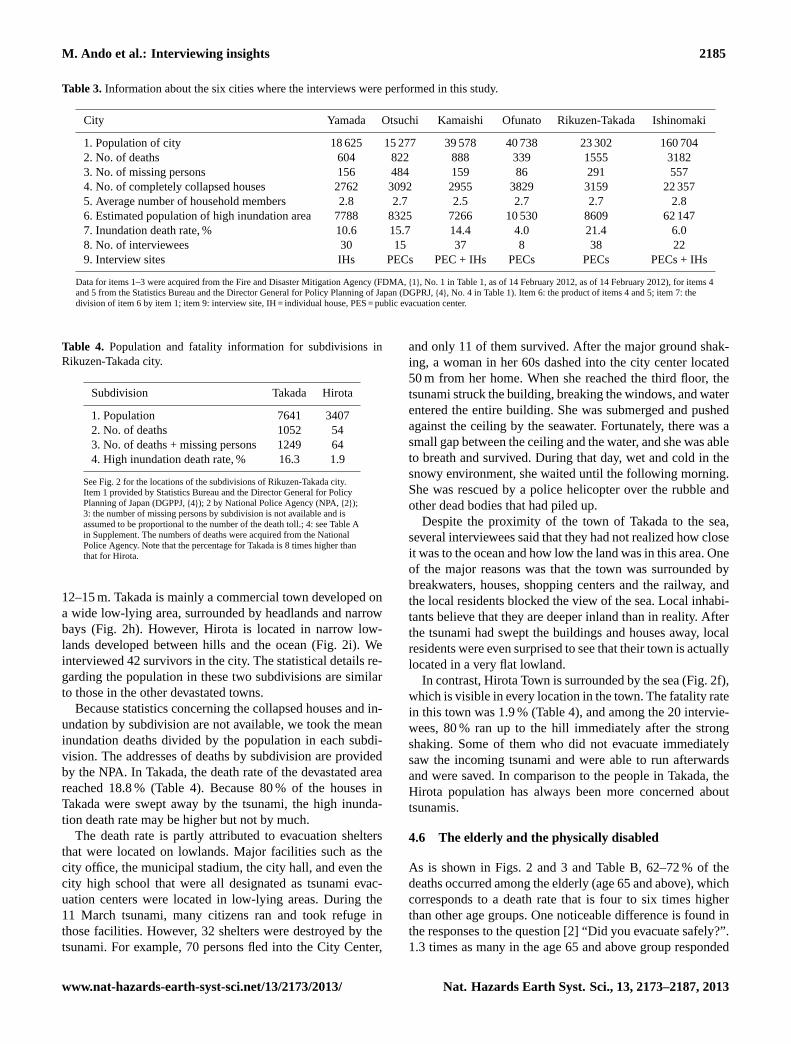
Table 3. Information about the six cities where the interviews were performed in this study.
City Yamada Otsuchi Kamaishi Ofunato Rikuzen-Takada Ishinomaki
1. Population of city 18 625 15 277 39 578 40 738 23 302 160 7042. No. of deaths 604 822 888 339 1555 31823. No. of missing persons 156 484 159 86 291 5574. No. of completely collapsed houses 2762 3092 2955 3829 3159 22 3575. Average number of household members 2.8 2.7 2.5 2.7 2.7 2.86. Estimated population of high inundation area 7788 8325 7266 10 530 8609 62 1477. Inundation death rate, % 10.6 15.7 14.4 4.0 21.4 6.08. No. of interviewees 30 15 37 8 38 229. Interview sites IHs PECs PEC + IHs PECs PECs PECs + IHs
Data for items 1–3 were acquired from the Fire and Disaster Mitigation Agency (FDMA,1, No. 1 in Table 1, as of 14 February 2012, as of 14 February 2012), for items 4and 5 from the Statistics Bureau and the Director General for Policy Planning of Japan (DGPRJ,4, No. 4 in Table 1). Item 6: the product of items 4 and 5; item 7: thedivision of item 6 by item 1; item 9: interview site, IH = individual house, PES = public evacuation center.
Table 4. Population and fatality information for subdivisions inRikuzen-Takada city.
Subdivision Takada Hirota
1. Population 7641 34072. No. of deaths 1052 543. No. of deaths + missing persons 1249 644. High inundation death rate, % 16.3 1.9
See Fig. 2 for the locations of the subdivisions of Rikuzen-Takada city.Item 1 provided by Statistics Bureau and the Director General for PolicyPlanning of Japan (DGPPJ,4); 2 by National Police Agency (NPA,2);3: the number of missing persons by subdivision is not available and isassumed to be proportional to the number of the death toll.; 4: see Table Ain Supplement. The numbers of deaths were acquired from the NationalPolice Agency. Note that the percentage for Takada is 8 times higher thanthat for Hirota.
12–15 m. Takada is mainly a commercial town developed ona wide low-lying area, surrounded by headlands and narrowbays (Fig. 2h). However, Hirota is located in narrow low-lands developed between hills and the ocean (Fig. 2i). Weinterviewed 42 survivors in the city. The statistical details re-garding the population in these two subdivisions are similarto those in the other devastated towns.
Because statistics concerning the collapsed houses and in-undation by subdivision are not available, we took the meaninundation deaths divided by the population in each subdi-vision. The addresses of deaths by subdivision are providedby the NPA. In Takada, the death rate of the devastated areareached 18.8 % (Table 4). Because 80 % of the houses inTakada were swept away by the tsunami, the high inunda-tion death rate may be higher but not by much.
The death rate is partly attributed to evacuation sheltersthat were located on lowlands. Major facilities such as thecity office, the municipal stadium, the city hall, and even thecity high school that were all designated as tsunami evac-uation centers were located in low-lying areas. During the11 March tsunami, many citizens ran and took refuge inthose facilities. However, 32 shelters were destroyed by thetsunami. For example, 70 persons fled into the City Center,
and only 11 of them survived. After the major ground shak-ing, a woman in her 60s dashed into the city center located50 m from her home. When she reached the third floor, thetsunami struck the building, breaking the windows, and waterentered the entire building. She was submerged and pushedagainst the ceiling by the seawater. Fortunately, there was asmall gap between the ceiling and the water, and she was ableto breath and survived. During that day, wet and cold in thesnowy environment, she waited until the following morning.She was rescued by a police helicopter over the rubble andother dead bodies that had piled up.
Despite the proximity of the town of Takada to the sea,several interviewees said that they had not realized how closeit was to the ocean and how low the land was in this area. Oneof the major reasons was that the town was surrounded bybreakwaters, houses, shopping centers and the railway, andthe local residents blocked the view of the sea. Local inhabi-tants believe that they are deeper inland than in reality. Afterthe tsunami had swept the buildings and houses away, localresidents were even surprised to see that their town is actuallylocated in a very flat lowland.
In contrast, Hirota Town is surrounded by the sea (Fig. 2f),which is visible in every location in the town. The fatality ratein this town was 1.9 % (Table 4), and among the 20 intervie-wees, 80 % ran up to the hill immediately after the strongshaking. Some of them who did not evacuate immediatelysaw the incoming tsunami and were able to run afterwardsand were saved. In comparison to the people in Takada, theHirota population has always been more concerned abouttsunamis.
4.6 The elderly and the physically disabled
As is shown in Figs. 2 and 3 and Table B, 62–72 % of thedeaths occurred among the elderly (age 65 and above), whichcorresponds to a death rate that is four to six times higherthan other age groups. One noticeable difference is found inthe responses to the question [2] “Did you evacuate safely?”.1.3 times as many in the age 65 and above group responded
www.nat-hazards-earth-syst-sci.net/13/2173/2013/ Nat. Hazards Earth Syst. Sci., 13, 2173–2187, 2013
2186 M. Ando et al.: Interviewing insights
with “Very risky, chased by tsunami” as those in youngergroups (Fig. 5). The difference between the two groups wasnot very large, but it may have been critical to the seniorgroup. A man in his 30s described how he ran up along ahill with his parents, chased by the tsunami. His parents hadinitially followed him, but after a short time, he looked backand observed that his mother had disappeared. His familydid not evacuate immediately; they had spent some time athome before evacuating. There are a number of reasons thatpeople delayed their evacuation, and such delays may haveseriously endangered in particular the elderly who needed alonger time than the younger generations to evacuate to highlands. This might cause the significantly high death rate withthe age 65 and above.
16 % of those in the age 65 and above group requirelong-term care in Iwate and Miyagi prefectures, accordingto statistics from 2011 provided by the Ministry of Health,Labor and Welfare. In the area, 33 % of the population is age65 and above. Therefore, at least 5 % of the population re-quires care or has mobility problems. We found that when anelderly member of a family is bedridden, a spouse or childoften remained at home, even during the earthquake. Thismay have increased the death rate and cannot be solved by abetter warning system or by tsunami drills. Among the inun-dation population in Iwate and Miyagi prefectures (635 000),the deaths of those age 65 and above is 7693 resulting in thedeath rate of 1.2 % according to Tani (2012). This impliesthat at least 76 % of population with mobility problems inthe age 65 and above group were rescued, which should beconsidered when further analysing how to reduce deaths ofthe elderly.
4.7 Knowledge of tsunami
Although 17 % of the interviewees evacuated under danger-ous conditions and 5 % were swept by the tsunami, it wasfortunate that 95–97 % of the total population survived thetsunami in the extremely high tsunami inundation (Table A inSupplement). Comparing the fatality rate (11–27 % in Aceh)associated with the 2004 Sumatra tsunami (Dooce et al.,2007), it is very low. This result was possible because mostpeople knew that tsunamis can occur after earthquakes in To-hoku. Furthermore, throughout our survey, we observed thatmost interviewees knew their assigned emergency evacua-tion sites. The knowledge of the local residents concerningtsunamis made the death rate significantly low, even in theextremely high tsunami inundation areas. Most of the resi-dents had participated in tsunami drills at schools, and somejoined annual drills on memorial days held in their commu-nities. However, many interviewees did not join drills be-cause of their business or a decrease in interest in tsunamiswith time. The interviewees above 55 yr of age rememberedthe tsunami following theMw = 9.5 1960 Chile earthquake.Over time, they said they became insensitive to tsunamis and
did not maintain their interest in tsunami measures for a longtime.
We recognized throughout the survey that most people didnot understand how a tsunami is created under the sea. There-fore, the relation between earthquakes and tsunamis is notclearly linked. An important issue during tsunamis to savelives is to “evacuate to higher and safe places immediatelyafter a big earthquake”. It is a sufficient rule and is the mostbasic tool for local residents to survive tsunamis. However,it is difficult to sustain such a simple rule for tens or hun-dreds of years from generation to generation. It is necessaryfor the population to learn a simple mechanism of the gen-eration of a tsunami in elementary school, especially as chil-dren have fresh minds. Although it requires time, this edu-cation is essential to ensure proper action during a tsunamiin any location. Tsunami disaster education has been con-ducted at numerous places by many groups and institutions(e.g. Kamaishi city16; the Committee on the Review of theTsunami Warning and Forecast System and Overview, USAgovernment17)
5 Conclusions
These interviews indicated that many deaths resulted becausecurrent technology did not properly function, earthquake sci-ence underestimated the earthquake size and tsunami heights,warning systems failed, and breakwaters produced a falsesense of security. The advanced technology did not workproperly, especially at the time of the severe disaster. If res-idents had taken an immediate action after the major shak-ing stopped, most local residents might have been saved be-cause highlands and safer grounds are within 5–20 min onfoot from the interviewed tsunami-affected areas, althoughthe elderly and physically handicapped people would still bein a much more difficult situation. Nevertheless, even if theseproblems occur in future earthquakes, better knowledge re-garding earthquakes and tsunami hazards could save morelives. People must take immediate action and identify loca-tions that are higher than the designated evacuation sites,while encouraging others to evacuate and not spend timesearching for others, regardless of any official tsunami warn-ing. Such basic and simple knowledge can lead local resi-dents to evacuate sooner, enabling more people to survive atsunami even if warning systems or other technology cannotfunction at all. To avoid similar high tsunami death ratiosin the future, residents, including young children, should betaught the basic mechanism of tsunami generation.
Supplementary material related to this article isavailable online at:http://www.nat-hazards-earth-syst-sci.net/13/2173/2013/nhess-13-2173-2013-supplement.pdf.
Nat. Hazards Earth Syst. Sci., 13, 2173–2187, 2013 www.nat-hazards-earth-syst-sci.net/13/2173/2013/
M. Ando et al.: Interviewing insights 2187
Acknowledgements.Many survivors agreed to be intervieweddespite facing hardships at the evacuation shelters. We thank B. At-water and R. Stein for their constructive comments and suggestionsfor improving the manuscript. We thank S. Yoshioka, C.-H. Lin andG. O. Besana for their helpful discussions and encouragement. Wethank N. Matta, N. Sugito, Y. Ohta, Y. Tanaka, and M. Takahashifor providing data. We are also grateful for the assistance providedby S. Kitamura, Y. Aono and Y. Tahiro. Tsunami inundation areamaps were drawn using the data provided by the Tsunami DamageMapping Team, Association of Japanese Geographers. Figureswere plotted using the GMT software. This study was initiated aTohoku-oki earthquake research project organized by the ResearchCenter for Urban and Safety and Security (RCUSS) at KobeUniversity. The RCUSS supported part of our travel expenses. Thisstudy was supported by a grant (NSC 101-2116-M-001-037) fromthe National Science Council of Taiwan.
Edited by: T. GladeReviewed by: R. Stein and B. F. Atwater
References
Abe, K.: Quantification of historical tsunamis by the Mt Scale, Zisin(Journal of the Seismological Society of Japan), 2nd Series, 52,369–377, 1999 (in Japanese with English abstract and figure cap-tions).
Ando, M., Ishida, M., Hayashi, Y., and Mizuki, C.: Interviews withsurvivors of Tohoku Earthquake provide insights into fatalityrate, EOS T. Am. Geophys. Un., 92, 411–412, 2011.
Doocy, S., Gorokhovich, Y., Burnham, G., Balk, D., and Courtland,R.: Tsunami Mortality Estimates and Vulnerability Mapping inAceh, Indonesia, Am J. Public Health, 97 (Suppl. 1), S146–S151,doi:10.2105/AJPH.2006.095240, 2007.
Fujii,Y., Satake, K., Sakai, S., Shinohara, M., and Kanazawa, T.:Tsunami source of the 2011 off the Pacific coast of Tohoku Earth-quake, Earth Planets Space, 63, 815–820, 2011.
Hatori, T.: Propagation of tsunamis from sources off the Pacificcoast of northeast Japan, Bulletin of the Earthquake Research In-stitute, Tokyo University, Tokyo, 51, 197–207, 1976 (in Japanesewith English abstract and figure captions).
Hoshiba, M., Iwakiri, K., Hayashimoto, N., Shimoyama, T., Hirano,K., Yamada, Y., Ishigaki, Y., and Kikuta, H.: Outline of the 2011off the Pacific coast of Tohoku earthquake (Mw9.0) – Earthquakeearly warning and observed seismic intensity, Earth Planet Space,63, 547–551, doi:10.5047/eps.2011.05.031, 2011.
Ide, S., Baltay, A., and Beroza, G. C.: Shallow dynamic overshootand energetic deep rupture in the 2011Mw9.0 Tohoku-Oki earth-quake, Science, 332, 1426–1429, doi:10.1126/science.1207020,2011.
Kanamori, H.: Seismological evidence for a lithosperic normalfaulting – The Sanriku earthquake of 1933, Phys. Earth Planet.In., 4, 289–300, 1971.
Kanamori, H.: Mechanism of tsunami earthquakes, Phys. EarthPlanet. In., 6, 346–359, 1972.
Koketsu, K., Yokota, Y., Nishimura, N., Yagi, Y., Miyazaki, S.,Satake, K., Fujii, Y., Miyake, H., Sakai, S., Yamanaka, Y.,and Okada, T.: A unified source model for the 2011 To-hokuearthquake, Earth Planet. Sc. Lett., 310, 480–487, 2011.
Lay, T., Ammon, C. J., Kanamori, H., Lian Xue, and Kim, M. J.:Possible large near-trench slip during the 2011Mw9.0 off the Pa-cific coast of Tohoku Earthquake, Earth Planets Space, 63, 687–692, 2011.
Lee, S.-J., Huang, B.-S., Ando, M., Chiu, H.-C., and Wang, J.-H.: Evidence of large scale repeating slip during the 2011Tohoku-Oki earthquake, Geophys. Res. Lett., 38, L19306,doi:10.1029/ 2011GL049580, 2011.
Minoura, K., Mamura, F., Sugawara, D., and Kono, Y.: The 869Jogan tsunami deposit and recurrence interval of large-scaletsunami on the Pacific coast of northeast Japan, J. Natural Disas-ter Science, 23, 83–88, 2001.
Mori, N., Takahashi, T., Yasuda, T., and Yanagisawa, H.: Sur-vey of 2011 Tohoku earthquake tsunami inundation and run-up,Geophys. Res. Lett., 38, L00G14, doi:10.1029/2011GL049210,2011.
Ohta, Y., Kobayashi, T., Tsushima, H., Miura, S., Hino, R., Takasu,T., Fujimoto, H., Iinuma, T., Tachibana, K., Demachi, T., Sato,T., and Ohzono, M.: Quasi real-time fault model estimation fornear-field tsunami forecasting based on RTK-GPS analysis: Ap-plication to the 2011 Tohoku-Oki earthquake (Mw 9.0), J. Geo-phys. Res., 117, B02311, doi:10.1029/2011JB008750, 2012.
Ozawa, S., Nishimura, T., Suito, H., Kobayashi, T., Tobita, M.,and Imakiire, T.: Coseismic and postseismic slip of the 2011maginutde-9 Tohoku-Oki earthquake, Nature, 475, 373–376,doi:10.1038/nature10227, 2011.
Sato, M., Ishikawa, T., Ujihara, U., Yoshida, S., Fujita, M.,Mochizuki, M. and Asada, A.: Displacement above the hypocen-ter of the 2011 Tohoku-Oki earthquake, Science, 332, p. 1395,doi:10.1126/science.1207401, 2011.
Sawai, Y., Okamura, Y., Shishikura, M., Matsumura, T., Aung, T.T., Komatsubara, J., and Fujii, Y.: Historical tsunamis recordedin deposits beneath Sendai Plain – Inundation areas of the A.D.1611 Keicho and A.D. 869 Jogan tsunamis, Chisitsu News, 624,34–31, 2006 (in Japanese with English abstract).
Sawai, Y., Namegaya, Y., Okamura, Y., Satake, K., and Shishikura,M.: Challenges of anticipating the 2011 Tohoku earthquake andtsunami using coastal geology, Geophys. Res. Lett., 39, L21309,doi:10.1029/2012GL053692, 2012.
Simons, M., Minson, S. E. , Sladen, A., Ortega, F., Jiang, J., Owen,S. E., Meng, L., Ampuero, J.-P., Wei, S., Chu, R., Helmberger, D.V., Kanamori, H., Hetland, E., Moore, A. W., and Webb, F. H.:The 2011 magnitude 9.0 Tohoku-Oki earthquake: Mosaickingthe megathrust from seconds to centuries, Science, 322, 1421–1425, doi:10.1126/science.1206731, 2011.
Tani, K.: Distribution of the death tolls and the death rate on theGreat East Japan Earthquake, Occasional Paper of Dept. Ge-ography, Saitama Univ., Saitama, Japan, 32, 1–26, 2012 (inJapanese).
Usami, T.: Materials for Comprehensive List of Destructive Earth-quakes in Japan, Univ. of Tokyo Press, Tokyo, [416]–2001, 605pp., 2003 (in Japanese).
Yamashita, F.: Fare of tsunamis-Transmission of Sanriku tsunamitales, Tohoku Univ. Press, Sendai, Japan, 2005 (in Japanese).
www.nat-hazards-earth-syst-sci.net/13/2173/2013/ Nat. Hazards Earth Syst. Sci., 13, 2173–2187, 2013