intra-industry trade in europe - european...
TRANSCRIPT
IntraIntra-Industry Trade in Europe-Industry Trade in Europe
Lionel Lionel FontagnéFontagné
Paris School of Economics, Paris School of Economics, UniversitéUniversité Paris 1 & CEPII Paris 1 & CEPII

MotivationMotivationSimultaneous exports and imports within industries betweencountries of similar development levelsOne of the most important empirical finding of the 1960sconcerning international trade.Initially observed for the Benelux customs union.Thereafter for the 6 founding members of the EECThen for the Single European MarketVerdoorn, 1960, Drèze, 1960, Balassa, 1966, Grubel, 1967,Fontagné et al. (1998)Concentration of trade flows within industries rather than betweenindustries : a recurrent pattern of the process of EuropeanintegrationWhat does it mean for policy making?What is the contemporary evidence?

Outline of the talkOutline of the talk
IntroductionRelated literatureMethodologyMain resultsConclusion

Prevalence of IIT even using disaggregated classifications ofproducts– Traditional theory of trade questioned.– New Trade Theory: IIT in horizontally differentiated products
Synthesis by Helpman and Krugman, 1985– IIT between similar countries– Inter-industry trade between different countries– … or due to agglomeration economies– "Love of Variety” versus specialisation in industries
Workhorse: gravity model (Bergstrand, 1990, Anderson & vanWincoop, 2004). Explaining trade volumes a.w.a. trade patterns– Share of IIT in bilateral trade is a decreasing function of
differences in capital-labour endowment ratios
Introduction
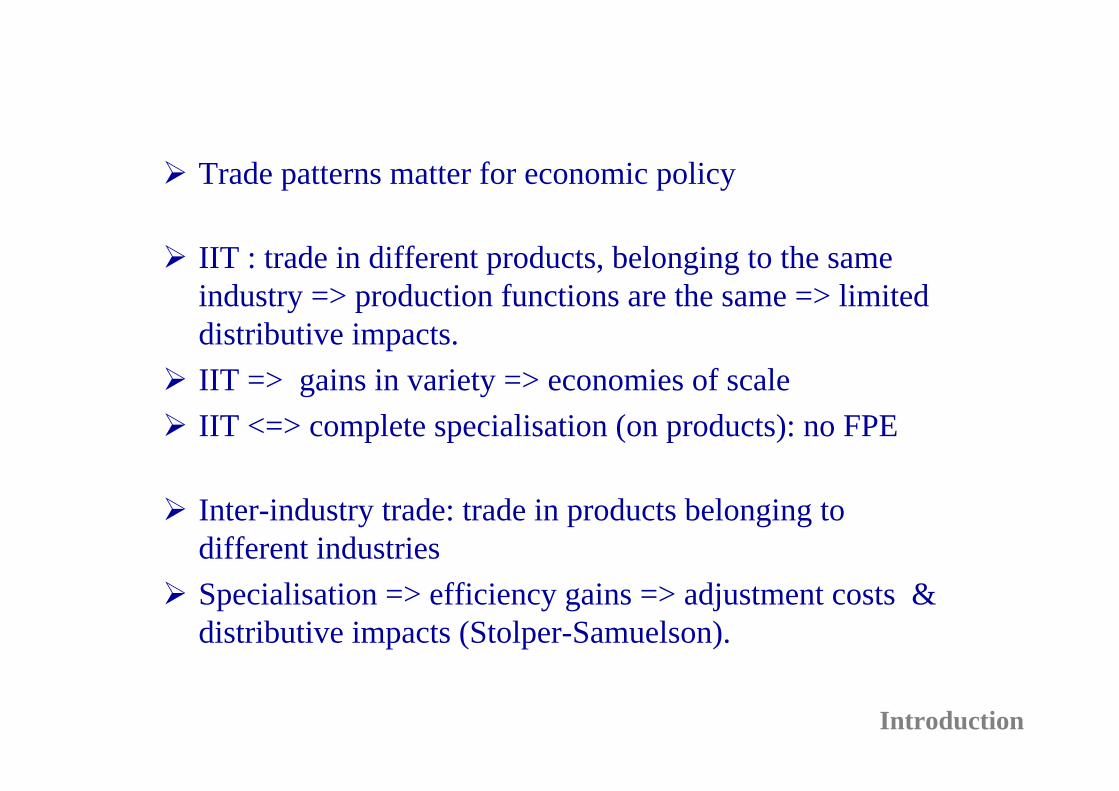
Trade patterns matter for economic policy
IIT : trade in different products, belonging to the sameindustry => production functions are the same => limiteddistributive impacts.IIT => gains in variety => economies of scaleIIT <=> complete specialisation (on products): no FPE
Inter-industry trade: trade in products belonging todifferent industriesSpecialisation => efficiency gains => adjustment costs &distributive impacts (Stolper-Samuelson).
Introduction

EU integration: large gains and limited pains.Specialisation and asymmetries within the monetary union– If Single market encourages IIT, "one market" is
complementary to "one money”– Monetary integration impacts i)transaction costs
2)agglomeration 3)trade patterns– Endogeneity of asymmetries– Structural asymmetries between member states reduced
("Mechanism 13" of the Emerson Report, 1990).Conclusions challenged by studies looking at the completionof the Single market.Prevalence of IIT-V– Specialisation in vertically diff. varieties within industries– Trade does overlap in products having different unit
values. Introduction
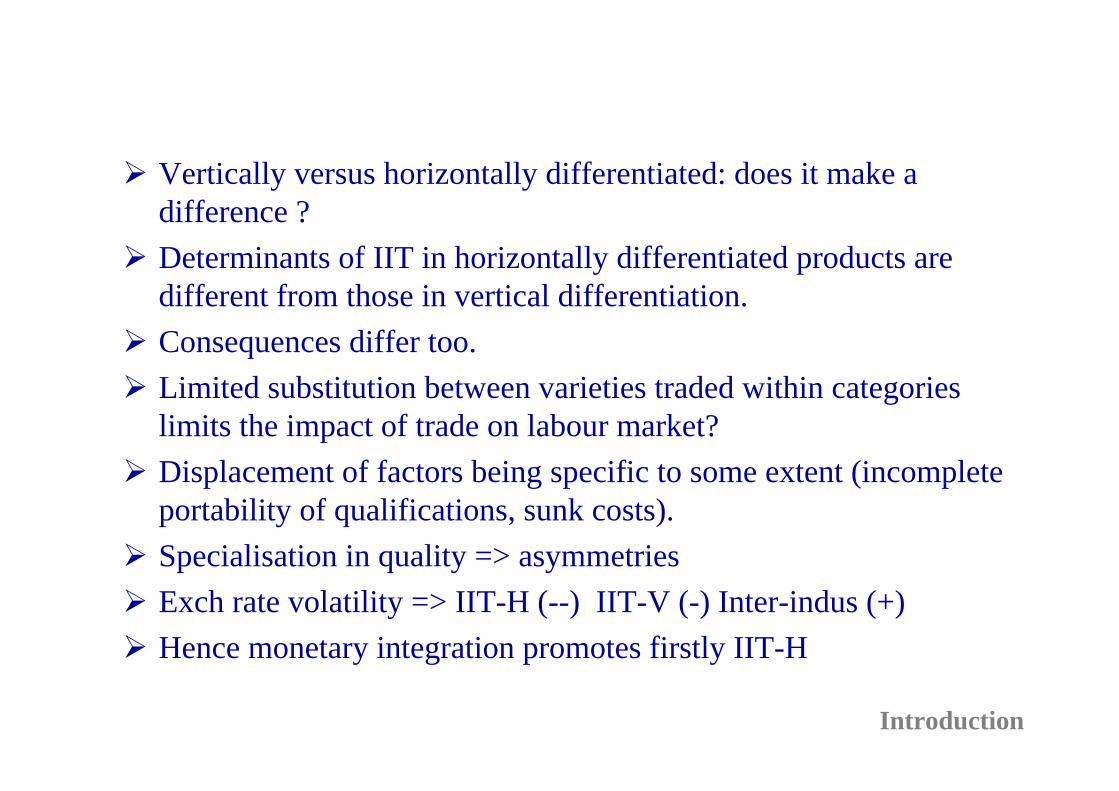
Vertically versus horizontally differentiated: does it make adifference ?Determinants of IIT in horizontally differentiated products aredifferent from those in vertical differentiation.Consequences differ too.Limited substitution between varieties traded within categorieslimits the impact of trade on labour market?Displacement of factors being specific to some extent (incompleteportability of qualifications, sunk costs).Specialisation in quality => asymmetriesExch rate volatility => IIT-H (--) IIT-V (-) Inter-indus (+)Hence monetary integration promotes firstly IIT-H
Introduction

Related literatureRelated literature
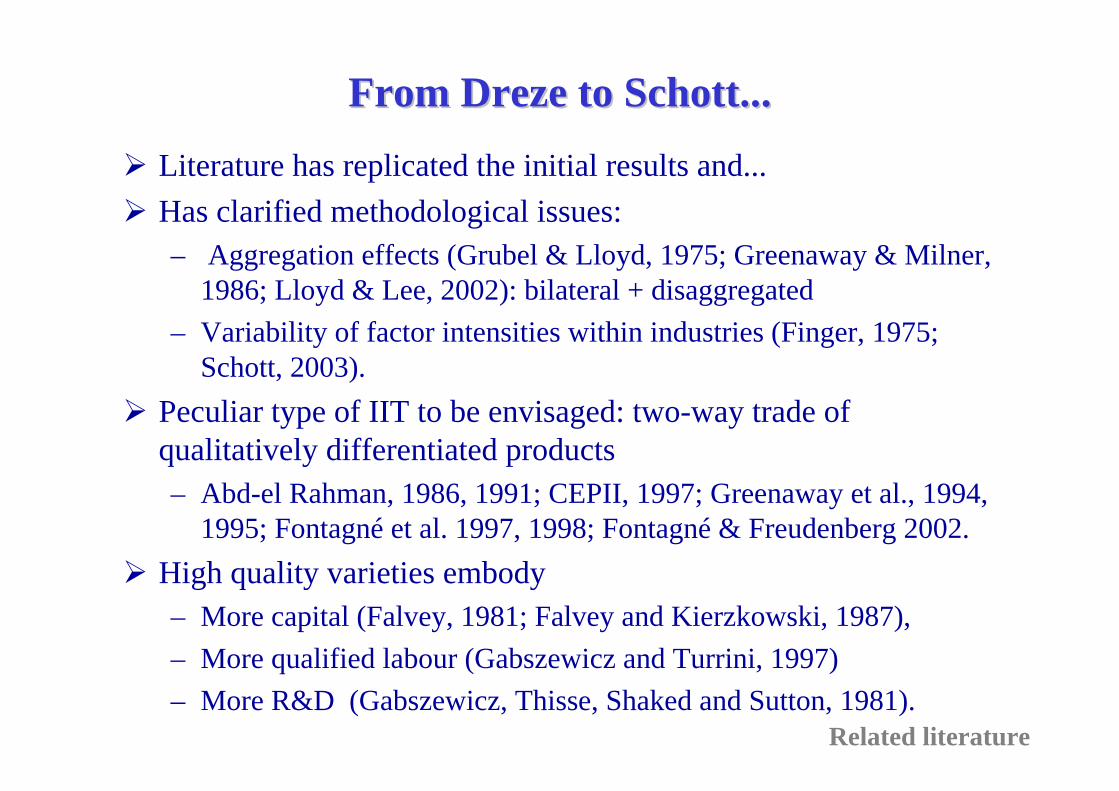
From From Dreze Dreze to to SchottSchott......Literature has replicated the initial results and...Has clarified methodological issues:– Aggregation effects (Grubel & Lloyd, 1975; Greenaway & Milner,
1986; Lloyd & Lee, 2002): bilateral + disaggregated– Variability of factor intensities within industries (Finger, 1975;
Schott, 2003).Peculiar type of IIT to be envisaged: two-way trade ofqualitatively differentiated products– Abd-el Rahman, 1986, 1991; CEPII, 1997; Greenaway et al., 1994,
1995; Fontagné et al. 1997, 1998; Fontagné & Freudenberg 2002.High quality varieties embody– More capital (Falvey, 1981; Falvey and Kierzkowski, 1987),– More qualified labour (Gabszewicz and Turrini, 1997)– More R&D (Gabszewicz, Thisse, Shaked and Sutton, 1981).
Related literature

… Matches new approaches: varieties + … Matches new approaches: varieties + vertvert..diffdiff° + ° + multimulti-product heterogeneous firms-product heterogeneous firmsSystematic finding of trade literature: considerable variation inunit values (UV) of traded products at the most detailed levelof product classification.Japanese (UV) 1.43 times higher than for Brazil, 1.86 timeshigher than for India, and 2.86 times higher than for China.For the same products, shipped to the same markets, within thesame year (2004).Evidence of a specialisation of countries within products andacross varieties. Schott (2004)At the most detailed level of classification, UV of imports ofUS-Japan and the EU is a function of GDP per cap of exporter(Fontagné, Gaulier, Zignago 2007).
Related literature

Median relative unit values (2004)Median relative unit values (2004)
Brazil China Japan Russia India USA EU25 Oth.Em.Brazil . 0.81 1.43 1.00 0.96 1.16 1.48 1.04China 1.23 . 2.86 1.17 1.25 2.44 3.06 1.43Japan 0.70 0.35 . 0.75 0.54 1.00 1.08 0.70Russia 1.00 0.85 1.34 . 1.13 1.26 1.36 1.08India 1.04 0.80 1.86 0.89 . 1.58 2.05 1.07USA 0.86 0.41 1.00 0.79 0.63 . 1.12 0.81EU25 0.68 0.33 0.92 0.73 0.49 0.90 . 0.57Oth. Em 0.96 0.70 1.43 0.92 0.93 1.23 1.77 .
Motivation
Note: Median of relative unit values of country A (in column) and B (in line)across common HS6 positions and geographical destinations of exports.Source: Fontagné, Gaulier & Zignago. (2007)
Related literature

Motivation
Share of up-market varieties, in US imports from eachShare of up-market varieties, in US imports from eachexporter, by development level (GDP per capita relative toexporter, by development level (GDP per capita relative to
the US) of the exporter.the US) of the exporter.
Related literature
UV of exports is a function of GDP per capUV of exports is a function of GDP per cap
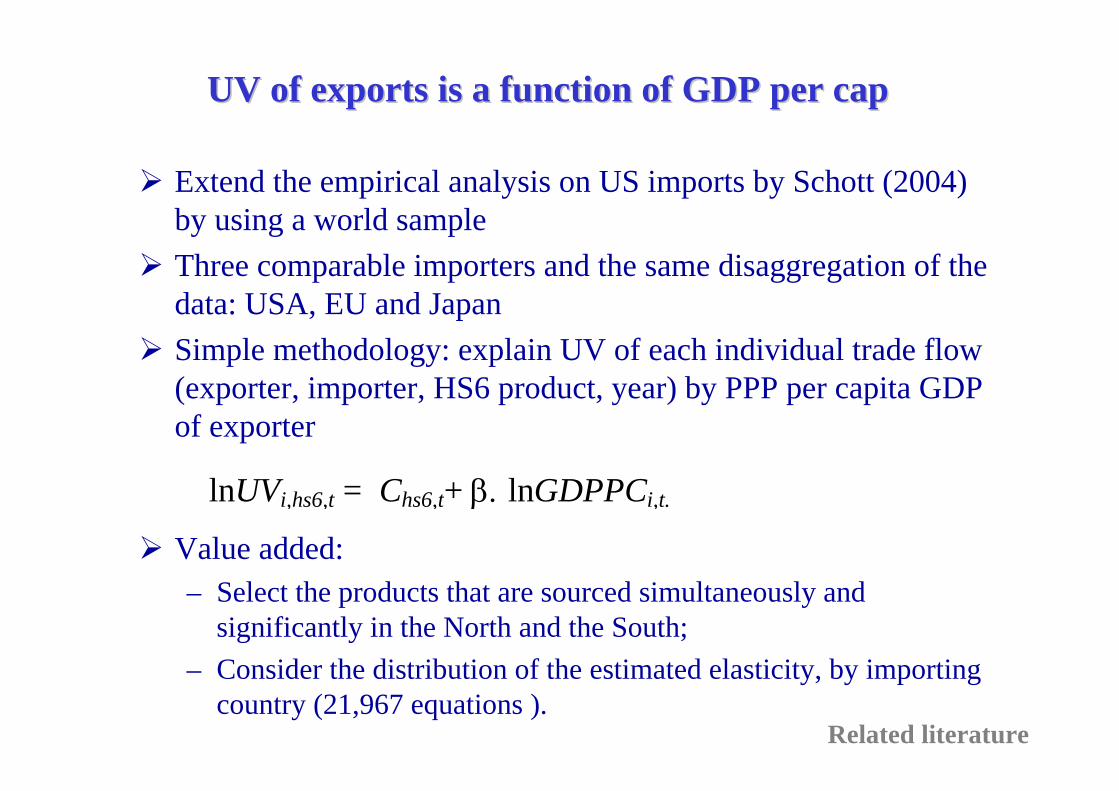
Extend the empirical analysis on US imports by Schott (2004)by using a world sampleThree comparable importers and the same disaggregation of thedata: USA, EU and JapanSimple methodology: explain UV of each individual trade flow(exporter, importer, HS6 product, year) by PPP per capita GDPof exporter
Value added:– Select the products that are sourced simultaneously and
significantly in the North and the South;– Consider the distribution of the estimated elasticity, by importing
country (21,967 equations ).
lnUVi,hs6,t = Chs6,t+ β. lnGDPPCi,t.
Results
Related literature

Impact of the level of development of the exporting country onImpact of the level of development of the exporting country onthe UV of products imported by the EU, Japan and USAthe UV of products imported by the EU, Japan and USA
(pooled data)(pooled data)
Importer: Estimatedparameter
standarderror
t R² N F
US 0.378 0.002 182.41 0.0484 653,633 33,274Japan 0.429 0.002 191.79 0.0796 425,242 36,782EU (*) 0.352 0.001 501.37 0.0635 3,710,189 251,377
Results
Source: Fontagné, Gaulier & Zignago. (2007)
Related literature

MethodologyMethodology

Greenaway, Hine and Milner (GHM 1994, 1995) furtherdecompose a Grubel and Lloyd (G&L) index.Fontagné and Freudenberg (FF 1997, 1998) categorise tradeflows and compute the share of each category in total trade.Both methods rely on the same assumption regarding theassociation of price (unit values ) with the quality of tradedproducts.Bilateral trade at the product (HS6, NC8) levelThreshold on relative unit values (+ - 15% / 25%)GHM: the balanced part of a bilateral trade flow is consideredas IITThe two shares (resp. GHM-H and GHM-V) sum up to theG&L.
Methodology
Two methods to disentangle horizontal and vertical IITTwo methods to disentangle horizontal and vertical IIT

Men/boys shirts Parts of computers
X_US,ChM_US,Ch M_US,Ch X_US,Ch
Inter-industry
M_US,Ch: Value of US imports from China
X_US,Ch: Value of US exports to China
Methodology
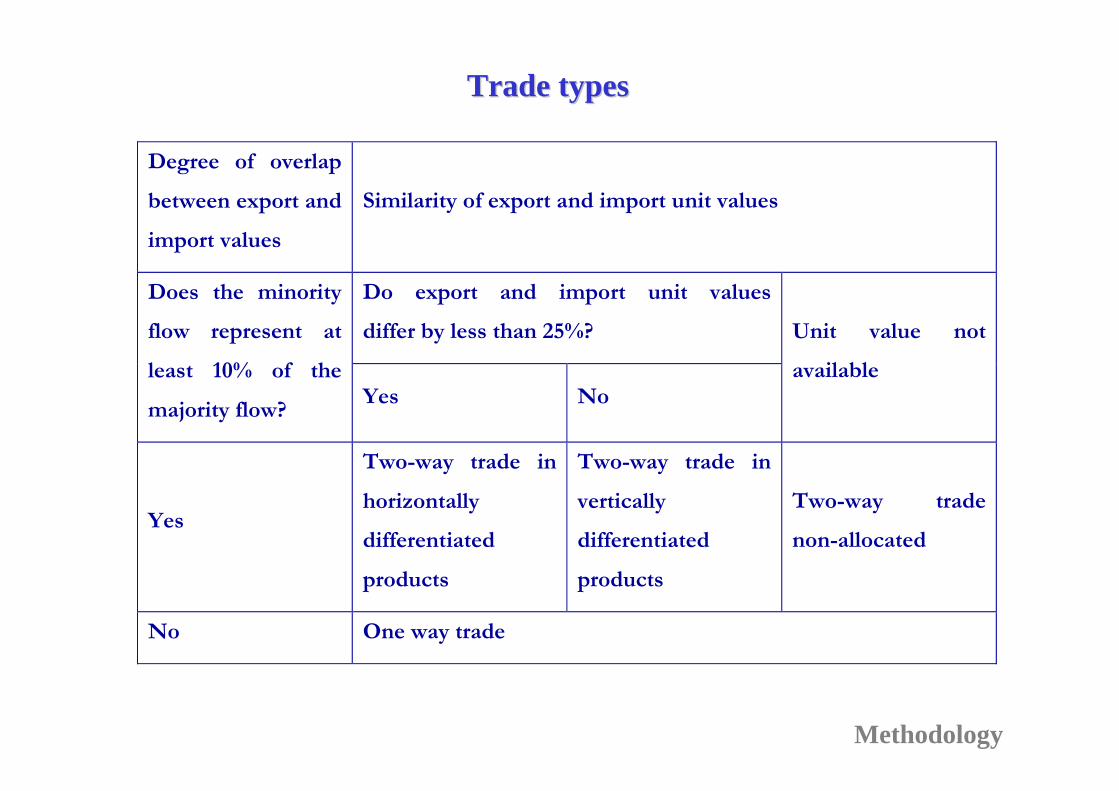
Degree of overlap
between export and
import values
Similarity of export and import unit values
Do export and import unit values
differ by less than 25%?
Does the minority
flow represent at
least 10% of the
majority flow?Yes No
Unit value not
available
Yes
Two-way trade in
horizontally
differentiated
products
Two-way trade in
vertically
differentiated
products
Two-way trade
non-allocated
No One way trade
Methodology
Trade typesTrade types

Comparison between (G&L) and (FF) for country pairs, 2000Comparison between (G&L) and (FF) for country pairs, 2000
Methodology
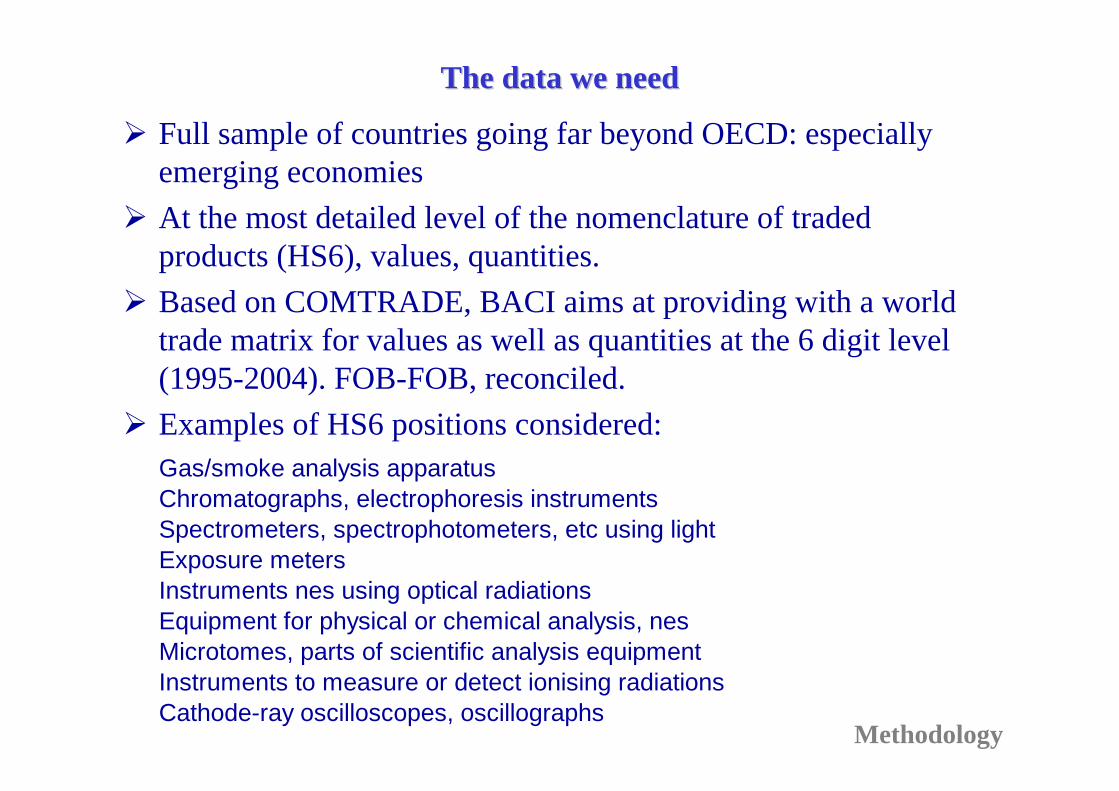
The data we needThe data we need
Full sample of countries going far beyond OECD: especiallyemerging economiesAt the most detailed level of the nomenclature of tradedproducts (HS6), values, quantities.Based on COMTRADE, BACI aims at providing with a worldtrade matrix for values as well as quantities at the 6 digit level(1995-2004). FOB-FOB, reconciled.Examples of HS6 positions considered:Gas/smoke analysis apparatusChromatographs, electrophoresis instrumentsSpectrometers, spectrophotometers, etc using lightExposure metersInstruments nes using optical radiationsEquipment for physical or chemical analysis, nesMicrotomes, parts of scientific analysis equipmentInstruments to measure or detect ionising radiationsCathode-ray oscilloscopes, oscillographs
Methodology

Main resultsMain results

Evolution 1989-2002Evolution 1989-2002of the 3 trade typesof the 3 trade types(% of world trade)(% of world trade)
Results10.0
20.0
30.0
40.0
50.0
60.0
70.0
1989 1990 1991 1992 1993 1994 1995 1996 1997 1998 1999 2000 2001 2002
Inter-Industry Trade
Intra-Industry Trade (vertical)
Intra-Industry Trade (horizontal)
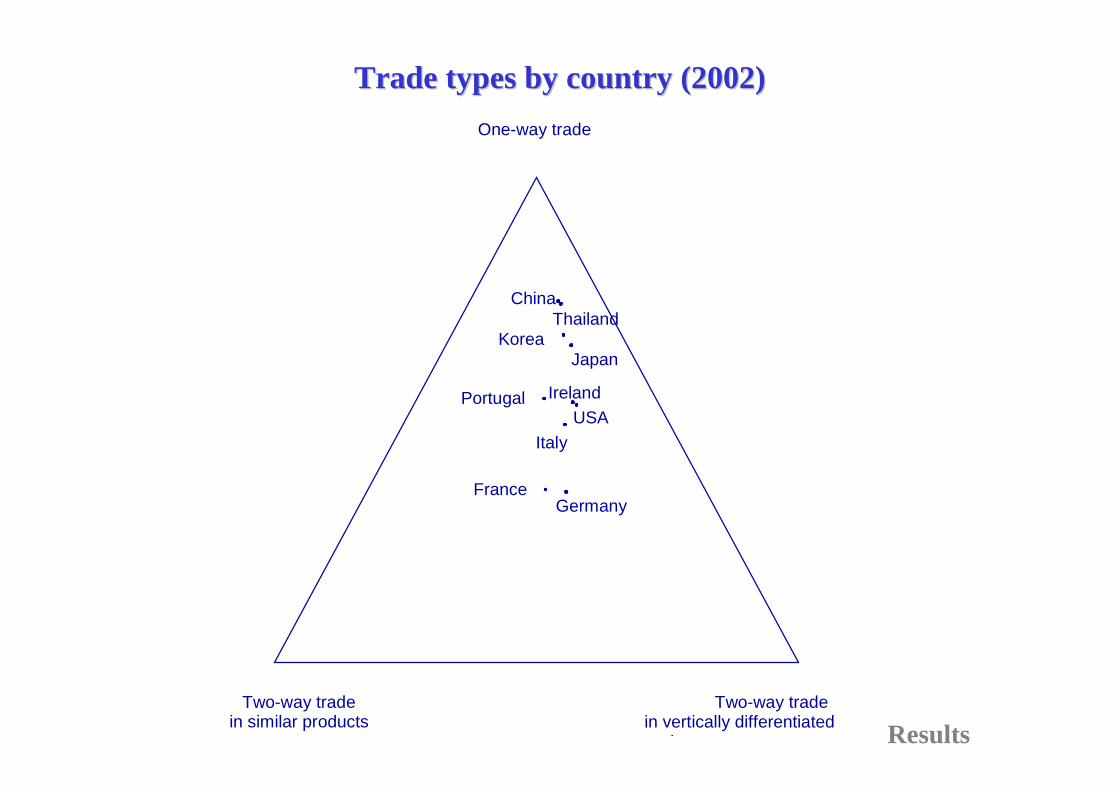
One-way trade
Two-way trade in similar products
Two-way trade in vertically differentiated
d t
China
JapanKorea
Thailand
USA
FranceGermany
Ireland
Italy
Portugal
Trade types by country (2002)Trade types by country (2002)
Results
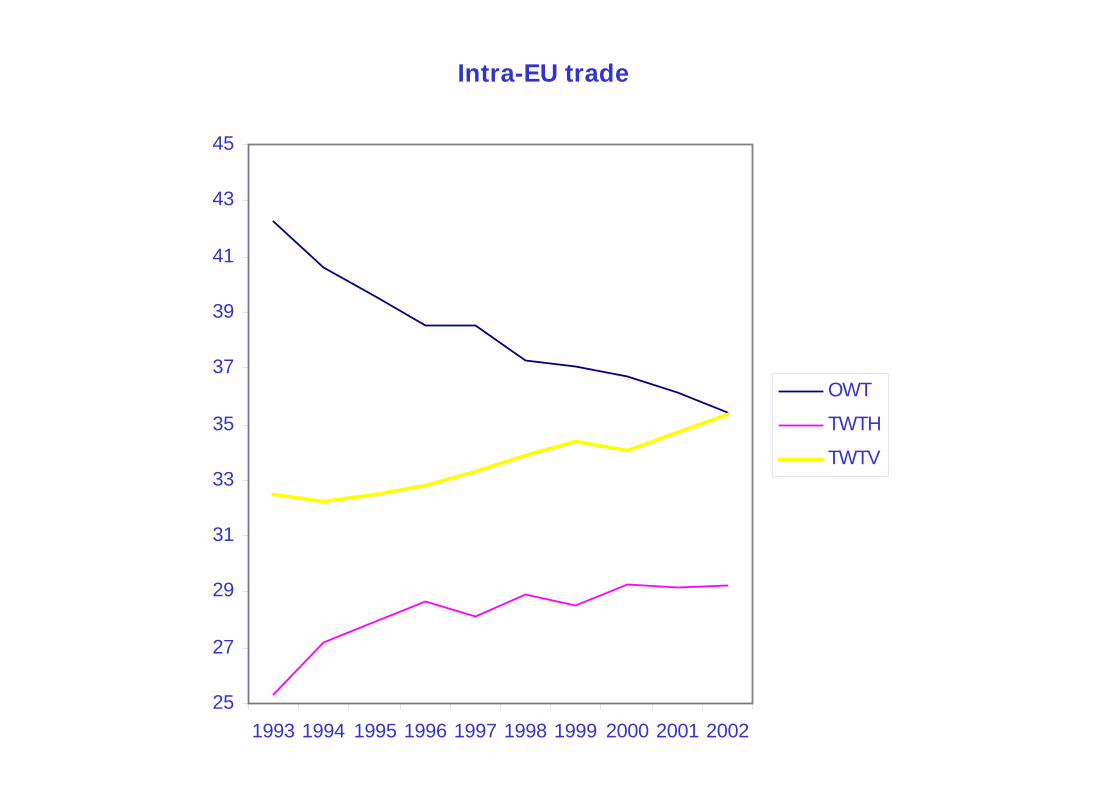
Intra-EU trade
25
27
29
31
33
35
37
39
41
43
45
1993 1994 1995 1996 1997 1998 1999 2000 2001 2002
OWT
TWTH
TWTV

Extra-EU trade
0
10
20
30
40
50
60
70
80
1993 1994 1995 1996 1997 1998 1999 2000 2001 2002
OWTTWTHTWTV

China
0
10
20
30
40
50
60
70
80
90
100
1993
1994
1995
1996
1997
1998
1999
2000
2001
2002
OWT
TWTH
TWTV
EU-China

TheThe worldwide worldwide top ten bilateral IIT relations ranked by top ten bilateral IIT relations ranked byshare and by value, 2000share and by value, 2000
Results
Top total IIT shares ( in %) Top total IIT values (USD million)
Germany France 86.20 USA Canada 130,041
Netherlands Belgium and Lux. 85.01 USA Mexico 68,111
France Belgium and Lux. 80.42 Germany France 49,110
France United Kingdom 77.08 Italy Germany 31,337
Germany Switzerland 76.99 Netherlands Germany 31,163
Germany Belgium and Lux. 76.83 USA Japan 28,442
Austria Germany 76.63 Belgium and Lux. France 28,390
France Spain 76.55 Italy France 27,530
Germany Netherlands 76.01 Belgium and Lux. Germany 27,421
Canada USA 73.55 United Kingdom Germany 24,251

WorldwideWorldwide top ten bilateral IIT-H shares, 2000 (%) top ten bilateral IIT-H shares, 2000 (%)
Results
Country pairs TWT-H TWT-V
France Spain 44.05 32.42
France Germany 43.03 43.15
Belgium and Lux. Netherlands 38.63 46.28
Belgium and Lux. France 38.26 42.10
Belgium and Lux. Germany 35.49 41.28
Austria Germany 34.27 42.31
Germany Netherlands 33.81 42.14
France Italy 33.56 35.18
Germany Spain 31.24 30.11
France United Kingdom 30.79 45.54
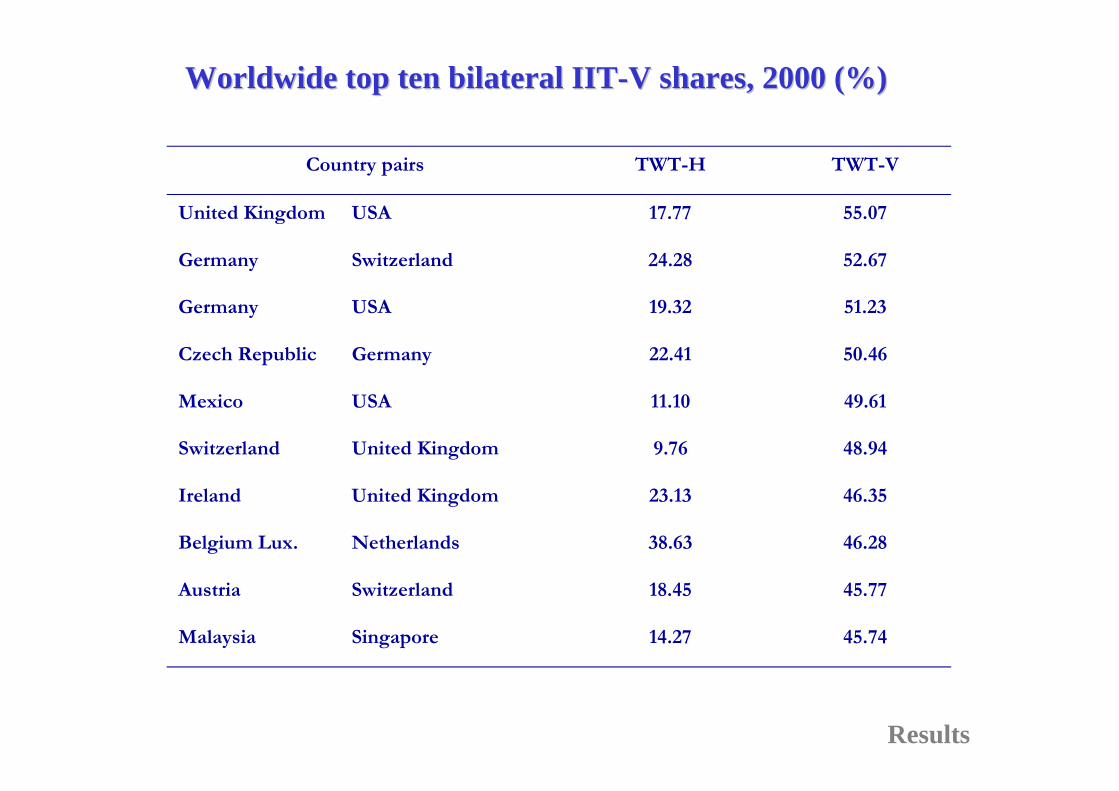
WorldwideWorldwide top ten bilateral IIT-V shares, 2000 (%) top ten bilateral IIT-V shares, 2000 (%)
Results
Country pairs TWT-H TWT-V
United Kingdom USA 17.77 55.07
Germany Switzerland 24.28 52.67
Germany USA 19.32 51.23
Czech Republic Germany 22.41 50.46
Mexico USA 11.10 49.61
Switzerland United Kingdom 9.76 48.94
Ireland United Kingdom 23.13 46.35
Belgium Lux. Netherlands 38.63 46.28
Austria Switzerland 18.45 45.77
Malaysia Singapore 14.27 45.74

ConclusionConclusionNew database, worldwide H6Method FF to disentangle two way trade in horizontally /vertically differentiated productsIIT-V is a peculiar type of specialisationEuropean pairs of Member states characterised by the largestIIT shares in the worldThis is even more true for IIT-HFears of monetary integration leading to asymmetriesexaggeratedThe big issue is now the increasing importance of trade withemerging economies: trade patterns characterised byspecialisation.Stolper-Samuelson make a come-back