intro to bi for management undergrads
TRANSCRIPT

Intro to Business Intelligence
Lunch & Learn with MISADesautels Faculty of Management
@ McGill University 30 October 2013
We’ll cover…
• Intro
• The Data/Analysis spectrum: Visualization – Analytics – BI – Data Mining
• Focus in on Business Intelligence
• BI at McGill
• Time permitting: Industry (Gartner, careers)
Profile: Mike Deutsch
• Education: U. Penn (Philadelphia), 1998.
– Computer Science & Cognitive Science
– (Management @ Wharton)
• 15 years as a Designer/Analyst/Developer in educational environments
• McGill central IT since 2002:
– Student systems (Banner/Minerva/uApply)
– LMS (myCourses)
– Enterprise Data Warehouse & Business Intelligence

Up front
• I strive for accuracy, but facts may not always be exactly as reported.
• All opinions expressed herein are my own, and may not correspond to official University positions on whatever it is I’m talking about.
• McGill BI info is past tense, circa 2008-12.
• BI is a blend of Technology & Business; Keep both hats on.
• Q&A as we go, and at the end.
THE DATA/ANALYSIS SPECTRUM
Viz :: Analytics :: BI :: Mining

The Data/Analysis spectrum
Related fields:
1. Data visualization
2. Analytics
3. Business intelligence
4. Data mining
All are concerned with preparing, presenting, & interpreting data.
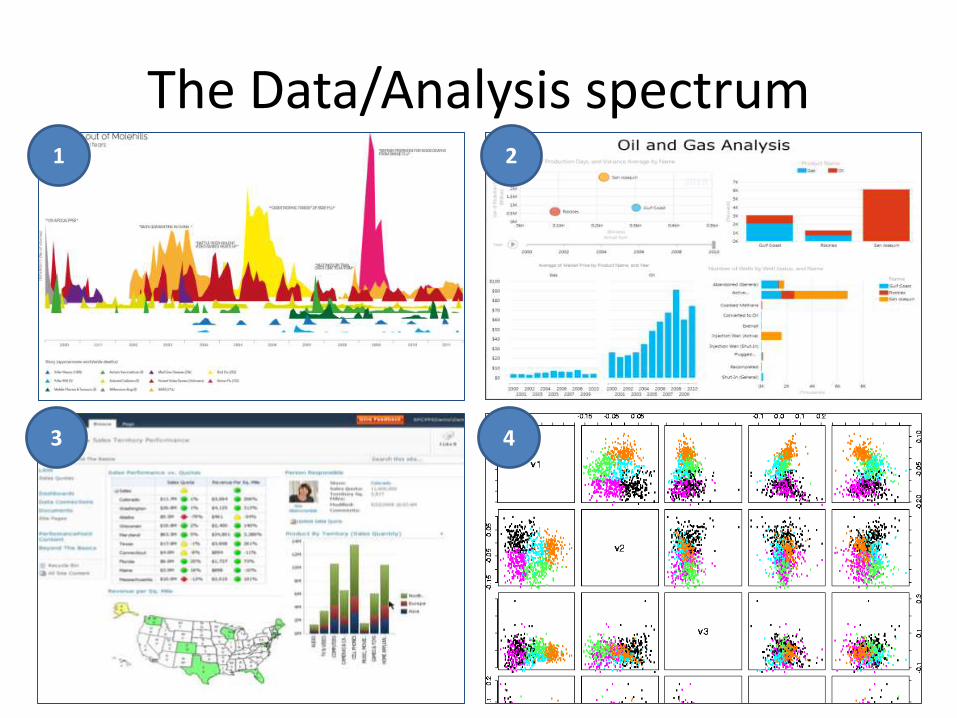
The Data/Analysis spectrum1
3
2
4

Data visualization
• Hand-crafted to tell a story.– Small or hand-picked data (often someone else’s, not yours)– Published: static or lightly interactive– Strikingly presented, very creative, expert designers– “Huh.” or “Wow!” enlightenment
– Source: Information is Beautiful – news hysteria

Analytics
• Interactive, to dig through and discover– Larger data set– Ad hoc pursuit of ideas and questions– Packaged software with common tools: filters, linked
charts/maps, drilling in/across/through– “Ohhhh…” or “That’s strange…” or “I wonder why…” action
– Source: Microsoft BI 2012 demo

Business intelligence
• Consistent and composed, to track and benchmark– Large, well-managed data set for well-managed enterprises
– Composed dashboards & tables showing highlights
– Has packaged Analytic layer + other layers above & below.
– “How are we doing?” “Let’s address that.” performance
• Source: Intellectual Capital Services, Inc.

Data mining
• Automated, to systematically find highlights– Huge data set– Deep statistical analysis – Specialized tools for expert users (produce & consume)– The math identifies significant data for you
– Source: Data Mining in Chemistry and Biotechnology
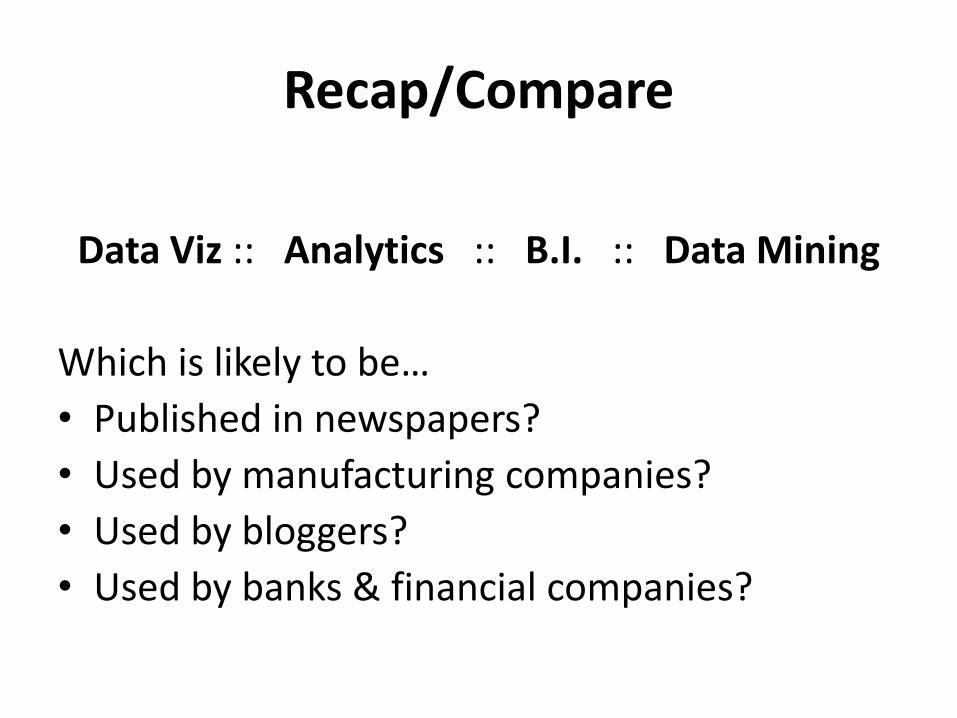
Recap/Compare
Data Viz :: Analytics :: B.I. :: Data Mining
Which is likely to be…
• Published in newspapers?
• Used by manufacturing companies?
• Used by bloggers?
• Used by banks & financial companies?

INTRO TO B.I.
The [what] and [why]
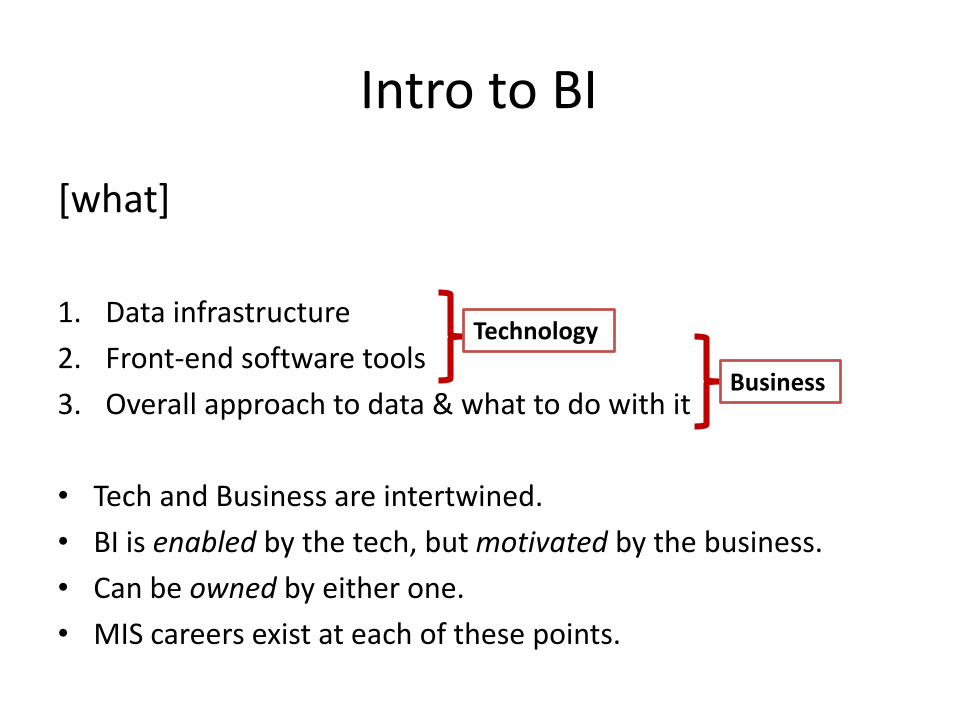
Intro to BI
[what]
1. Data infrastructure
2. Front-end software tools
3. Overall approach to data & what to do with it
• Tech and Business are intertwined.
• BI is enabled by the tech, but motivated by the business.
• Can be owned by either one.
• MIS careers exist at each of these points.
Technology
Business

Intro to BI
[why]
• Organizations use BI to improve & shorten the cycle:
Execute Learn Adjust
• They use their own (and others’) data to investigate, make decisions, and improve their business.
[so on the face of it…]
Intro to BI
Big whoop.
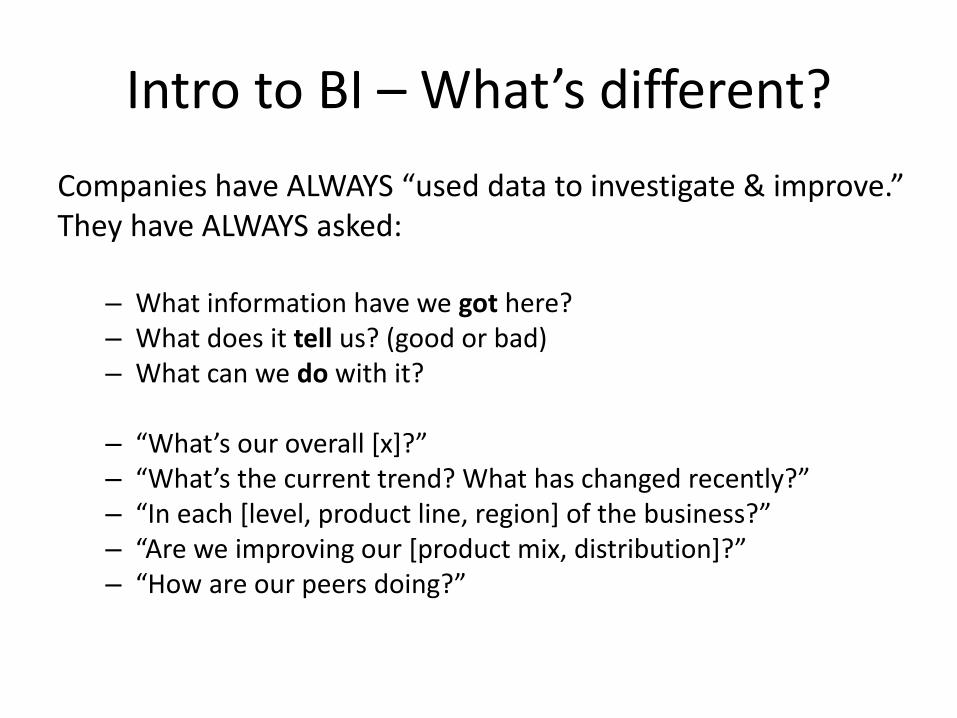
Intro to BI – What’s different?
Companies have ALWAYS “used data to investigate & improve.”They have ALWAYS asked:
– What information have we got here? – What does it tell us? (good or bad)– What can we do with it?
– “What’s our overall [x]?”– “What’s the current trend? What has changed recently?”– “In each [level, product line, region] of the business?”– “Are we improving our [product mix, distribution]?”– “How are our peers doing?”

Intro to BI – What’s different?
But the experience & results are very different.
BI tools offer:
• More effective, faster learning
– Question answer cycle shrinks
– Triggers questions you never thought to ask
• Better distribution throughout the business.
– Allow more people to be analytical
[a visual example: McGill internationalism]
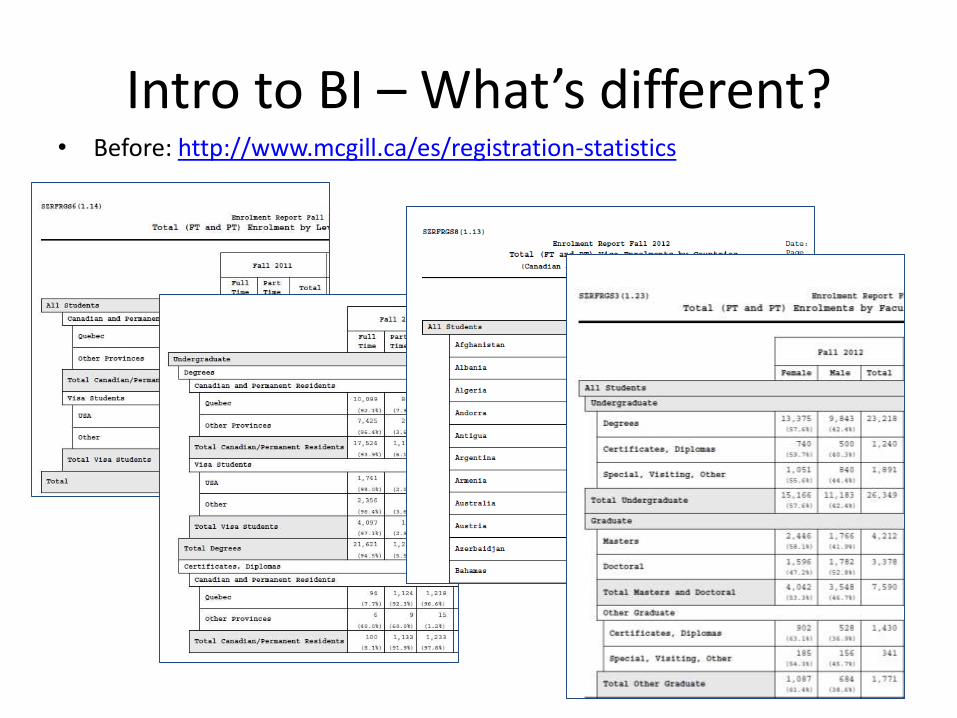
Intro to BI – What’s different?• Before: http://www.mcgill.ca/es/registration-statistics
Intro to BI – What’s different?
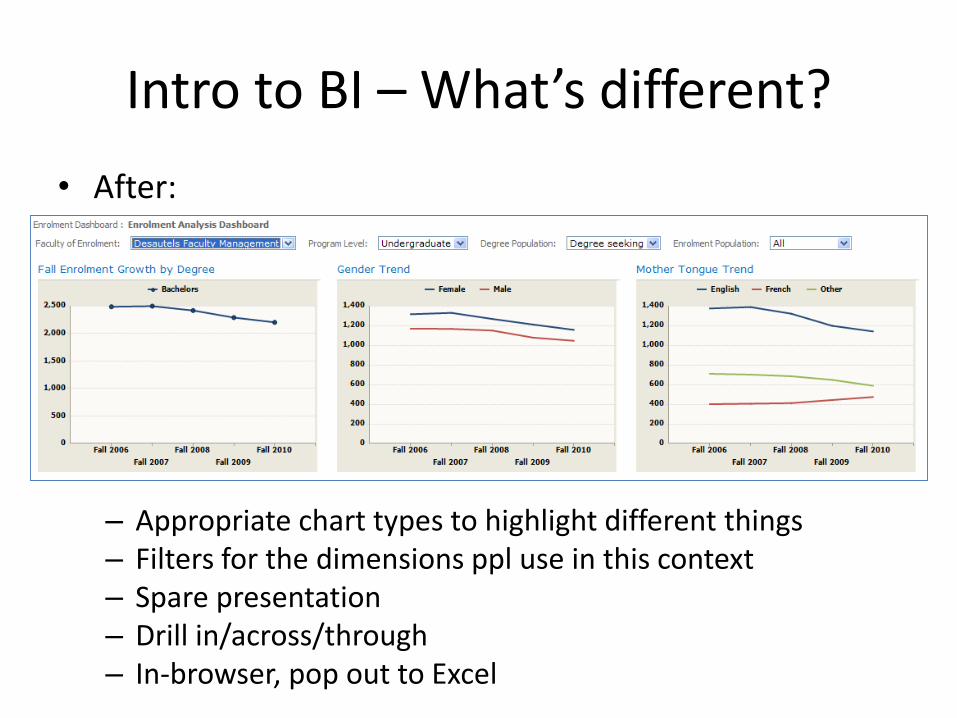
• After:
– Appropriate chart types to highlight different things– Filters for the dimensions ppl use in this context– Spare presentation– Drill in/across/through – In-browser, pop out to Excel
Intro to BI – the Technology
• Design the data for quick & flexible retrieval
– Pre-calculate all combinations of data, from individual records to totals
– Don’t query & compile, just fetch the number.
• Present it through accessible, attractive, interactive tools.
– In-browser, Excel, etc.
– Good data viz so highlights and “stories” pop out.
[the architecture…]

• Tech: data infrastructure + tools on top.
Intro to BI – the Technology
1 – Transactional DBDaily business DATA
recorded
2 – Data WarehouseJoined, prepared, and made easier to
REPORT off of
3 – BI & AnalyticsTheories tested, discoveries made,
ANALYSIS performed
Intro to BI – the Business
• Give it to everyone – democratize your analysis
– IT builds it; users help themselves.
– Common tools.
• Let them explore
– Provide different entry points, formats, paths.
– Expose all levels, all combinations.
– It all reconciles – a “single version of the truth”

Intro to BI – the Business
Who uses BI, and why?
• Executives > Managers > Analysts
– Different skills
– Different questions
– Different preferred “depth” of analysis.
– So, you give them different tools, and expose the data in appropriate ways.

Intro to BI – the Business
Here’s a great example of what it means to a company:
• Mature BI at Proctor & Gamble: [~8:30]

B.I. AT MCGILL

BI at McGill
• Technology
– Oracle transactional + warehouse
– Microsoft BI stack
• Business
– McGill’s company profile
– What our users are after
– What we offer & to whom

BI at McGill
• Is McGill…– Private or Public? Profit or Non-profit?– … an institution, more than a business.
• What is its mission?– "The mission of McGill University is the advancement of learning through (1)
teaching, (2) scholarship and (3) service to society by offering to outstanding undergraduate and graduate students the best education available, by carrying out scholarly activities judged to be excellent when measured against the highest international standards, and by providing service to society in those ways for which we are well suited by virtue of our academic strengths." http://www.mcgill.ca/about/mission/
• Who are its competitors?• What is its external environment?• What is its hierarchy like?

• Central admin: (CXO)– Principal, Provost– Planning & Institutional Analysis– VP-Admin & Finance, SLL, etc.
• Data/Business Area owners: (VPs, Directors, Mgrs)– Enrolment– Academic Management– Graduate studies– Teaching & Learning– Financial, Research, etc.
• End users– Directors, Managers & Analysts, central & academic units
Dash
bo
ards &
Visu
alization
Interactive p
ivot &
drill to
ols
BI at McGill

BI at McGill
We face:
• General organizational/managerial issues
• Issues specific to certain university functions

BI at McGill
General organizational/managerial issues:
• Coordination (across units or functions)– How can we handle interdependencies?– How can we make things operate or “flow” smoothly?– How can we see all different activities on one page for, say:
• An entire Faculty or Department?• A single professor?
• Long-range analysis and planning– How can we bridge from year-to-year “regular business” to real
planning?– How can we identify hidden trends (problems)?
• How can we get people managing analytically?

BI at McGill
• Issues specific to certain university functions:
– How is our mix of: • QC – Canadian – International students?• Undergraduate vs. Graduate vs. Postgrad/ContEd/Special/Other
– What is the trend of: • Growth/decline in student population?• Class size? Popular or unpopular courses and majors?
– What is the biggest:• Department in terms of Research dollars?
– Which units are most effective at:• Graduating their students?• Preventing transfer-outs?
• Doing good teaching?
– MORE???

BI at McGill
• Enrollment dashboard again:
+ Immigration, Fee residence, Admit region, etc.

APPENDICES
Data model :: Gartner quadrant :: Job listings

Data visualization (more)
• Real visualization (our data):– Internet traffic visualization– Netflix rental patterns
• Their data:– Information is Beautiful.net – news hysteria– Montreal BIXI time lapse– Mapnificent real-time transit– Montreal open data
• Infographic renaissance…– I Love Charts – many great examples– Pop Chart Lab (pie) – good “craftsmanship”– Newspaper/magazine infographic (The Onion)
• xkcd– Self-description, Money– Height, Numbers
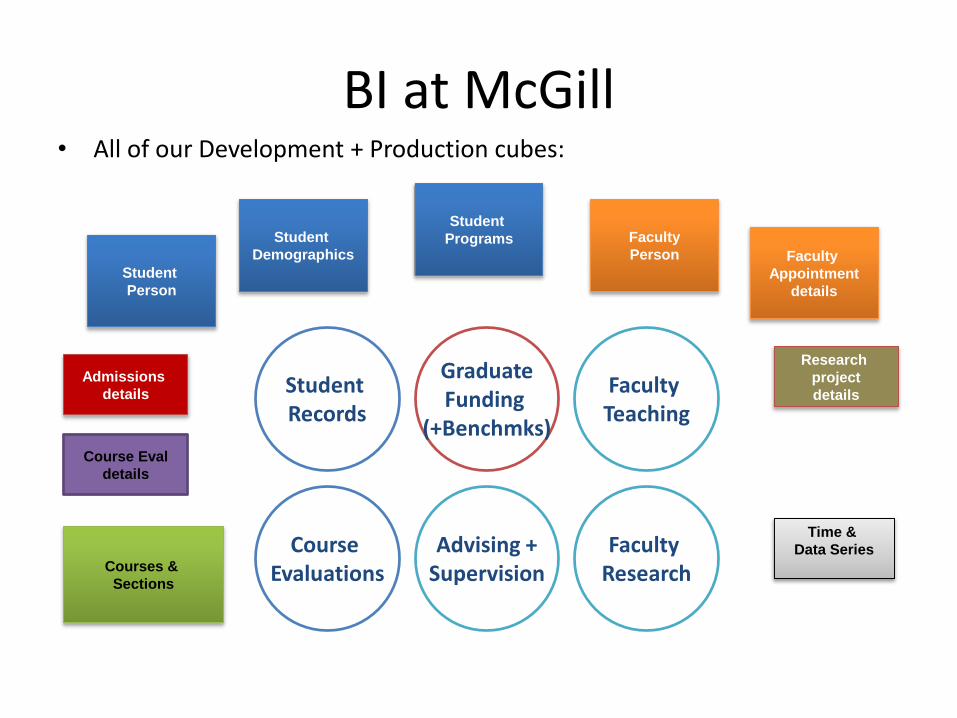
BI at McGill• All of our Development + Production cubes:
Student
Programs
Courses &
Sections
Admissions
details
Time &
Data Series
Student Records
Student
Person
Student
Demographics
Faculty
Person Faculty
Appointment
details
Research
project
details
Course Eval
details
GraduateFunding
(+Benchmks)
Faculty Teaching
Advising +Supervision
Faculty Research
Course Evaluations

• BI vendors, according to Gartner analysts: