intro to computerized investing - aaii silicon valley we are using voice over ip (your computer) for...
TRANSCRIPT
11/9/16 website: siliconvalleyaaii.org 1
American Association of Individual Investors
presents the
Financial Planning Workshop
Intro to Computerized Investing
Al Zmyslowski(A Poor Substitute for Fred Smith)
Email: [email protected]
Webcast details at www.siliconvalleyaaii.org
Legal Disclaimer And Risk Disclosure
11/9/16
These materials are for educational and entertainment purposes only and are
neither a solicitation, nor an offer to buy or sell any financial instrument. All
information provided here is the personal opinion of the authors. The
authors, AAII, AAII-Silicon Valley, AAII-SV-CI-MI Group leaders and
members, make no claim that the information in any of these presentations is
correct. Under no circumstances should any of the information in these
presentations be taken as personal or individual trading advice. Past
performance and/or hypothetical results of any trading method are not
indicative of future results. Trading and investing in any financial instrument
carries high levels of risk and may not be suitable for all investors. You
should be aware of all the risks associated with trading, and seek advice from
a financial professional, if you have any doubts. The authors, AAII, AAII-
Silicon Valley, AAII-SV-CI-MI Group leaders and members, will not assume
any responsibility whatsoever for the actions of the reader nor financial losses
that may result from the use or misuse of the information presented.
2website: siliconvalleyaaii.org

11/9/16
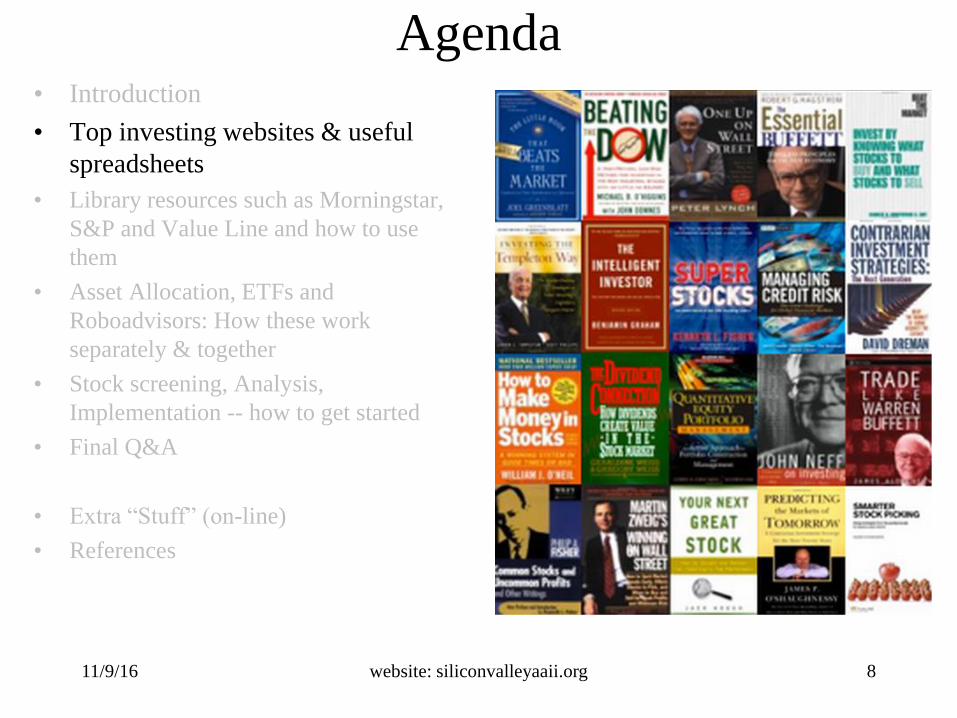
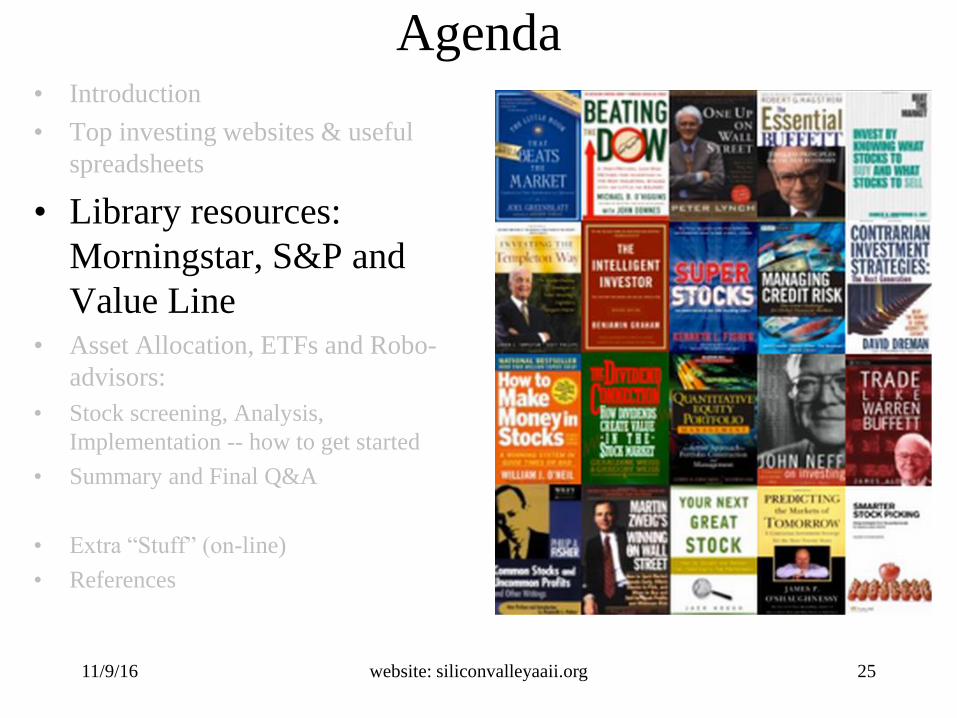
Agenda
• Introduction
• Top investing websites & useful
spreadsheets
• Library resources: Morningstar, S&P
and Value Line
• Asset Allocation with ETFs; Robo-
advisors
• Stock screening, Analysis,
Implementation -- how to get started
• Summary and Final Q&A
• Extra “Stuff” (on-line)
• References (on-line)
website: siliconvalleyaaii.org 3

11/9/16
Agenda• Introduction
– Webinar Intro
– The FPW Series
• Top investing websites & useful
spreadsheets
• Library resources such as Morningstar,
S&P and Value Line
• Asset Allocation, ETFs and
Roboadvisors:
• Stock screening, Analysis,
Implementation -- how to get started
• Final Q&A
• Extra “Stuff” (on-line)
• References
website: siliconvalleyaaii.org 4
Welcome to the Financial
Planning Workshop Series!!
For our web participants we have a few reminders:
• We’ll start the WebEx at 6:45 or so – it’s started if you see these slides!
• You will be muted when you enter the webinar
• We will have several designated Q&A sessions; Webinar Q&A will be via your chat window
• We are using Voice over IP (your computer) for audio. We’ll do a sound check before we start – if you have issues tell us vis chat!
• We will be recording the meeting for reference later
• Trouble?? See the links/info we provided in our earlier emails to you…
These workshops are given at the Los Altos Public Library on the second Wednesday of every month from September 2016 through April 2017. If you're in the area we invite you to stop by and join us in-person. If you're out of area join us via our WebEx session.
11/9/16 website: siliconvalleyaaii.org

Welcome to the Financial
Planning Workshop Series!!
Topics Covered in the FPW Series
Completed
• Fundamentals of Investing
• Building a Diversified Portfolio
Tonight
• Introduction to Computerized Investing
Future Sessions
• Active versus Passive Investing Strategies
• Retirement Planning
• Managing your Cash Flow in Retirement
• Safe Withdrawal Rates from your Retirement Portfolio
• Social Security and Medicare
• Estate Planning
11/9/16 website: siliconvalleyaaii.org

Welcome to the Financial
Planning Workshop Series!!
Topics Covered in FPW3:
Intro to Computerized Investing
• Top investing websites; Some useful
spreadsheets
• Library resources: Morningstar, S&P and
Value Line
• Asset Allocation w/ETFs; Roboadvisors
• Stock screening, Analysis and
Implementation -- how to get started
11/9/16 website: siliconvalleyaaii.org
11/9/16
Agenda• Introduction
• Top investing websites & useful
spreadsheets
• Library resources such as Morningstar,
S&P and Value Line and how to use
them
• Asset Allocation, ETFs and
Roboadvisors: How these work
separately & together
• Stock screening, Analysis,
Implementation -- how to get started
• Final Q&A
• Extra “Stuff” (on-line)
• References
website: siliconvalleyaaii.org 8

11/9/16
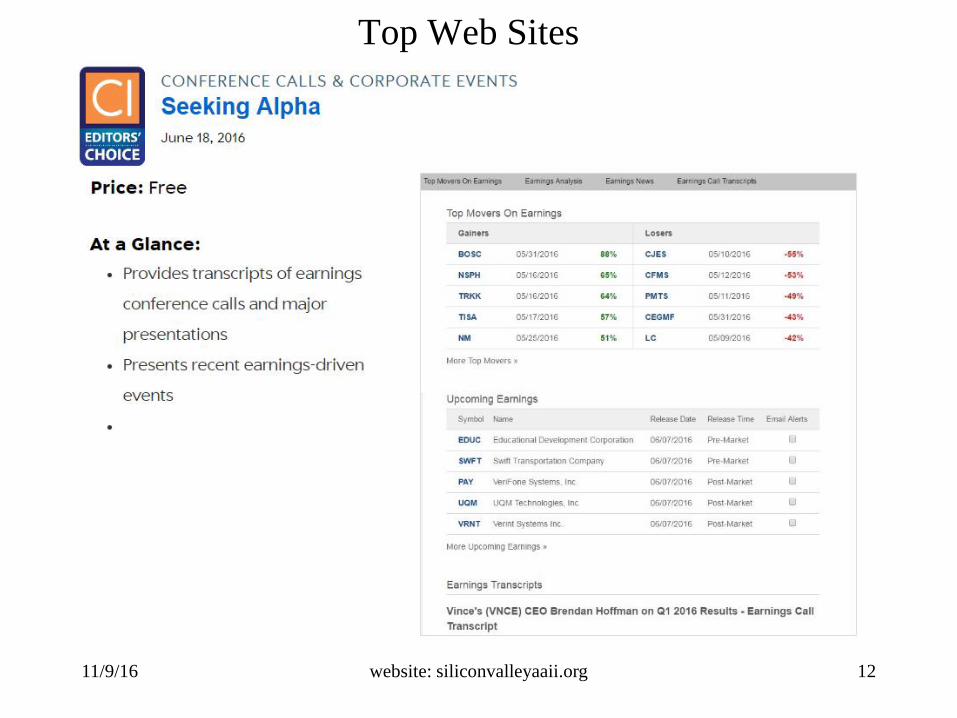
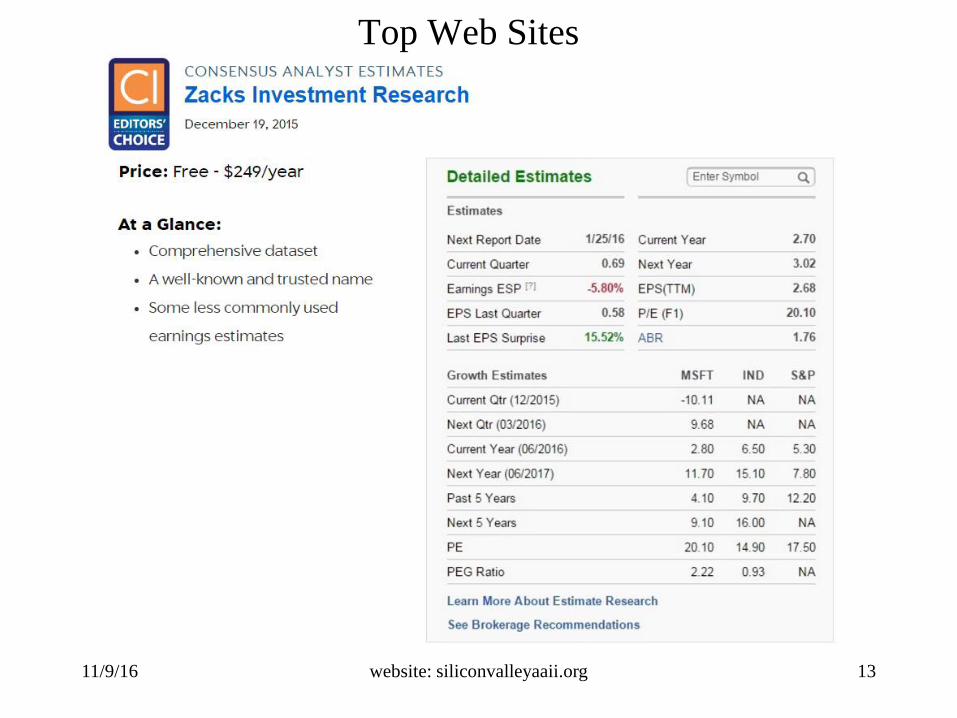
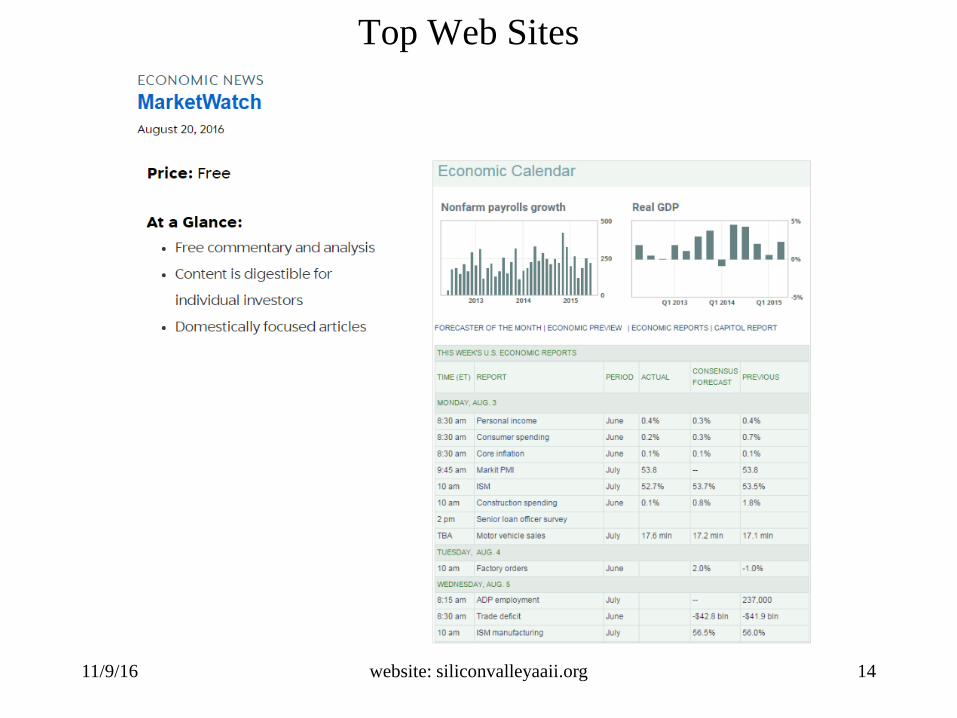
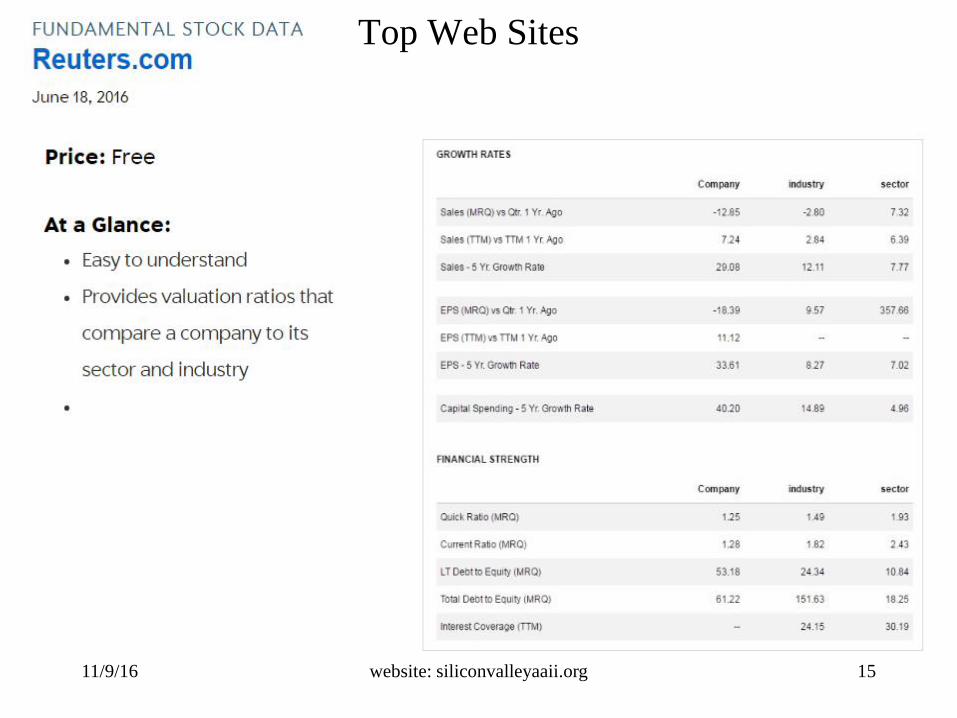
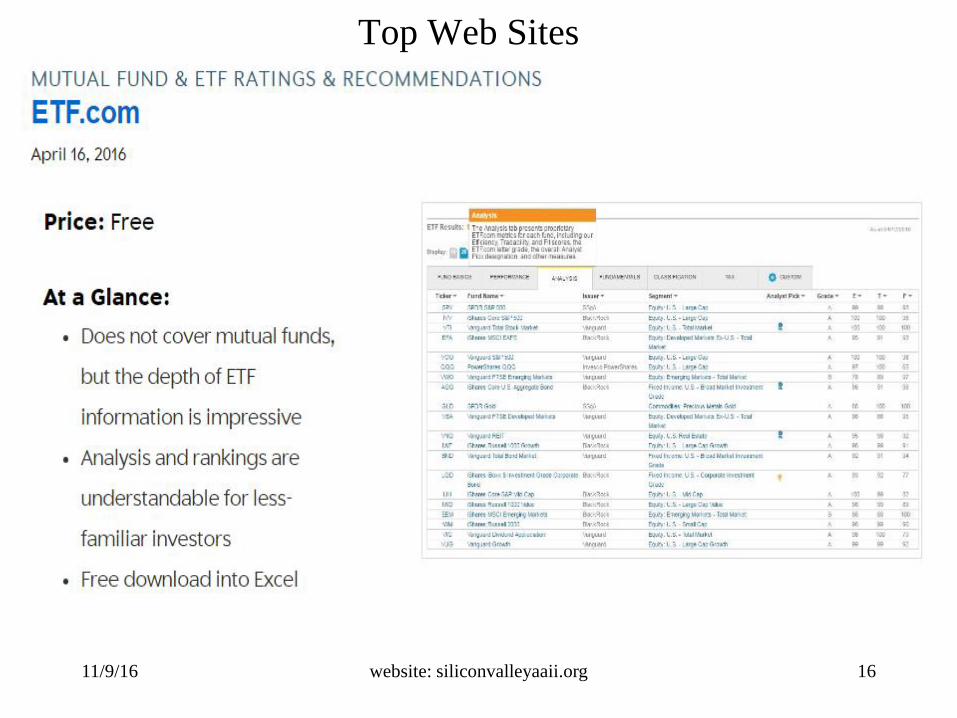
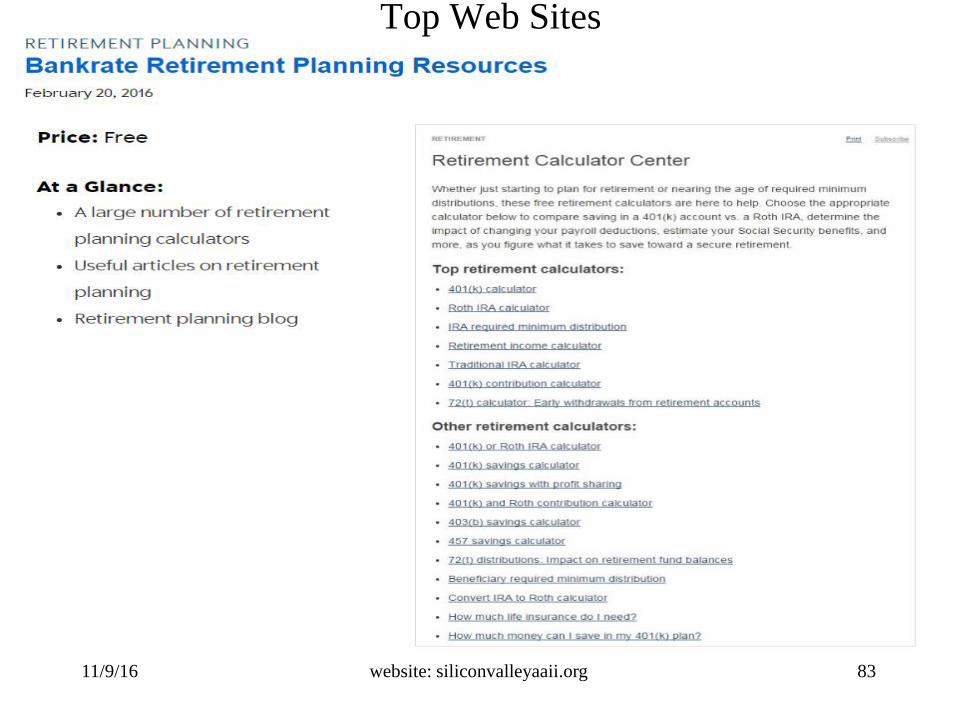
Top Web Sites
website: siliconvalleyaaii.org 9
Goal: Introduce you to sites in various areas and let you try them out
and explore…
• This is a survey course – not a PhD thesis (in-depth, detailed)
Main resource: CI Newsletter “Best of the Web”
• I will feature my favorite site – and maybe provide a top runner-up
• I put priority on free sites (some have fees if you “go premium”)
• Some “winners” I use in a different area than recommended
• Plenty of other contenders out there…
And away we go….

11/9/16
Top Web Sites
website: siliconvalleyaaii.org 10

11/9/16
Top Web Sites
website: siliconvalleyaaii.org 11
11/9/16
Top Web Sites
website: siliconvalleyaaii.org 12
11/9/16
Top Web Sites
website: siliconvalleyaaii.org 13
11/9/16
Top Web Sites
website: siliconvalleyaaii.org 14
11/9/16
Top Web Sites
website: siliconvalleyaaii.org 15
11/9/16
Top Web Sites
website: siliconvalleyaaii.org 16

11/9/16
Top Web Sites
website: siliconvalleyaaii.org 17

11/9/16 website: siliconvalleyaaii.org 18
11/9/16
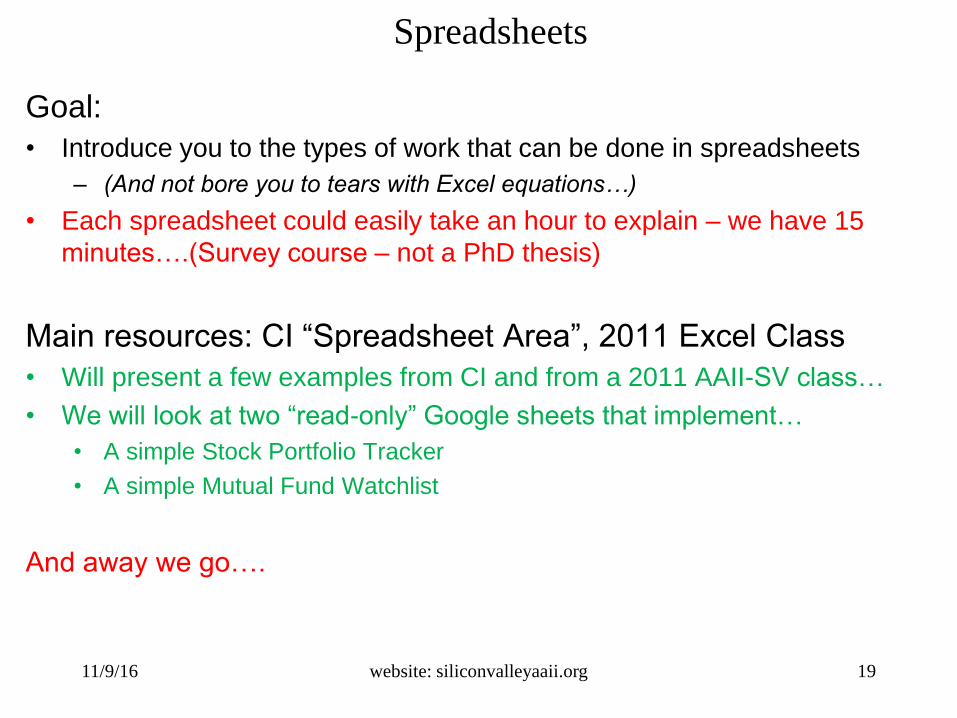
Spreadsheets
website: siliconvalleyaaii.org 19
Goal:
• Introduce you to the types of work that can be done in spreadsheets
– (And not bore you to tears with Excel equations…)
• Each spreadsheet could easily take an hour to explain – we have 15
minutes….(Survey course – not a PhD thesis)
Main resources: CI “Spreadsheet Area”, 2011 Excel Class
• Will present a few examples from CI and from a 2011 AAII-SV class…
• We will look at two “read-only” Google sheets that implement…
• A simple Stock Portfolio Tracker
• A simple Mutual Fund Watchlist
And away we go….

11/9/16
Spreadsheets: Examples from CI Spreadsheet Area
website: siliconvalleyaaii.org 20
• Mortgage Refinance Calculator– A worksheet that helps you see how refinancing your mortgage could affect your cash flow.
• Retirement Withdrawal Calculator– A simple spreadsheet that allows you to input a few estimates and see whether you will have enough
savings to last through your retirement years.
• Financial Ratio Analysis Spreadsheet– Excel spreadsheet automatically derives financial ratios for company analysis after a simple import
of financial statement data from Morningstar.com.
• Deconstructing ROE: DuPont Analysis– How to use two formulas created by DuPont to analyze a firm’s return on equity.
• Calculating Intrinsic Stock Value in Excel– An easy-to-use spreadsheet that allows you to perform independent analysis to determine a stock’s fair
value and see whether it exceeds the market price.
• The Ulcer Index of the AAII Stock Screens– Calculating the downside risk of the stock screening methodologies tracked at AAII.com
• Using a Spreadsheet to Construct Moving Averages– A spreadsheet from AAII for calculating three types of moving averages and generating buy
and sell signals from them
• And many more….
If there’s enough interest in the above, the Chapter will consider running another Excel class series focusing on the above

11/9/16
Spreadsheets: Examples from the 2011 Excel Class
website: siliconvalleyaaii.org 21
Presentations, spreadsheets below are available on request…
• Class 1: The Basics– Download Yahoo! Data, basic Excel functions, Normalizing data, Charting the
Equity Curve (EC), Simple statistics (CRR, DD, MDD, Std Dev, MAR, Sharpe)
• Class 2: SMAs and switched ECs– Calculating the Simple Moving Average (SMA), Long/Flat decision, the
switched EC, adding in money market/bond returns, SMA tolerance bands
• Class 3: ETF Ratios, FundX Score– ETF/Asset ratios, applying SMAs to the ratio, FundX scores, timing with
FundX
• Class 4: Ranking and Choosing between Multiple Assets– Combining multiple assets, rebalancing between assets, Faber5/Ivy Portfolio,
ranking and scoring of a variable number of assets in a portfolio
If there’s enough interest in the above, the Chapter will consider re-running another Excel class series focusing on the above
11/9/16
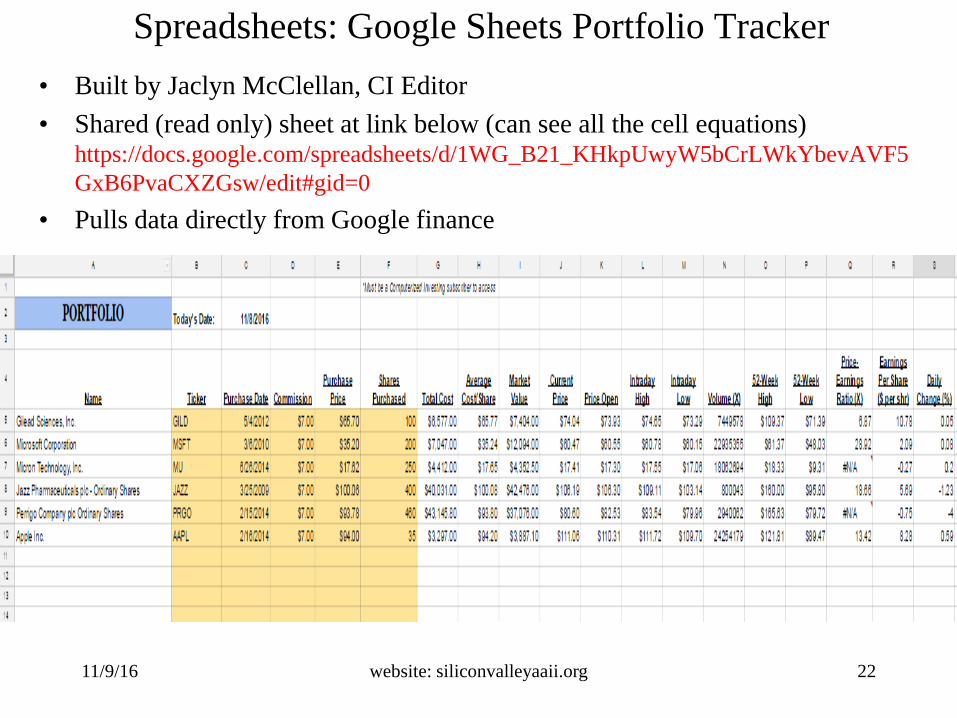
Spreadsheets: Google Sheets Portfolio Tracker
website: siliconvalleyaaii.org 22
• Built by Jaclyn McClellan, CI Editor
• Shared (read only) sheet at link below (can see all the cell equations) https://docs.google.com/spreadsheets/d/1WG_B21_KHkpUwyW5bCrLWkYbevAVF5
GxB6PvaCXZGsw/edit#gid=0
• Pulls data directly from Google finance
11/9/16
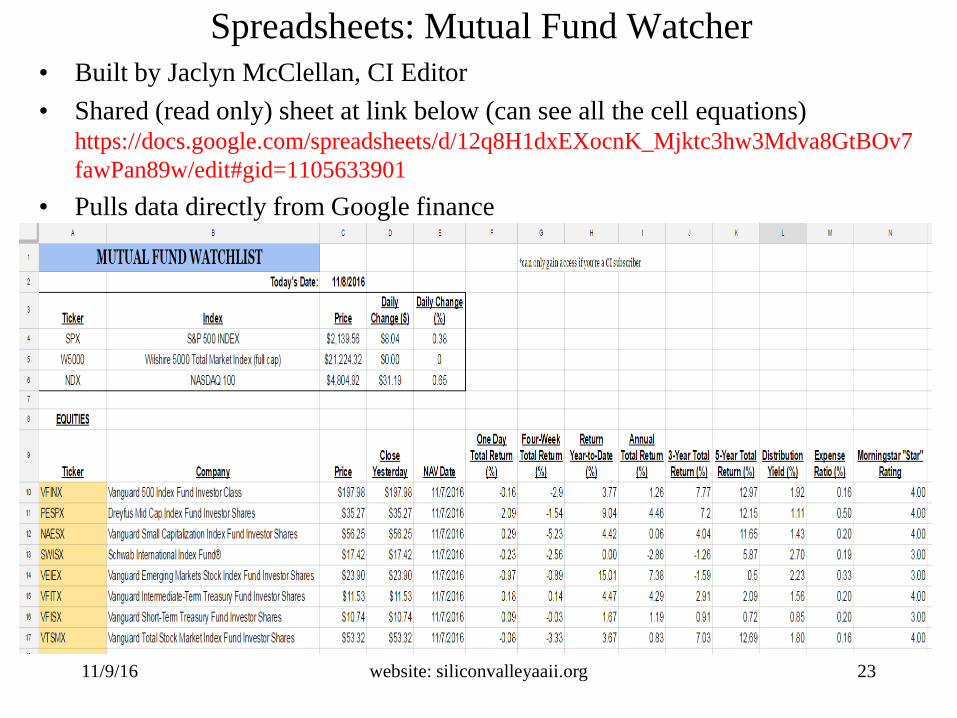
Spreadsheets: Mutual Fund Watcher
website: siliconvalleyaaii.org 23
• Built by Jaclyn McClellan, CI Editor
• Shared (read only) sheet at link below (can see all the cell equations) https://docs.google.com/spreadsheets/d/12q8H1dxEXocnK_Mjktc3hw3Mdva8GtBOv7
fawPan89w/edit#gid=1105633901
• Pulls data directly from Google finance

11/9/16 website: siliconvalleyaaii.org 24
11/9/16
Agenda• Introduction
• Top investing websites & useful
spreadsheets
• Library resources:
Morningstar, S&P and
Value Line • Asset Allocation, ETFs and Robo-
advisors:
• Stock screening, Analysis,
Implementation -- how to get started
• Summary and Final Q&A
• Extra “Stuff” (on-line)
• References
website: siliconvalleyaaii.org 25

11/9/16
Asset Allocation and ETFs – and Robo-Advisors
website: siliconvalleyaaii.org 26
Goal:
• Tell you how to get to these services here at the library
• Provide an overview of what these tools can do
• This is NOT an overview of each tool – that would take hours. If you
need that -- go to the appropriate webpage (and/or search Youtube…)
Main resources: Library Webpage, Service Providers
• Morningstar, S&P and ValueLine Topics
And away we go….

11/9/16
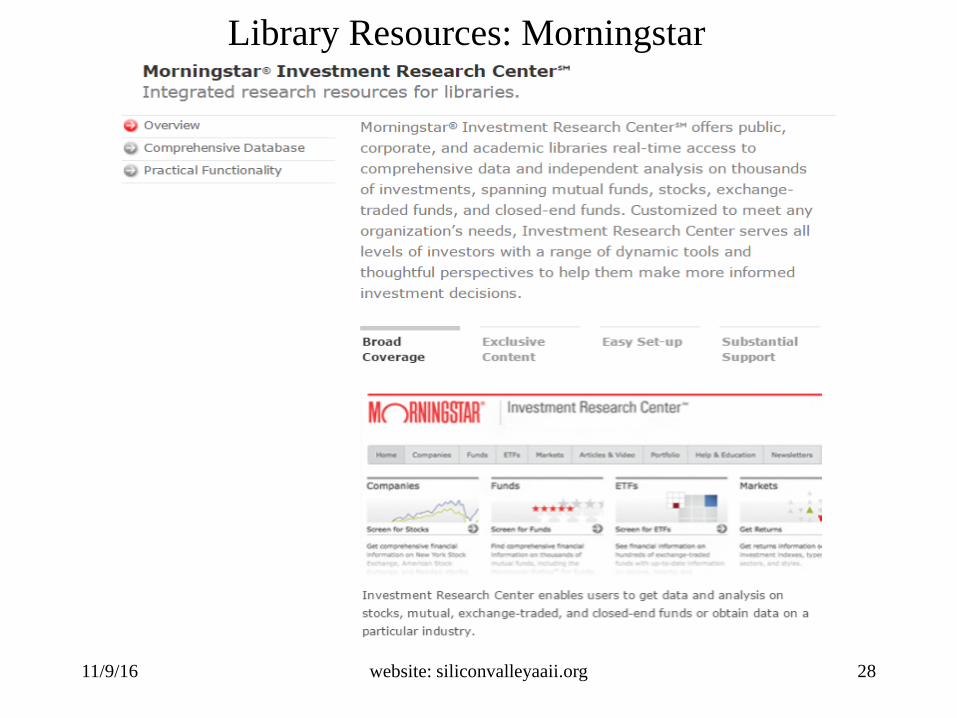
Library Resources: Morningstar
website: siliconvalleyaaii.org 27
https://www.sccl.org/Research/A-Z-List?letter=M
11/9/16
Library Resources: Morningstar
website: siliconvalleyaaii.org 28
https://www.sccl.org/Research/A-Z-List?letter=M
11/9/16
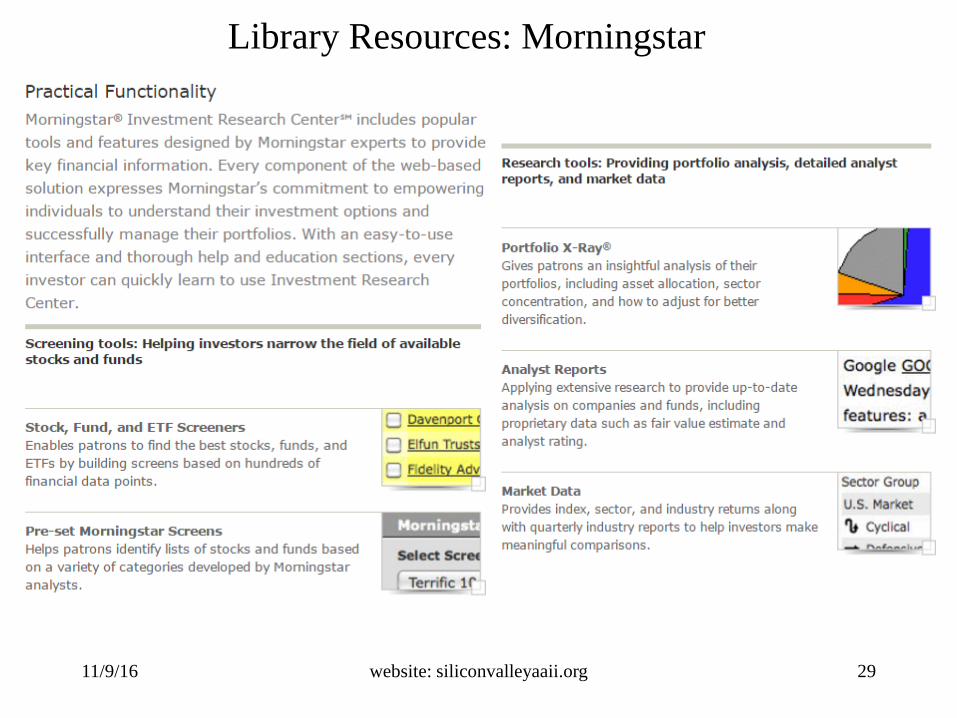
Library Resources: Morningstar
website: siliconvalleyaaii.org 29
11/9/16
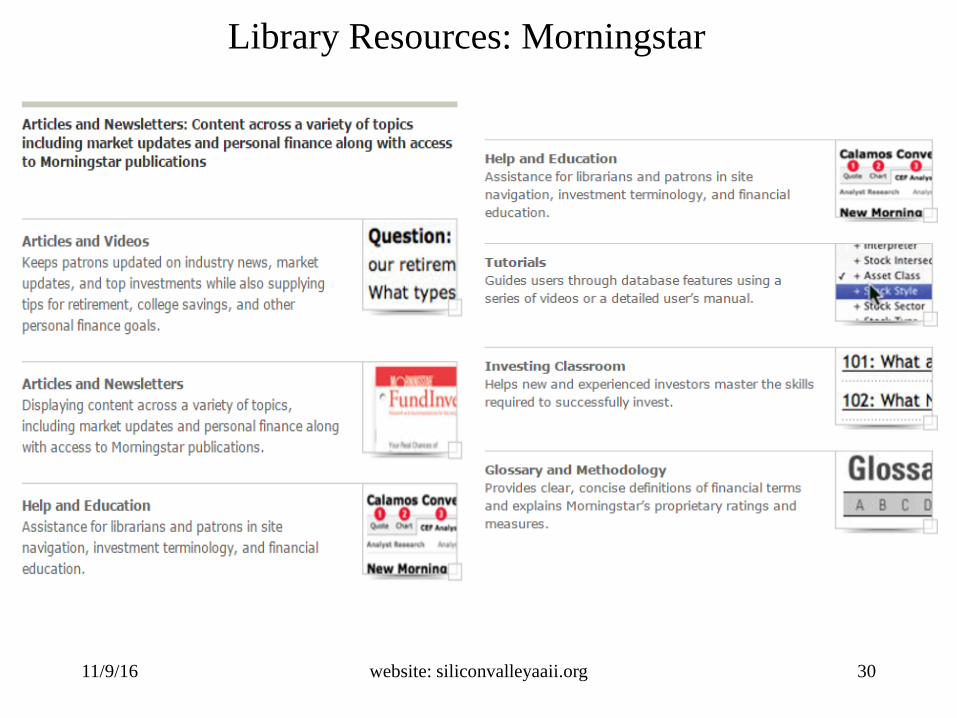
Library Resources: Morningstar
website: siliconvalleyaaii.org 30
11/9/16
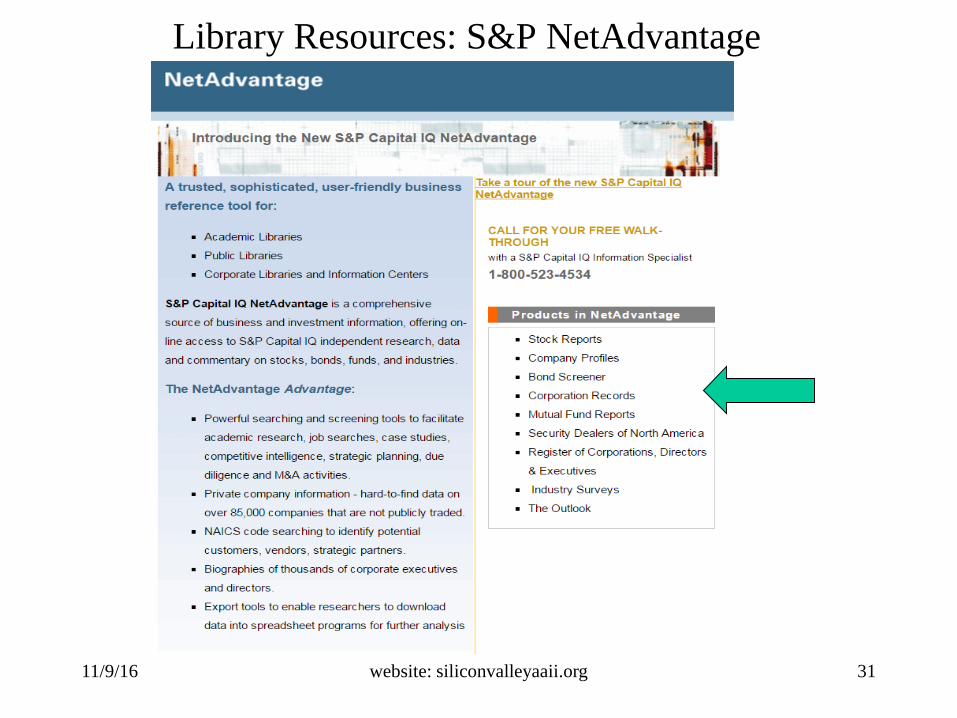
Library Resources: S&P NetAdvantage
website: siliconvalleyaaii.org 31
11/9/16
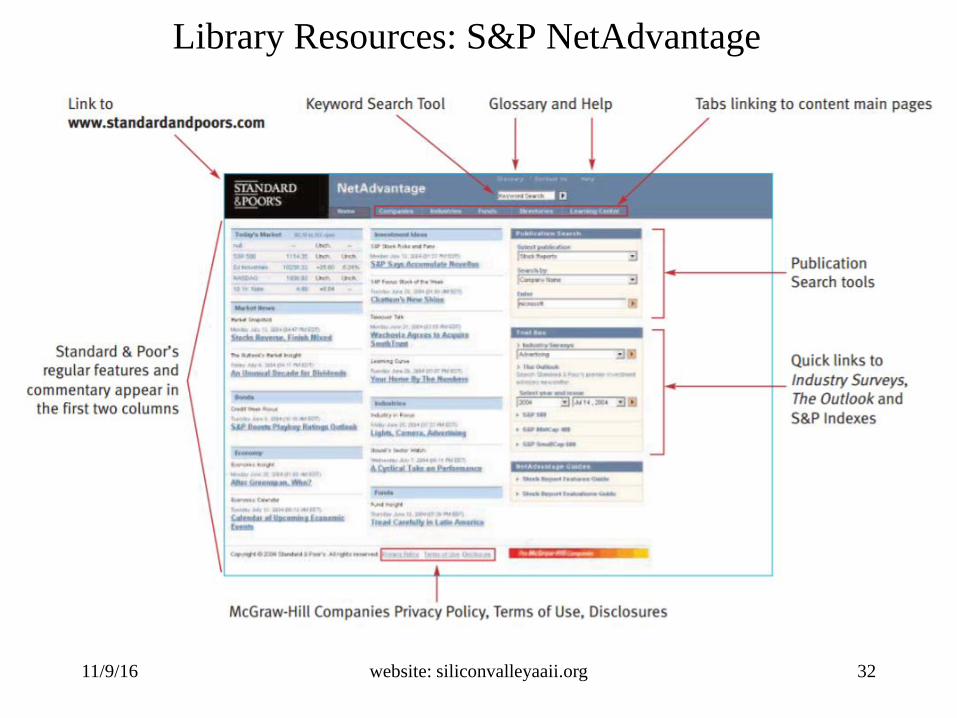
Library Resources: S&P NetAdvantage
website: siliconvalleyaaii.org 32
11/9/16
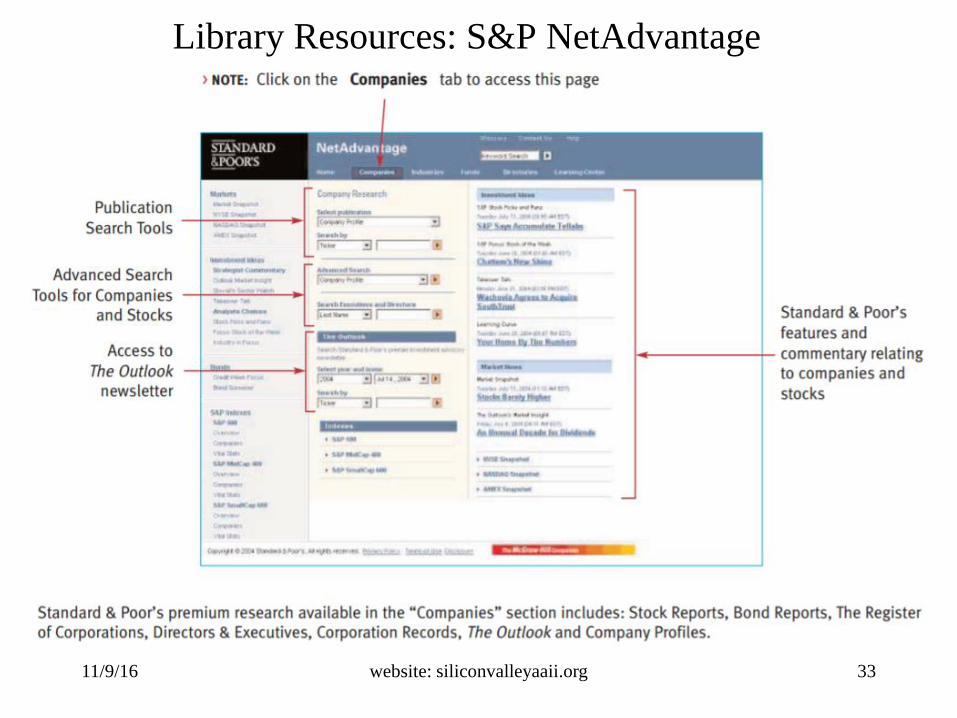
Library Resources: S&P NetAdvantage
website: siliconvalleyaaii.org 33
11/9/16
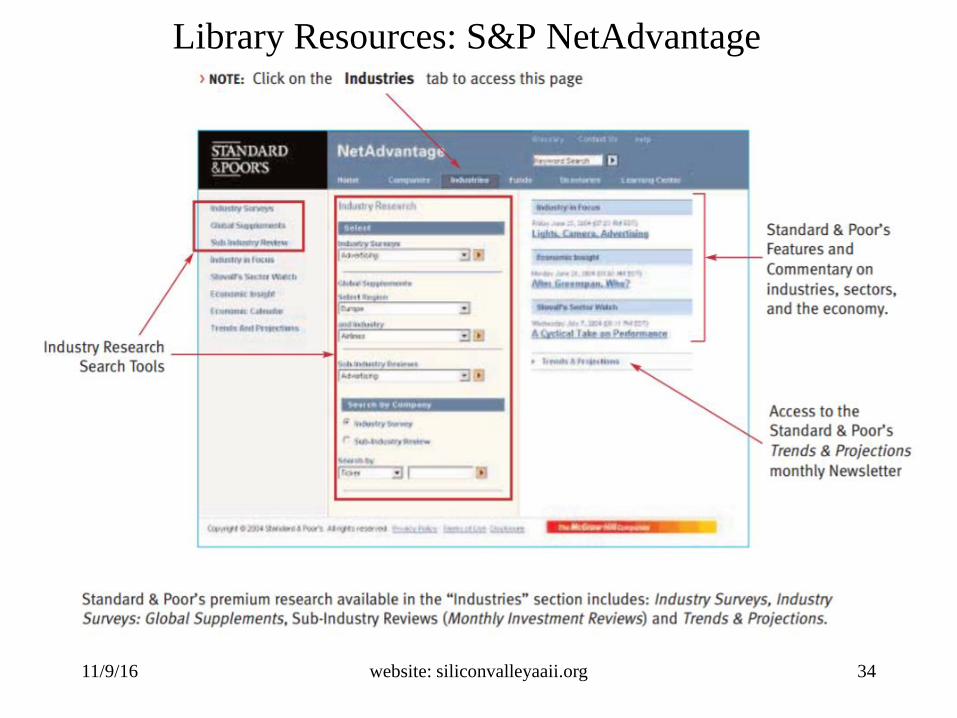
Library Resources: S&P NetAdvantage
website: siliconvalleyaaii.org 34

11/9/16
Library Resources: S&P NetAdvantage
website: siliconvalleyaaii.org 35
11/9/16
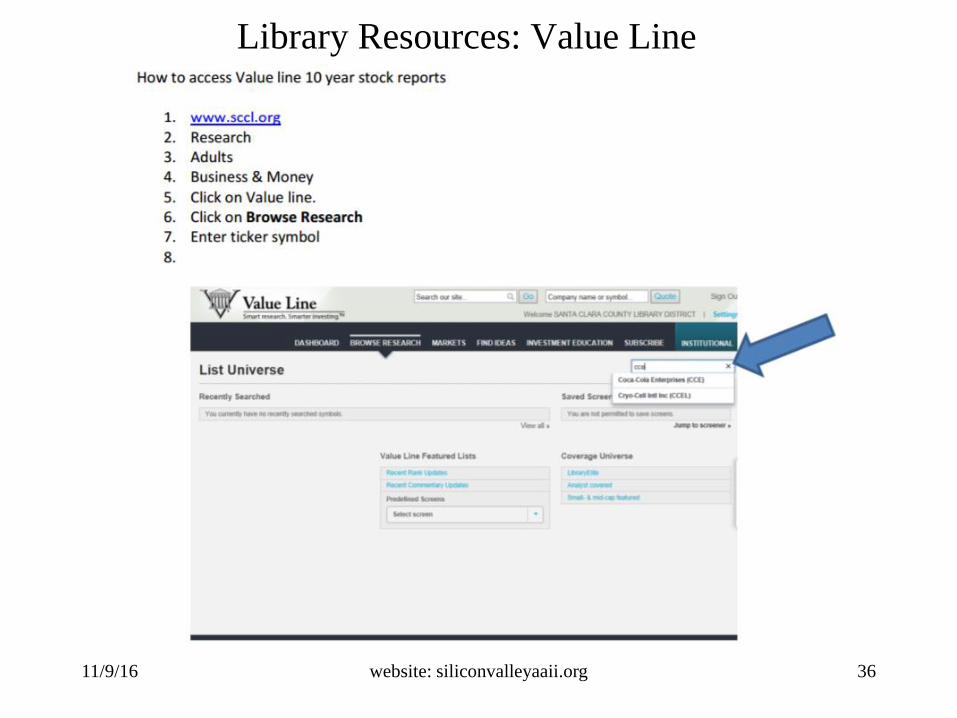
Library Resources: Value Line
website: siliconvalleyaaii.org 36
11/9/16
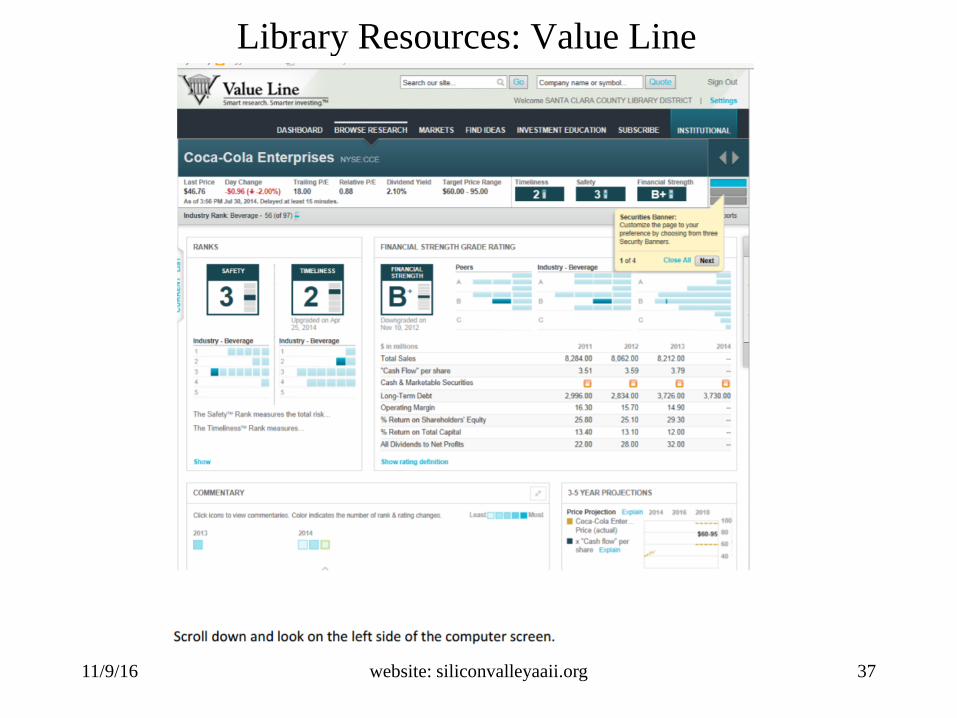
Library Resources: Value Line
website: siliconvalleyaaii.org 37
11/9/16
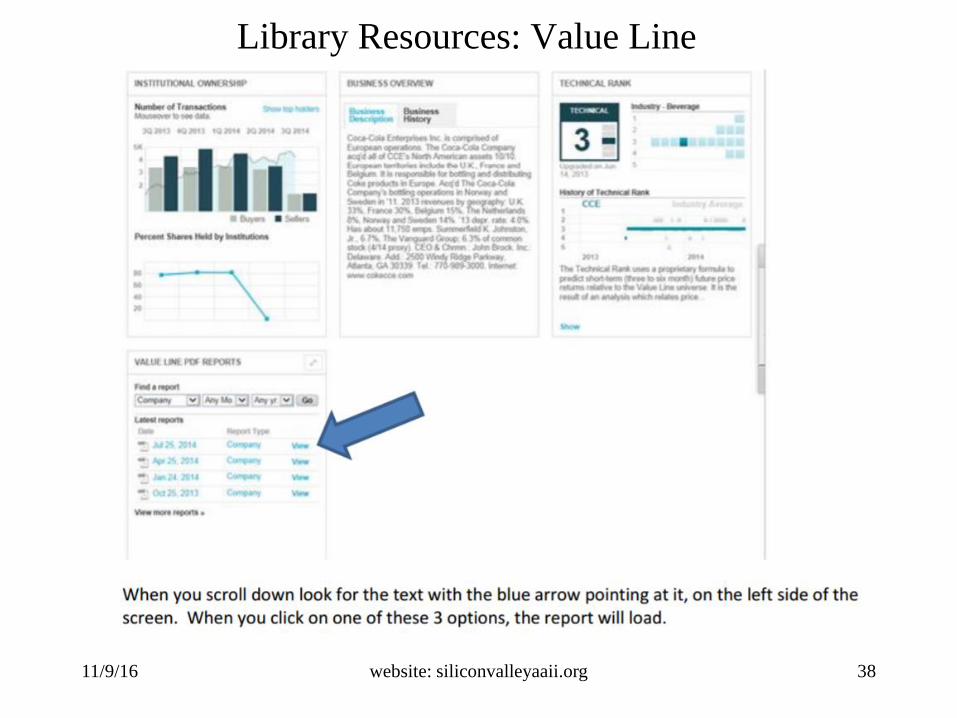
Library Resources: Value Line
website: siliconvalleyaaii.org 38
11/9/16
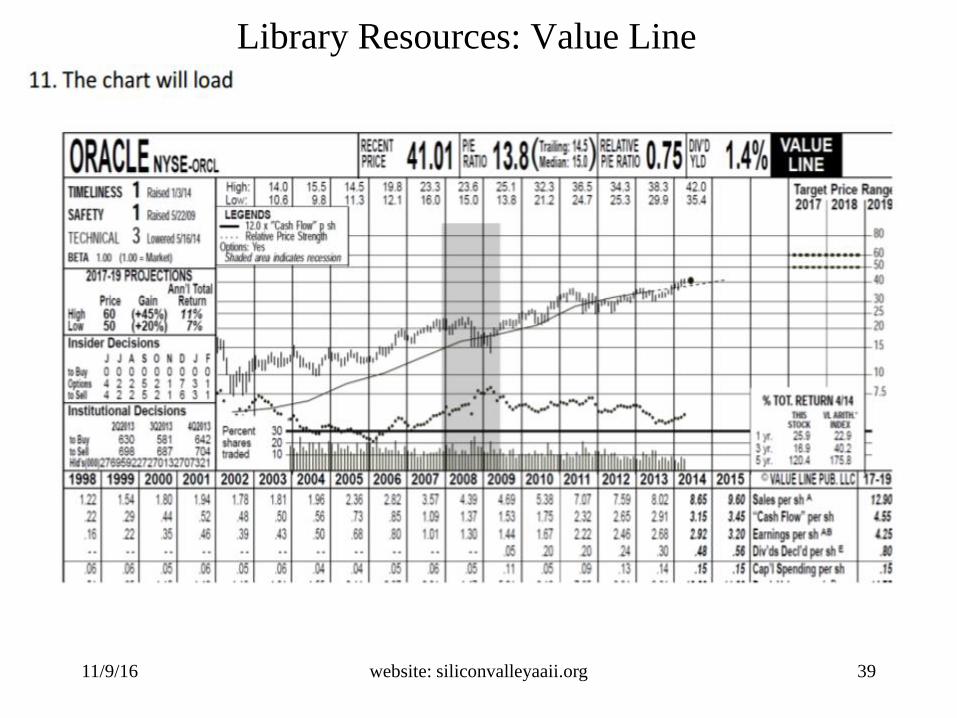
Library Resources: Value Line
website: siliconvalleyaaii.org 39

11/9/16 website: siliconvalleyaaii.org 40
11/9/16
Agenda• Introduction
• Top investing websites & useful
spreadsheets
• Library resources such as Morningstar,
S&P and Value Line
• Asset Allocation, ETFs and
Robo-advisors:
• Stock screening, Analysis,
Implementation -- how to get started
• Summary and Final Q&A
• Extra “Stuff” (on-line)
• References
website: siliconvalleyaaii.org 41

11/9/16
Asset Allocation and ETFs – and Robo-Advisors
website: siliconvalleyaaii.org 42
Goal: • Introduce a powerful freeware portfolio tool
• Provide an overview, with the good and the bad, about Robos
• A very brief treatment of both topics – hopefully enough to get you excited to investigate on your own…
Main resources: Portfolio Visualizer, Journal/CI Robo Articles • Portfolio Visualizer: Some background and capability overview
• PV: Asset/ETF backtest of 3 well-known allocation schemes
• Summaries of 4 AAII Journal/CI newsletter articles on Robos
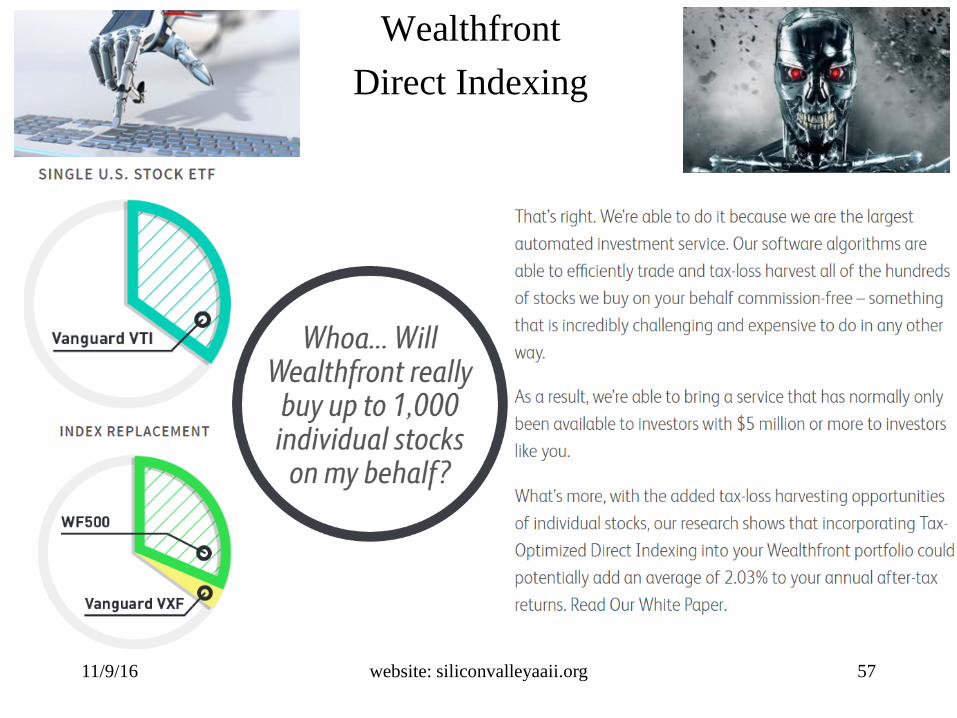
• Direct Indexing tax harvesting (Wealthfront)
And away we go….
7/21/16
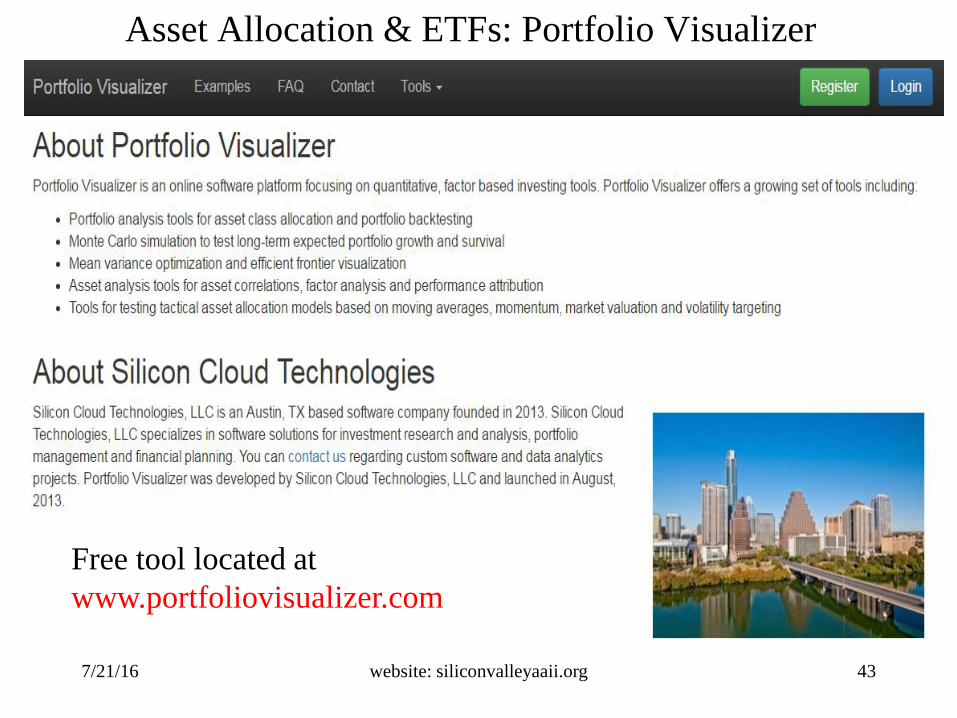
Asset Allocation & ETFs: Portfolio Visualizer
• Free tool located at www.portfoliovisualizer.com
• Can back-test a wide variety of portfolios, strategies (uses
ETFs, Mutual Funds, Indices)
• List of analysis capabilities:
– Asset Allocation, Portfolio Performance, Portfolio Optimization, Asset
Correlation, Factor Analysis, Monte Carlo Simulation, Efficient
Frontier, Market Timing (MA, RS, Dual Momentum)
• Other items: Custom Data Series, Data Sources
• Makes it easy for you to become a DIY quant analyst
Let’s look at the tool…
website: siliconvalleyaaii.org 43
Free tool located at
www.portfoliovisualizer.com
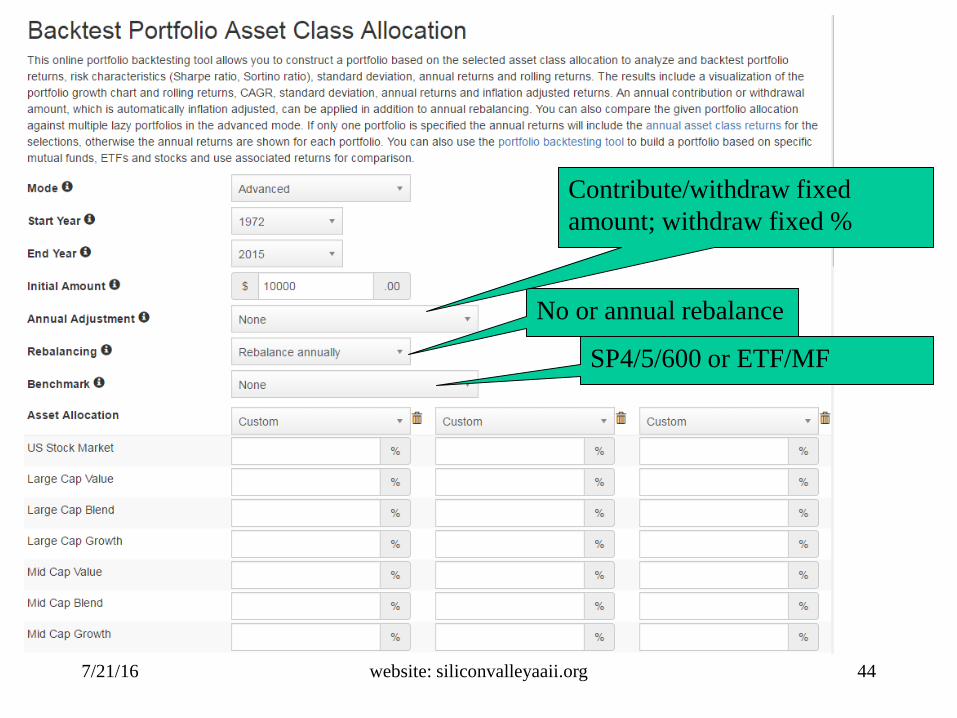
7/21/16 website: siliconvalleyaaii.org 44
No or annual rebalance
Contribute/withdraw fixed
amount; withdraw fixed %
SP4/5/600 or ETF/MF
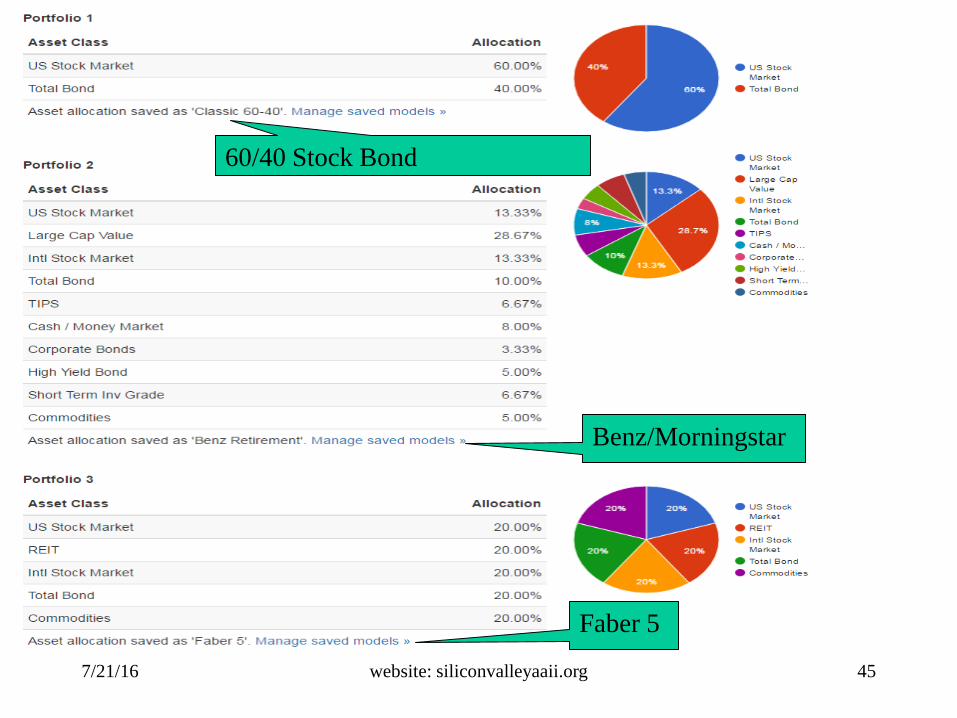
7/21/16 website: siliconvalleyaaii.org 45
Benz/Morningstar
60/40 Stock Bond
Faber 5
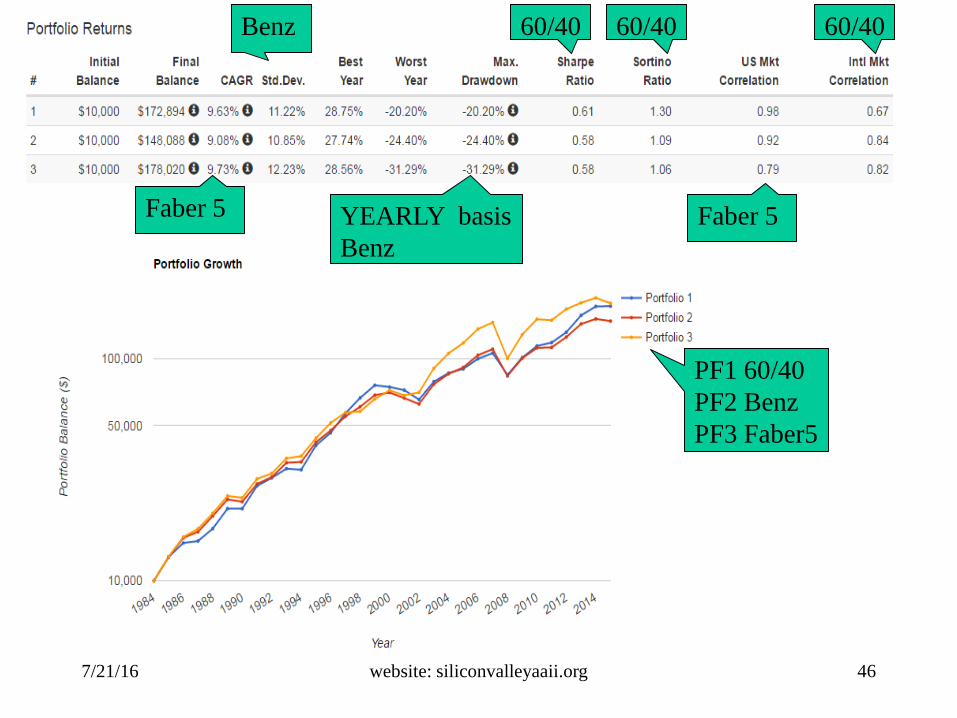
7/21/16 website: siliconvalleyaaii.org 46
Benz
YEARLY basis
Benz
Faber 5
60/40 60/40
Faber 5
60/40
PF1 60/40
PF2 Benz
PF3 Faber5
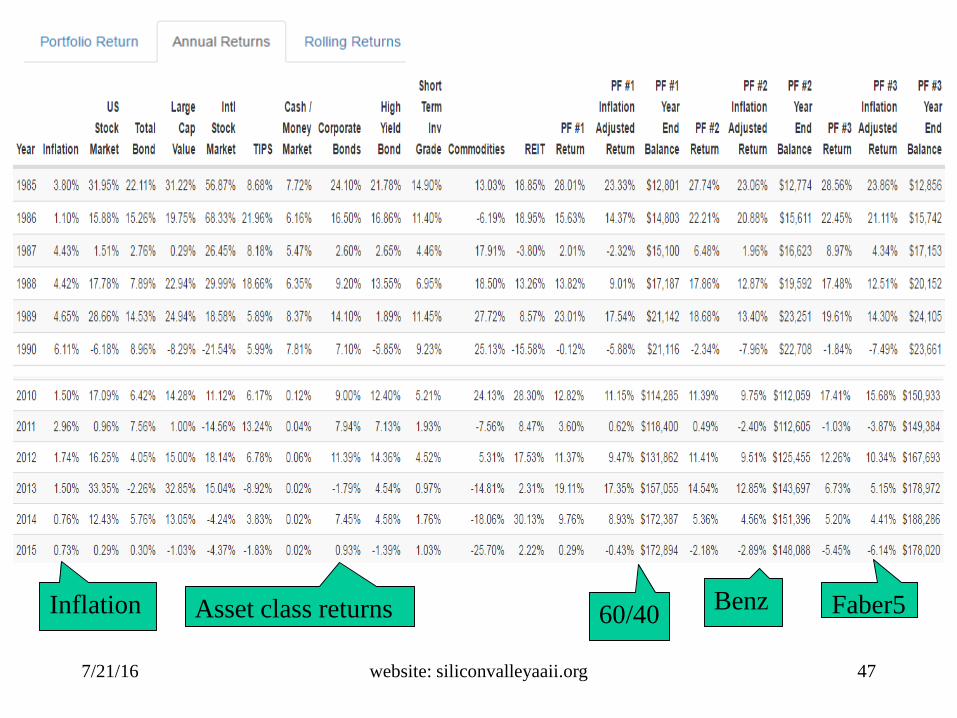
7/21/16 website: siliconvalleyaaii.org 47
60/40Asset class returnsInflation Benz Faber5
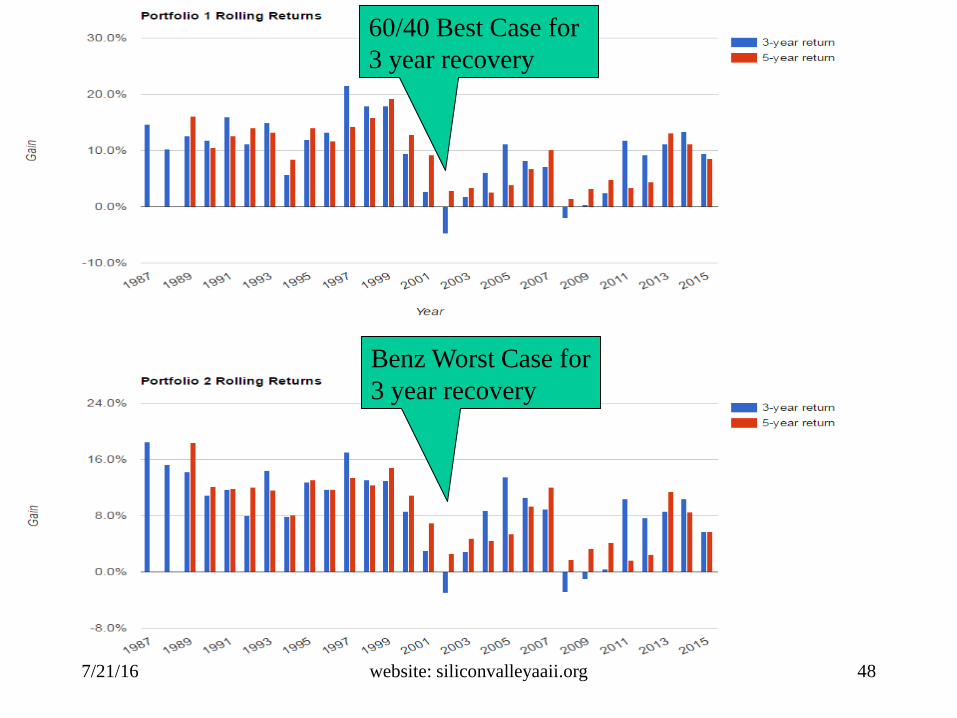
7/21/16 website: siliconvalleyaaii.org 48
60/40 Best Case for
3 year recovery
Benz Worst Case for
3 year recovery

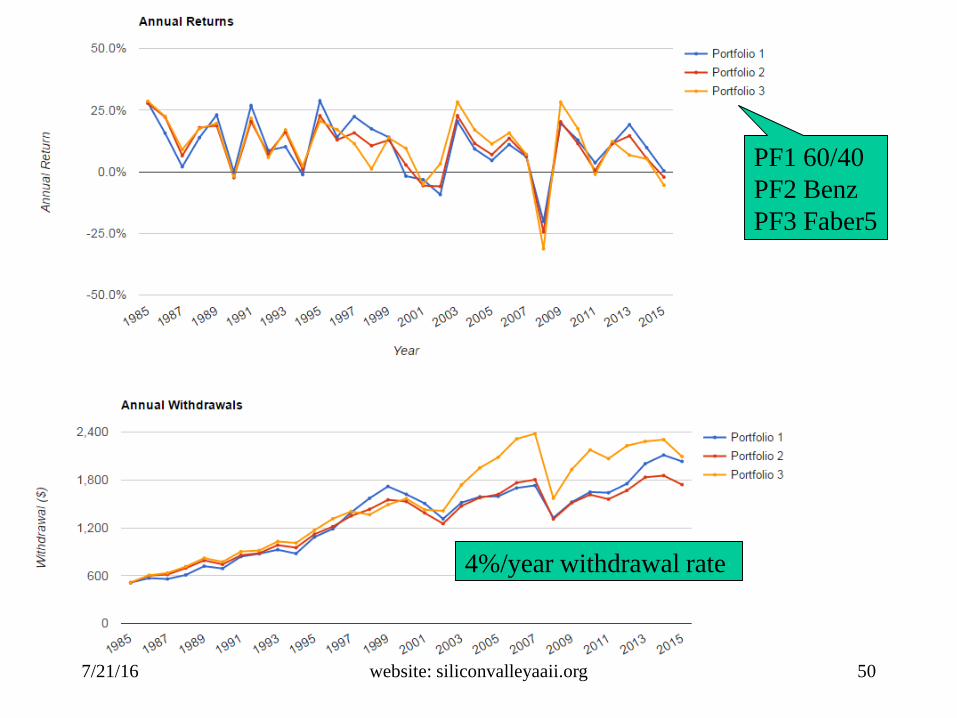
7/21/16 website: siliconvalleyaaii.org 49
Faber 5
Faber 5
PF1 60/40
PF2 Benz
PF3 Faber5
4%/year withdrawal rate
Benz
60/40 60/40 60/40
Faber 5
60/40
7/21/16 website: siliconvalleyaaii.org 50
PF1 60/40
PF2 Benz
PF3 Faber5
4%/year withdrawal rate
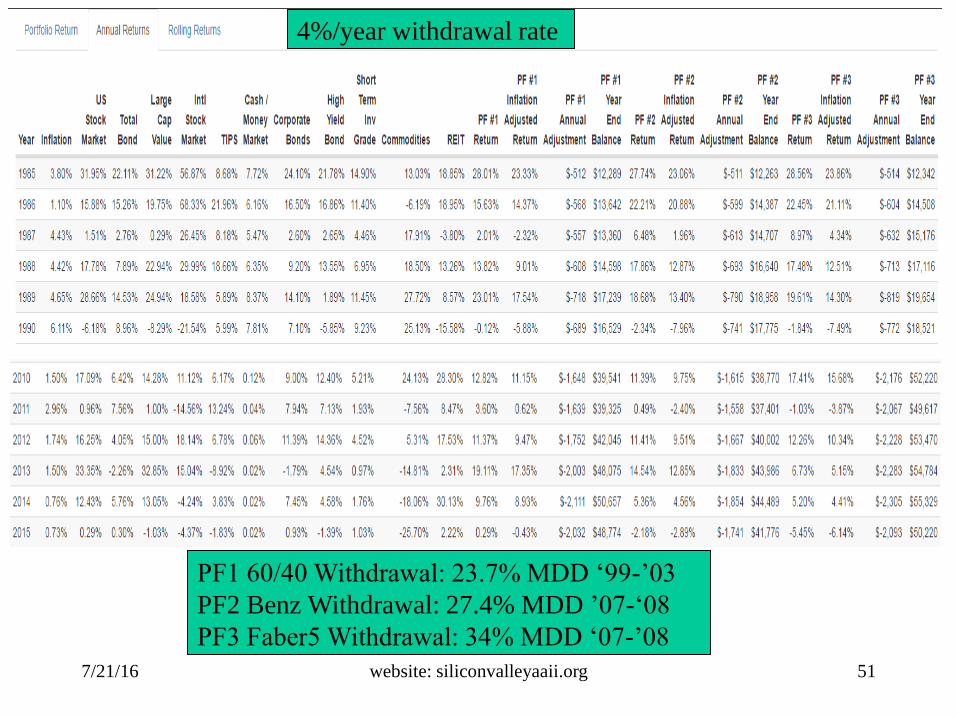
7/21/16 website: siliconvalleyaaii.org 51
4%/year withdrawal rate
PF1 60/40 Withdrawal: 23.7% MDD ‘99-’03
PF2 Benz Withdrawal: 27.4% MDD ’07-‘08
PF3 Faber5 Withdrawal: 34% MDD ‘07-’08

11/9/16 website: siliconvalleyaaii.org 52

11/9/16
Robos: Basics & Pitfalls
Matthew Bajowski
website: siliconvalleyaaii.org 53
• What are Robos??– Robo-advisers are online wealth management services that provide automated
portfolio management and advice…. Their goal is to make investing easier for those who don’t want to actively manage their own portfolios.
– The term is loosely applied to a wide range of online investment services– They tend to “bucket” investors based on risk/reward assumptions as opposed to
creating a customized risk/reward profile– Much of the decision-making process that robo-advisers use, comes from the
concepts of modern portfolio theory (MPT)
• Weaknesses:– Lack of Personal Investment Advice: Many robo services ask a series of
questions (usually no more than 10) in order to generate a risk/return profile.
– Robos May Not Act in the Client’s Best Interest: Human financial advisers who are programming….each robo uses different “rebalancing bands” ….. robo-advisers use affiliated brokers, custodians, clearing firms….
– Robos Don’t Necessarily Cut Costs: Some robos collect no direct fees… but often receive other forms of compensation…. example, robos may not charge a commission… but the investor must still pay the (ETFs) or MF expense ratios
11/9/16
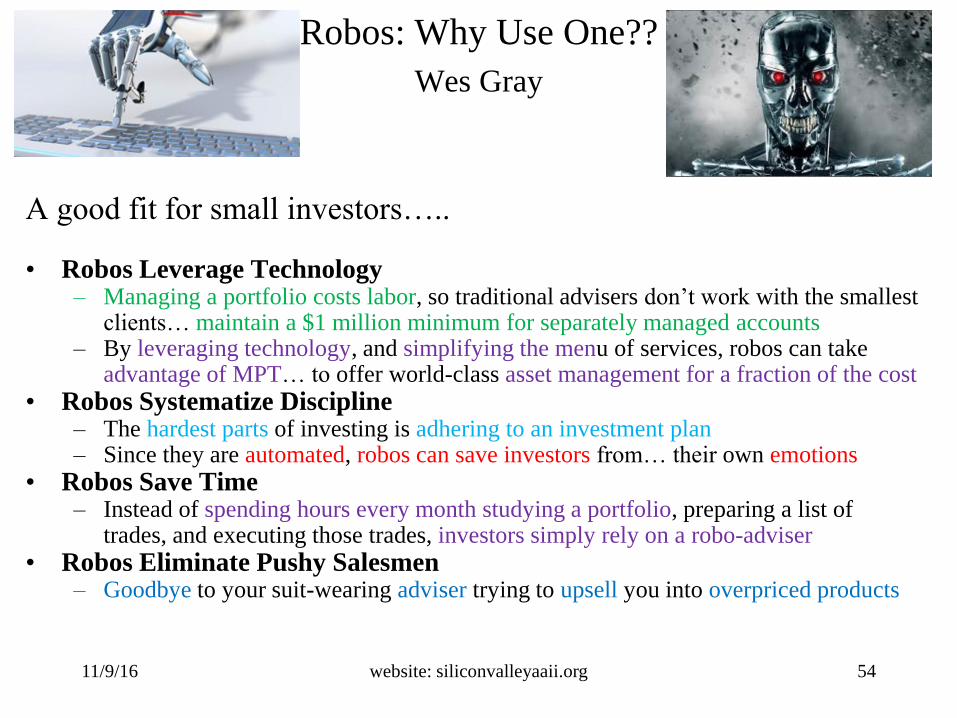
Robos: Why Use One??
Wes Gray
website: siliconvalleyaaii.org 54
A good fit for small investors…..
• Robos Leverage Technology– Managing a portfolio costs labor, so traditional advisers don’t work with the smallest
clients… maintain a $1 million minimum for separately managed accounts– By leveraging technology, and simplifying the menu of services, robos can take
advantage of MPT… to offer world-class asset management for a fraction of the cost
• Robos Systematize Discipline– The hardest parts of investing is adhering to an investment plan– Since they are automated, robos can save investors from… their own emotions
• Robos Save Time– Instead of spending hours every month studying a portfolio, preparing a list of
trades, and executing those trades, investors simply rely on a robo-adviser
• Robos Eliminate Pushy Salesmen– Goodbye to your suit-wearing adviser trying to upsell you into overpriced products
11/9/16
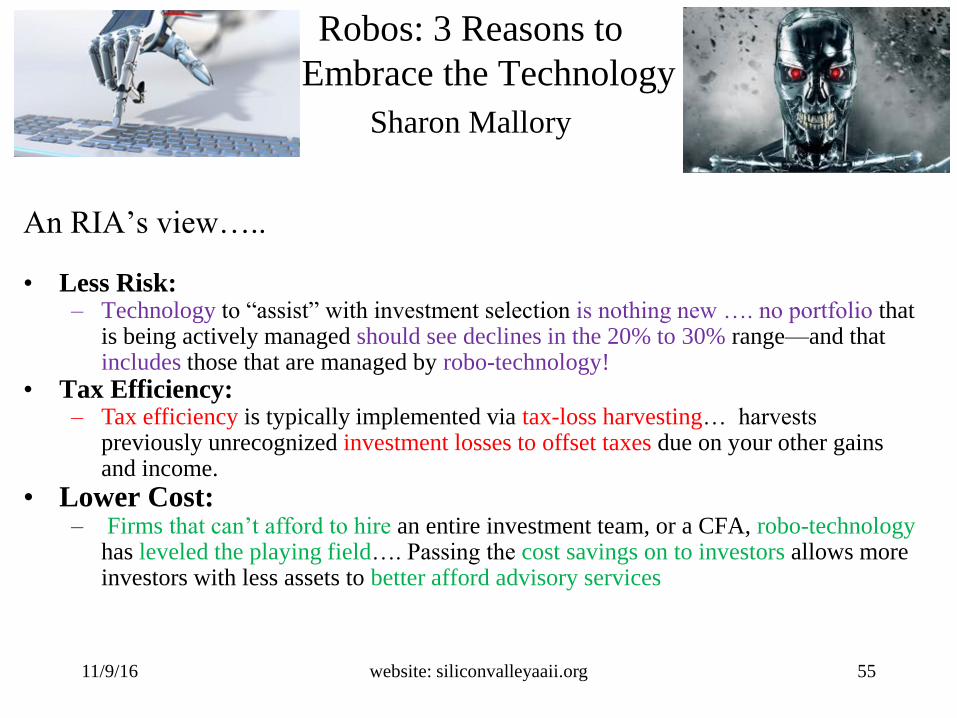
Robos: 3 Reasons to
Embrace the Technology
Sharon Mallory
website: siliconvalleyaaii.org 55
An RIA’s view…..
• Less Risk:– Technology to “assist” with investment selection is nothing new …. no portfolio that
is being actively managed should see declines in the 20% to 30% range—and that includes those that are managed by robo-technology!
• Tax Efficiency:– Tax efficiency is typically implemented via tax-loss harvesting… harvests
previously unrecognized investment losses to offset taxes due on your other gains and income.
• Lower Cost:– Firms that can’t afford to hire an entire investment team, or a CFA, robo-technology
has leveled the playing field…. Passing the cost savings on to investors allows more investors with less assets to better afford advisory services
11/9/16
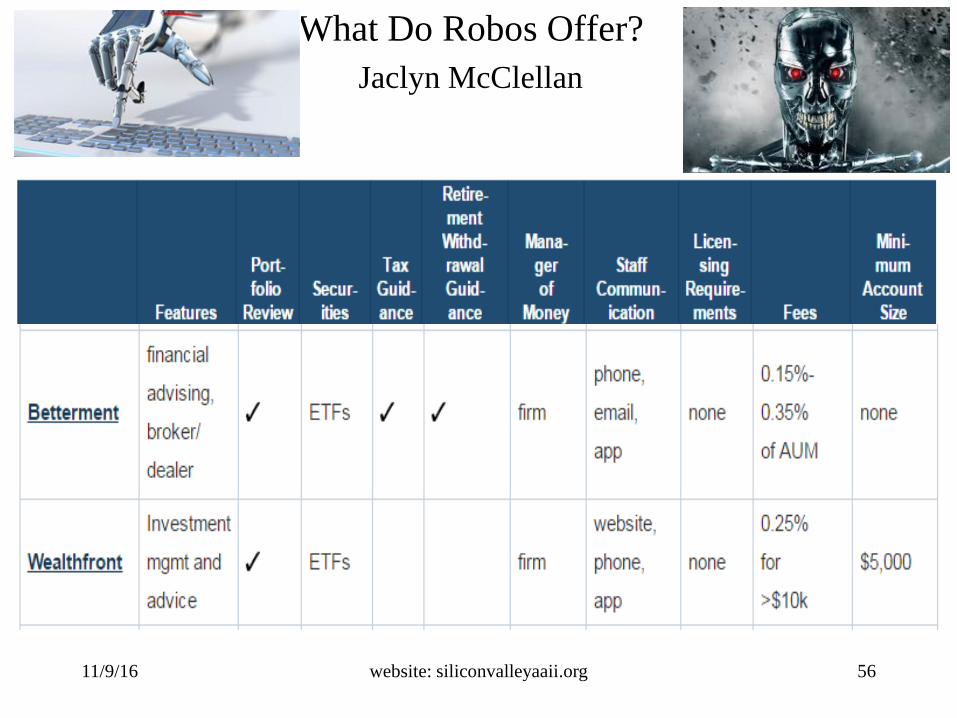
What Do Robos Offer?
Jaclyn McClellan
website: siliconvalleyaaii.org 56
11/9/16
Wealthfront
Direct Indexing
website: siliconvalleyaaii.org 57

11/9/16 website: siliconvalleyaaii.org 58
11/9/16
Agenda• Introduction
• Top investing websites & useful
spreadsheets
• Library resources such as Morningstar,
S&P and Value Line
• Asset Allocation, ETFs and Robo-
advisors:
• Stock screening, Analysis,
Implementation -- how to get started
• Summary and Final Q&A
• Extra “Stuff” (on-line)
• References
website: siliconvalleyaaii.org 59
11/9/16
Stock Screening and Implementation
website: siliconvalleyaaii.org 60
Goal:
• Introduce a simple stock screen and illustrate implementation
• An in-depth version of this took 90 minutes – we have 30 minutes
– (Survey course – not a PhD thesis)
Main resources: SYLD book, Portfolio123/Stock Investor Pro
• Introductory comments on screeners and backtesters
• The Shareholder Yield (SYLD) screen and backtest
• Implementation problems and solutions
And away we go….
11/9/16 website: siliconvalleyaaii.org
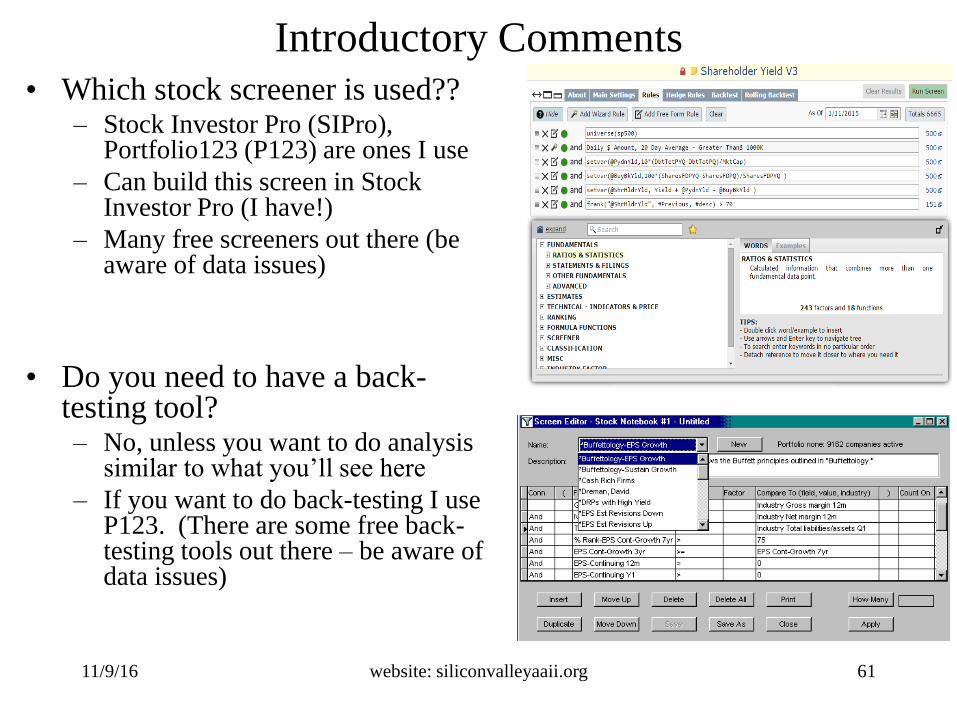
Introductory Comments • Which stock screener is used??
– Stock Investor Pro (SIPro), Portfolio123 (P123) are ones I use
– Can build this screen in Stock Investor Pro (I have!)
– Many free screeners out there (be aware of data issues)
• Do you need to have a back-testing tool?– No, unless you want to do analysis
similar to what you’ll see here
– If you want to do back-testing I use P123. (There are some free back-testing tools out there – be aware of data issues)
61
11/9/16 website: siliconvalleyaaii.org
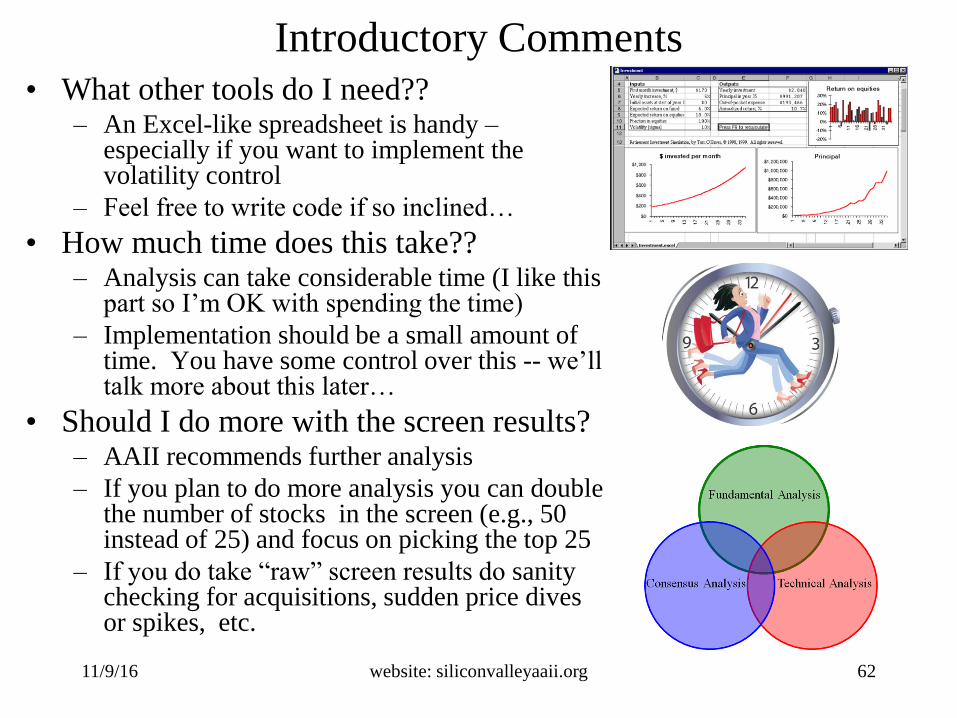
Introductory Comments• What other tools do I need??
– An Excel-like spreadsheet is handy –especially if you want to implement the volatility control
– Feel free to write code if so inclined…
• How much time does this take??– Analysis can take considerable time (I like this
part so I’m OK with spending the time)
– Implementation should be a small amount of time. You have some control over this -- we’ll talk more about this later…
• Should I do more with the screen results?– AAII recommends further analysis
– If you plan to do more analysis you can double the number of stocks in the screen (e.g., 50 instead of 25) and focus on picking the top 25
– If you do take “raw” screen results do sanity checking for acquisitions, sudden price dives or spikes, etc.
62

• Based on AAII-SV event in May 2013 by
Meb Faber on his book Shareholder Yield
– Free e-book at Amazon (occasionally)
• Key points
– SY = DY + BBY + PDY
• Shareholder Yield = Dividend Yield +
BuyBack Yield + PayDown Yield
– BuyBack Yield: Net share buybacks (measured
over the last year)
– PayDown Yield: Net pay down of debt (Total
debt reduction over the last year)
– All 3 terms are the real return to shareholders
– SY has done well over time – see next slide
– Compare SYLD ETF to PKW, PFM ETFs
• For foreign stocks see the FYLD ETF
Shareholder Yield
11/9/16 website: siliconvalleyaaii.org 63

Shareholder Yield
11/9/16 website: siliconvalleyaaii.org
• Back-test takes
top 25% of
S&P500 stocks
yearly (by each
measure)
• Market cap-
weights used
within each
strategy
64

• Terms: (some, not all)
– Setvar = “set variable”; frank = “rank on ShrHldrYld descending order”
– DbtTotPYQ = “Total Debt Previous Year Quarter”;
– SharesFDPYQ = “Common Shares Fully Diluted Previous Year Quarter”
Shareholder Yield at Portfolio123
11/9/16 website: siliconvalleyaaii.org 65
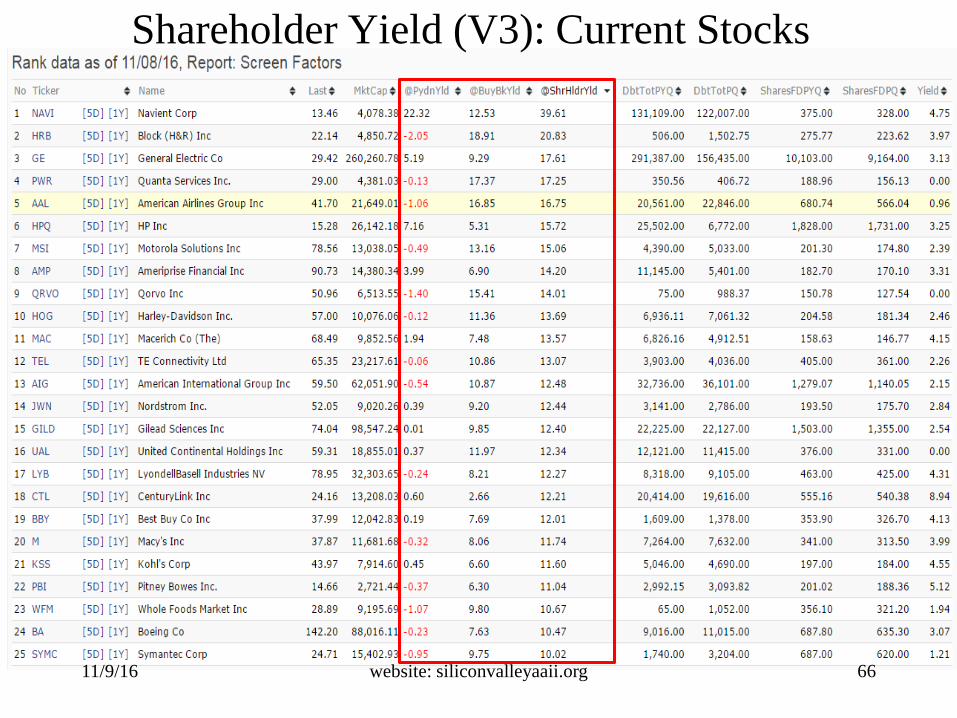
Shareholder Yield (V3): Current Stocks
11/9/16 website: siliconvalleyaaii.org 66
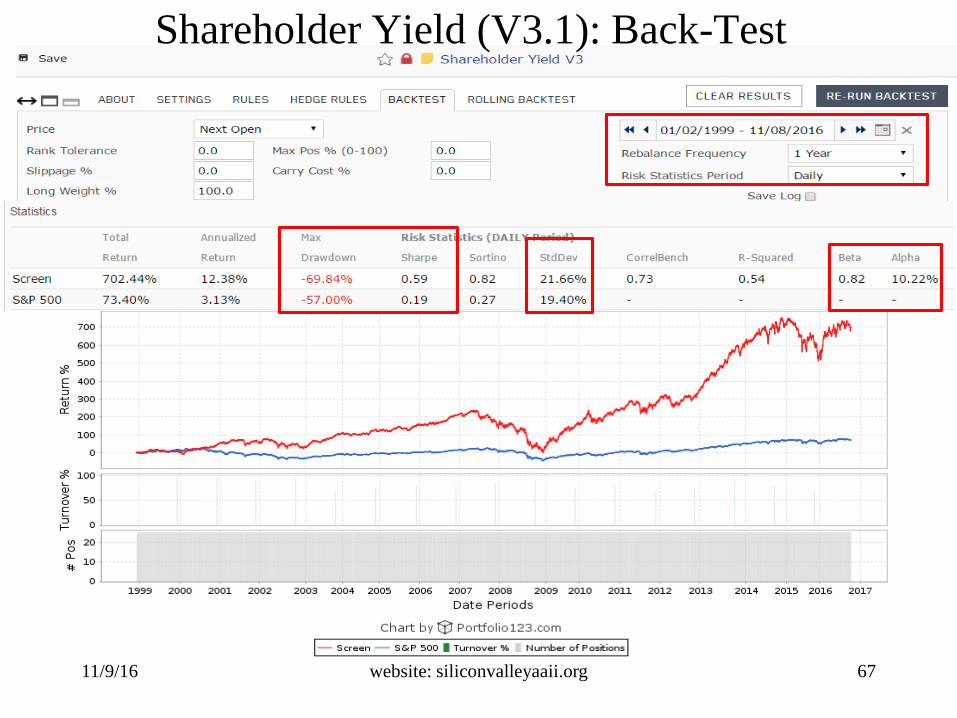
Shareholder Yield (V3.1): Back-Test
11/9/16 website: siliconvalleyaaii.org 67
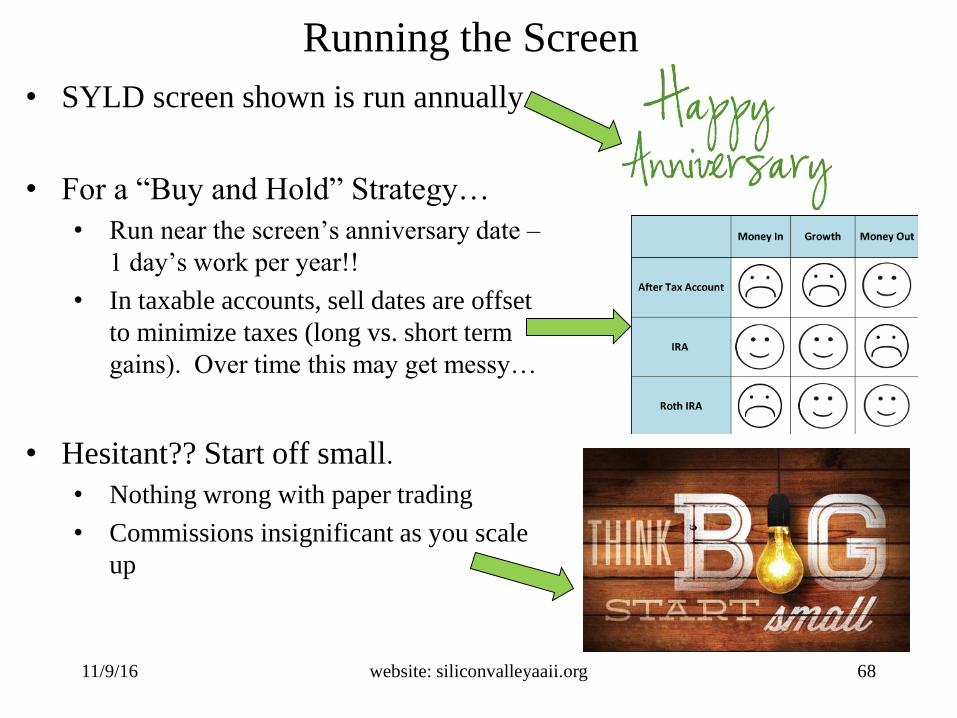
Running the Screen
11/9/16 website: siliconvalleyaaii.org
• SYLD screen shown is run annually
• For a “Buy and Hold” Strategy…
• Run near the screen’s anniversary date –
1 day’s work per year!!
• In taxable accounts, sell dates are offset
to minimize taxes (long vs. short term
gains). Over time this may get messy…
• Hesitant?? Start off small.
• Nothing wrong with paper trading
• Commissions insignificant as you scale
up
68
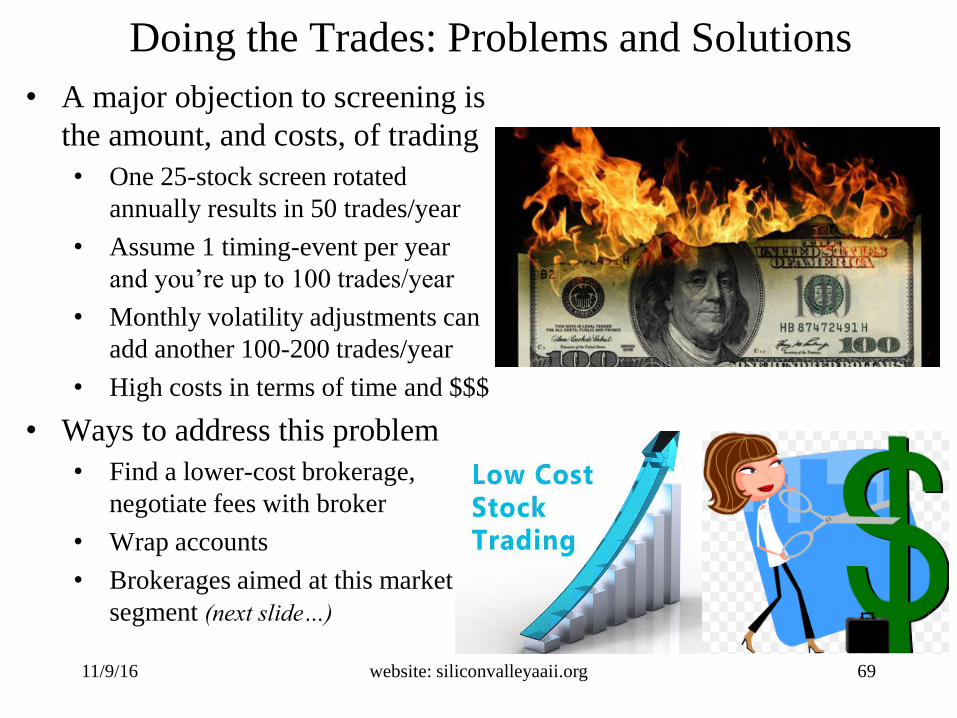
Doing the Trades: Problems and Solutions
11/9/16 website: siliconvalleyaaii.org
• A major objection to screening is
the amount, and costs, of trading
• One 25-stock screen rotated
annually results in 50 trades/year
• Assume 1 timing-event per year
and you’re up to 100 trades/year
• Monthly volatility adjustments can
add another 100-200 trades/year
• High costs in terms of time and $$$
• Ways to address this problem
• Find a lower-cost brokerage,
negotiate fees with broker
• Wrap accounts
• Brokerages aimed at this market
segment (next slide…)
69
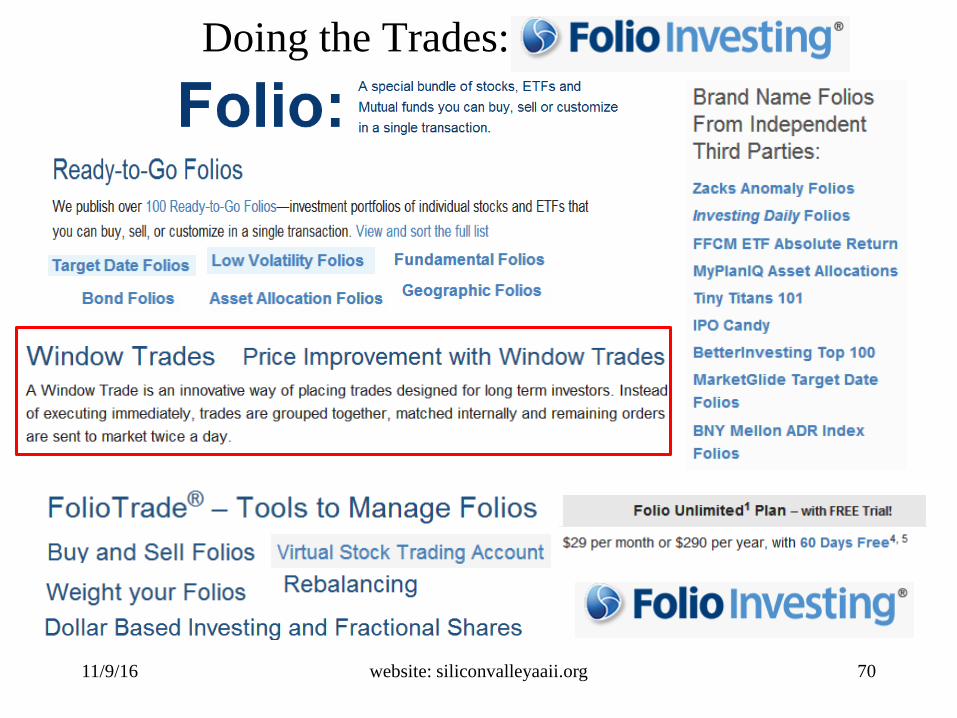
Doing the Trades: Folio Investing
11/9/16 website: siliconvalleyaaii.org 70
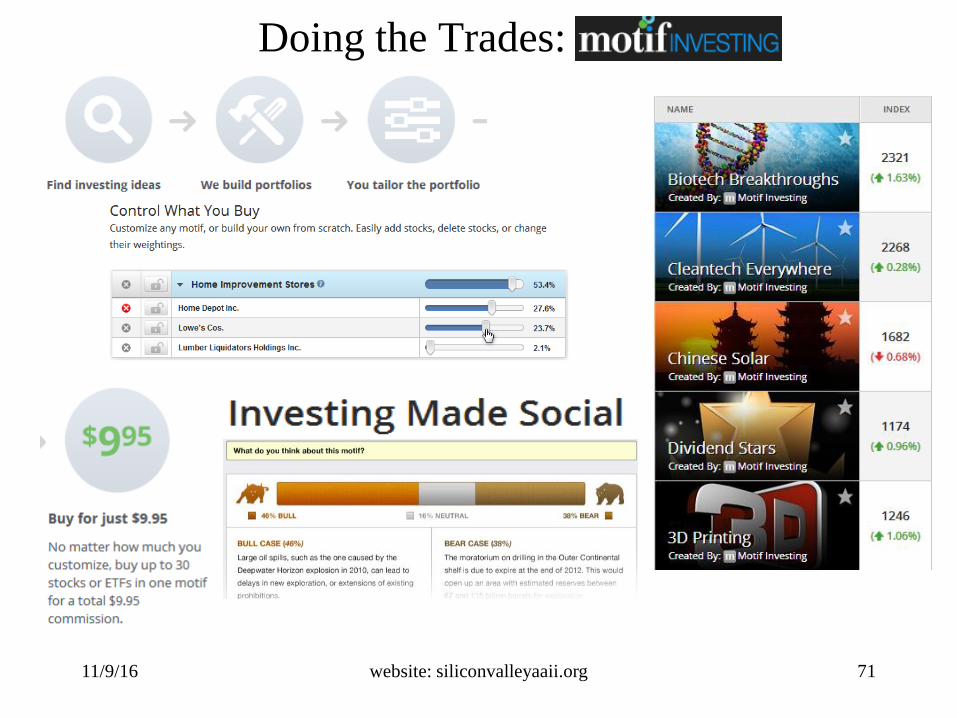
Doing the Trades: 9ge0990
11/9/16 website: siliconvalleyaaii.org 71

11/9/16 website: siliconvalleyaaii.org 72
11/9/16
Agenda• Introduction
• Top investing websites & useful
spreadsheets
• Library resources such as Morningstar,
S&P and Value Line
• Asset Allocation, ETFs and
Roboadvisors
• Stock screening, Analysis,
Implementation -- how to get started
• Summary and Final Q&A
• Extra “Stuff” (on-line)
• References
website: siliconvalleyaaii.org 73
11/9/16
Summary
• Introduction:
– A bit about the FPW Series
• Top investing websites & useful spreadsheets
– Select websites and a few example spreadsheets
• Library resources such as Morningstar, S&P and Value Line
– Free “Brand Name” advice for you to use
• Asset Allocation w/ETFs; Robo-advisors
– Freeware tool for asset allocation; A basic understanding of Robos
• Stock screening, Analysis, Implementation -- how to get started
– The basics of screening – and how you can implement screens
And one more thing….
website: siliconvalleyaaii.org 74
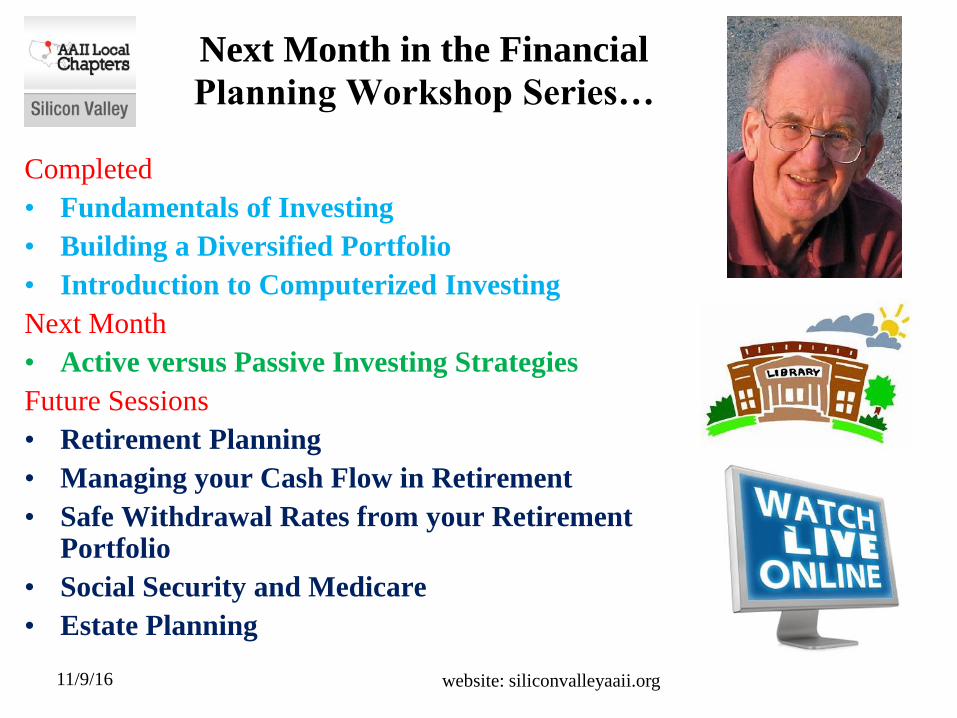
Next Month in the Financial
Planning Workshop Series…
Completed
• Fundamentals of Investing
• Building a Diversified Portfolio
• Introduction to Computerized Investing
Next Month
• Active versus Passive Investing Strategies
Future Sessions
• Retirement Planning
• Managing your Cash Flow in Retirement
• Safe Withdrawal Rates from your Retirement Portfolio
• Social Security and Medicare
• Estate Planning
11/9/16 website: siliconvalleyaaii.org

11/9/16 website: siliconvalleyaaii.org 76
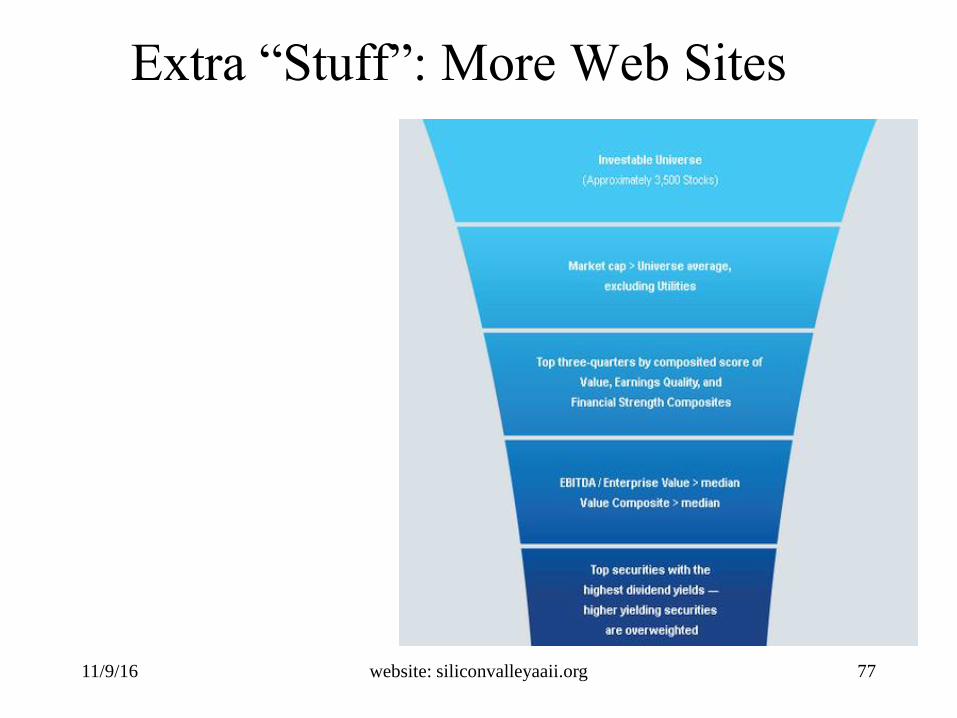
11/9/16
Extra “Stuff”: More Web Sites
website: siliconvalleyaaii.org 77
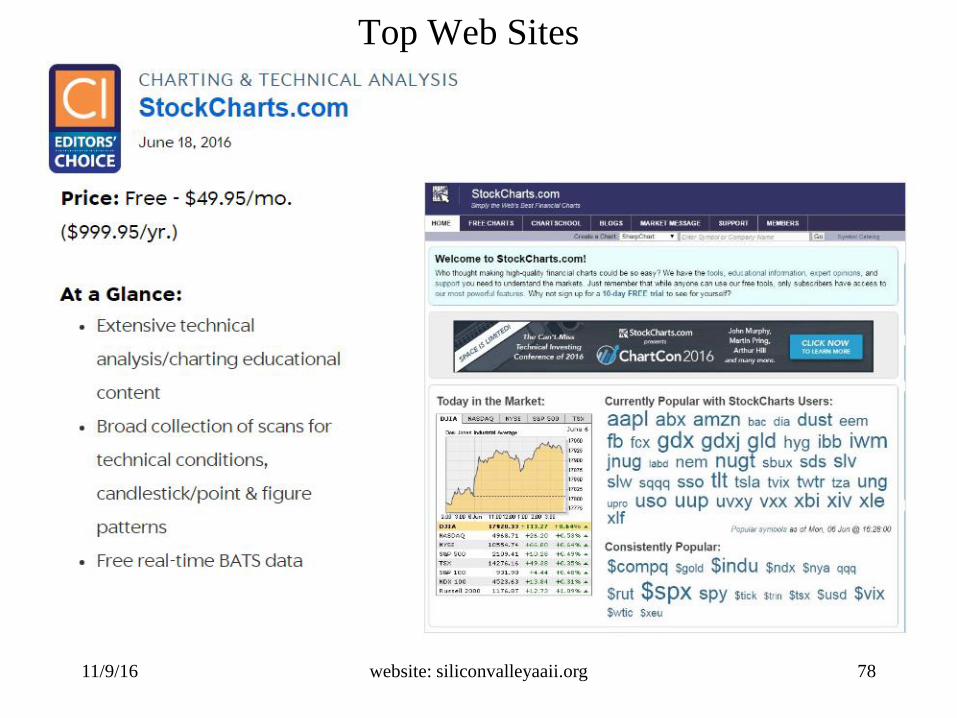
11/9/16
Top Web Sites
website: siliconvalleyaaii.org 78
11/9/16
Top Web Sites
website: siliconvalleyaaii.org 79
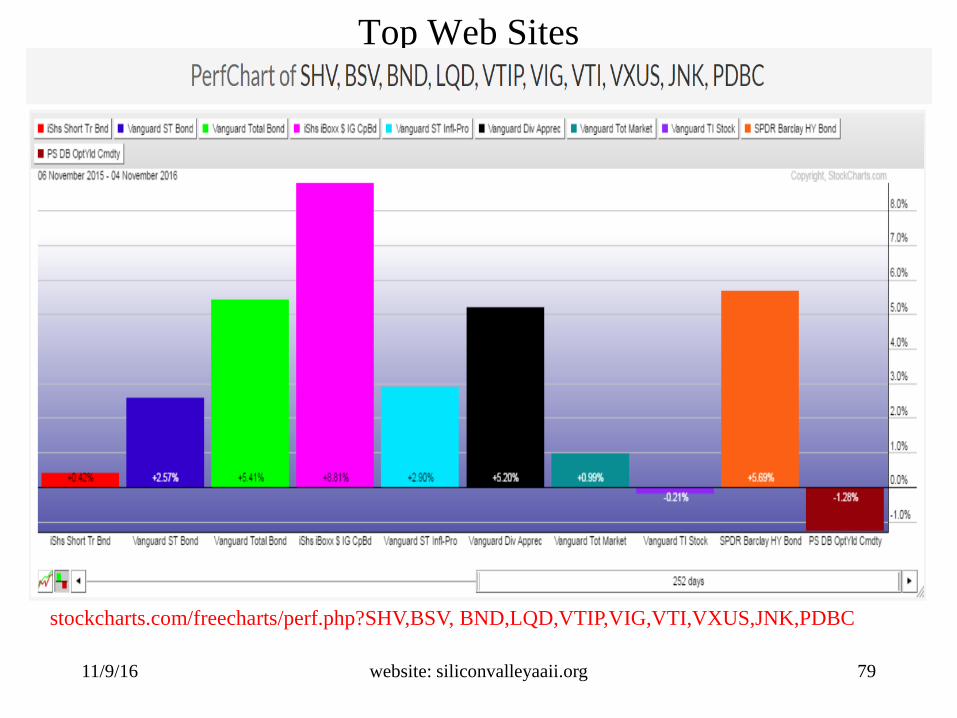
stockcharts.com/freecharts/perf.php?SHV,BSV, BND,LQD,VTIP,VIG,VTI,VXUS,JNK,PDBC
11/9/16
Top Web Sites
website: siliconvalleyaaii.org 80
11/9/16
Top Web Sites
website: siliconvalleyaaii.org 81
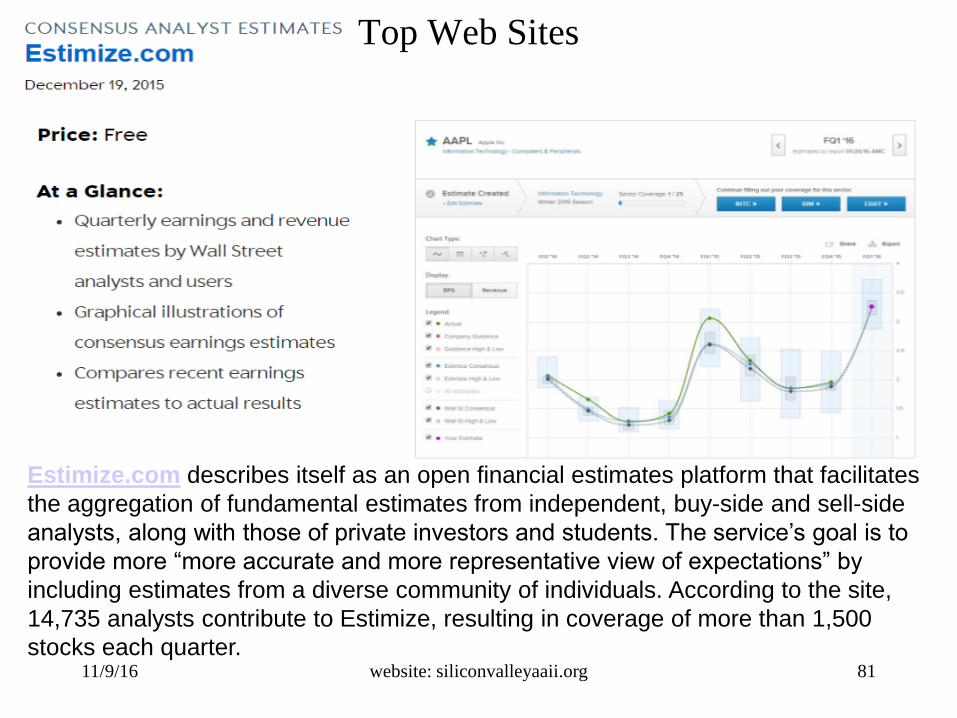
Estimize.com describes itself as an open financial estimates platform that facilitates
the aggregation of fundamental estimates from independent, buy-side and sell-side
analysts, along with those of private investors and students. The service’s goal is to
provide more “more accurate and more representative view of expectations” by
including estimates from a diverse community of individuals. According to the site,
14,735 analysts contribute to Estimize, resulting in coverage of more than 1,500
stocks each quarter.
11/9/16
Top Web Sites
website: siliconvalleyaaii.org 82
11/9/16
Top Web Sites
website: siliconvalleyaaii.org 83
11/9/16
Top Web Sites
website: siliconvalleyaaii.org 84
11/9/16
Top Web Sites
website: siliconvalleyaaii.org 85

11/9/16
Top Web Sites
website: siliconvalleyaaii.org 86
11/9/16
Top Web Sites
website: siliconvalleyaaii.org 87
11/9/16
Top Web Sites
website: siliconvalleyaaii.org 88
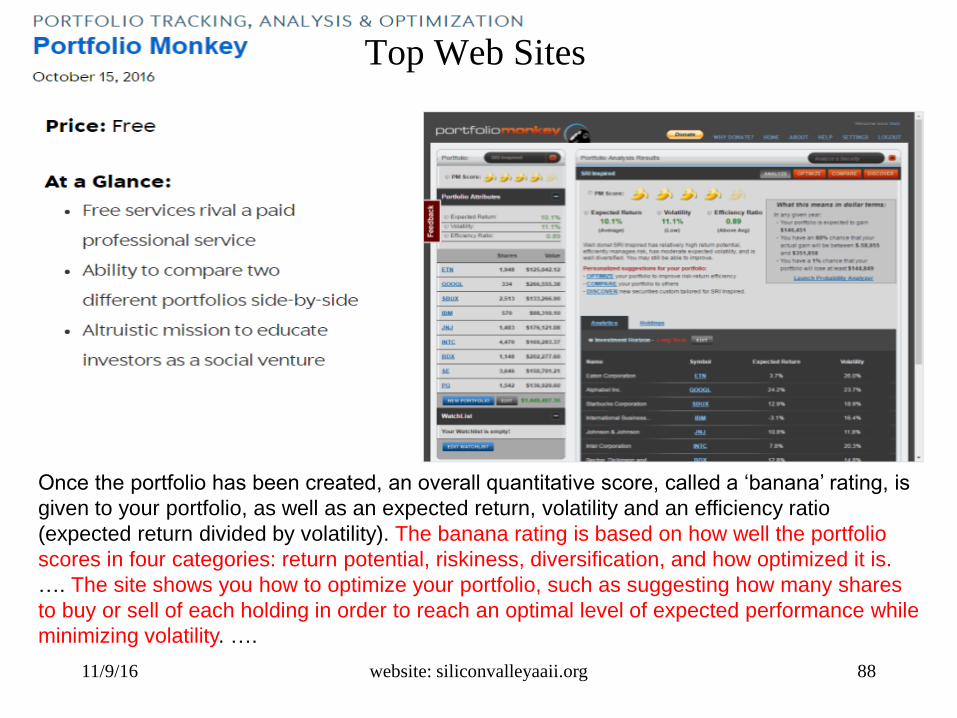
Once the portfolio has been created, an overall quantitative score, called a ‘banana’ rating, is
given to your portfolio, as well as an expected return, volatility and an efficiency ratio
(expected return divided by volatility). The banana rating is based on how well the portfolio
scores in four categories: return potential, riskiness, diversification, and how optimized it is.
…. The site shows you how to optimize your portfolio, such as suggesting how many shares
to buy or sell of each holding in order to reach an optimal level of expected performance while
minimizing volatility. ….
11/9/16 website: siliconvalleyaaii.org 89
Reference Material
11/9/16 website: siliconvalleyaaii.org
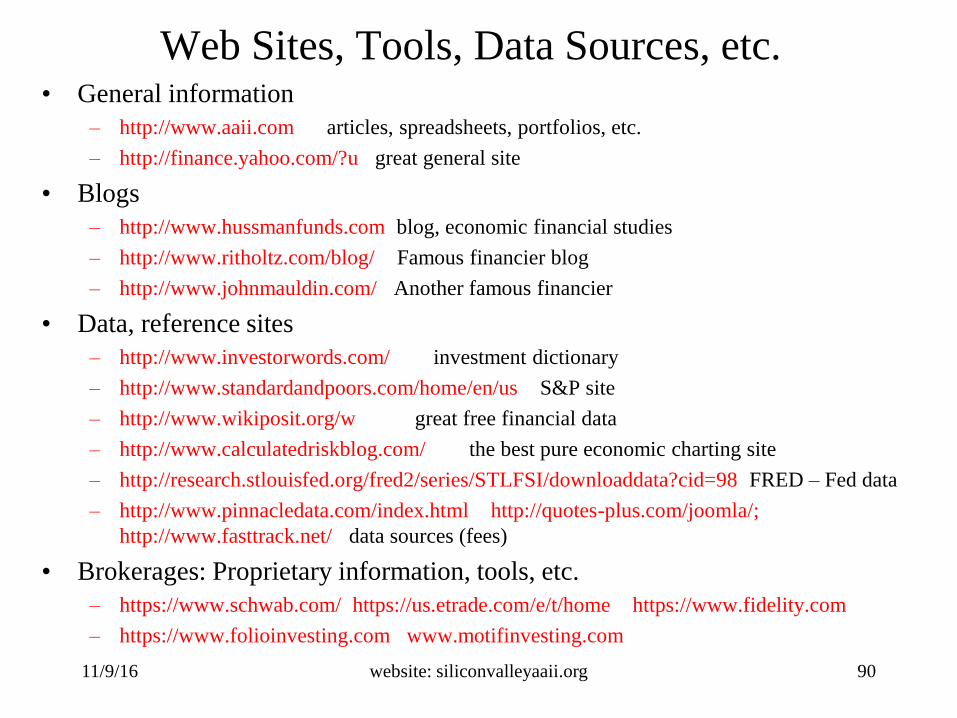
Web Sites, Tools, Data Sources, etc.• General information
– http://www.aaii.com articles, spreadsheets, portfolios, etc.
– http://finance.yahoo.com/?u great general site
• Blogs
– http://www.hussmanfunds.com blog, economic financial studies
– http://www.ritholtz.com/blog/ Famous financier blog
– http://www.johnmauldin.com/ Another famous financier
• Data, reference sites
– http://www.investorwords.com/ investment dictionary
– http://www.standardandpoors.com/home/en/us S&P site
– http://www.wikiposit.org/w great free financial data
– http://www.calculatedriskblog.com/ the best pure economic charting site
– http://research.stlouisfed.org/fred2/series/STLFSI/downloaddata?cid=98 FRED – Fed data
– http://www.pinnacledata.com/index.html http://quotes-plus.com/joomla/;
http://www.fasttrack.net/ data sources (fees)
• Brokerages: Proprietary information, tools, etc.
– https://www.schwab.com/ https://us.etrade.com/e/t/home https://www.fidelity.com
– https://www.folioinvesting.com www.motifinvesting.com
90

11/9/16 website: siliconvalleyaaii.org
Web Sites, Tools, Data Sources, etc.• Tools
– http://www.assetcorrelation.com/ Generates correlations across instruments
– http://stockcharts.com/ Draw complex charts
– http://www.google.com/ Can find anything
– http://sumgrowth.com/ momentum & timing site (fees after trial period)
– https://www.vectorvest.com/vvlogin/login.aspx back testing tool (fees)
– http://www.portfolio123.com/ back testing toll (fees)
– http://www.qmatix.com/XLQ.htm (good Excel plug-in for Yahoo! Data, SIPro)
– Excel, Visual Basic: do a lot of hacking with this tool
– SIPro: best reasonably priced stock screener out there
• Economics, Finance sites
– http://advisorperspectives.com/dshort/ mix of economic and market, very understandable, lots of fun
charts
– http://www.businesscycle.com/ ECRI – famous economic forecaster, downloadable info
– http://gfs.eiu.com/about/ monthly economic forecast (free – I think)
• Quant sites (mostly blogs)
– http://cssanalytics.wordpress.com/ Lots of algs, models, ideas
– http://www.cxoadvisory.com/ Lots of algs, models, economic forecasts, etc
– http://www.mebanefaber.com/ Faber’ blog; some algs, lots of good reading references, ideas
– http://marketsci.wordpress.com/ Lots of algs, models, ideas
– http://boards.fool.com/mechanical-investing-100093.aspx board with lots of ideas, algs
91