intro to data visualization - old dominion universitymweigle/courses/cs625-f19/01-infovis.pdftopic...
TRANSCRIPT

Intro to Data Visualization
Dr. Michele C. Weigle
CS 625Data VisualizationFall 2019
http://www.cs.odu.edu/~mweigle/CS625-F19/
Today} Before class
} Reading: Ch 1 - What's Vis, and Why Do It?
} During class} Highlight and discuss Ch 1} We will not cover everything that you are responsible for during
class time.
CS 625 - Fall 2019 - Weigle2
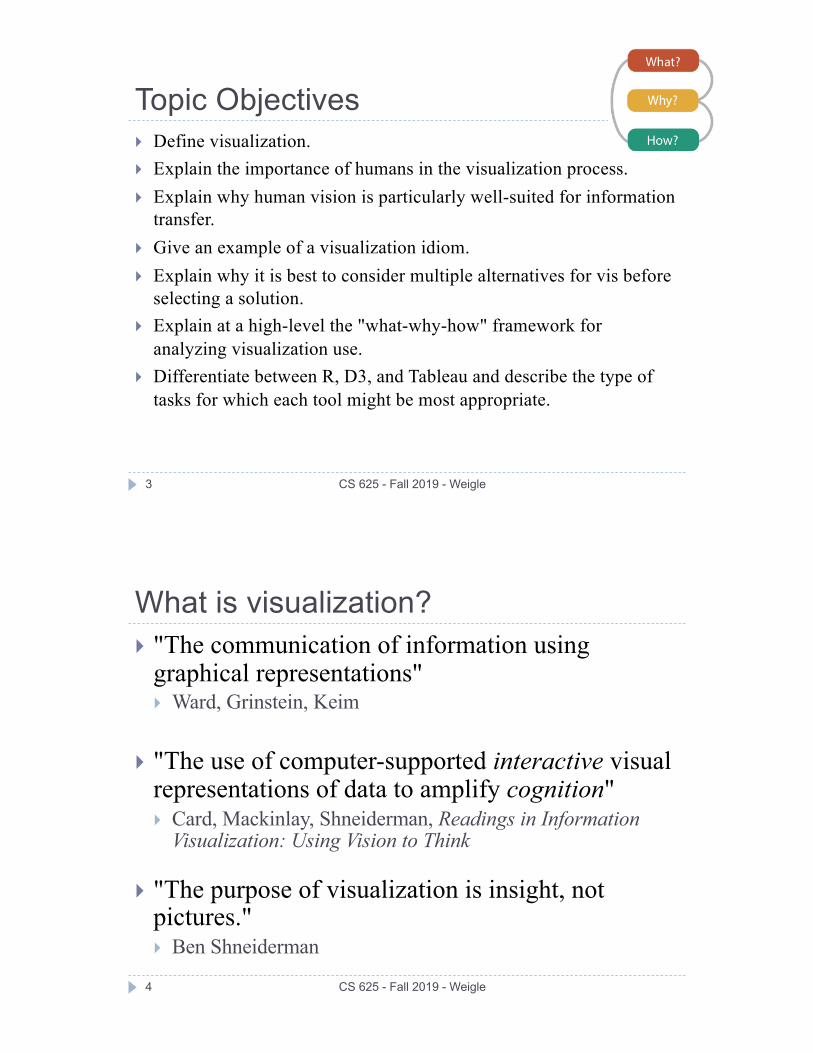
Topic Objectives} Define visualization.} Explain the importance of humans in the visualization process.} Explain why human vision is particularly well-suited for information
transfer.} Give an example of a visualization idiom.} Explain why it is best to consider multiple alternatives for vis before
selecting a solution.} Explain at a high-level the "what-why-how" framework for
analyzing visualization use.} Differentiate between R, D3, and Tableau and describe the type of
tasks for which each tool might be most appropriate.
CS 625 - Fall 2019 - Weigle3
What is visualization?} "The communication of information using
graphical representations"} Ward, Grinstein, Keim
} "The use of computer-supported interactive visual representations of data to amplify cognition"} Card, Mackinlay, Shneiderman, Readings in Information
Visualization: Using Vision to Think
} "The purpose of visualization is insight, not pictures."} Ben Shneiderman
CS 625 - Fall 2019 - Weigle4

Where have you seen a visualization today?
CS 625 - Fall 2019 - Weigle5
http://darksky.net
http://google.com/maps/
http://money.cnn.com/data/markets/
What's vis?} Visualization is suitable when there is a need to augment human
capabilities rather than replace people with computational decision-making methods.
} The design space of possible vis idioms is huge, and includes the considerations of both how to create and how to interact with visual representations.
} Vis design is full of tradeoffs, and most possibilities in the design space are ineffective for a particular task, so validating the effectiveness of a design is both necessary and difficult.
} Vis designers must take into account three very different kinds of resource limitations: those of computers, of humans, and of displays.
} Vis usage can be analyzed in terms of why the user needs it, what data is shown, and how the idiom is designed.
CS 625 - Fall 2019 - Weigle6
Munzner, pg. 1

CS 625 - Fall 2019 - Weigle7
Visualization is suitable when there is a need to augment human capabilities rather than replace people with computational decision-making methods.
Why have a human in the loop?
} Vis allows people to analyze data when they don't know exactly what questions to ask in advance.
} Best path - put a human in the loop } exploit the pattern detection properties of human
vision
CS 625 - Fall 2019 - Weigle8
augment human capabilities

Humans are great at pattern recognition
CS 625 - Fall 2019 - Weigle9
augment human capabilities
Create visualizations that lets computers do what computers do well and lets humans do what humans do well.
Uses of vis tools} Transitional
} vis works itself out of a job
} Long-term} exploratory analysis
} Presentation} visual explanations
CS 625 - Fall 2019 - Weigle10
augment human capabilities
New York Times, 2006
https://www.geovista.psu.edu/research/healthvisualization/

Why have a computer in the loop?
CS 625 - Fall 2019 - Weigle11
augment human capabilities
Munzner, Fig 1.2 (Barsky et al., 2007)
Why use an external representation?} Vis allows people to offload cognition and
memory usage to make space for other operations.
} Diagrams as external representations} information can be organized by spatial location
} search - grouping items needed for problem-solving in one location
} recognition - grouping relevant info for one item in the same location
CS 625 - Fall 2019 - Weigle12
augment human capabilities

Visualization can extend your memory
CS 625 - Fall 2019 - Weigle
paper mental buffer
57x 48
[8 * 7 = 56]5
6
[8 * 5 = 40 + 5 = 45]
45 [4 * 7 = 28]
2
8[4 * 5 = 20 + 2 = 22]
2263
[8 + 5 = 13]
1
[4 + 2 + 1 = 7]
72
13
Example courtesy Tamara Munzner, Univ. of British Columbia
What is 57 x 48?
augment human capabilities
Why depend on vision?} Visual system provides
a high-bandwidth channel to our brains.
} Significant amount of visual information processing occurs in parallel at the pre-conscious level.
CS 625 - Fall 2019 - Weigle14
augment human capabilities

Can you find the red dot?
CS 625 - Fall 2019 - Weigle15
http://www.csc.ncsu.edu/faculty/healey/PP/index.html
preattentive processing
augment human capabilities
Colorado - 6.8
Which state had the highest marriage rate?
CS 625 - Fall 2019 - Weigle16
Colorado - 6.8Connecticut - 5.9
Delaware - 5.4District of Columbia - 4.7
Florida - 7.5
augment human capabilities

Which state had the highest marriage rate?
CS 625 - Fall 2019 - Weigle
U.S. Census Bureau, Statistical Abstract of the United States: 2012https://www2.census.gov/library/publications/2011/compendia/statab/131ed/tables/vitstat.pdf,http://www2.census.gov/library/publications/2011/compendia/statab/131ed/tables/12s0133.xls
17
augment human capabilities
Why show the data in detail?} Vis tools can allow people to explore data to
find patterns or to determine if a statistical model actually fits the data
} Look out for questionable data} "just because it's numbers doesn't mean it's true"} is it a typo or something interesting?
} "make sure you know which one it is"
CS 625 - Fall 2019 - Weigle18
augment human capabilities

Anscombe's Quartet
CS 625 - Fall 2019 - Weigle19
F.J. Anscombe, "Graphs in Statistical Analysis", American Statistician, Feb 1973Munzner, Figure 1.3
augment human capabilities
ii
ii
ii
ii
8 1. What’s Vis, and Why Do It?
Anscombe’s Quartet: Raw DataI II III IV
x y x y x y x y10.0 8.04 10.0 9.14 10.0 7.46 8.0 6.588.0 6.95 8.0 8.14 8.0 6.77 8.0 5.76
13.0 7.58 13.0 8.74 13.0 12.74 8.0 7.719.0 8.81 9.0 8.77 9.0 7.11 8.0 8.84
11.0 8.33 11.0 9.26 11.0 7.81 8.0 8.4714.0 9.96 14.0 8.10 14.0 8.84 8.0 7.046.0 7.24 6.0 6.13 6.0 6.08 8.0 5.254.0 4.26 4.0 3.10 4.0 5.39 19.0 12.50
12.0 10.84 12.0 9.13 12.0 8.15 8.0 5.567.0 4.82 7.0 7.26 7.0 6.42 8.0 7.915.0 5.68 5.0 4.74 5.0 5.73 8.0 6.89
mean 9.0 7.5 9.0 7.5 9.0 7.5 9.0 7.5var. 10.0 3.75 10.0 3.75 10.0 3.75 10.0 3.75corr. 0.816 0.816 0.816 0.816
Figure 1.3: Anscombe’s Quartet is four datasets with identical simplestatistical properties: mean, variance, correlation, and linear regressionline. However, visual inspection immediately shows how their struc-tures are quite di↵erent. After [Anscombe 73], Figures 1–4. Fromhttp://en.wikipedia.org/wiki/File:Anscombe.svg
The four data sets are not the same
CS 625 - Fall 2019 - Weigle20
augment human capabilities
http://en.wikipedia.org/wiki/File:Anscombe.svg
"Graphics reveal data"- Edward Tufte, The Visual Display of Quantitative Information

Datasaurus Dozen
CS 625 - Fall 2019 - Weigle21
https://www.autodeskresearch.com/publications/samestats
CS 625 - Fall 2019 - Weigle22
The design space of possible vis idioms is huge, and includes the considerations of both how to create and how to interact with visual representations.

Why is the idiom design space huge?} Vis idioms - approaches to creating and
manipulating visual representations
} Simple examples: scatterplots, bar charts, line charts
CS 625 - Fall 2019 - Weigle23
design space of possible vis idioms is huge
45 Ways to Communicate Two Quantities
CS 625 - Fall 2019 - Weigle24
https://visual.ly/blog/45-ways-to-communicate-two-quantities/
design space of possible vis idioms is huge

datavizproject.com
CS 625 - Fall 2019 - Weigle25
design space of possible vis idioms is huge
Why use interactivity?
CS 625 - Fall 2019 - Weigle26
} Interaction allows for} handling complexity} displaying multiple aspects of a dataset
http://adilmoujahid.com/posts/2016/08/interactive-data-visualization-geospatial-d3-dc-leaflet-python/
how to interact with visual representations

CS 625 - Fall 2019 - Weigle27
Vis design is full of tradeoffs, and most possibilities in the design space are ineffective for a particular task, so validating the effectiveness of a design is both necessary and difficult.
Why focus on tasks?} The intended task is just as important as the
data to be visualized.
} Four categories of tasks} presentation} discovery} enjoyment of information} producing more information for later use
CS 625 - Fall 2019 - Weigle28
…ineffective for a particular task

Why focus on effectiveness?} Effectiveness is an important measure for
understanding if the user task was supported.} "The purpose of visualization is insight, not
pictures." -Ben Shneiderman
} But, no picture can tell the truth, the whole truth, and nothing but the truth.
CS 625 - Fall 2019 - Weigle29
most possibilities are ineffective…
Why are most designs ineffective?} Design may not match with human perception
} Design may not match with intended task
CS 625 - Fall 2019 - Weigle30
most possibilities are ineffective
Which color comprises the greatest portion?
What is the percentage of the green region?

Search space metaphor for vis design
CS 625 - Fall 2019 - Weigle31
ii
ii
ii
ii
12 1. What’s Vis, and Why Do It?
x
Consideration space
Proposal space
x
Bad!
x
x
xx
o
oo
x o
o
Good!
Space of possible solutions
Known space
Selectedsolution
x
Good solutionOK solutionPoor Solution
xo
Space of possible solutions
o
x
o
o
o
o
o
o
o
o
Figure 1.5: A search space metaphor for vis design.
The diagram shows five spaces, each of which is progressively smaller thanthe previous. First, there is the space of all possible solutions, includingpotential solutions that nobody has ever thought of before. Next, there isthe set of possibilities that are known to you, the vis designer. Of course,this set might be small if you are a novice designer who is not aware of thefull array of methods that have been proposed in the past. If you’re in thatsituation, one of the goals of this book is to enlarge the set of methods thatyou know about. The next set is the consideration space of the solutionsthat you actively consider. This set is necessarily smaller than the knownspace, because you can’t consider what you don’t know. An even smaller setis the proposal space of possibilities that you investigate in detail. Finally,one of these becomes the selected solution.
The diagram in Figure 1.5 contrasts a good strategy on the left, wherethe known and consideration spaces are large, with a bad strategy on theright, where these spaces are small. The problem of a small considerationspace is the higher probability of only considering ok or poor solutionsand missing a good one. A fundamental principle of design is to considermultiple alternatives and then choose the best, rather than to immediatelyfixate on one solution without considering any alternatives. One way toensure that more than one possibility is considered is to explicitly generatemultiple ideas in parallel. This book is intended to help you as a designerentertain a broad consideration space by systematically considering manyalternatives, and also to help you rule out some parts of the space by notingwhen there are mismatches of possibilities with human capabilities or theintended task.
As with all design problems, vis design cannot be easily handled as asimple process of optimization because tradeo↵s abound. A design thatdoes well by one measure will rate poorly on another. The characterizationof tradeo↵s in the vis design space is a very open problem at the frontier of
Munzner, Fig 1.5
most possibilities are ineffective
Why is validation difficult?} How do you know if your visualization
"works"?} How do you measure insight?
} How do you argue that one design is better than another?} What does "better" mean? faster? more fun? more
effective?} What does "effectively" mean?
CS 625 - Fall 2019 - Weigle32
validating the effectiveness is necessary and difficult

CS 625 - Fall 2019 - Weigle33
Vis designers must take into account three very different kinds of resource limitations: those of computers, of humans, and of displays.
Why are there resource limitations?
CS 625 - Fall 2019 - Weigle34
} computational capacity
} human perceptual and cognitive capacity
} display capacity
http://bigdata-madesimple.com/30-simple-data-visualization-tools/
take into account resource limitations

CS 625 - Fall 2019 - Weigle35
Vis usage can be analyzed in terms of why the user needs it, what data is shown, and how the idiom is designed.
Why analyze vis?} Analyzing existing systems is a good stepping
stone to designing new ones.
} High-level framework for analyzing vis use} what data the user sees} why the user intends to use a vis tool} how the visual encoding and interaction idioms are
constructed in terms of design choices
CS 625 - Fall 2019 - Weigle36

Tools
CS 625 - Fall 2019 - Weigle37
Workflow} What
} data gathering} data wrangling
} Why} developing questions} initial analysis
} How} charts for analysis} charts for presentation
CS 625 - Fall 2019 - Weigle38

https://www.census.gov/library/publications/2011/compendia/statab/131ed/births-deaths-marriages-divorces.html
What: Data Gathering
CS 625 - Fall 2019 - Weigle39
} Tabula – extract tables from PDFs
} Beautiful Soup –extract data from webpages
What: Data Wrangling} Data is often messy
} Tools} Excel} OpenRefine – filter and clean data files
} Much more on this next week
CS 625 - Fall 2019 - Weigle40

Why} Developing questions
} which states have the highest marriage rates? } which states have the highest divorce rates? is that
correlated to marriage rate?} which states have the highest birth rates? is that
correlated to marriage rate?
} Initial analysis} Excel} Google Sheets, Google Charts} Tableau} R
CS 625 - Fall 2019 - Weigle41
How} Charts for analysis
} Charts for presentation
CS 625 - Fall 2019 - Weigle42
New York Times, 2006
https://www.geovista.psu.edu/research/healthvisualization/

Excel
CS 625 - Fall 2019 - Weigle
http://chandoo.org/wp/2008/09/03/6-charts-to-never-use/
http://www.juiceanalytics.com/writing/recreating-ny-times-cancer-graph/
43
CS 625 - Fall 2019 - Weigle
http://www.r-project.org
44

Tableau
CS 625 - Fall 2019 - Weigle45
https://www.tableau.com/academic/students
D3
CS 625 - Fall 2019 - Weigle
http://d3js.org
46

Vega and Vega-Lite} Vega is a visualization
grammar, built on top of D3
} Vega-Lite is a higher-level language built on top of Vega
CS 625 - Fall 2019 - Weigle47
https://vega.github.io/vega/https://vega.github.io/vega-lite/
https://vega.github.io/vega/examples/bar-chart/
https://vega.github.io/vega-lite/examples/bar.html
Observable
CS 625 - Fall 2019 - Weigle48
https://observablehq.com

My Observable Notebooks
CS 625 - Fall 2019 - Weigle49
https://observablehq.com/@weiglemc
Choosing Tools – datavisualization.ch
CS 625 - Fall 2019 - Weigle50
http://selection.datavisualization.ch

Choosing Tools – chartmaker directory
CS 625 - Fall 2019 - Weigle51
http://chartmaker.visualisingdata.com
What I Learned Recreating One Chart Using 24 Tools
CS 625 - Fall 2019 - Weigle52
https://source.opennews.org/en-US/articles/what-i-learned-recreating-one-chart-using-24-tools/

Tools for Analysis vs. Presentation
CS 625 - Fall 2019 - Weigle53
https://source.opennews.org/en-US/articles/what-i-learned-recreating-one-chart-using-24-tools/
Flexibility of Tools
CS 625 - Fall 2019 - Weigle54
https://source.opennews.org/en-US/articles/what-i-learned-recreating-one-chart-using-24-tools/

Apps vs. Libraries and Static vs. Interactive
CS 625 - Fall 2019 - Weigle55
https://source.opennews.org/en-US/articles/what-i-learned-recreating-one-chart-using-24-tools/
One Chart, Nine Tools – Revisited
CS 625 - Fall 2019 - Weigle56
https://lisacharlotterost.github.io/datavistools-revisited

Topic Objectives} Define visualization.} Explain the importance of humans in the visualization process.} Explain why human vision is particularly well-suited for information
transfer.} Give an example of a visualization idiom.} Explain why it is best to consider multiple alternatives for vis before
selecting a solution.} Explain at a high-level the "what-why-how" framework for
analyzing visualization use.} Differentiate between R, D3, and Tableau and describe the type of
tasks for which each tool might be most appropriate.
CS 625 - Fall 2019 - Weigle57