intro to matlab programming
TRANSCRIPT

MATLAB
Programming
By : Ahmed Moawad

LET’S BEGIN……
MATLAB is a tool that simplify the programming than
any other programming language like c , c# , …….
Let’s begin with first function in MATLAB …
And the most helpful Fn .
>> help ;
this function gives you a very useful tutorial ,
and information about using MATLAB in every
applications.
1

FIRST TIME : HOW TO INPUT A MATRIX OR
VECTOR IN MATLAB
Vector :
>> x = [1 2 3 4]
x = 1 2 3 4
o Matrix :
>> y = [1 2 3 ; 5 1 4 ; 2 3 1]
y = 1 2 3
5 1 4
2 3 1
2

CHARACTERISTICS OF MATRIX
Transpose :
>> xt = x ’ convert the columns to rows and vice versa
x = 1
2
3
4
>> x = [1 : 5]
x = 1 2 3 4 5 this is the step of increment
>>x = [1 : 2 : 5]
x = 1 3 5 3

CONTINUE……
>>size (y) Number of columns and rows
>>length(y) The tallest dimension(row , column) of Matrix
>>z = y( 2 , 2:3 ) Choose the second & third columns.
z = 1 4 Choose the second row.
>>zeros(M ,N); Matrix consists of zeros
>>ones(M,N); Matrix consists of ones
>>eye(M,N) ; The main diameter of Matrix is ones , others zeros
>>rand (M,N) ; Uniform Distribution
>>randn (M,N); Normally Disribution
1
5
4

OPERATORS
Scalar Arithmetic Operations :
>> z = x * y; multiply every element in x to its corresponding in y.
Matrices Arithmetic Operations:
>> z = x .* y ; multiply as matrices rules ,with condition (Num. of rows
of x = Num. of columns of y)
+ .+ Summation
- .- Subtraction
/ ./ Division
^ .^ Exponential
5

FUNCTIONS BREAK (1):
>>sign(x) ; If an element in matrix x is +ve returns 1 ,-ve returns
-1.
>>exp (2) The exponential function.
ans = 7.3891
round (x); Approximate the number x to the nearest number
Fix (x) ; Delete the fraction (1.2>>1, 1.6 >>1)
Abs(complex ); Magnitude of complex number
Angle(comp.); Angle of complex number
Real(complex); Real part of complex.
isprime(x) ; 0 for not , 1 for prime number
6

FLOW CONTROL FUNCTIONS
For loop:
i.e.:
>>a=3; initial value of b
>>for i = 1 :1: 10; initial : step : final
a=a +i;
end
>> disp(a); Fn. that display the value of a
>>sprintf (‘the number of icons is = %g ’ , a)
print the sentence ‘ ’ , replaces the %g by a
7

CONTINUE …. While loop:
i.e.:
>>b =0; initial value of b
>>while b<4 carry out if b <4 , stop if else
b=b+1;
end
>>weight = b*2.2;
>>disp(b);
>>sprintf(‘The weight equals %f ’ , weight)
weight is float type8

CONTINUE ….. If Statement:
i.e.:
degree =input(‘please insert the degree(0-100): ’)
fn. that make user input the value which preferred
if degree>= 85
disp(‘Excellent’)
elseif( degree>= 75 & degree <85)
disp(‘very good’)
elseif( degree>= 65 & degree <75)
disp(‘good’)
elseif( degree>= 50 & degree <65)
disp(‘pass’)
else
disp(‘fail’)
end 9

CONTINUE …… Switch …case:
i.e.:
month= input (‘please input the month(1-12): ’)
switch month
case { 1,3,5,7,8,10,12} more than one case>> {1,2,…..}
disp (31)
case{4 , 6 ,9 ,11}
disp (30)
case 2 only one case>> 1
disp (28)
end10

FUNCTION BREAK(2):
>>Str = ‘ the sentence you want to write’
>>w = str [ 1 2 5 7 9]
w = thsne
x(2) = 4 change the second element value in the matrix x to 4.
X(3) = [ ] delete the third element .
mean(x) The mean of elements of x .
std(x) The standard diversion of elements of x.
[theta phi r ] = cart2sph [2 , 3 , 5]
any names indicates the sph. Conversion fn. the values of Cartesian coordinates
11

GRAPHS
Line plot :
i.e.:
>>t = [ 0 : 10 ];
>> y = sin(t); y is sinusoidal wave on t
>>Figure(1) Open figure , name it 1
>>plot (t,y) plot t(h-axis) versus y (v-axis) in figure.
>>xlabel(‘time’) write 9time) under h-axis
>>ylabel(‘input’) write (input) beside v-axis
>>title (‘Gain’) Make a title for plot
12

CONTINUE …. Bar Graph:
i.e.:
>>x = -3 : 1 : 3;
>>y = x.^2;
>>bar(x,y) Bar Graph
>>figure(1)
>>subplot 221 divide the figure into number of plots
>>z= magic (3); special function
>>subplot 222 row no. column no. position
>>bar(z)
>>subplot (2,2,3)
>> bar(z , ‘grouped’) Style type
>>subplot(2,2,4)
>>bar (z , ‘stacked’)13

CONTINUE ….. Histogram :
>> hist (z , 7 ) Number of intervals in histogram
Pie Graph :
>>z = [10 4 5 8 2];
>>pie(z)
Polar Graph :
>>polar(t , y)
14

CONTINUE …… Scatter plot :
>>x =[1:10];
>> y = 2.*rand (1,10)
>>subplot 221
>>scatter(x ,y) scatter points on plot
>>subplot 222
>> stem ( x , y) scatter points connected with the h-axis
>>subplot 223
>>scatter(x ,y , 3 , ‘y’ ) Mark color (yellow)
size of mark (scatter point)15
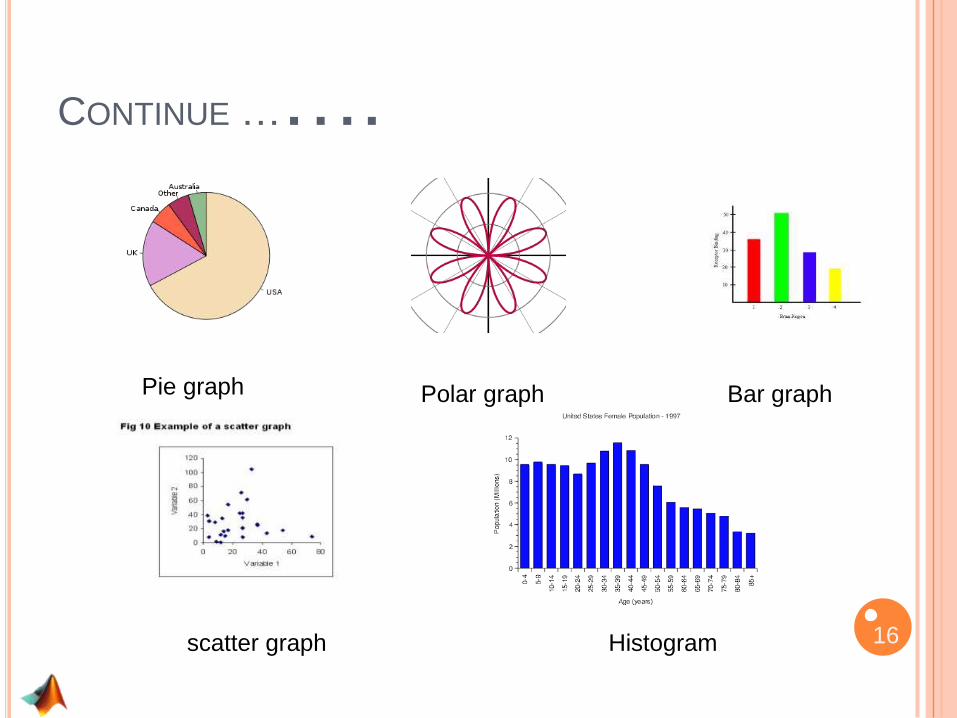
CONTINUE …….
Pie graph Polar graph Bar graph
Histogramscatter graph 16
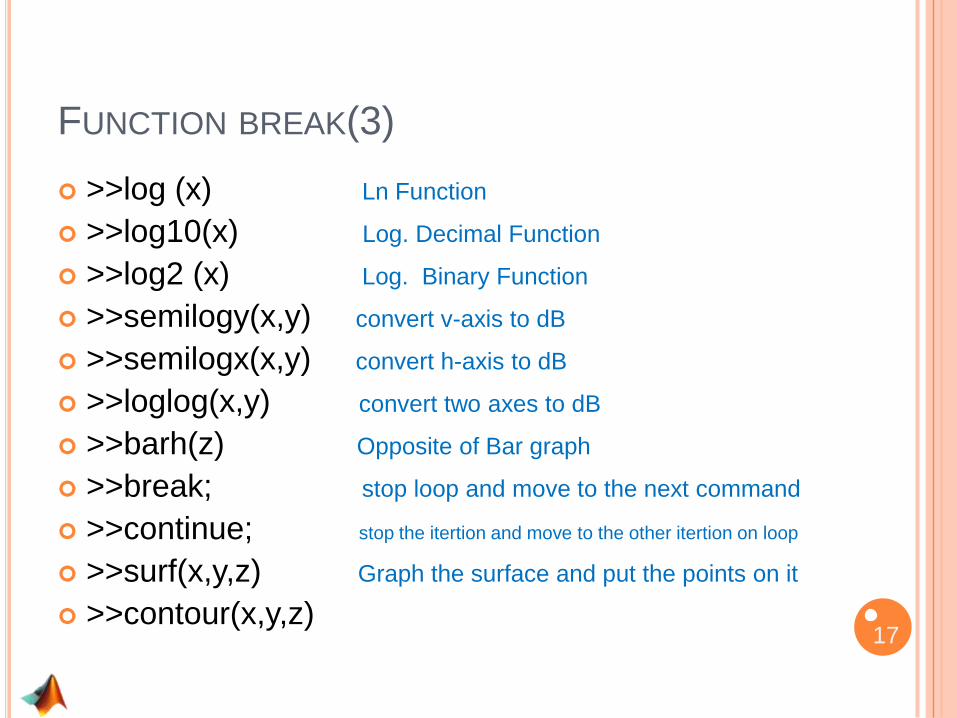
FUNCTION BREAK(3)
>>log (x) Ln Function
>>log10(x) Log. Decimal Function
>>log2 (x) Log. Binary Function
>>semilogy(x,y) convert v-axis to dB
>>semilogx(x,y) convert h-axis to dB
>>loglog(x,y) convert two axes to dB
>>barh(z) Opposite of Bar graph
>>break; stop loop and move to the next command
>>continue; stop the itertion and move to the other itertion on loop
>>surf(x,y,z) Graph the surface and put the points on it
>>contour(x,y,z) 17

SYMBOLIC MATH :
Functions: >>syms x y z ; convert this variables into symbols
>>f = x^2 + y^2 +z^2;
Substitution the symbols you want substitute
>>f1 = subs( f , [x y] , [4 5] ) the values of substitution
f1 = 16 + 25+z^2
Differentiation
>>f2 = diff ( f , 2 , z ) The symbol you want to diff.
f2 = 2 The order of diff.
Integration
>>f3 = int (f1 , -10 , 10 ) Final limit
f3 = 5 initial limit
Limit Fn
>>limit ( sin (x) /x , inf ) the value the limit approximate to
Summation
>>symsum( 1 / x^2 , 1 , inf ) the final sub . of summation
the initial sub. of summation18

DOMAINS TRANSFORMS :
Laplace Transform :
>>syms t ;
>> laplace ( cos (t)) laplace transform
Ans = s / (s^2 +1)
>>ilaplace (s/ (s^2 +1) inverse laplace transform
Ans = cos t
>>transferfn = tf ([1] , [1 2 1]) transfer fn.
Transfer function = 1 / s^2 + 2* s + 1
>> bode(transferfn) Bode plot
>> step(transferfn) Step response
>> impulse (transferfn) Impulse response19

CONTINUE …. Fourier Transform :
>>syms t w b ;
>>y = cos(b*t);
>> f = fourier (x , t ,w );
>>y = cos( 2*pi *t);
>>fd = fft ( y , 512 );
must be 2^n
20

THANK YOU