intro to r - umiacsusers.umiacs.umd.edu/.../lectures/lect20_rintro/rintro.pdfr environment...
TRANSCRIPT

Intro to RHéctor Corrada Bravo CMSC702 Spring 2014 University of Maryland
Computer Science

http://www.nytimes.com/2009/01/07/technology/business-computing/07program.html?_r=2&pagewanted=1
http://www.forbes.com/forbes/2010/0524/opinions-software-norman-nie-spss-ideas-opinions.html
http://www.theregister.co.uk/2010/05/06/revolution_commercial_r/

Some history
• John Chambers and others started developing the “S” language in 1976
• Version 4 of the language definition(currently in use) was settled in 1998
• That year, “S” won the ACM Software System Award
Some history
• Ihaka and Gentleman (of NYTimes fame) create R in 1991
• They wanted lexical scoping (see NYTimes pic)
• Released under GNU GPL in 1995
• Maintained by R Core Group since1997

Languages used in Kaggle (prediction competition site)
Currently

• Freely available: http://www.r-project.org/
• IDEs:
• [cross-platform] http://rstudio.org/
• [Windows and Linux] http://www.revolutionanalytics.com/
• Also bindings for emacs [http://ess.r-project.org/] and plugin for eclipse [http://www.walware.de/goto/statet]

• Resources:
• Manuals from r-project http://cran.r-project.org/manuals.html
• Chambers (2008) Software for Data Analysis, Springer.
• Venables & Ripley (2002) Modern Applied Statistics with S, Springer.
• List of books: http://www.r-project.org/doc/bib/R-books.html

• Uses a package framework (similar to Python)
• Divided into two parts
• base: what you get when you download R (base package, and other packages like stats, graphics, utils, Matrix, boot,codetools)
• everything else:
• [http://cran.r-project.org/]
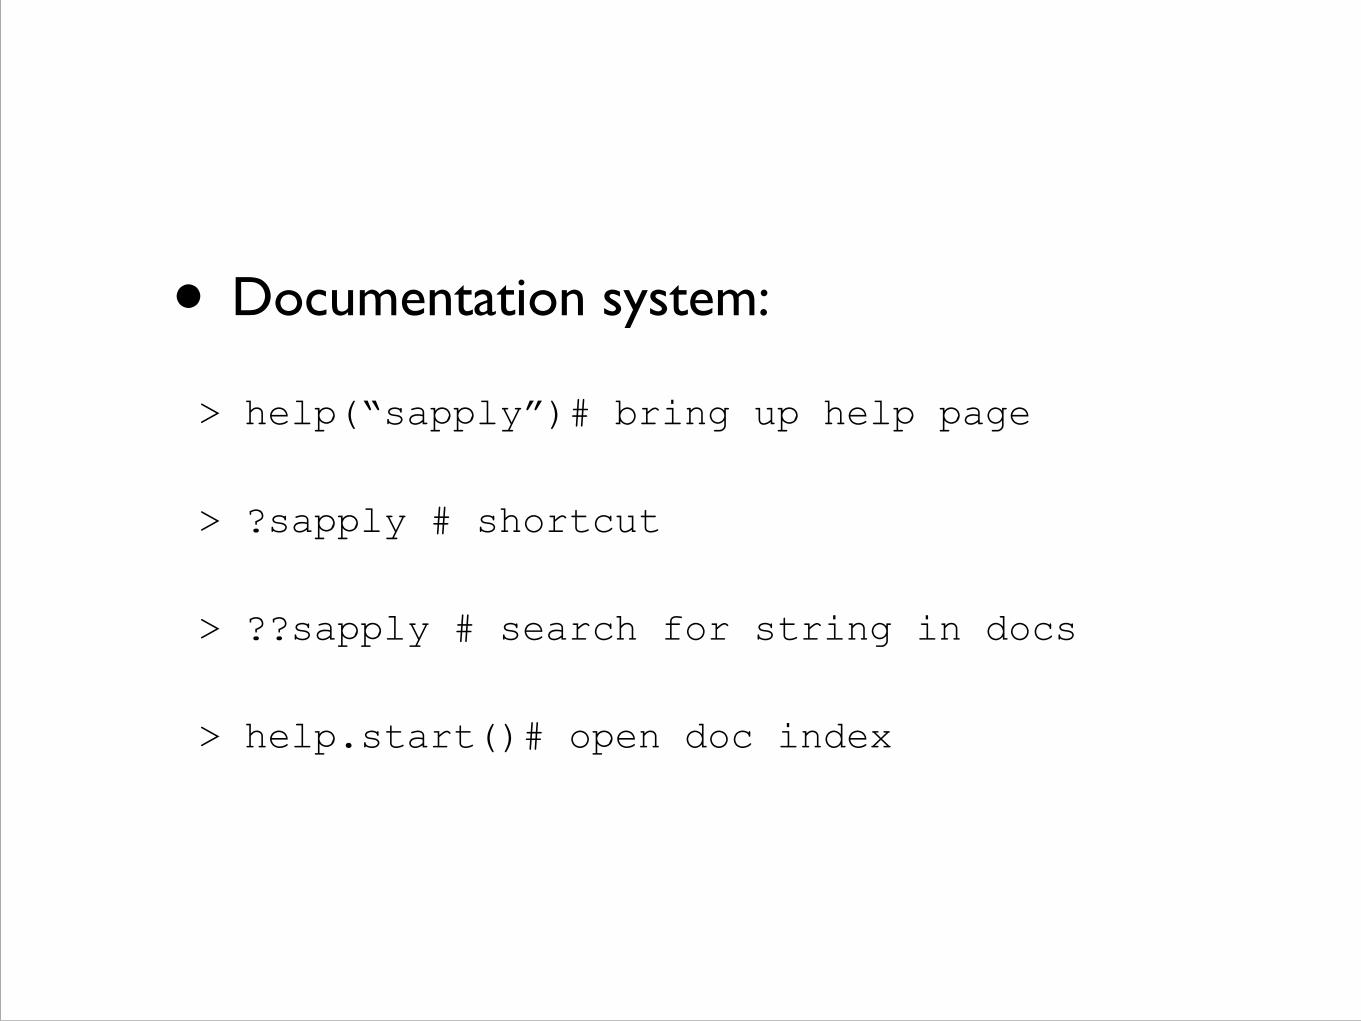
• Documentation system:
> help(“sapply”)# bring up help page
> ?sapply # shortcut
> ??sapply # search for string in docs
> help.start()# open doc index

• Three ways of thinking required
• Numerical computing (e.g., like Matlab)
• Functions and lists (e.g., like Lisp and Scheme)
• Data tables (e.g., like SQL)

vectors (numerical computing)
# creating vec = c(1,10,20) vec = 1:100 vec = seq(1,100,by=2) vec = rnorm(100) !# indexing vec[1] vec[1:10] !# operations are vectorized sum(vec) mean(vec) vec/10 crossprod(vec) tcrossprod(vec) !# gotcha: scalars are vectors of size 1 is.vector(1) # TRUE
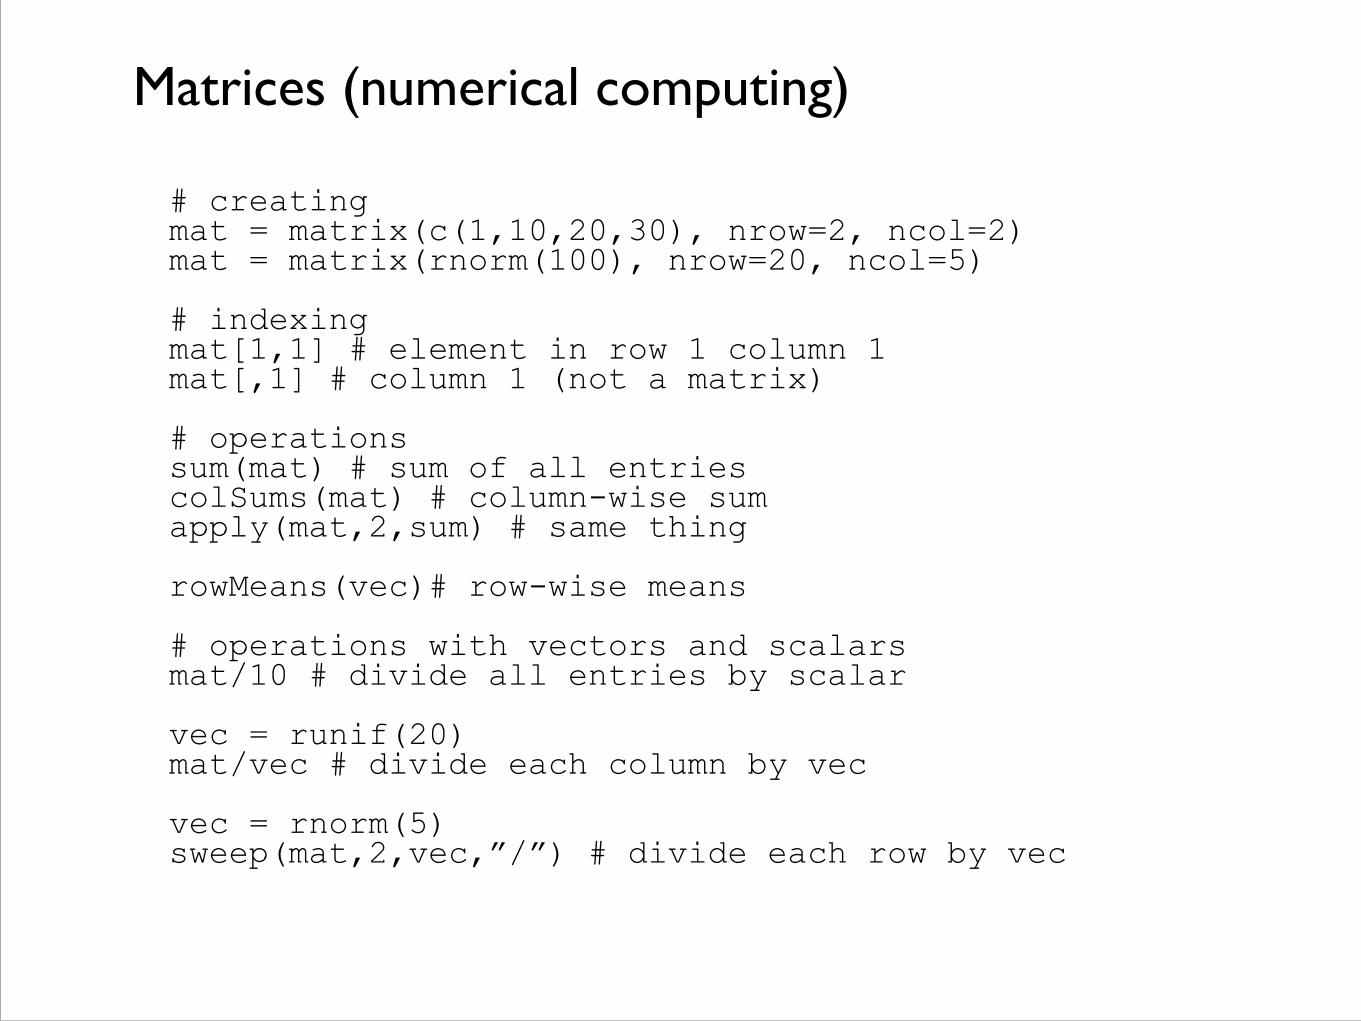
Matrices (numerical computing)
# creating mat = matrix(c(1,10,20,30), nrow=2, ncol=2) mat = matrix(rnorm(100), nrow=20, ncol=5) !# indexing mat[1,1] # element in row 1 column 1 mat[,1] # column 1 (not a matrix) !# operations sum(mat) # sum of all entries colSums(mat) # column-wise sum apply(mat,2,sum) # same thing !rowMeans(vec)# row-wise means !# operations with vectors and scalars mat/10 # divide all entries by scalar !vec = runif(20) mat/vec # divide each column by vec !vec = rnorm(5) sweep(mat,2,vec,”/”) # divide each row by vec !!

• All your linear algebra operations:
• crossproducts, matrix inverses, decompositions (QR, Cholesky, eigenvalue)
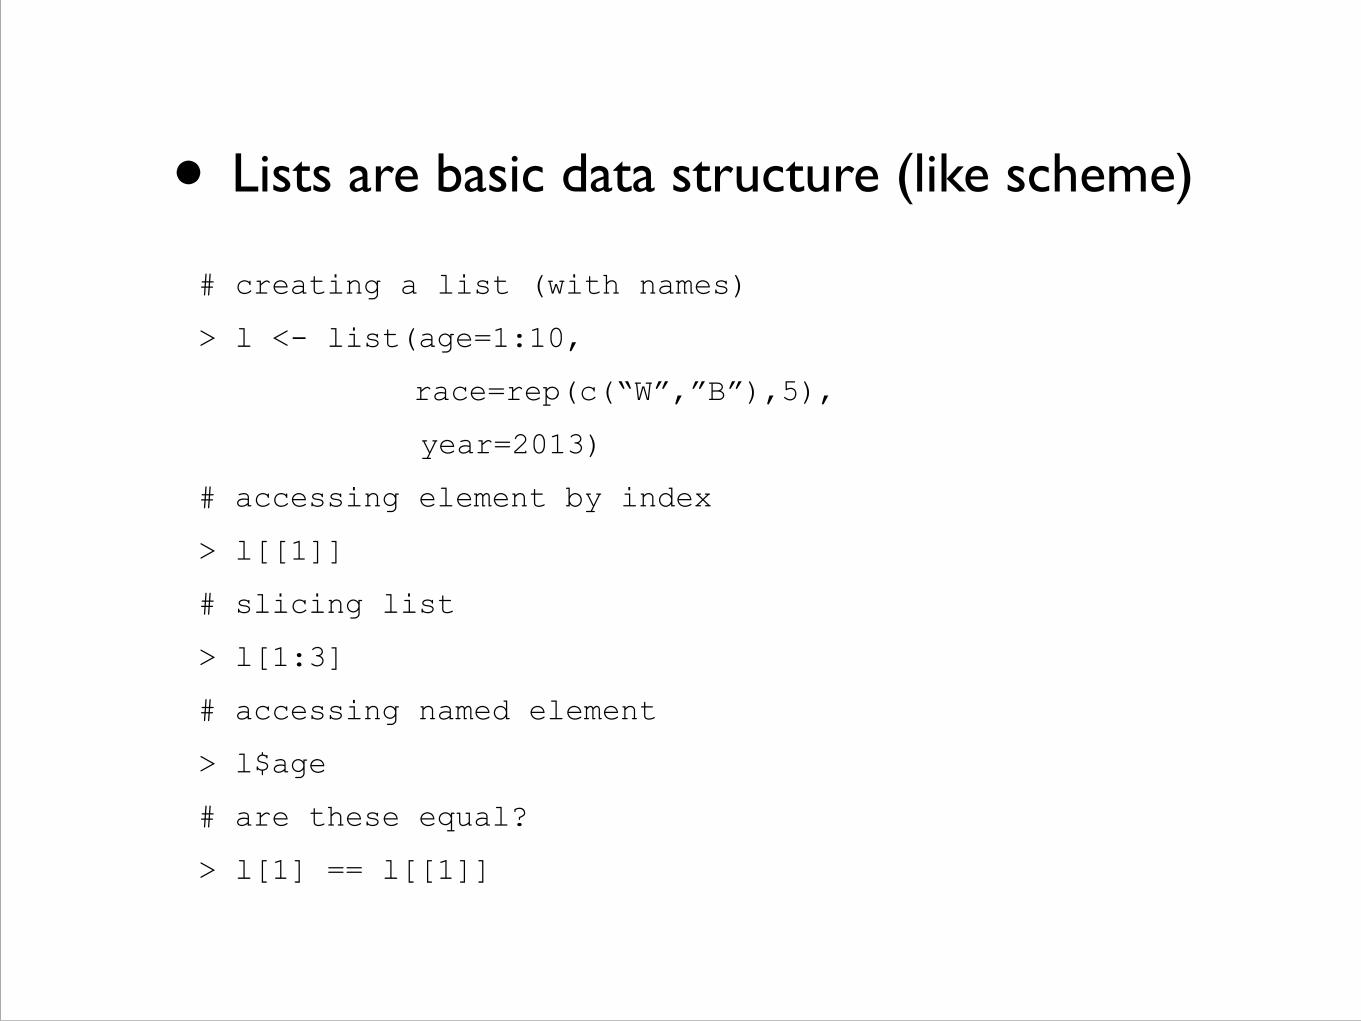
• Lists are basic data structure (like scheme)
# creating a list (with names)
> l <- list(age=1:10,
race=rep(c(“W”,”B”),5),
year=2013)
# accessing element by index
> l[[1]]
# slicing list
> l[1:3]
# accessing named element
> l$age
# are these equal?
> l[1] == l[[1]]
!

Function definition
locationGrid <- function(tab, gridSize=50) #default value, call can omit {
<body> }
Function call
locationGrid(tab)
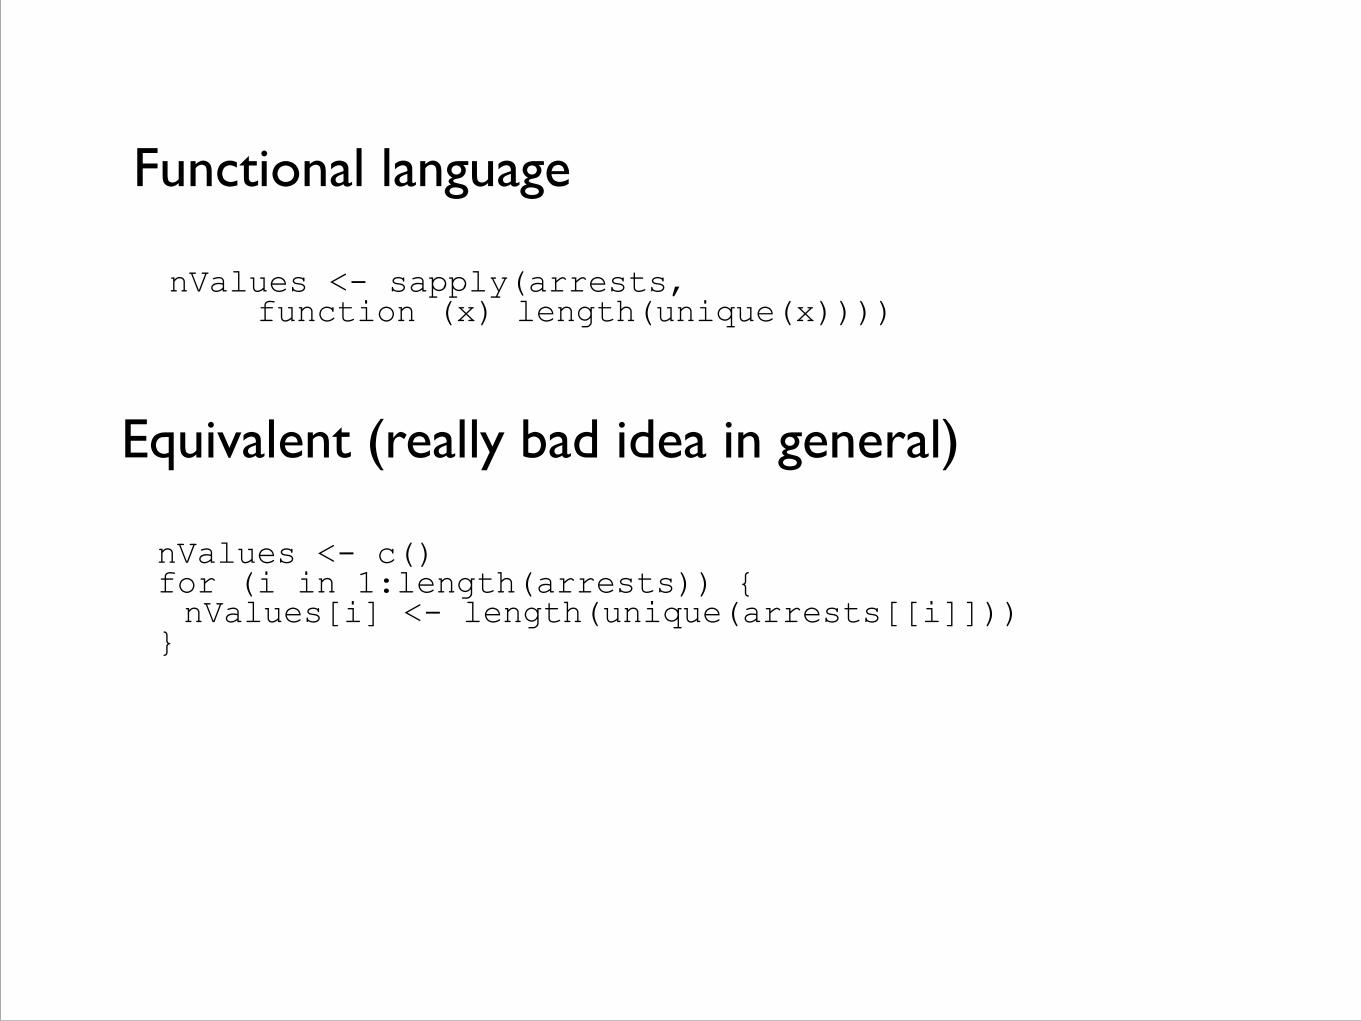
Functional language
nValues <- sapply(arrests, function (x) length(unique(x))))
Equivalent (really bad idea in general)
nValues <- c() for (i in 1:length(arrests)) { nValues[i] <- length(unique(arrests[[i]])) }

Data frames: a hybrid of matrix and list # creating (looks like a named list) arrests=data.frame(age=1:10,
race=rep(c(“W”,”B”),10), year=2013)
# accessing # like a list arrests[[1]] # the first element (column) arrests$age # a named element (column) names(arrests) # the names of elements (columns) !# like a matrix arrests[1,1] # the first value in first column arrests[,1] # the entire first column !
[named] list components are vectors of the same length => treated as columns in a matrix
Checkout dplyr package for a new powerful data table operation library
(https://github.com/hadley/dplyr)
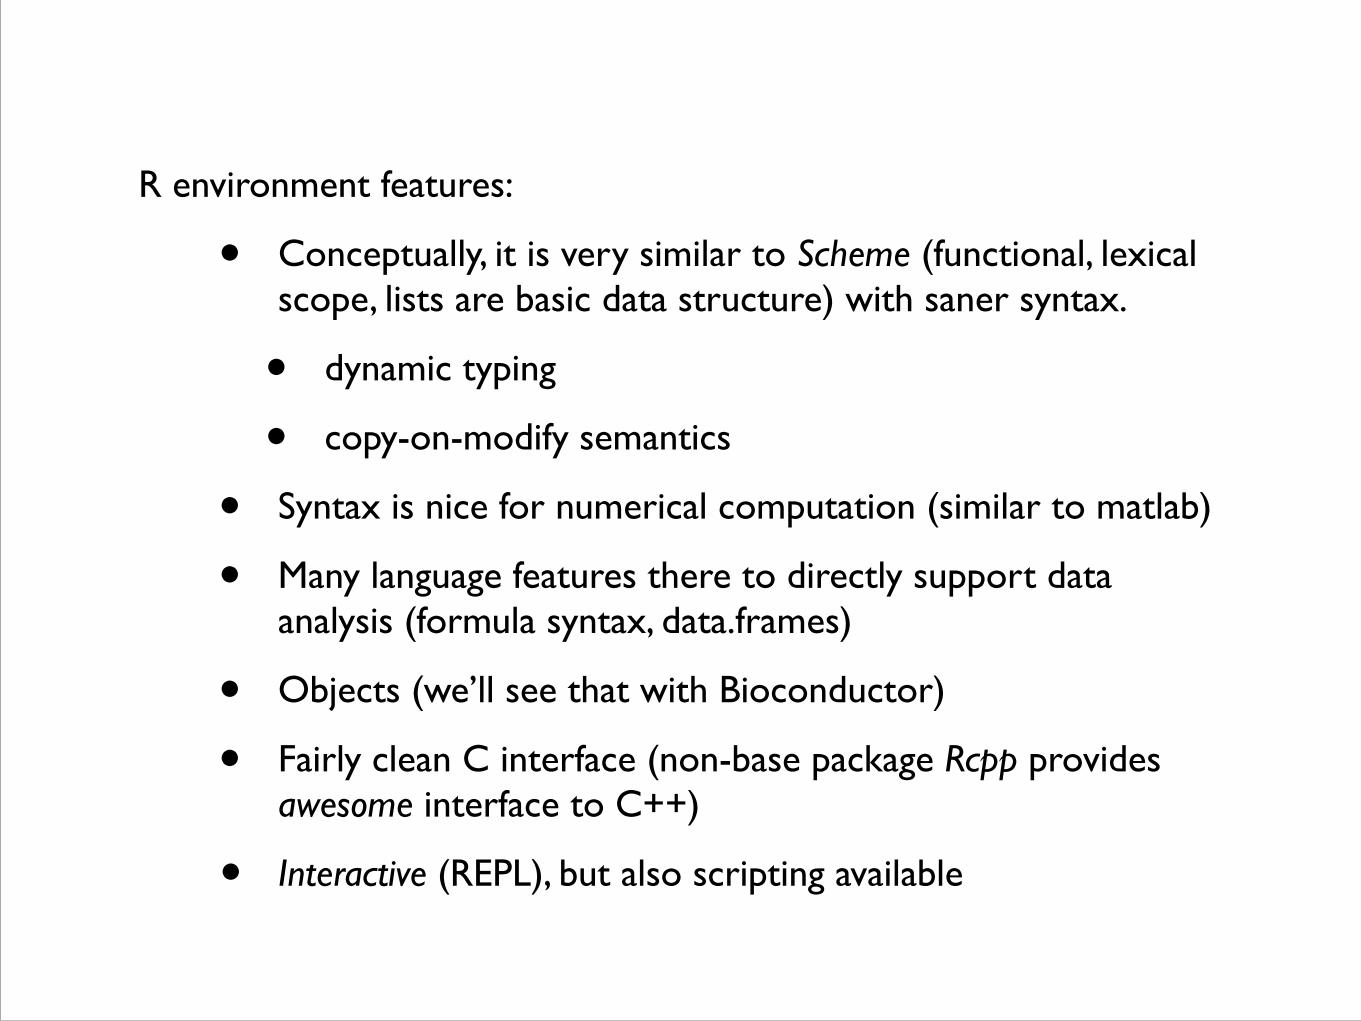
R environment features:
• Conceptually, it is very similar to Scheme (functional, lexical scope, lists are basic data structure) with saner syntax.
• dynamic typing
• copy-on-modify semantics
• Syntax is nice for numerical computation (similar to matlab)
• Many language features there to directly support data analysis (formula syntax, data.frames)
• Objects (we’ll see that with Bioconductor)
• Fairly clean C interface (non-base package Rcpp provides awesome interface to C++)
• Interactive (REPL), but also scripting available

• Plotting: there are three graphics system in R:
• graphics: the base system (which we’ll use today)
• lattice: a very flexible system (uses statistical model syntax we’ll see later)
• ggplot2: very pretty, very extensible (grammar of graphics)
• R graph gallery: http://addictedtor.free.fr/graphiques/
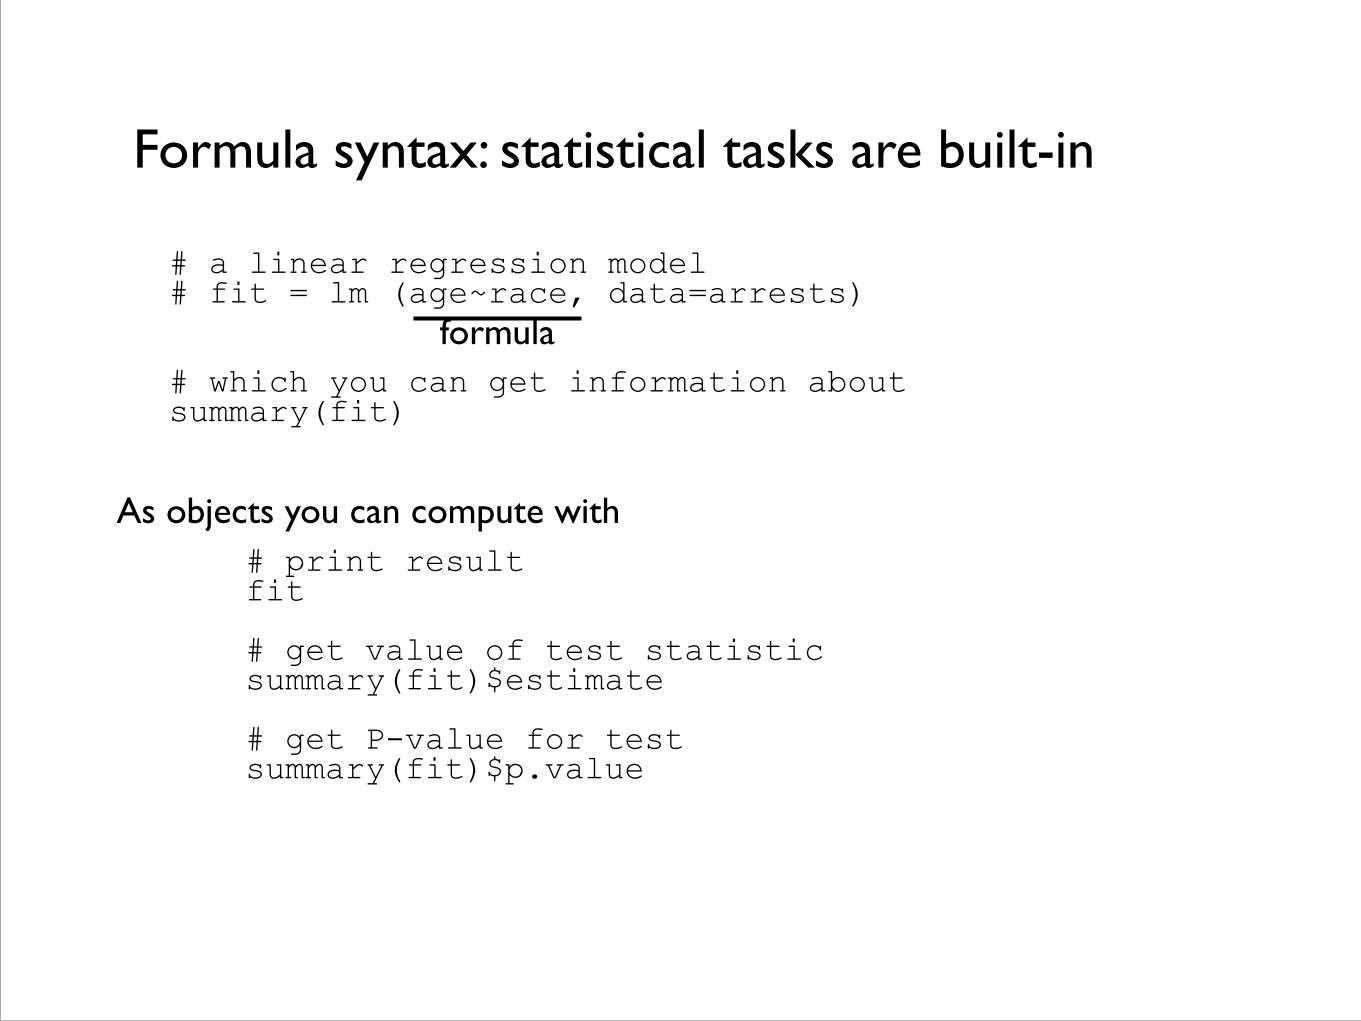
Formula syntax: statistical tasks are built-in
# a linear regression model # fit = lm (age~race, data=arrests) !!# which you can get information about summary(fit) !
!
formula
# print result fit !# get value of test statistic summary(fit)$estimate !# get P-value for test summary(fit)$p.value
As objects you can compute with
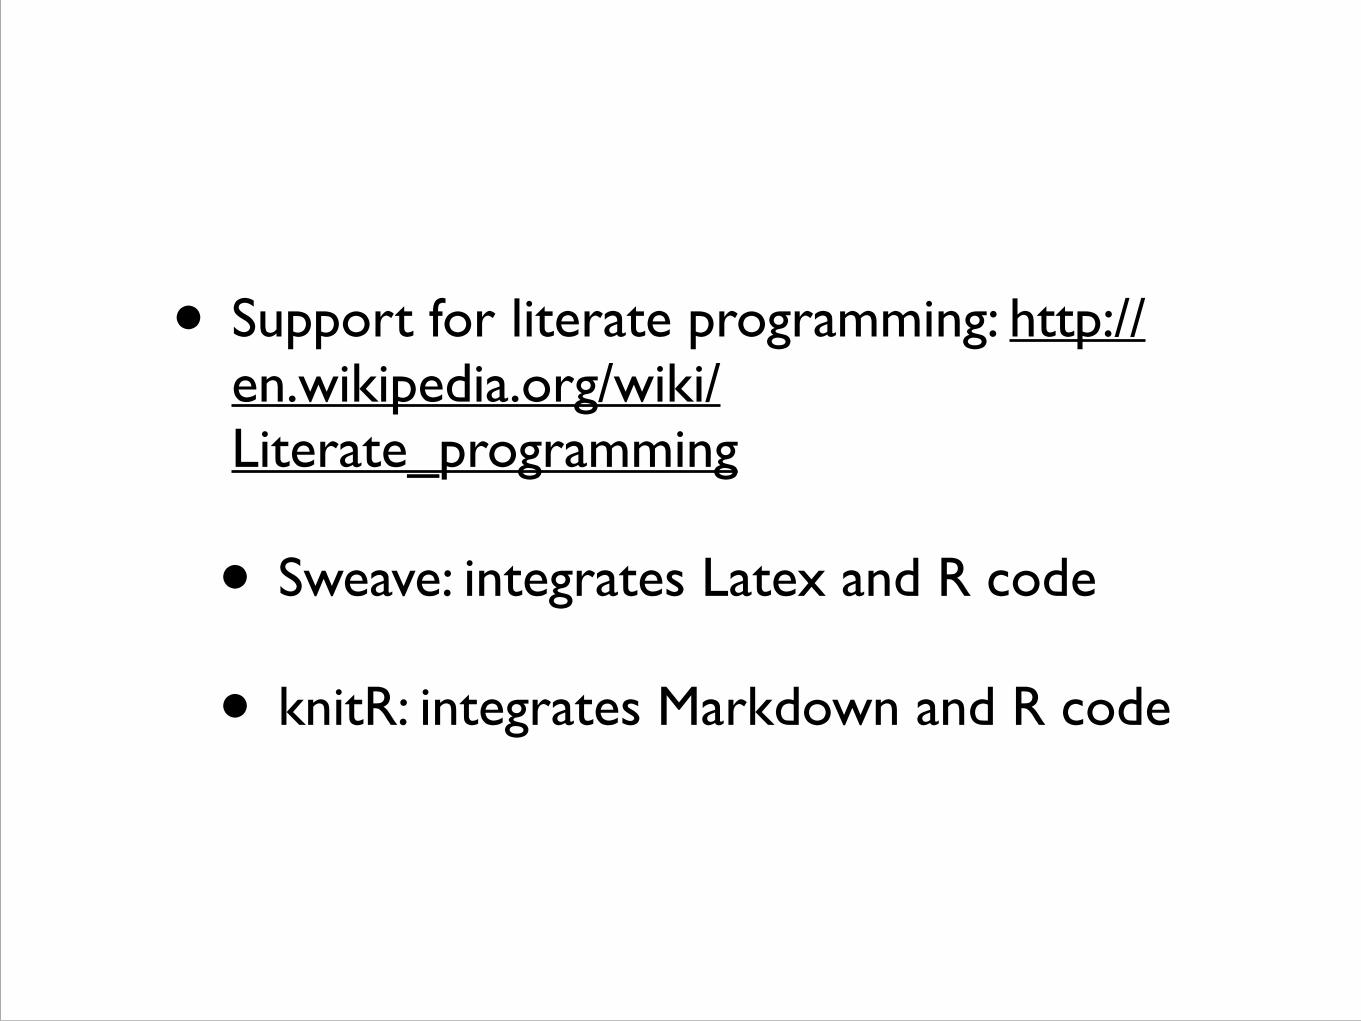
• Support for literate programming: http://en.wikipedia.org/wiki/Literate_programming
• Sweave: integrates Latex and R code
• knitR: integrates Markdown and R code

• Summary:
• functional programming paradigm
• data analysis support: data frames, model formula syntax, built-in statistical tests
• data management support: efficient indexing, subsetting, aggregation
• support for parallel computing available and rapidly improving
• outstanding graphics support
• growing external libraries, awesome community
• support for data-centric web applications rapidly developed (shiny)
• Alternatives:
• Python (with Pandas library, http://pandas.pydata.org/)
• Julia (http://julialang.org/)
• CSers are paying attention:
• PL semantics study: (http://r.cs.purdue.edu/pub/ecoop12.pdf)
• re-implementations: fastr (https://github.com/allr/fastr), renjin (http://www.renjin.org/)
• A few extra pointers:
•Advanced R Programming: http://adv-r.had.co.nz/!
•John Cook’s Intro: www.johndcook.com/R_language_for_programmers.html!
•The Art of R Programming: http://heather.cs.ucdavis.edu/~matloff/132/NSPpart.pdf!
•Why and how people use R: http://channel9.msdn.com/Events/Lang-NEXT/Lang-NEXT-2012/Why-and-How-People-Use-R?format=html5
• One more thing:
• Check piazza, I’ll post part of HW1 tomorrow
• Play with the Baltimore data