introducing financial analysis
TRANSCRIPT

INTRODUCING FINANCIAL ANALYSIS
T.VENKATARAMANAN. FICWA.FCS.

Executive Overview
WHY?
Why bother with financial analysis ?what tools and techniques ?
How it helps decision making?A Practical Example.

The Three uses
1.Is the project going to make money?
2. Demonstrating Additionality
3.The choice: The structuring of the project

Profit & loss plan & revenue plans
Beware of little expenses ; a small leak will sink a great ship
Projects cost money- outflow
Projects generate inflows
The differencebetween profit flow and cash flow.
Arrive at net cash flow
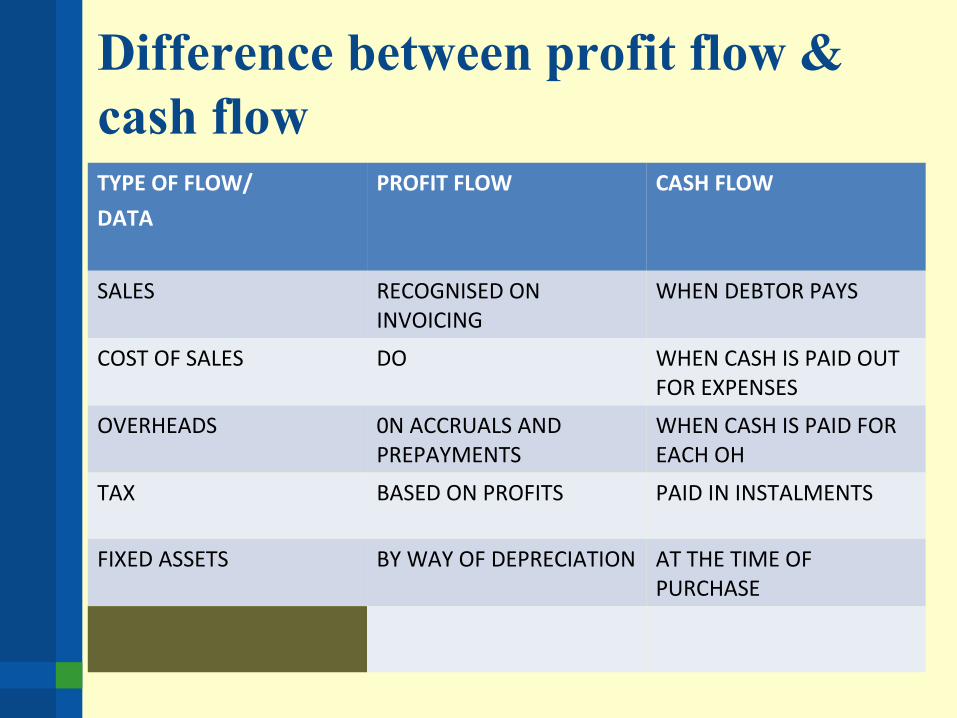
Difference between profit flow & cash flowTYPE OF FLOW/
DATA
PROFIT FLOW CASH FLOW
SALES RECOGNISED ON INVOICING
WHEN DEBTOR PAYS
COST OF SALES DO WHEN CASH IS PAID OUT FOR EXPENSES
OVERHEADS 0N ACCRUALS AND PREPAYMENTS
WHEN CASH IS PAID FOR EACH OH
TAX BASED ON PROFITS PAID IN INSTALMENTS
FIXED ASSETS BY WAY OF DEPRECIATION AT THE TIME OF PURCHASE

FREE CASH FLOW
OPERATING PROFIT
CHANGES IN WORKING CAPITAL
LESS TAX PAID
LESS CAPITAL EXPENDITURE
FREE CASH FLOW

FREE CASH FLOW THE INCLUSIONS & EXCLUSIONSTO INCLUDE TO EXCLUDE
SALES LOAN FINANCE/EQUITY
PAYMENT FOR PURCHASES - DIVIDENDS/INTERESTS
RUNNING COSTS - LEASE PAYMENTS
PAID/RECD ON ASSETS INTEREST ON SURPLUS DEPOSITS
PURCHASE COSTS OF ASSETS OTHERWISE WOULD HAVE BEEN LEASED
TAX PAYMENTS AND REFUNDS
The Next step :demonstrating /the best alternative
In the earlier stage we would have considered a myriad of alternatives which might have resulted in same or different net cash flows
therefore it becomes necessary to make comparative analysis of the various options available.

the appropriate indicators
choose an appropriate indicator to evaluate the alternatives.The generally selected indicators are IRR , NPV, CBA, etc.It may also be neccessary to calculate pay back periods and B.E.Pointsto make proper assessmentscompare the above results with bench mark values internally or externallyROI etc.

Pay back Period
It is the length of time taken by the inflows of cash, to match the original investment.
It measures the length of time it takes for the project to pay back the original investment or capital cost
If the cost of a m/c is Rs 20,000/= and the annual net cash flow per annum is Rs 10,000/= the pay back period is 2 years .
the pay back period acts as a proxy for Risk.The lesser the pay back period the lesser is the Risk
Informal thresholds are typically employed 3-5 years for Britain. For countries like Iraq it is 6 months
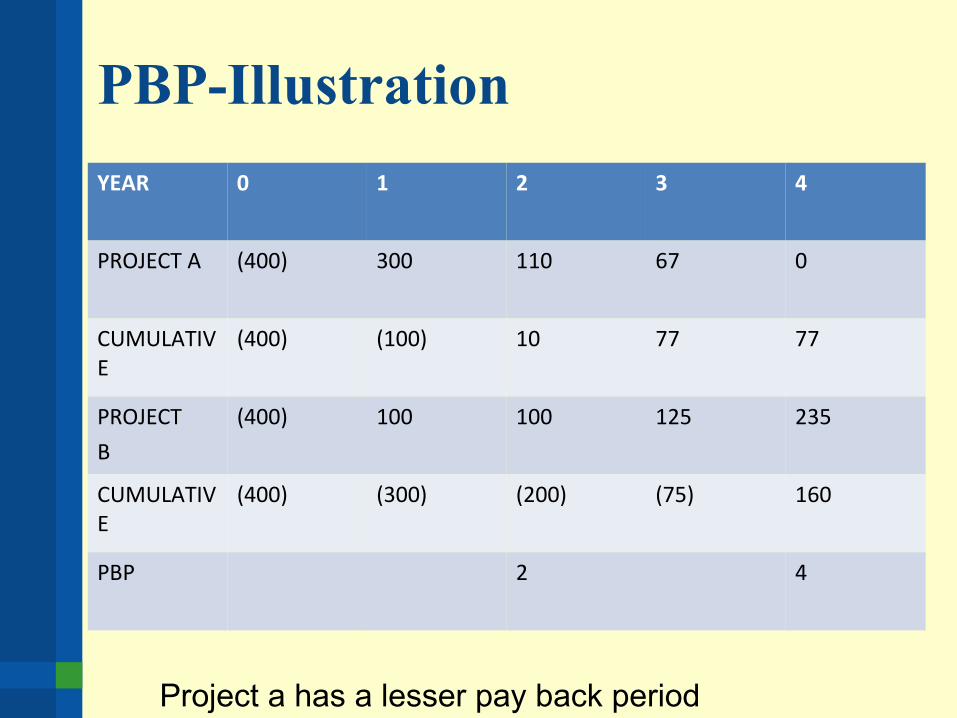
PBP-Illustration
YEAR 0 1 2 3 4
PROJECT A (400) 300 110 67 0
CUMULATIVE
(400) (100) 10 77 77
PROJECT
B
(400) 100 100 125 235
CUMULATIVE
(400) (300) (200) (75) 160
PBP 2 4
Project a has a lesser pay back period

NPV -METHOD
P.B.Period does not consider the time value of money.
A Bird in hand is worth two in the bush.
The money in hand today is more valuable than the distant cash flow on a/c of two reasons.1) Interest it will earn 2)the impact of inflation
Rs 1000/= deposited in bank today @ 5% interest will be equal to 1050.
But Rs 1050/= today if idle, after a year is equal to Rs 1000/= if rate of inflation is 5%
This is the oppurtunity cost of investing money in bank .

NPV ILLUSTRATION
YEAR 0 1 2 3 4 5
A (400) 300 110 67 0 0
CUMULATIVE
(400) (100) 10 77 77 77
D.F @10% 1 .909 .826 .751 .683
NPV (400) 272.2 90.9 50.3
B (400) 100 100 125 235
CUMU (400) (300) (200) (75) 160
D.F 1 .909 .826 .751 .683
NPV (400) 90.9 82.6 93.9 160.5
NNPV A=13.4 B=27.9
AS NNPV PROJECT B IS BETTER

IRR.
IRR is the discount rate that produces a net present value of zero.It can be considered as the breakeven discount rate .It represents the maximum cost of finance at which the project remains VIABLEThe procedure for calculating is thro trial and error method or use computers.irr is determined thro an iteration process using different discount rates until ZERO NPV is produced.

Hurdle rate
Once IRR is calculated it is compared with the companys'preset threshold investment rate,which is called hurdle rate.Hurdle rate is company's oppurtunity cost of capital.Alternatively the WACCIRR Decision rule : IRR > HR ACCEPT IRR < HR REJECTIRR Provides the simplest tool for decision making by managers
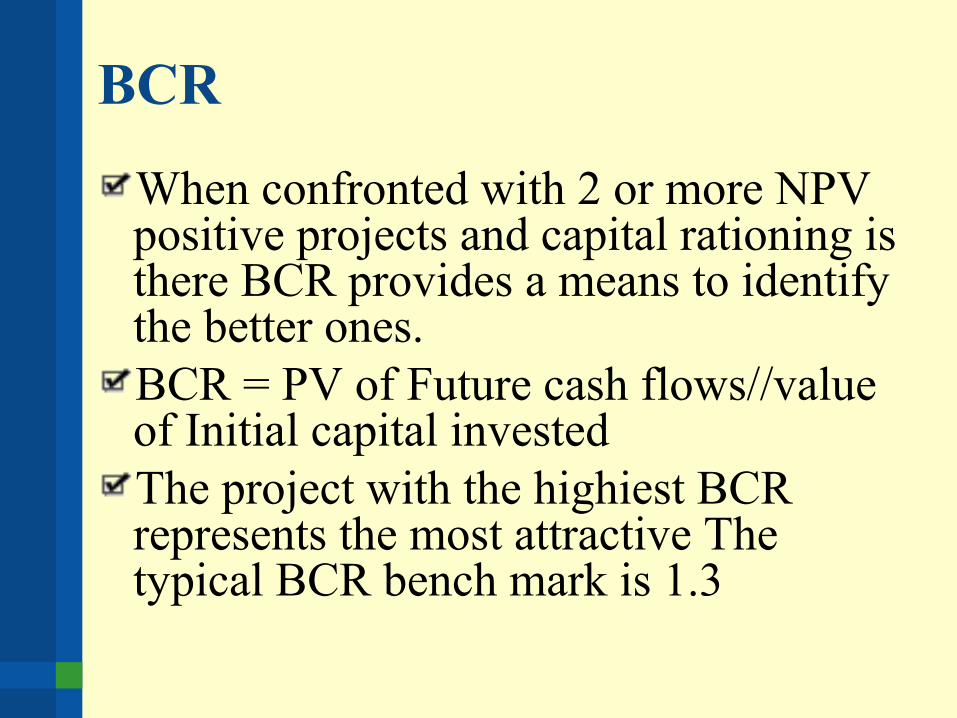
BCR
When confronted with 2 or more NPV positive projects and capital rationing is there BCR provides a means to identify the better ones.BCR = PV of Future cash flows//value of Initial capital invested The project with the highiest BCR represents the most attractive The typical BCR bench mark is 1.3

WACC - illustration
A cost of equity current year
16
previous year
17
B interest 275 280
C average borrowings
2348 2533
D pretax borrowing cost
11.71 11.06
E post tax cost of debt
8.20 7.76
F average invested capital
3983 3858
G average equity 1635 1325
H wacc 11.40 10.92
WACC = (E X C/F + A *G/F )

Company Objectives
List your company objectivesDefine these objectives in detail

Defining Terms
Define any terms or vocabulary you need to discuss in your presentation while your audience may be unfamiliar with.
First item•Definition
Second item•Definition
Third item•Definition

Current Situation
Explain the current situation and issues that face your company, and explain their implications.
Background to Recommend a Strategy
The original strategy fails to catch up with the current changes
New problems/needs/issues
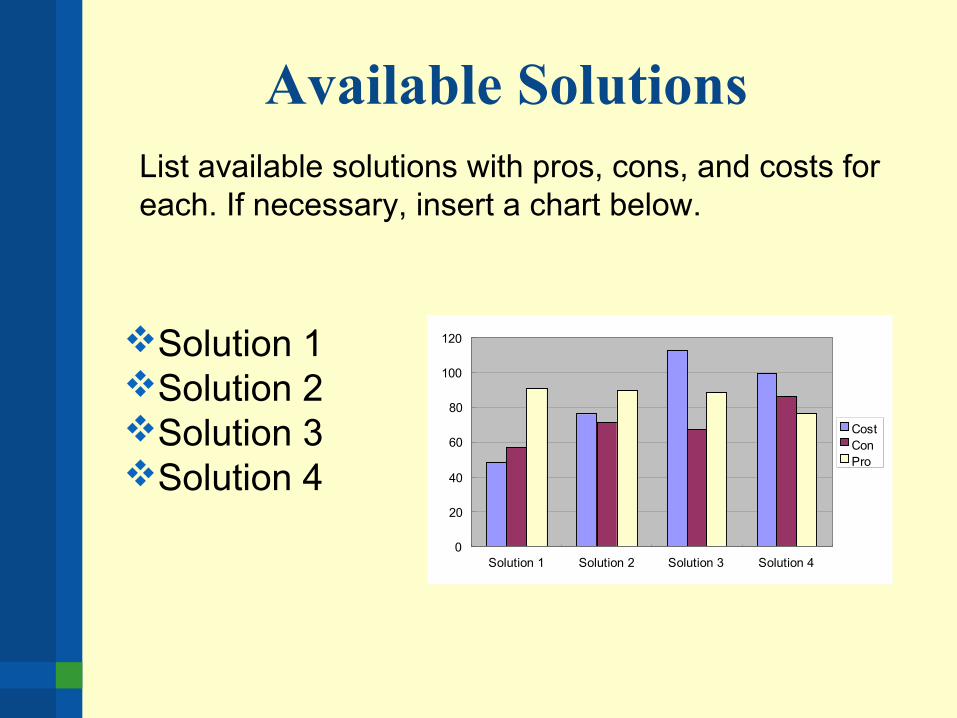
Available SolutionsList available solutions with pros, cons, and costs for each. If necessary, insert a chart below.
0
20
40
60
80
100
120
Solution 1 Solution 2 Solution 3 Solution 4
CostConPro
Solution 1Solution 2Solution 3Solution 4

Recommend a Strategy
Recommend one solution that you think is best suited to the situation.

Benefits of My Recommendation
Benefit 1
Benefit 2
Benefit 3
Benefit 4

Costs of Rejecting this Solution
List the costs of not using this solution

Questions and Answers
Prepared questions
Questions from the audience

Thank You for Coming!