introducing gis modeling1 - esri support
TRANSCRIPT

input 3 raster RECLASSIFYinput 3 cost
raster
input 2 raster RECLASSIFYinput 2 cost
raster
input 1 raster RECLASSIFYinput 1 cost
raster
ADDtotal cost
raster
origin layer
COST
cost distanceraster
backlink raster
COST PATH path layer
destinationlayer
DISTANCE
4
5
6
7
8
9
10
11
12
13
14
15
16
17
Introducing GIS modeling1
The GIS modeling process Define the goal of the analysis
Define the criteria
Collect the data
Run the model
Verify the results
Modify and rerun the model
Document the analysis
Display and apply the results
Modeling and GIS Data Spatial data types
Attribute data
Accounting for spatial bias
Geographic extent and resolution
Data quality
References and further reading

2 The Esri Guide to GIS Analysis
The first book in The Esri Guide to GIS Analysis series showed you how to get answers to straightforward spatial queries—mapping the most and least, finding what’s nearby, and so on. The second book showed you how to use statistics to find patterns and relationships in your geographic data, beyond simply gleaning them visually from a map. Together these volumes cover a broad swath of commonly used GIS analysis methods.
Beyond spatial query and pattern analysis, you can use GIS to answer questions that are more subjective and dependent on criteria and factors that you define:
• Whereisthebestlocation?
• Whichisthemostefficientpath?
• Wherewilltheflowgo?
• Whichplacewillpeopletravelto?
In these analyses, you define what constitutes “best” or “least cost,” and you specify the factorsthatinfluencefloworthewayinwhichafacilitycanbestservethesurroundingpopulation.Theseanalysesareusedtosupportdecisions:Whereshouldthenewhousingdevelopmentbebuilt?Whichisthebestpathforthepipeline?Whichareasareatriskfromstormrunoff?Whereshouldwebuildthenewbranchlibrary?WhiletheGIScan’tmake the decision for you, based on the criteria and parameters you specify, it can provide valuable insight. And by changing the criteria and parameters, you can explore alternate scenarios and the impacts of different plans before you implement them. Most of these analyses predate GIS (or even the use of computers), but GIS has made the process faster andmoreflexible,andmadeiteasiertovisualizeandcomprehendtheresults.
Historically, the different types of analysis have been the purview of different disciplines—finding the best location has traditionally been done by land planners; finding the least-cost path has commonly been used in the world of shipping and logistics; modeling flowhasbeendonebyhydrologistsaswellasbypublicworksdepartments(forwaterandsewer networks); and modeling where people will travel (and shop) has been done in the retail and commercial sector.
The goal of this book is to gather the methods used to perform these analyses in one place and present them to a wider audience of GIS users. If you’ve used GIS primarily for mapping or simple spatial queries and pattern analysis, you’ll find many new methods to support your decisions. If you’re familiar with one or a few of the methods included here, you’ll find best practices as well as other methods, or even other types of analysis, you may not have previously considered for your GIS applications.

Introducing GIS modeling 3
The analyses in the book broadly fall into two categories—evaluating locations and analyzingmovement.
Evaluating locations involves looking at various characteristics of a set of locations to determine how suitable they are for a particular use. The characteristics are represented by layers of information. These include characteristics of the locations themselves (such as the slope steepness or vegetation), as well as what’s surrounding or nearby (such as the distance of the locations from highways or streams). Evaluating locations is used for finding the best site to build something or the best use for each location in a study area. (These kinds of uses are collectively called “suitability analysis.”) It’s also used to predict areas that might be susceptible to risk, such as from landslides, fires, or insect infestations, based on the conditions at a site. The same type of analysis is used to identify where something (such as a particular bird species) will likely be found, by combining the preferred conditions of the species (certain type of vegetation, distance to water, presence of food sources, and so on).
Analyzingmovementcoversabroadrangeofmethods.Whattheyallhaveincommonisthat the analysis identifies the least travel cost between two or more locations. Cost is defined in terms of money, time, or distance. The movement can be by people or animals, in which case some decision process is involved, or by material that simply follows the path of least resistance, such as rainfall runoff after a storm or motor oil dumped into a drain through a stormwater system.
The book explores methods to do the following:
• Identify existing locations—such as lots or a section of roadway—that are suitable for an intended use. “Show me all the lots that are suitable for a shipping distribution center.”
• Find locations anywhere in your study area that are suitable for a particular use. “Show me all the areas that are suitable mountain lion habitat.”
• Ratelocationsasmoreorlesssuitable.“Show me the most and least suitable locations for a new housing development.”
• Findthebestpathorcorridorbetweentwolocationstravelingoverland.“Show me the path for a new transmission line that costs the least to construct while minimizing environmental impacts.”

4 The Esri Guide to GIS Analysis
• Find the shortest, quickest, or least expensive path between a series of stops, optionally picking up and dropping off people or goods. “Show me the driving route that requires the least travel time while allowing me to visit all my customers within their available time windows.”
• Findoutwherewaterwillflowandaccumulateoverthelandsurface.“Show me the total area upstream from the stream gauge.”
• Tracetheflowofwaterorothermaterialthroughpipesfromanoriginlocation.“Show me which manholes are in the path of motor oil dumped into a storm drain.”
• Findtheoptimallocationforafacilitythatservesthesurroundingpopulationsuchthatoveralltraveltimeisminimized,themostpeopleareserved,oreveryoneiswithinaspecified distance of a facility. “Show me the location for the new library that ensures no one in the community has to travel more than ten minutes to reach a library.”
• Predictwhichfacilitypeoplearelikelytouse,giventheattractivenessofthefacility,how far away it is, and the locations of competitors. “Show me the likelihood that people will visit a regional park, given the size of the park and its amenities.”
analysis methods chapter
Evaluate suitable existing locations Logical & spatial selection Chapter 2, “Finding suitable locations”
Identify suitable locations anywhere in the study area
Vector overlayRaster overlay
Chapter 2, “Finding suitable locations”
Rate suitable locations Weighted overlayFuzzy overlay
Chapter 3, “Rating suitable locations”
Find the best overland path Path-distance analysis Chapter 4, “Modeling paths”
Find the most efficient route over fixed infrastructure
Least-cost pathVehicle Routing Problem
Chapter 4, “Modeling paths”
Find out where water will flow over the land surface
Flow direction analysis Chapter 5, “Modeling flow”
Trace where fluid will flow through pipes Geometric network trace Chapter 5, “Modeling flow”
Find the optimum location for a facility that serves the surrounding population
Location-Allocation Chapter 6, “Modeling interaction”
Predict visitation to a facility Spatial interaction model Chapter 6, “Modeling interaction”

Introducing GIS modeling 5
Mostofthemethodsforevaluatinglocationsandanalyzingmovementinvolveaprocessin which you run a series of functions, or tools, in sequence to get the end result. For each tool, you specify parameters and the input datasets. (In many cases, the output dataset from one step becomes the input dataset for the next step.) Together, the data, tools, and parameters—along with the sequence of steps—comprise a GIS model.
The book compares methods and explains the theory behind them so you can better interpret the results of your analysis. It also describes how a particular method is imple-mented in the GIS. Understanding the implementation will help you decide which method is best suited for the task at hand. In this book the implementation described is the one used by Esri’s ArcGIS software. Comparable tools can be found in other GIS software. The book assumes familiarity with basic GIS concepts, as well as the GIS analysis concepts presented in the earlier volumes.
The methods presented here are some of the most commonly used and can be imple-mented using tools contained within typical GIS software.
Ofcourse,additionalmethodsexistforevaluatinglocationsandanalyzingmovement.Typical of such methods are dispersion models that predict the spread of a phenomenon, such as a wildfire over the land, a pollutant through groundwater, or a toxic gas through the air. Other methods, such as simulation models, predict behavior. Examples include predicting the home range of mountain lions given the behavior of the lions, the presence of other mountain lions, prey, and preferred habitat; or models that predict urban growth over several decades given various economic scenarios, population growth, and people’s preferences for places to live, work, and shop.
In general, these types of models are implemented outside a GIS, often using mathemati-cal or statistical software. In some cases, GIS is used to process data for input to a model, the model is run outside the GIS, and the results of the model are imported back to the GIS for display as maps and charts. In other cases, the linkage with GIS is more inte-grated: the model sends data to the GIS for spatial processing using a particular tool or function—or perhaps even a complete model built inside the GIS—and the results are returned to the external model for the next step. Since these methods are primarily implemented outside of a GIS, they are beyond the scope of this book.
6 The Esri Guide to GIS Analysis
the gis modeling process
The process for creating a GIS model is much like that for other GIS analyses, with a few additional considerations. Each method presented in the book essentially follows the process described below.
define the goal of the analysis
The goal of the analysis can be stated as a problem to be solved or as a question to be answered. The more specific the question, the more likely it is you will get meaningful results.
• Whatisthebestlocationformycompany’snewshippingdistributioncenter?
• Ineedtofindtheareasthataregoodmuledeersummerhabitat.
• Ineedtofindthebestpathforanewhighwayconnectingtwotowns.
• Whichofthethreecandidatelocationsforthenewlibrarywillbestservethecity’sresidents?
• Givenachoiceofseveralregionalparks,whichonesarehikersmostlikelytouse?
define the criteria
Whenyouevaluatelocationsoranalyzemovement,youfirstdefinethecriteriaforwhatmakes a place suitable or what constitutes the least cost. You also decide which criteria are more important and which less, and weight the criteria accordingly.
Whatmakesforagoodlocationtobuildsomething?Usually,itisacombinationoffactors—for a shipping distribution center it might be a site that is currently vacant, at leastfiveacresinsize,withinamileofahighway,andnotinafloodzone.
Whatmakesalocationsuitablehabitat?Again,itisoftenacombinationoffactors.Forsummer mule deer habitat, the factors might include elevation, vegetation type, and distance from water.
Whatdefinesthebestpath—isittheshortestone,thequickestone,theonethatcoststheleastmoneytobuild,ortheonethathastheleastimpactontheenvironment?
If you’re meeting demand for services, as with a library, do you want to serve the most people,minimizethetotaltraveltimetothefacilityfromalllocations,orensurealltheresidentsofthecommunityareequallyclosetoafacility?

Introducing GIS modeling 7
If you’re predicting travel to facilities such as regional parks, you define the factors that make one facility more attractive than another (and hence more likely to draw people from farther away). Hikers might be attracted to parks with the greatest total length of trails, those having a lake or stream, and those having a wide variety of habitats.
Defining the criteria and their weights is the core of creating your model. There are many sources of information for determining criteria and weights.
You might have firsthand knowledge or experience of the phenomenon you’re modeling, based on your research, observation, or the expertise you’ve developed over years of working in your particular field. Even then, you’ll likely want to get some verification from others knowledgeable in the field.
Publishedresearch,industrystandards,orregulationsmayalsoguideyouindefiningcriteria and weights. For example, research on mountain lions may indicate that the presence of vegetation cover, steep slopes, and proximity to water are more important in identifying suitable habitat than other factors, such as distance from roads or urban areas. Similarly, a city’s building regulations might stipulate the permissible steepness of slopes for different types of development or how close construction can be to a stream or wetland.
If there is no published literature to help you define your criteria, you can attempt to develop a consensus among a group of experts on the issue. One such technique is called the Delphi process, in which experts independently submit their best knowledge of the phenomenon you’re modeling and the associated criteria. The results are compiled and redistributed for the experts to assess and reevaluate. Through several such iterations (hopefully not too many), a consensus may emerge.
Another approach is to convene a workshop in which experts discuss the criteria and try to reach a consensus on the spot. One technique for use in a workshop (or even by an individual attempting to define criteria) is pairwise comparison. In this method, all potential criteria are identified, and each criterion is compared to each of the other criteria in turn. The first criterion in the pair is compared to the second on a scale ranging from, for example, “much more important” to “equally important.” Eventually, the most important criteria rise to the top. (If one particular criterion is listed as “much more important” when compared to each of the other criteria, it is clearly the most important.) See“Referencesandfurtherreading”attheendofthischapterforsourcesthatdiscussthese and other methods for defining criteria.

8 The Esri Guide to GIS Analysis
Somecriteriaaredifficulttoquantify.Thisisespeciallytrueofsocialvalues,forexamplewhen trying to determine the value to a community in protecting a scenic view (although you can undertake a survey to try to determine this). To the extent you estimate the values associated with such criteria, the results of your model will also be an estimate.
Whenassigningcriteriaandweights,subjectivityandvaluejudgmentsareofteninvolved.For example, in selecting a site for a new housing subdivision, there are economic and socialcriteriatoconsider:protectionofwildlifehabitats,increasedtraffic,higherdemandonschoolsandotherpublicservices.Byemphasizingcertaincriteriaoverothers,youcancreate alternative scenarios—one that takes greater account of economic factors, for example, and another that takes greater account of environmental factors.
collect the data
The criteria you define will determine the data you need for your model. This being a GIS model, the data will consist of map layers.
Dataisavailablefromavarietyofsources—withinyourorganization,fromotherorgani-zationsinyourregion,fromstateandnationalagencies,orfromcommercialsuppliers.Much of this data is available via the Internet.
In some cases, a map layer can be used as is in the model. In other cases you’ll need to modify or enhance the layer before it can be used. You may need to add or calculate additional attributes. You may need to edit or process the data to make it usable for the model. You may also need to derive new map layers. For example, if your model calls for a layer of slope steepness (and one doesn’t exist), you’d create one from an elevation layer.
criteria map layer
Currently vacant Parcels
At least five acres in size Parcels
Within one mile of a highway Highways
Outside a flood zone Flood zones
Criteria for finding the best location for a shipping distribution center, along
with the associated data layer for each criterion.
Introducing GIS modeling 9
GIS data takes the form of either raster or vector data. Generally, the methods for evaluating locations can use either type, although, depending on the specific method, one ortheothermightbemoreappropriate.Foranalyzingmovement,themethodsaregearedspecifically to either raster or vector data.
Geographic data has unique characteristics which can impact the results of your model, and hence your decisions. These include spatial bias in the data, issues associated with geographic scale, and locational accuracy (whether things in the data are where they actually are on the ground).
Using GIS data in the modeling process is discussed later in this chapter.
run the model
The goal of your analysis, and the type of data you’re using, will determine which analysis method you’ll use. In some cases more than one method may be appropriate—the choice depends on personal preference or the type of output you want to obtain. You can also use alternate methods to verify the results of your analysis.
In most cases, each step in the model has a corresponding tool or function—you specify the parameters for each tool and then run the tools in sequence. Depending on the method and the GIS software you’re using, you might run the tools interactively via the software’s interface. Often, you can automate this process by specifying all the data inputs, tools, and parameters, and the order in which to run the tools, and then run them all at one time.
In ArcGIS, automating the process is usually done by creating a model document using ModelBuilder.ModelBuilderallowsyoutocreateaflowdiagramwithallthemodelcomponents, and then run the model. Building a model document has a number of advantages—you can see a visual representation of the model that makes the steps easy to follow; it is relatively easy to modify the model, if necessary, and rerun it; in the process of building the model, you are documenting the analysis; and a model document is easy to share with others.
10 The Esri Guide to GIS Analysis
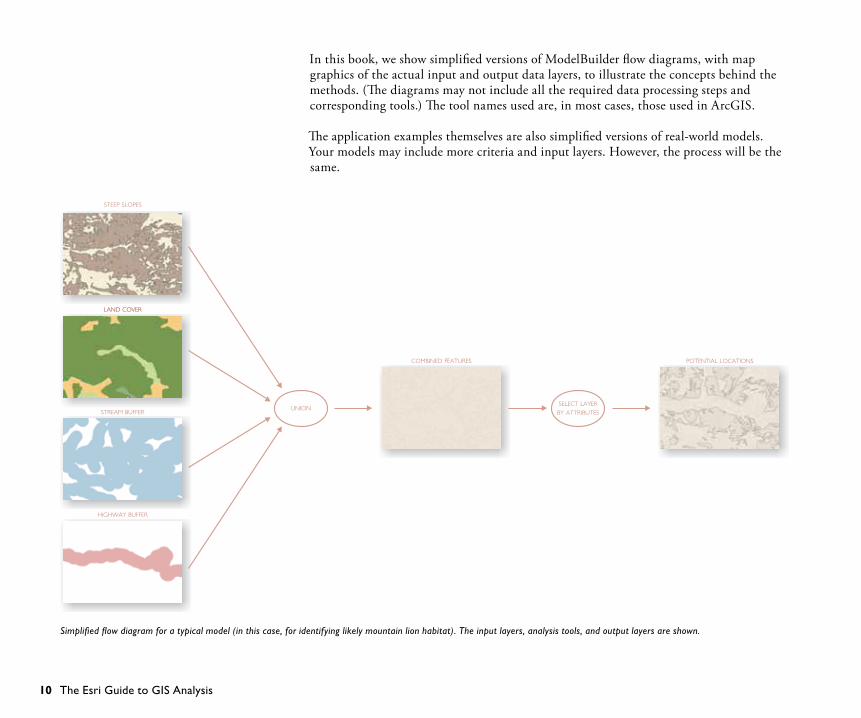
Inthisbook,weshowsimplifiedversionsofModelBuilderflowdiagrams,withmapgraphics of the actual input and output data layers, to illustrate the concepts behind the methods. (The diagrams may not include all the required data processing steps and corresponding tools.) The tool names used are, in most cases, those used in ArcGIS.
The application examples themselves are also simplified versions of real-world models. Your models may include more criteria and input layers. However, the process will be the same.
UNIONSTREAM BUFFER
LAND COVER
HIGHWAY BUFFER
COMBINED FEATURES POTENTIAL LOCATIONS
SELECT LAYER
BY ATTRIBUTES
LAND COVER
STEEP SLOPES
Simplified flow diagram for a typical model (in this case, for identifying likely mountain lion habitat). The input layers, analysis tools, and output layers are shown.

Introducing GIS modeling 11
Verify the results
Once you’ve obtained the results from the model, usually in the form of a map layer and associated tables, you need to determine if the results are valid. There are several ways to do this. One is to see if the results make sense given your knowledge of the study area and the problem you’re solving. You’ll also want to share the results with colleagues or experts in the field who were not involved in developing the model, to see if they think the results make sense.
Another way to verify the results is to check the results against your original criteria. You can do this by displaying the results layer on top of the layers representing your criteria (or bycomparingthemside-by-side).Theresultsshouldreflectthecriteriaandweightsyouspecified in the model.
You can also modify the model criteria slightly and run the model again (see below) to see how much the results vary. If the results vary little, this will give you confidence that the results are stable, and you’ll have more confidence in any decisions based on the results. If the results vary depending on the criteria you specify, it means the model is more sensitive to some criteria than others. You’ll want to look at these sensitive criteria closely and make sure you’ve weighted them correctly in the model.
Of course, the most effective way to verify the results of your model (if you have the time andresources)istogointothefieldandseeiftheyreflectreality.Ifyou’remodelingmountain lion habitat, you’d go to areas that the model indicates are suitable habitat and look for evidence of mountain lions. You’d also go to areas that the model indicates are not suitable habitat and look for evidence of lions. If you find evidence of lions in unsuit-able habitat (or no evidence of lions in suitable habitat), you’ll want to do additional research to find out which criteria are missing from your model.
modify and rerun the model
If your analysis of the results shows errors in the model or if you find that some of your assumptions about the criteria were incorrect, you can modify the model inputs and parameters and rerun the model to produce a new result. If you’ve created a model document, this is fairly straightforward, as all the inputs and parameters are saved—you merely need to edit the document, make the necessary changes, and run the model again.
12 The Esri Guide to GIS Analysis
The goal of your analysis may require alternative scenarios. For example, if the goal is to find the optimal location for elementary schools in a new planned community, you can first run the model assuming you will build three schools, and then rerun the model to find out how much farther students will have to travel if you only build two new schools.
Alternative scenarios can also be based on different social and economic values. For example, when finding the best location for the new planned community, you might favor minimizingconstructioncostsinonescenarioandmaximizingtheamountofgreenspacein another. By creating alternatives, you can see where the results of the scenarios are the same, so discussions and compromises can focus on the areas where the results differ.
document the analysis
An important step in the process is to document the analysis and the model. You may need to revisit your work in the future, and good documentation will allow you to recall what you previously did. You may also want to share the model with others inside or outsideyourorganizationwhowillneedcleardocumentationsotheycanreplicateyouranalysis.Perhapsmostimportantly,peers,decisionmakers,andcitizenswillwanttoseeand understand how the results were obtained.
A ModelBuilder document is a useful way to store and present your analysis process. Includinggraphicsandlabelsinthediagramwillhelpothersvisualizethecriteriathatwent into the model as well as the inputs and outputs at each step of the process.
display and apply the results
The results from the analysis can feed directly into a decision process via maps, tables, and charts. The results can also be used in further analyses or to provide additional under-standing of the problem.
Similarly, the results of a model can be used as input to another model. For example, you might use a suitability model to find potential locations for a new school, and then use the resulting locations as input to a location-allocation model to find the school that will serve the most students.
Introducing GIS modeling 13
Bear in mind that the result of your model is just another tool to help with decisions or with understanding the phenomenon you’re modeling—it’s not the definitive answer. There may be other political or economic factors involved in the decision process. New data or future research may change the criteria or weights for your model, making your results obsolete. But the results you obtain can help inform decisions in the present and advance understanding of the problem at hand.

14 The Esri Guide to GIS Analysis
modeling and gis data
ThenatureofGISdatahasimplicationsforevaluatinglocationsandanalyzingmovement.These include the type of spatial and attribute data required by a particular method, whether there is spatial bias in the data, issues of geographic scale, and issues of spatial and attribute data quality. By understanding the data you’re working with, you’ll be able to avoid pitfalls in developing your analysis and interpreting the results.
spatial data types
Most of the analysis methods described in this book require a particular type of spatial data. The type of data you have available at least partially determines the method you use. (Conversely, if there’s a particular method you want to use, you’ll need to obtain the appropriate data.)
Vector dataVector data uses coordinate pairs to define both the location and shape of geographic features.Pointfeaturesaredefinedbyasinglepair.Suchpairsalsodefinetheverticesofaline feature or the boundary that defines an enclosed area (a polygon).
Vector data is often used to represent features that are discrete in space—individual buildings, streets, or parks.
Buildings represented as points. Streets represented as lines. Parks represented as polygons.

Introducing GIS modeling 15
It can also be used to represent spatially continuous phenomena such as elevation or land cover.
Features of the same type are stored as a layer. Each layer has an associated table that stores the attributes for the features.
Elevation represented as contour lines. Land-cover types represented as polygons.
A layer of land parcels (polygons) with its attribute table. The attributes are displayed when you
identify a feature. They can also be used to symbolize features, create reports, and do analysis.

16 The Esri Guide to GIS Analysis
Vector data can be used for some types of analysis that involve finding suitable locations (chapter 2, “Finding suitable locations”).
Features represented as vector data are often used when displaying the results of your analysis, to add context to maps—such as with highways, rivers, county boundaries, and so on.
networksNetworks are a specific type of vector data. They are comprised of a set of connected featuresinasystem—usuallyonethatsomematerialorobjectflowsthroughorover.These include utility networks—such as a system of water pipes and valves—and trans-portation networks—such as a system of streets, turns, and stops.
A network is primarily composed of lines, known as edges, and the junctions, or nodes, where edges connect. The GIS knows which edges connect at which junctions. That allows you to model the movement through or over the network. You create a network from existing features using tools in the GIS.
The edges and junctions in the network have associated attributes that can affect the movement through the network, such as the diameter of stormwater pipes or the time required to travel each street segment.
A street network showing edges (gray lines) and junctions
(gray dots).

Introducing GIS modeling 17
Transportation networks are used to model routes for visiting various locations or making deliveries (chapter 4, “Modeling paths”) and for locating facilities (chapter 6, “Modeling interaction”).Utilitynetworksareusedtotraceupstreamordownstreamflow(chapter5,
“Modelingflow”).
raster dataRasterlayersrepresentgeographicspaceasagridofcells,witheachcellbeingassignedavalue representing the attribute for that particular location. Each layer essentially repre-sents a single characteristic.
Rasterdataisoftenusedtorepresentgeographicphenomenathatarespatiallycontinuous,such as elevation or soil moisture—at any location within your study area the elevation above sea level or the amount of moisture in the soil can be measured. In these two examples, the values are also continuous—for example, the elevation values for a particu-lar study area may range from 230 meters to 600 meters. However, raster data is also used to represent categorical data that is spatially continuous, such as land-cover categories or soil types.
A route for a salesperson making visits to doctors’ offices
(blue crosses), starting from the sales office (blue square).
A downstream trace of motor oil through stormwater
pipes (blue lines). The oil was dumped into three inlets
(blue boxes); the red lines show the pipes the oil will flow
through. Street centerlines are also shown in gray.
18 The Esri Guide to GIS Analysis
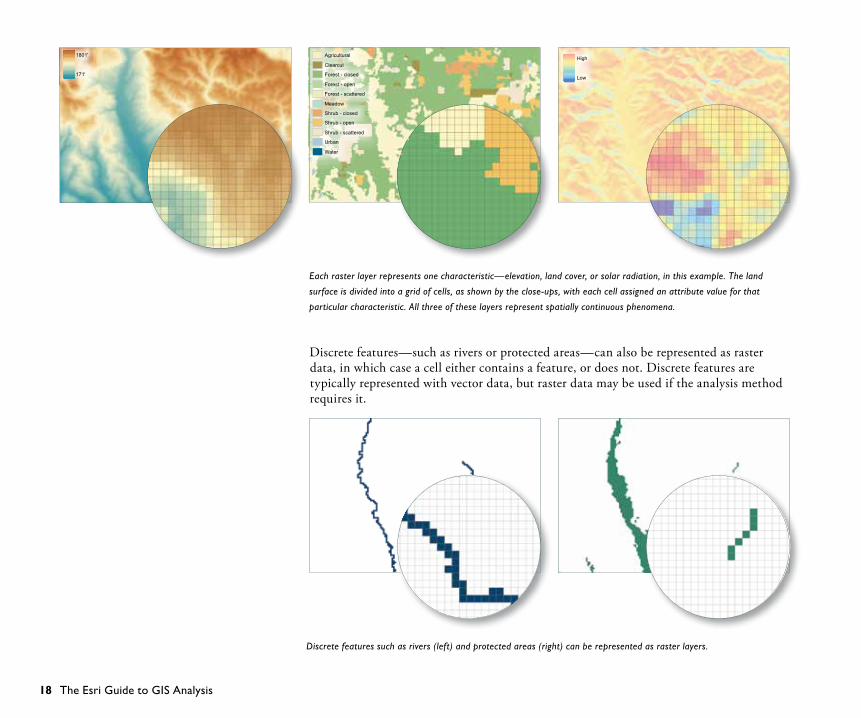
Discrete features—such as rivers or protected areas—can also be represented as raster data, in which case a cell either contains a feature, or does not. Discrete features are typically represented with vector data, but raster data may be used if the analysis method requires it.
1801'
171'
Agricultural
Clearcut
Forest - closed
Forest - open
Forest - scattered
Meadow
Shrub - closed
Shrub - open
Shrub - scattered
Urban
Water
High
Low
Each raster layer represents one characteristic—elevation, land cover, or solar radiation, in this example. The land
surface is divided into a grid of cells, as shown by the close-ups, with each cell assigned an attribute value for that
particular characteristic. All three of these layers represent spatially continuous phenomena.
Discrete features such as rivers (left) and protected areas (right) can be represented as raster layers.

Introducing GIS modeling 19
Rastersareoftenusedforfindingthebestlocationforsomething(chapter2,“Findingsuitablelocations”andchapter3,“Ratingsuitablelocations”)aswellasforcreatingoverlandpathsandcorridors(chapter4,“Modelingpaths”).Rastersarealsousedinhydrologic modeling to identify stream channels and drainage basin boundaries (chapter5,“Modelingflow”).
attribute data
Attribute data—the descriptive information about geographic features—is used to specify and filter criteria. (For vector data, attributes are stored in tables associated with a layer; for raster data, they are the values associated with the cells in the raster.) Attribute values are nominal, ordinal, interval, or ratio. The latter three types are measured on scales of high to low (or more to less). Some analysis methods require you to use a particular scale.
nominalNominal values describe features by name or type and are often used for categorical attributes.Parcelscanbedisplayedorselectedbyland-usecode,forexample.
Land-use types are nominal values.
Commercial
Industrial
Public
Multi Family Residential
Single Family Residential
Agricultural
Rural
Vacant
20 The Esri Guide to GIS Analysis
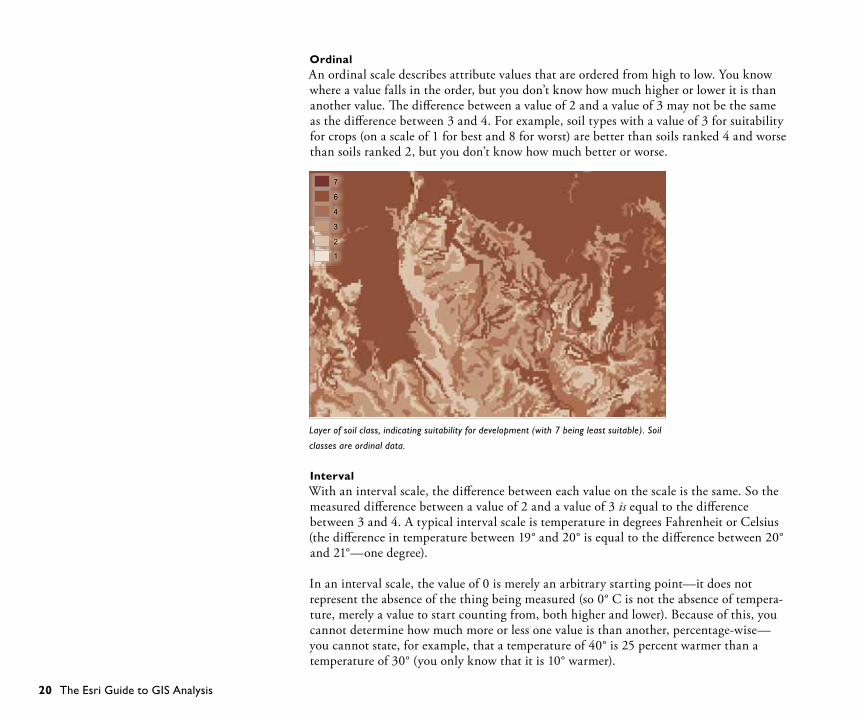
ordinalAn ordinal scale describes attribute values that are ordered from high to low. You know where a value falls in the order, but you don’t know how much higher or lower it is than another value. The difference between a value of 2 and a value of 3 may not be the same as the difference between 3 and 4. For example, soil types with a value of 3 for suitability for crops (on a scale of 1 for best and 8 for worst) are better than soils ranked 4 and worse than soils ranked 2, but you don’t know how much better or worse.
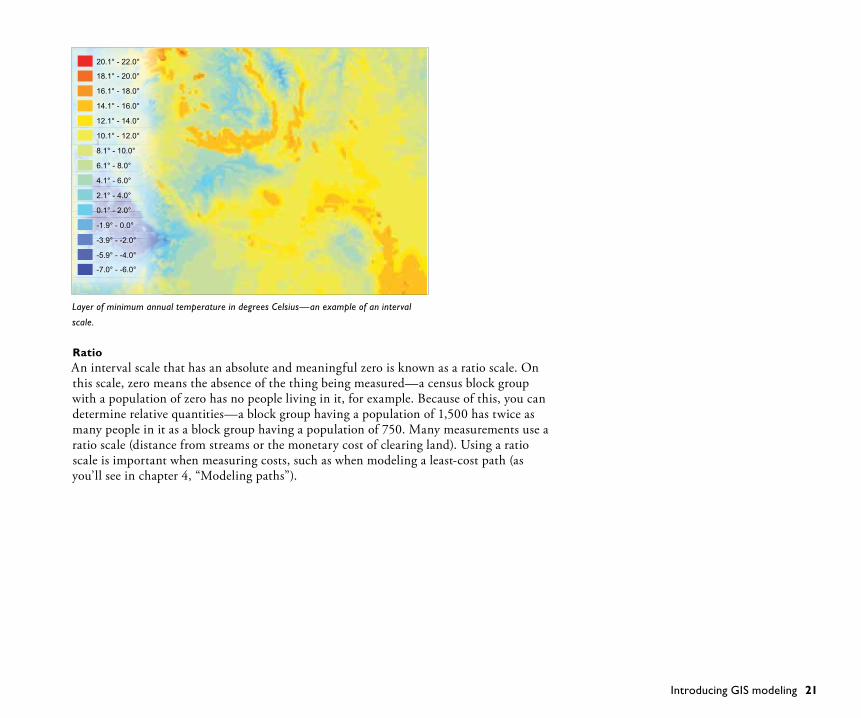
intervalWithanintervalscale,thedifferencebetweeneachvalueonthescaleisthesame.Sothemeasured difference between a value of 2 and a value of 3 is equal to the difference between 3 and 4. A typical interval scale is temperature in degrees Fahrenheit or Celsius (the difference in temperature between 19° and 20° is equal to the difference between 20° and 21°—one degree).
In an interval scale, the value of 0 is merely an arbitrary starting point—it does not represent the absence of the thing being measured (so 0° C is not the absence of tempera-ture, merely a value to start counting from, both higher and lower). Because of this, you cannot determine how much more or less one value is than another, percentage-wise—youcannotstate,forexample,thatatemperatureof40°is25percentwarmerthanatemperature of 30° (you only know that it is 10° warmer).
7
6
4
3
2
1
Layer of soil class, indicating suitability for development (with 7 being least suitable). Soil
classes are ordinal data.
Introducing GIS modeling 21
ratioAnintervalscalethathasanabsoluteandmeaningfulzeroisknownasaratioscale.Onthisscale,zeromeanstheabsenceofthethingbeingmeasured—acensusblockgroupwithapopulationofzerohasnopeoplelivinginit,forexample.Becauseofthis,youcandeterminerelativequantities—ablockgrouphavingapopulationof1,500hastwiceasmanypeopleinitasablockgrouphavingapopulationof750.Manymeasurementsusearatio scale (distance from streams or the monetary cost of clearing land). Using a ratio scale is important when measuring costs, such as when modeling a least-cost path (as you’ll see in chapter 4, “Modeling paths”).
20.1° - 22.0°
18.1° - 20.0°
16.1° - 18.0°
14.1° - 16.0°
12.1° - 14.0°
10.1° - 12.0°
8.1° - 10.0°
6.1° - 8.0°
4.1° - 6.0°
2.1° - 4.0°
0.1° - 2.0°
-1.9° - 0.0°
-3.9° - -2.0°
-5.9° - -4.0°
-7.0° - -6.0°
Layer of minimum annual temperature in degrees Celsius—an example of an interval
scale.
22 The Esri Guide to GIS Analysis
accounting for spatial bias
Since geographic data represents real-world phenomena and processes, certain characteris-tics of geography can lead to spatial bias in the data. You’ll need to be aware of any bias before conducting your analysis and take steps to counter it if the bias will affect the analysis results. Two common forms of bias are spatial autocorrelation and correlated data layers.
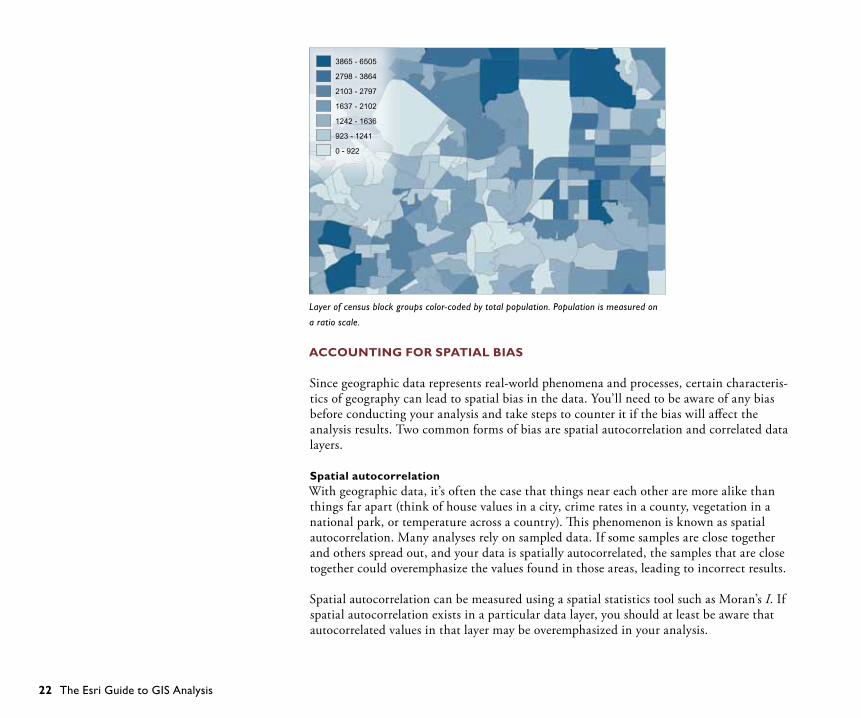
spatial autocorrelationWithgeographicdata,it’softenthecasethatthingsneareachotheraremorealikethanthings far apart (think of house values in a city, crime rates in a county, vegetation in a national park, or temperature across a country). This phenomenon is known as spatial autocorrelation. Many analyses rely on sampled data. If some samples are close together and others spread out, and your data is spatially autocorrelated, the samples that are close togethercouldoveremphasizethevaluesfoundinthoseareas,leadingtoincorrectresults.
Spatial autocorrelation can be measured using a spatial statistics tool such as Moran’s I. If spatial autocorrelation exists in a particular data layer, you should at least be aware that autocorrelatedvaluesinthatlayermaybeoveremphasizedinyouranalysis.
Layer of census block groups color-coded by total population. Population is measured on
a ratio scale.
3865 - 6505
2798 - 3864
2103 - 2797
1637 - 2102
1242 - 1636
923 - 1241
0 - 922

Introducing GIS modeling 23
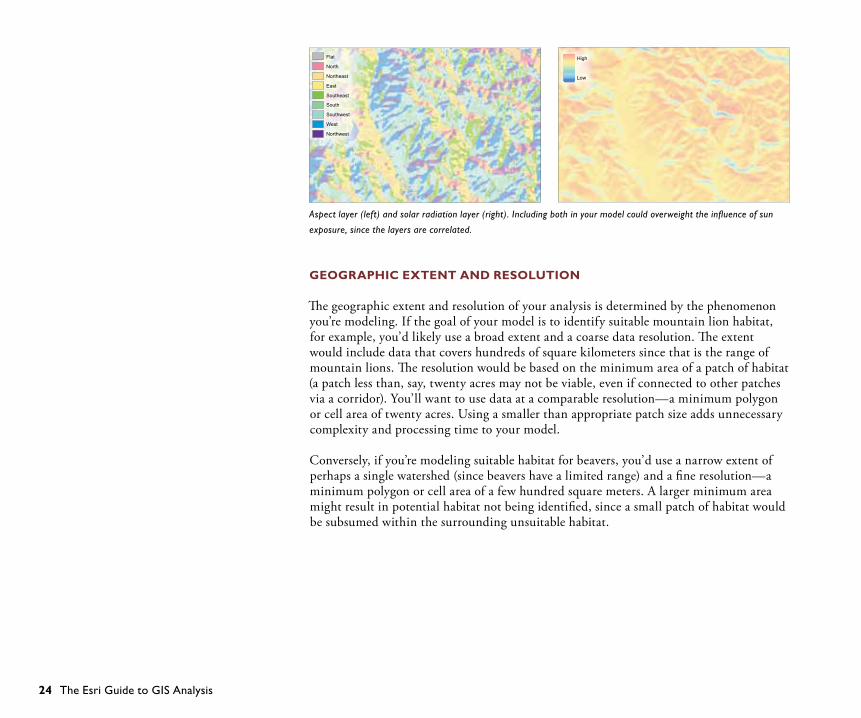
correlated layersAnother form of spatial bias involves two or more data layers that may be correlated. If you include in your analysis several layers related to the same phenomenon, that phenom-enon will be overrepresented. For example, if you’re modeling the distribution of a plant species,includinglayersforaspectandsolarradiationwouldoverweighttheinfluenceofsun exposure, since these two layers are correlated. (In the northern hemisphere, south facingslopesreceivealotofsun).Asaresult,theinfluenceofotherlayersinthemodel(such as soil type and rainfall) would be underweighted.
YoucantesttoseeiflayersarecorrelatedusingastatisticstoolsuchasPearson’scorrela-tioncoefficientorSpearman’srankcorrelationcoefficientorbyusingaregressionanalysissuch as Ordinary Least Squares. If two or more of your layers are strongly correlated, consider using only one of the layers in your analysis.
Map showing median property value in each census tract. Tracts having a high value
occur near each other (upper right) as do tracts having a low value (center and bottom).
$0 - $26,700
$26,701 - $60,100
$60,101 - $107,500
$107,501 - $186,700
$186,701 - $400,000
24 The Esri Guide to GIS Analysis
geographic extent and resolution
The geographic extent and resolution of your analysis is determined by the phenomenon you’re modeling. If the goal of your model is to identify suitable mountain lion habitat, for example, you’d likely use a broad extent and a coarse data resolution. The extent would include data that covers hundreds of square kilometers since that is the range of mountain lions. The resolution would be based on the minimum area of a patch of habitat (a patch less than, say, twenty acres may not be viable, even if connected to other patches via a corridor). You’ll want to use data at a comparable resolution—a minimum polygon orcellareaoftwentyacres.Usingasmallerthanappropriatepatchsizeaddsunnecessarycomplexity and processing time to your model.
Conversely, if you’re modeling suitable habitat for beavers, you’d use a narrow extent of perhaps a single watershed (since beavers have a limited range) and a fine resolution—a minimum polygon or cell area of a few hundred square meters. A larger minimum area might result in potential habitat not being identified, since a small patch of habitat would be subsumed within the surrounding unsuitable habitat.
Aspect layer (left) and solar radiation layer (right). Including both in your model could overweight the influence of sun
exposure, since the layers are correlated.
Flat
North
Northeast
East
Southeast
South
Southwest
West
Northwest
High
Low

Introducing GIS modeling 25
The extent and resolution will also impact your choice of datasets to use. For example, if one criterion is that suitable areas are closer to streams, you need to decide which streams. Thedistancelayerwillbequitedifferentifyouusestreamscreatedfrom1:250,000scaledataversus1:100,000scaledata.Whichdatasetyouusedependsontheextentofyourstudy area, the purpose of your analysis, and the resolution you require.
Distance to rivers using data from the 1:250,000 scale
map.
Rivers captured from a printed map at a scale of
1:250,000—the locations of only the largest rivers are
included.
Rivers for the same study area as above, captured from a
printed map at a scale of 1:100,000—smaller streams,
as well as larger rivers, are included.
Distance to rivers using data from the 1:100,000 scale
map.

26 The Esri Guide to GIS Analysis
Relatedtogeographicextentisthelocationandconfigurationofyourstudyareabound-ary. In some cases, how you delimit the study area can impact the results of your analysis. This is especially true of methods that involve distance calculations. For example, if one criterion is that locations should be close to streams, and your study area is limited to a particular watershed, a location might appear to be far from streams but, in fact, be close to a stream which is just outside the watershed boundary (and study area).
Distance to rivers (darker blue indicates farther distance). The map on the left shows the distances for a watershed, using only the streams within the watershed. The map on the right
shows the distances within the watershed, including streams outside the watershed in the calculation. The close-up views show that some areas at the edge of the watershed are, in
fact, close to streams when the streams outside the watershed are included.

Introducing GIS modeling 27
In a spatial interaction model, the study area boundary also directly impacts your results—destinations (including competitors) outside the boundary will be excluded from the analysis, but, in reality, they may draw visits from origin locations within the study area. In a location-allocation model to find the best location for a new facility, if your study area is a city boundary, people outside the study area will be excluded even though they might in fact use the planned facility.
Another issue related to geographic extent is the way in which distances are calculated. The issue arises from the fact that GIS data (which represents geography on the surface of thecurvedearth)isprojectedtoaflatplanefordisplayasamap,therebydistortingdistances. The map projection you use will affect the distance calculations and hence your results. If your study area is limited to a city, county, or state, the curvature of the earth is minimal, so distance distortion is generally not an issue. At the continental or global scale, however, the earth’s curvature is a factor in calculating distance. If you’re working at this scale and distance is one of the criteria in your model (or if distance calculations are inherent in the analysis method, such as with spatial interaction models), you’ll want to useamapprojectionthatminimizesdistancedistortion.
This analysis shows the best location for a library (box with star) from four possible
locations. The best location provides access to the most people while minimizing travel
distance. (Census block groups are color-coded by population, with darker blue indicating
higher population.) Only census blocks within the city limit were considered.
In this analysis, census blocks beyond the city limit were included in the study area
(assuming people outside the city might visit the library). The best location shifts to the
one in the lower left.
28 The Esri Guide to GIS Analysis
data quality
GIS data has both a spatial component and an attribute component. Features have to have both the correct location and the correct attributes to ensure the results of your model are valid.
Fornetwork-basedmodels,suchasroutingdeliverytrucksoverstreetsormodelingflowthrough a water system, an error in the network will invalidate the results. Examples of errors might be a missing street or one that is incorrectly tagged as one-way, or a valve in a water system that is tagged as open when it’s actually closed.
In suitability models, several data layers are combined, in a series of steps, to create a result. Small errors in each of several layers can be compounded when the layers are combined. In addition, the errors are carried through subsequent steps—the results of each step are based on the previous steps, so before long your results will differ signifi-cantly from the results you’d obtain using better data.
For example, in a suitability analysis, a missing stream feature will result in an incorrect stream distance layer. The error will be compounded if the distance layer is combined with a land-cover layer on which the wrong land-cover code has been assigned to one area. Your final results will show some suitable areas as unsuitable, and vice versa.
Introducing GIS modeling 29
You’ll want to ensure you’re using the most accurate and current data possible. If the data isfromwithinyourownorganization,youcanrelyonthedataqualitycontrolsthatarein place. However, it’s increasingly common to gather data from a wide variety of sources, including the Internet. You’ll want to research the quality of the data and check it against alternate sources, if possible, to ensure it meets the requirements of your analysis. At the very least, by assessing the quality of the data you’ll know what level of confidence you can have in the results of your model.
Agriculture
Forest
Meadow
Shrub
Urban
Water
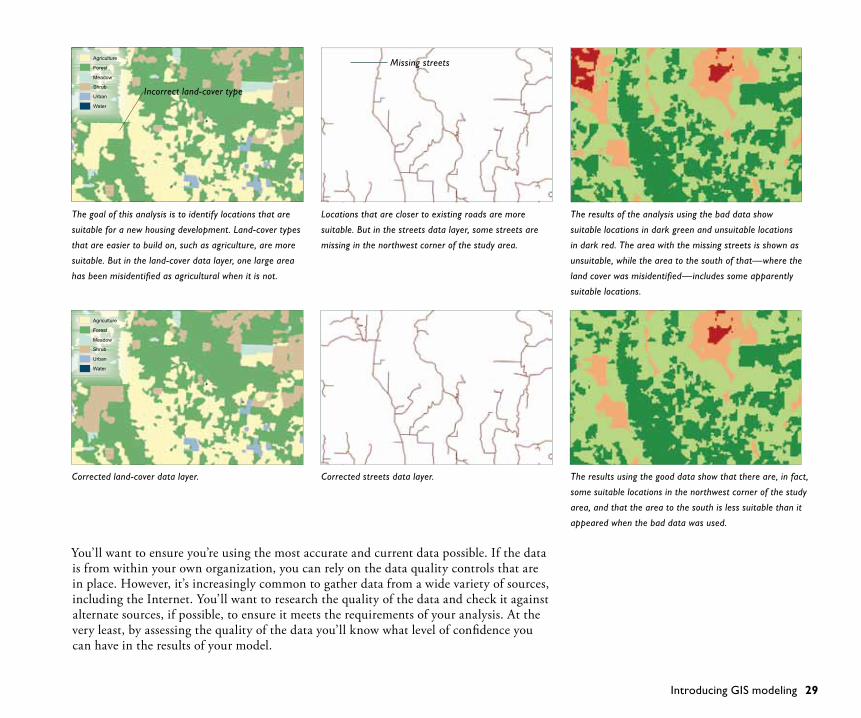
The goal of this analysis is to identify locations that are
suitable for a new housing development. Land-cover types
that are easier to build on, such as agriculture, are more
suitable. But in the land-cover data layer, one large area
has been misidentified as agricultural when it is not.
Locations that are closer to existing roads are more
suitable. But in the streets data layer, some streets are
missing in the northwest corner of the study area.
The results of the analysis using the bad data show
suitable locations in dark green and unsuitable locations
in dark red. The area with the missing streets is shown as
unsuitable, while the area to the south of that—where the
land cover was misidentified—includes some apparently
suitable locations.
Corrected land-cover data layer. Corrected streets data layer. The results using the good data show that there are, in fact,
some suitable locations in the northwest corner of the study
area, and that the area to the south is less suitable than it
appeared when the bad data was used.
Agriculture
Forest
Meadow
Shrub
Urban
Water
Incorrect land-cover type
Missing streets

30 The Esri Guide to GIS Analysis
Allen, David. 2011. Getting to Know ArcGIS ModelBuilder.Redlands,CA:EsriPress.Thebook presents tutorials that show you how to automate GIS analysis tasks (as well as data processing tasks) using ArcGIS ModelBuilder.
Carr,MargaretH.andPaulD.Zwick.2007.Smart Land-Use Analysis: The LUCIS Model. Redlands,CA:EsriPress.Thebookpresentsanapproachtoland-usesuitabilityanalysis.Includes a discussion of the Delphi process, pairwise comparison, and several other techniques for defining criteria.
Mitchell,Andy.2005.The Esri Guide to GIS Analysis, Volume 2: Spatial Measurements and Statistics.Redlands,CA:EsriPress.Includesdiscussionsofspatialautocorrelationandother issues related to spatial bias in GIS data.
Zeiler,Michael.2010.Modeling Our World: The Esri Guide to Geodatabase Design. Redlands,CA:EsriPress.ThisauthoritativebookonGISdatadescribesindetailthevarious types of spatial and attribute data used in GIS mapping and analysis.
references and further reading