introducing ncel - pide.org.pk commodity exchange... · size, as a percentage of us gdp (2004)...
TRANSCRIPT
Introducing NCEL

Agenda• Derivatives• A Futures Exchange• NCEL
– Vision / Mission– Business Model– Technology– Operations– Analytics & Risk Management– Contract Design– NCEL & Agriculture
Derivatives

Derivatives• Introduced in 1972 • Doubling every 3 years• Extremely low failure rate even if compared
to bank lending • Derivatives are termed as “new technology”• Common analogy – aircrafts versus cars • Rates of accident per kilometer are
extremely low as compared to road travel• Trillions of $s are traded daily

SIZE, as a percentage of US GDP (2004)
Derivatives, OutstandingTrillion US$, notional principal (as percent of U.S. GDP)
$272.86 (2340%)$115.24 (988%)Total
$52.80 (453%)$31.06 (266%)Exchange Traded
$220.06 (1887%)$84.18*(722%)OTC Derivatives
GLOBALUS
* US commercial banks only, broker-dealers and others not reporting
Global – 23 times the US GDP

Derivatives & InfrastructureExchange-Traded Derivatives Products:
– Fixed Income– Foreign Exchange– Equity– Commodity
Risk Management: – Analytics for quantifying risk – Risk based margining
Clearing & Settlement: – Novation & CCP– Guaranteed performance of contracts– 100% Trading of credit risk free contracts

Financials vs. Non Financials 2005
92%
8%Financials
Non Financials
9.9 billion contracts traded in 2005Financials: 9.1 billionNon-financials: 0.8 billion
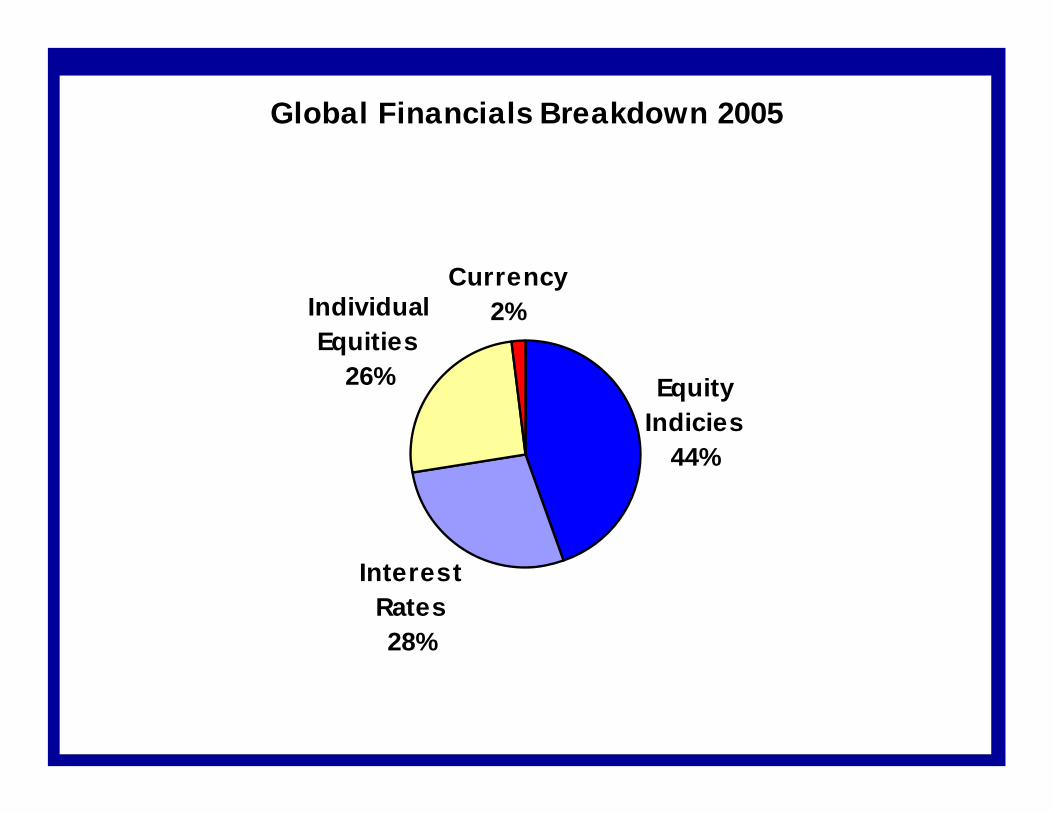
Global Financials Breakdown 2005
Equity Indicies
44%
Interest Rates28%
Individual Equities
26%
Currency2%

Global Agricultural, Metal and Energies Breakdown 2005
Agricultural44%
Energies36%
Metals20%
Other0%
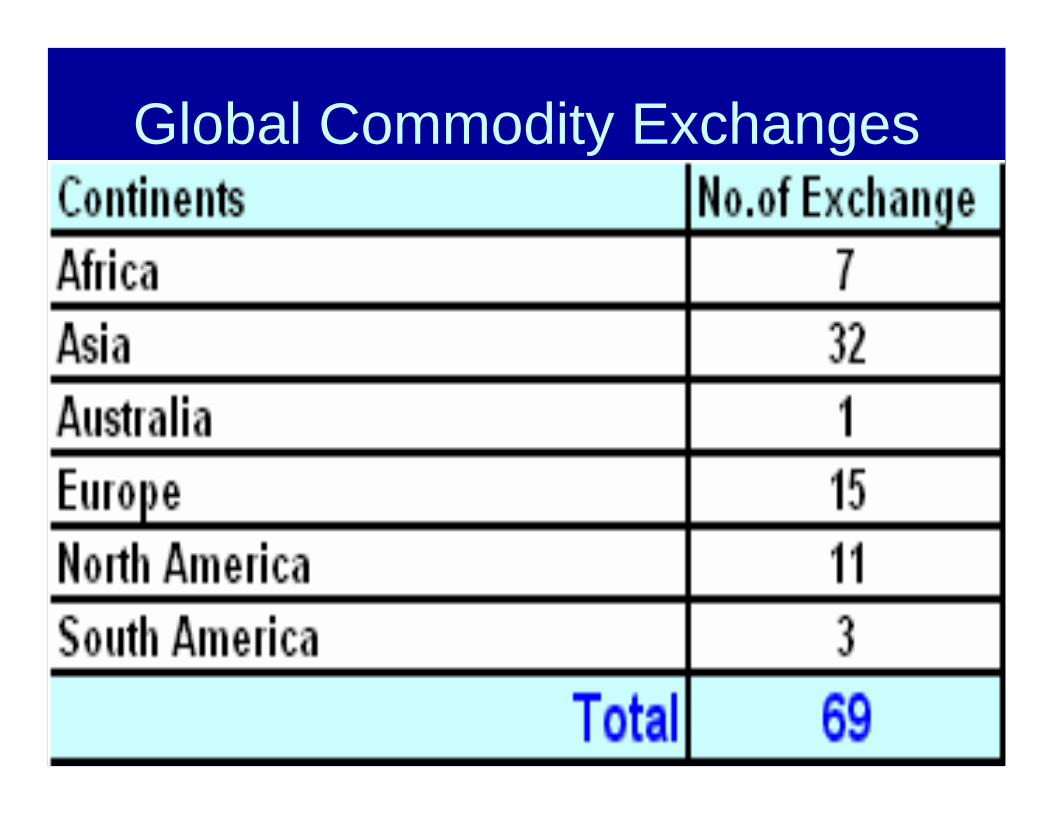
Global Commodity Exchanges

Growth of Commodity Exchanges• Three new commodity exchanges in India - 2004
– NCDEX is the sixth largest in the world within 2 years of its operations
• MCX to launch cotton yarn contract• Two commodity exchanges in Iran and third will be
opening in 2006• Dubai Gold and Commodity Exchange launched in
November 2005– To launch cotton and rice futures in Q3 2006
• Dubai Mercantile Exchange being launched in Q3 2006 – Crude Oil, Oil Products and Metals

1.850.24
0.50
7.758.94
11.83
13.97
16.49
0.06 0.170.72
1.67 2.133.51
4.315.29
0m
2m
4m
6m
8m
10m
12m
14m
16m
18m
Q1 04 Q2 04 Q3 04 Q4 04 Q1 05 Q2 05 Q3 05 Q4 05
Num
ber o
f fut
ures
con
trac
ts
NCDEXMCX
Growth of India's Commodity Exchanges
Source: Exchange data; projections made on the basis of compound quarterlygrowth rates during period Q1 2004 to Q2 2005
CQGR > 120%
A Futures Exchange

Role of a Futures Exchange• Futures Exchange:
– A regulated and an orderly marketplace where buyers and sellers express their collective future expectations
– Guarantees performance of contracts
– Disseminates prices
– Provides liquidity and depth through centralization
– Educates Investors
Exchange is only a thermometer of the price movements and is not responsible for the price movements
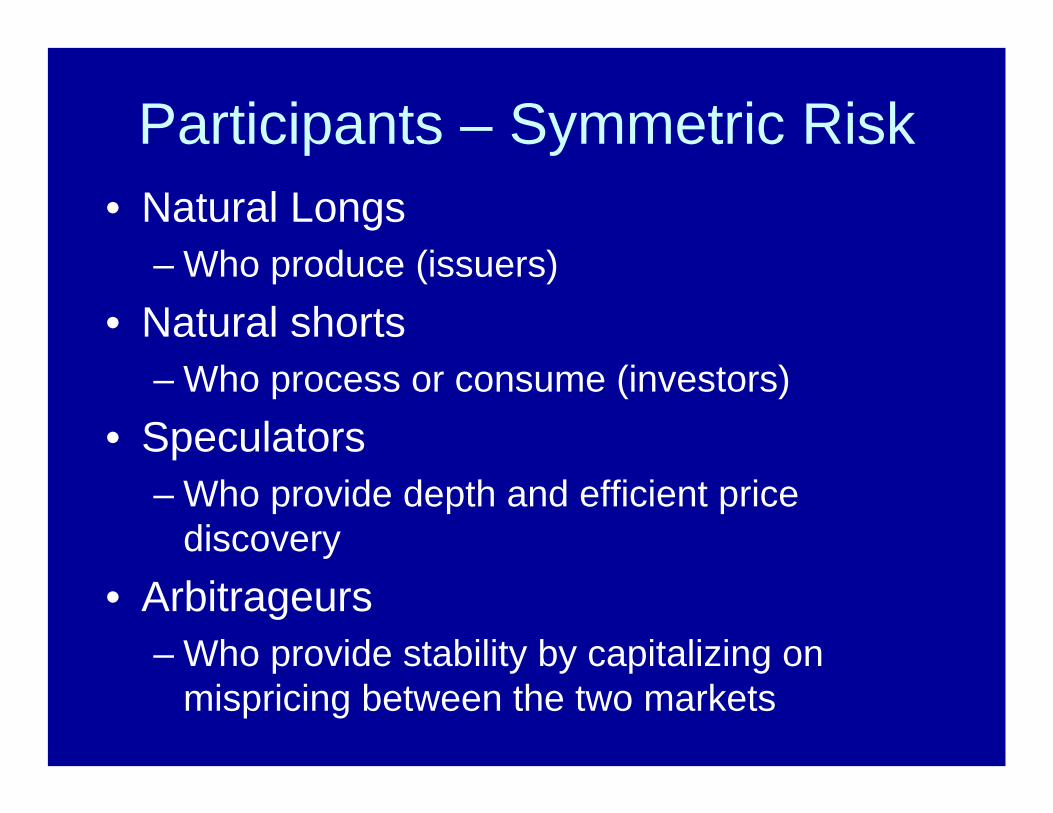
Participants – Symmetric Risk• Natural Longs
– Who produce (issuers)• Natural shorts
– Who process or consume (investors)• Speculators
– Who provide depth and efficient price discovery
• Arbitrageurs– Who provide stability by capitalizing on
mispricing between the two markets

Spot and Futures Markets• Two distinct and separate markets
– Spot Market – Futures Market
• The two markets interact to provide price signals
• The linkage between the two markets provides price stability
• The existence of a futures market stabilizes today’s prices

NCEL Vision/Mission
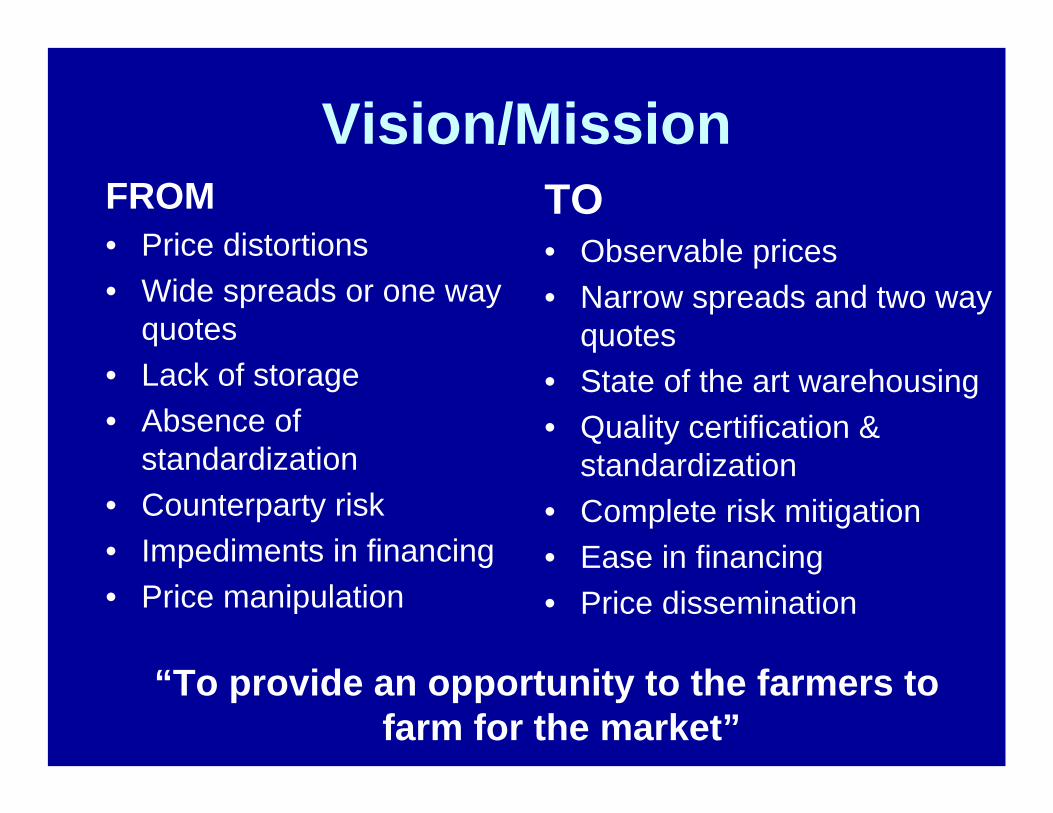
Vision/MissionFROM• Price distortions• Wide spreads or one way
quotes• Lack of storage• Absence of
standardization• Counterparty risk• Impediments in financing• Price manipulation
TO• Observable prices• Narrow spreads and two way
quotes• State of the art warehousing• Quality certification &
standardization• Complete risk mitigation• Ease in financing• Price dissemination
“To provide an opportunity to the farmers to farm for the market”

Wheat Price Comparison between Major & Minor Pakistani Markets
(For Four Years)
700
800
900
1000
1100
1200
1300
1400
OctDec Fe
bApr Ju
nAug OctDec Fe
bApr Ju
nAug OctDec Fe
bApr Ju
nAug OctDec Fe
bApr
Rup
ees/
100
Kg
Source: Federal Bureau of Statistics & Agri. Marketing Deptt.
Red = Average of Three Major Markets
Yellow = Average of 9 minor MarketsSowing
Harvest
Harvest
2002-03 2003-04 2004-05 2005-06
Sowing
SowingSowing
Harvest
Harvest

NCEL Business Model
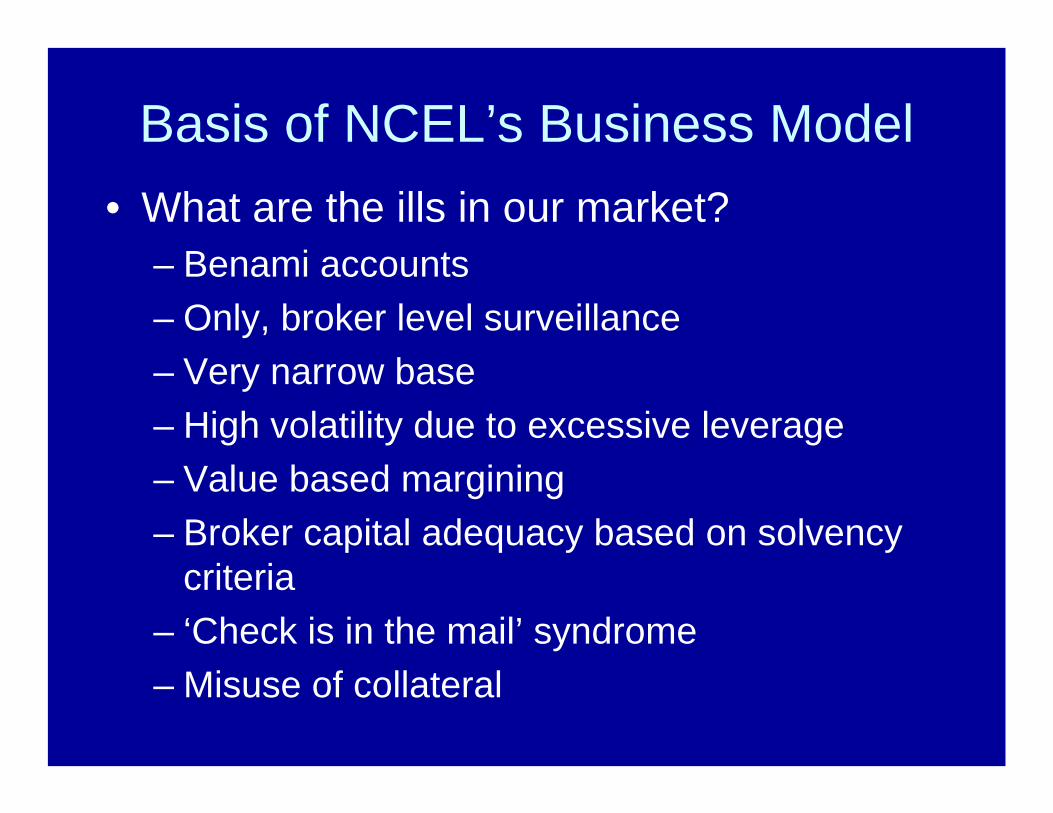
Basis of NCEL’s Business Model• What are the ills in our market?
– Benami accounts– Only, broker level surveillance– Very narrow base– High volatility due to excessive leverage– Value based margining– Broker capital adequacy based on solvency
criteria– ‘Check is in the mail’ syndrome– Misuse of collateral

NCEL Highlights• First partially demutualized exchange• First all-electronic exchange of Pakistan• First to introduce client level identification• First to provide complete segregation between
broker/client and client/clients• First to introduce risk based gross margining• First to integrate online banking with trading• First to undertake client level surveillance
Recent happenings highlights the strengths of NCEL’s business model

Business Drivers Implications
IntellectualCapital
Technology
Regulations
Markets
EnsuringCompliance
ControllingCosts
ManagingRisks
Operations
Key challenges for NCEL is to balance national priorities, reducing risks while improving processes and controlling costs
MarketParticipants
A cost effective solution of exceptional
quality
NCEL Business Model
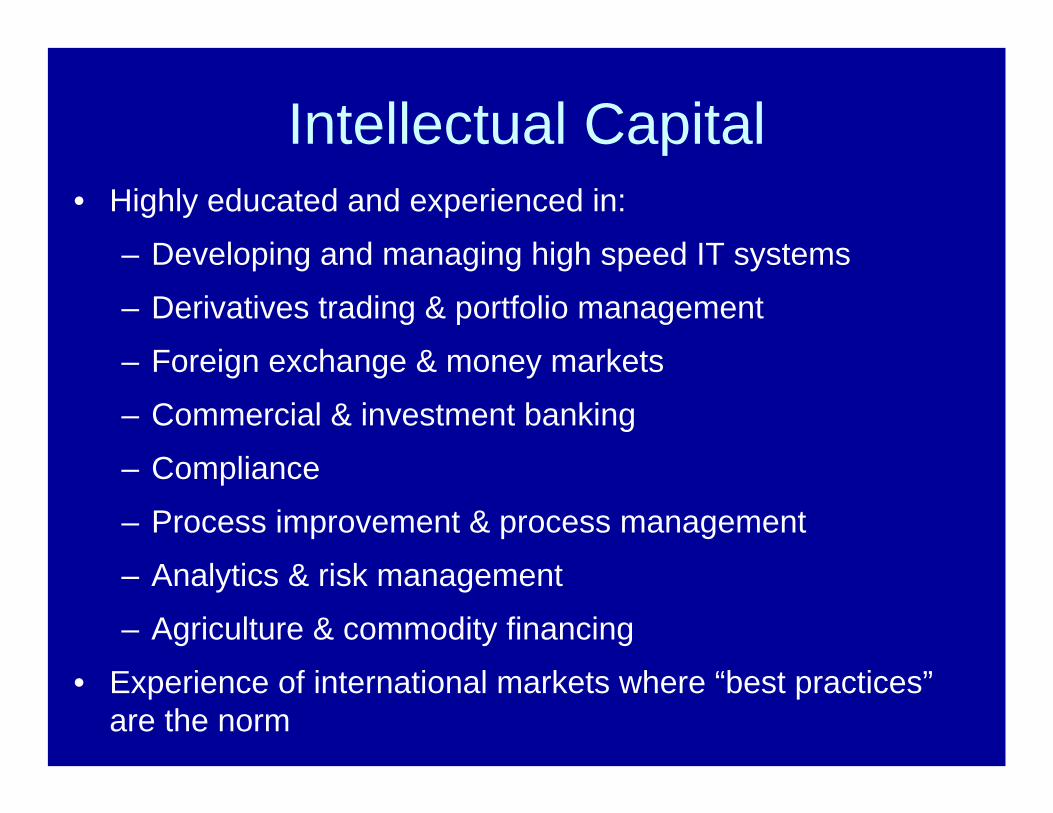
Intellectual Capital• Highly educated and experienced in:
– Developing and managing high speed IT systems
– Derivatives trading & portfolio management
– Foreign exchange & money markets
– Commercial & investment banking
– Compliance
– Process improvement & process management
– Analytics & risk management
– Agriculture & commodity financing
• Experience of international markets where “best practices”are the norm
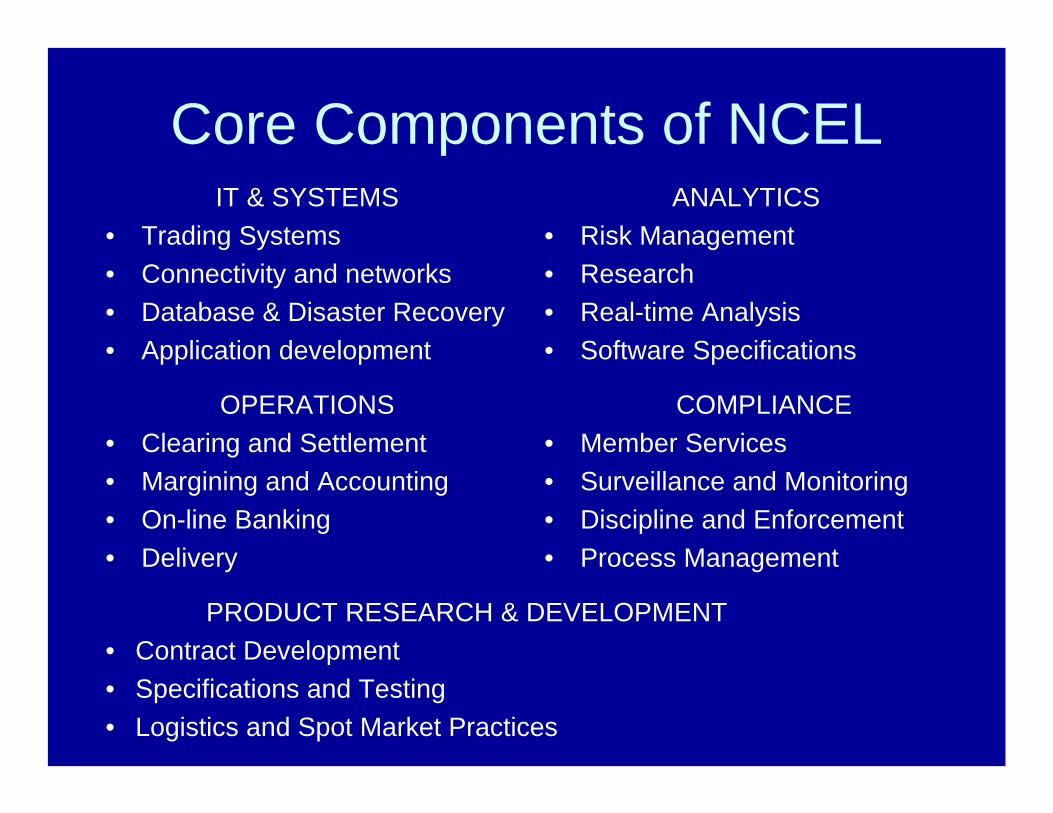
Core Components of NCELIT & SYSTEMS
• Trading Systems• Connectivity and networks• Database & Disaster Recovery• Application development
ANALYTICS• Risk Management• Research• Real-time Analysis• Software Specifications
OPERATIONS• Clearing and Settlement• Margining and Accounting• On-line Banking• Delivery
COMPLIANCE• Member Services• Surveillance and Monitoring• Discipline and Enforcement• Process Management
PRODUCT RESEARCH & DEVELOPMENT• Contract Development• Specifications and Testing• Logistics and Spot Market Practices

NCEL Technology

NCEL Trading System
Trade Capture
Pre-Trade Risk Management
Mark to
Market
Position
Update
Market Monitoring
Risk
Mgmt
Banking &
Settlement
Collateral
Mgmt
NCEL Trading
Platform
NCEL Broker
Trader “A”
Trader “B”
AssignedDeal
A & B Clients of NCEL Broker
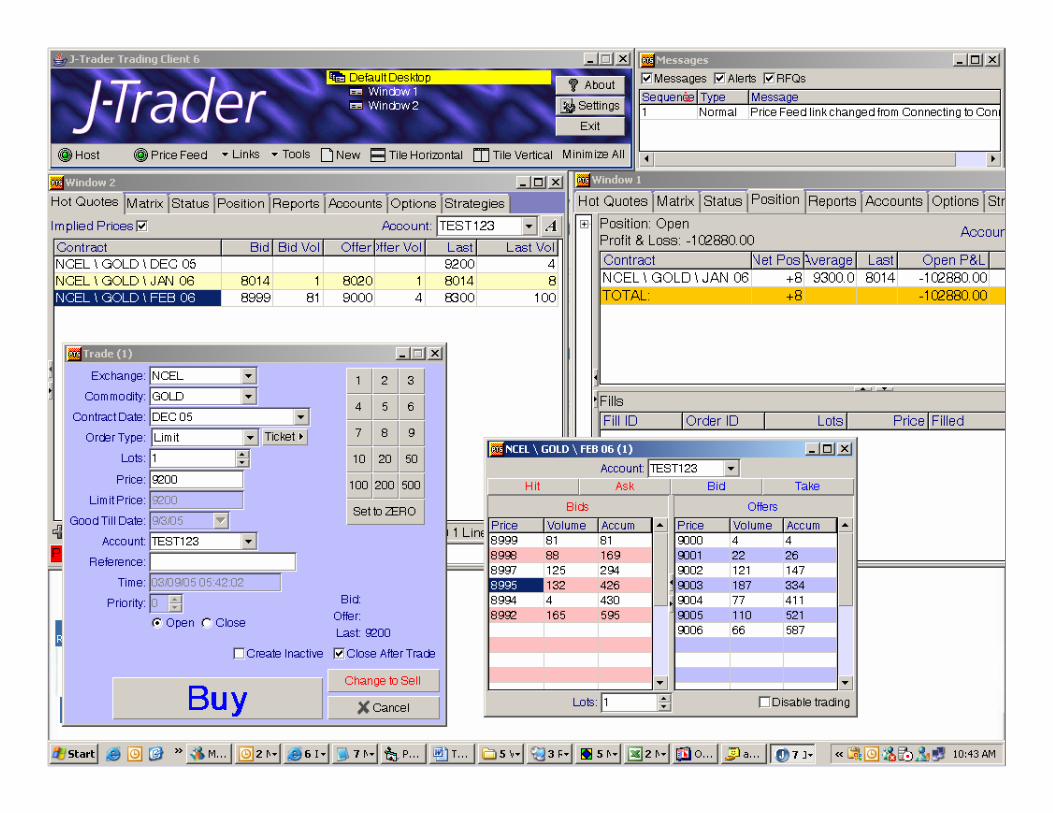
NCEL Trading Terminal -- orders are born here

NCEL Operations
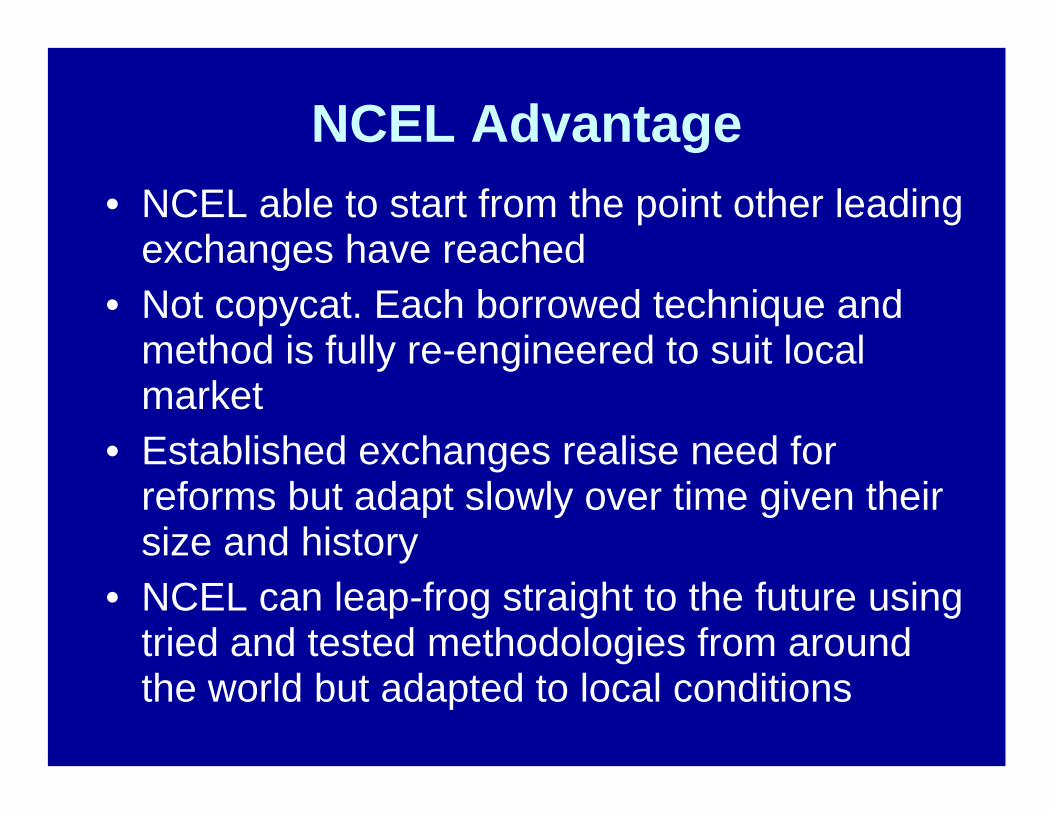
NCEL Advantage• NCEL able to start from the point other leading
exchanges have reached• Not copycat. Each borrowed technique and
method is fully re-engineered to suit local market
• Established exchanges realise need for reforms but adapt slowly over time given their size and history
• NCEL can leap-frog straight to the future using tried and tested methodologies from around the world but adapted to local conditions

NCEL Operations v Rest of WorldNCEL
• Online, Electronic Trading up to client level with UID for all
• Client has direct access to the market with pre-trade checks
• Margining for each and every account at Exchange level
• Monitoring up to client level
• Margins in cash only
International Practice• Physical and Electronic• Brokers provide online
access• All orders routed through
brokers• Post-trade margining• Members responsible for
margining clients• Market-wide & broker level
surveillance with client level reporting
• Securities are acceptable

Completely Segregated Accounts
NCEL
Member111-000-000
House111-000-1000
Client 1111-000-1001
Client 2111-000-1002
Client 3111-000-1003
Client 4111-000-1004
NCEL LEDGER Online Clearing Bank
Daily Account Swipes
Member111-000-0000
House111-000-1000
Client 1111-000-1001
Client 2111-000-1002
Client 3111-000-1003
Client 4111-000-1004
Initial & Variation
Margins and Clearing Deposits

Multan Faislabad Muree
Quetta
Client 1 0891-5660 10,000Client 2 0891-5661 15,000Client 3 0891-5662 40,000Client 4 0891-5663 5,000
Broker inPeshawar
Client 1 Client 2 Client 3
Client 4
Online Clearing Bank Accounts
Transfer Client Funds to Exchange
NCEL0791-4830
70,000
Online Bank Transfer
Online Bank Transfer
Online Bank Transfer
Online Bank Transfer
Symmetric Participation
Natural Longs
Natural Shorts
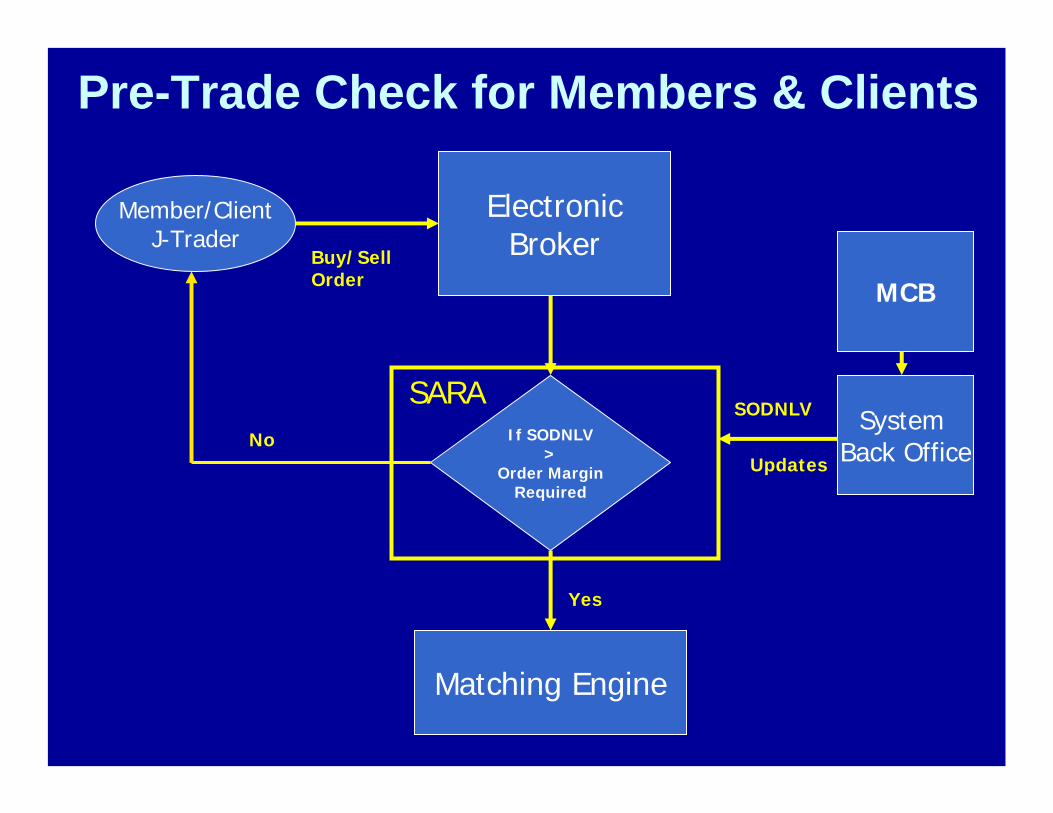
Pre-Trade Check for Members & Clients
Member/ClientJ-Trader
ElectronicBrokerBuy/Sell
Order
If SODNLV>
Order MarginRequired
SARA
Matching Engine
Yes
NoSystem
Back Office
MCB
SODNLV
Updates
Daily Settlement• All positions marked-to-market daily• P&L of positions in real-time• Margin calls generated at end of today • Settlement of margin calls latest by 8.00 PM• Trading matches fund settlement• Margins, price limits, and clearing and
position limits ensure that few trades progress to the stage of default

Analytics &
Risk Management

Risks in Clearing and Settlement
Slice N’ Dice Approach to Risk Management
Credit Risk/
Residual Risk
Market Risk
Counterparty Risk
Third Party Credit Risk
Operational Risk
Liquidity Risk
SettlementRisk
ConcentrationRisk
VolatilityRisk
Margins (99%)
Clearing Funds to mitigate extreme events (1%)
Legal Risk

Value at Risk - An Example
• Let’s use a 5% probability and a one-day holding period
• VaR is the one day loss that will be exceeded only 5% of the time
• It’s the tail of the return distribution
• In the example, the VaR is about Rs60,000
Return Distribution
VaR(10
0,000
) 0
100,0
00
Portfolio Gains/Losses
Prob
abili
ty


0
10
20
30
40
50
60
Trading B
egins
Spot Month
Delive
ry Month
Risk Management Example(illustration only)
Settlement Price
Lower Price Limit
Upper Price Limit
Spot MonthMargin
VariableMargin
Initial Margin

Default Protection: Segregation of Participant Risk
ClearingParticipants
ClearingParticipantsMarket
ParticipantsMarket
Participants
Prop
Prop
Prop
SGF

Controlling Excessive Speculation• Position limits
– Market wide– Broker level– Client level
• Volatility based variable margining• Online and real-time client level surveillance• Regulations allow forced reduction of
position limits if prudential concerns• Close-out if breach of Regulations
Reduced in delivery month
Contract Design

Contract Choice and Design• First Principle: Futures contract should
mirror or improve upon the imperfections of the spot market
• Four out of Five new futures contracts fail and are de-listed within the first five years of trading
• Two possible reasons:– Lack of demand for the contract itself– Poor contract design
• Of course these two reasons are related to one another

Research & Product Development MethodologyCash Value
Cash Price Volatility
Production
Consumption
Export
Import
Detailed Study of Contracts Listed on Other Exchanges
Need of The Contract in Market
Desk Research
Market Research
Formulation of Contract Specifications
Questionnaire Development
Delivery Procedures
Delivery Unit & Size
Deliverable Grades
Packaging
Warehouse Selection
Premium/Discounts
Trading conditions
Unit of Trade
Unit for Price Quotation
Contract Months & Months Traded In
Basis Price
Tick Size
Testing & Quality Certification
Weight
Premium/Discount
Charges
Quality Certificate
Sampling
Analytics
Initial Margin
Maintenance Margin
Position Limits
Circuit Breakers
Finalization of Contract
Approval from SECP
Launch of The Contract for Trading
Approval from NCEL Board
Preparation of Commodity Brochure for Participants'
Education
Industry ConsultationFeedback
Millers
Manufacturer of Value Added Products
Traders
Exporters / Importers
Progressive Growers
Trade Associations
Identification of Key Market Players &
Recommendations for Commodity Specific
Memberships
Special/Spot/Delivery Margin
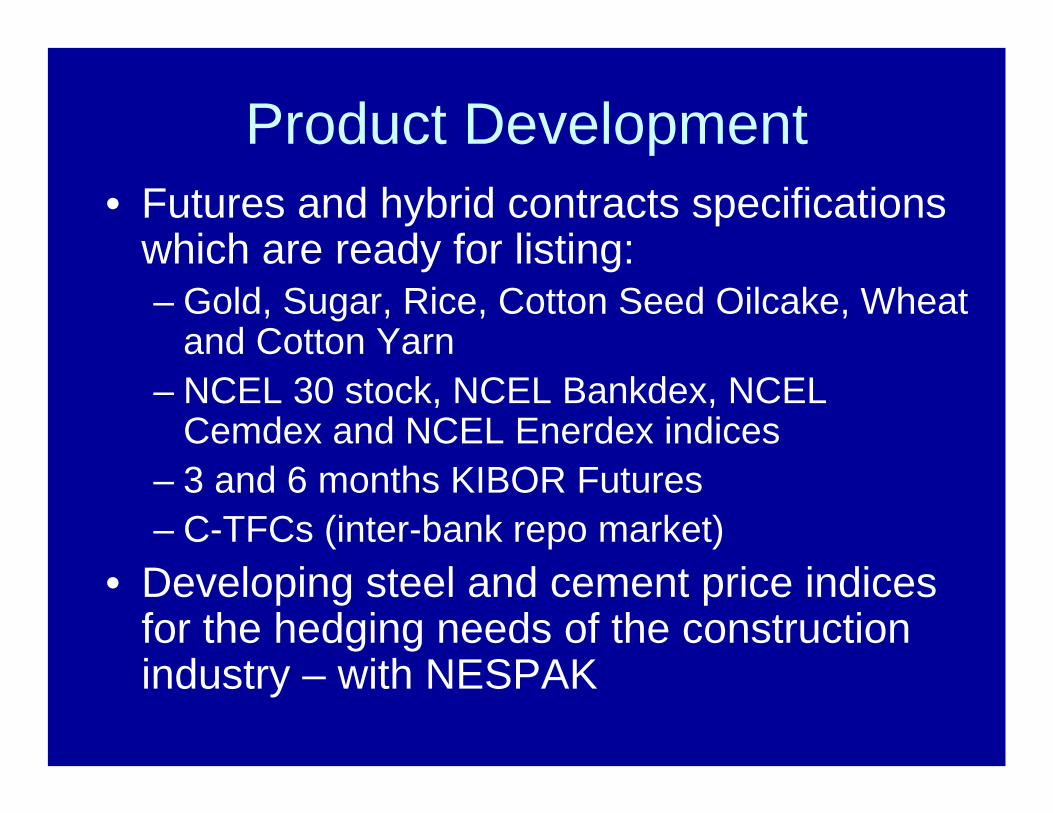
Product Development• Futures and hybrid contracts specifications
which are ready for listing:– Gold, Sugar, Rice, Cotton Seed Oilcake, Wheat
and Cotton Yarn– NCEL 30 stock, NCEL Bankdex, NCEL
Cemdex and NCEL Enerdex indices– 3 and 6 months KIBOR Futures– C-TFCs (inter-bank repo market)
• Developing steel and cement price indices for the hedging needs of the construction industry – with NESPAK
NCEL & Agriculture

Benefits of a Commodity Exchange• Reduces price volatility
• Reveals monopoly mark-up
• Generates signals of future prices, today
• Converts unregulated market into a regulated market
• Empowers state-owned organizations and policy makers to make informed decisions
• Improves input/production decisions, if less price uncertainty, thus improving quality and yield
• Vehicle for transmission of the trickle down effect

NCEL Hub & Spokes
Producers(Farmers/
Middlemen)
NCELAn Electronic
Exchange
Consumers(Retail/
Institutional)
Clearing Banks
Warehousing
QualityCertification
Agencies
Transporters/Logistic Support
Agencies
Traders(Investors)
Arbitrageurs/Client)
Hedger(Exporters/
Millers/Industry)
Global Commodities Market
Spot & Futures Markets
MCB BankUTI InternationalA US Company
Market Participants
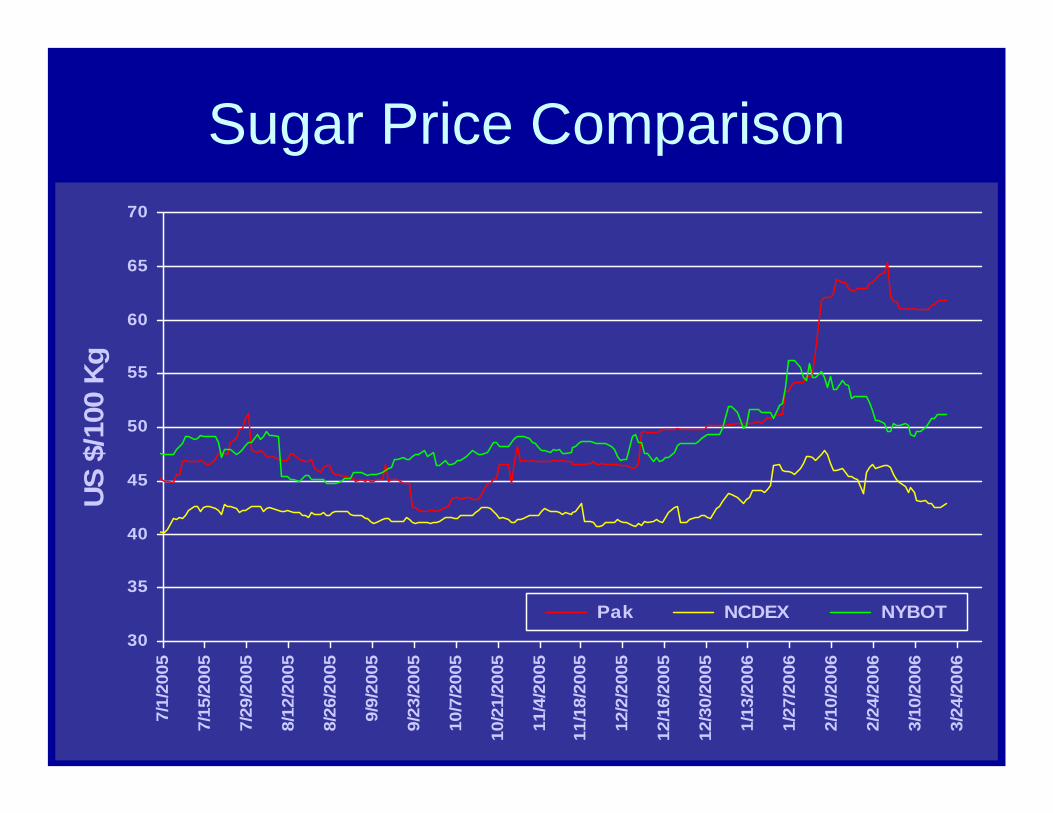
Sugar Price Comparison
30
35
40
45
50
55
60
65
70
7/1/
2005
7/15
/200
5
7/29
/200
5
8/12
/200
5
8/26
/200
5
9/9/
2005
9/23
/200
5
10/7
/200
5
10/2
1/20
05
11/4
/200
5
11/1
8/20
05
12/2
/200
5
12/1
6/20
05
12/3
0/20
05
1/13
/200
6
1/27
/200
6
2/10
/200
6
2/24
/200
6
3/10
/200
6
3/24
/200
6
US
$/10
0 K
g
Pak NCDEX NYBOT
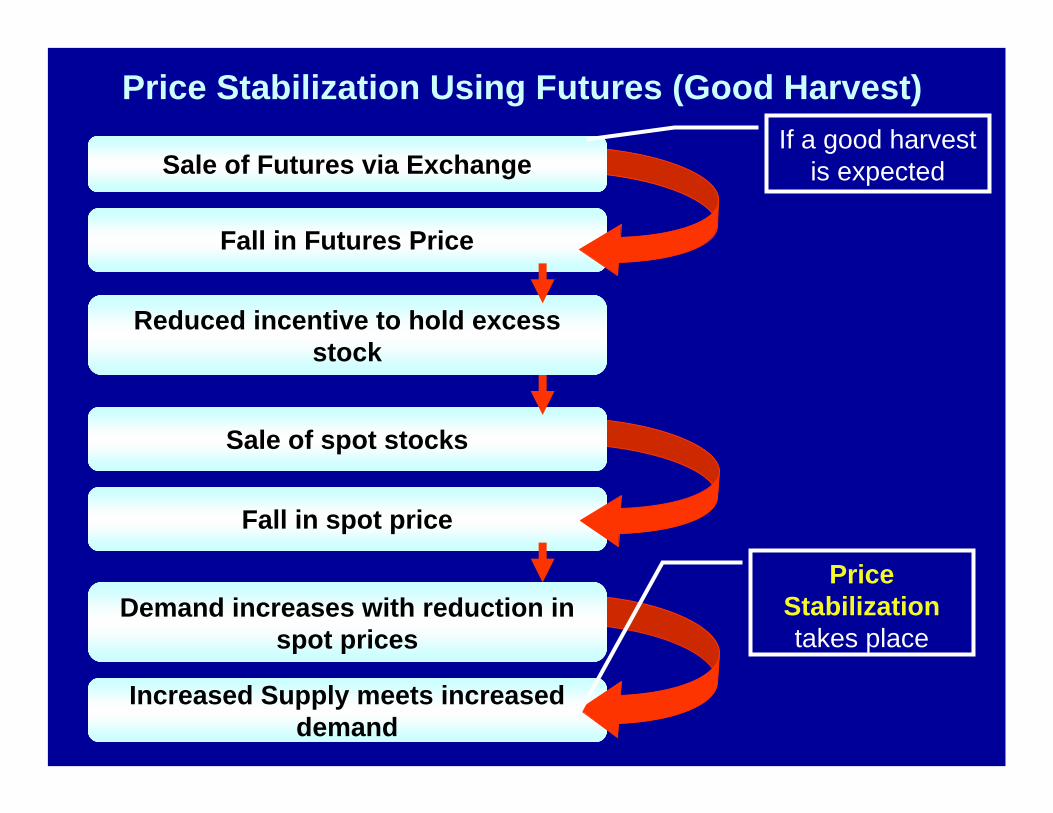
Fall in Futures Price
Reduced incentive to hold excess stock
Fall in spot price
Increased Supply meets increased demand
Demand increases with reduction in spot prices
Sale of spot stocks
Sale of Futures via Exchange
Price Stabilization Using Futures (Good Harvest)If a good harvest
is expected
Price Stabilizationtakes place

Rise in Futures Price
Increased incentive to hold excess stock
Rise in spot price
Reduced demand meets reduced supply
Demand Decreases with increase in spot prices
Purchase of spot stocks
Purchase of Futures via Exchange
Price Stabilization Using Futures ( Bad Harvest)If a bad harvest
is expected
Price Stabilizationtakes place
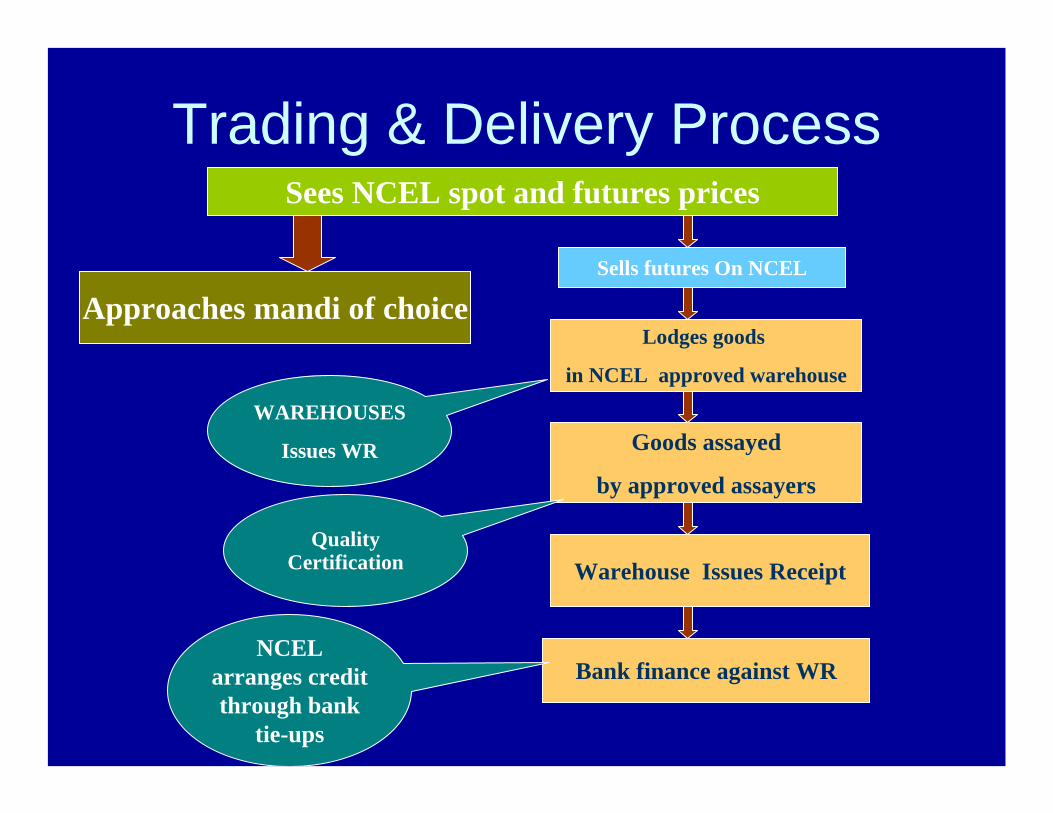
Trading & Delivery ProcessSees NCEL spot and futures prices
Approaches mandi of choiceSells futures On NCEL
Bank finance against WR
Lodges goods
in NCEL approved warehouse
Goods assayed
by approved assayers
Warehouse Issues Receipt
WAREHOUSES
Issues WR
Quality Certification
NCEL arranges credit through bank
tie-ups

Prerequisites for Commodity based Financing
• To convert agricultural produce into a tradable instrument – Warehouse Receipt
• But it Requires an Institutional Framework– Sound banking system– Futures exchanges– Price stability– Network of warehouses– Collateral Managers
The Concern is warehousing and collateral managers

Proposal – Jointly with MINFAL
If approved, NCEL plans to link 11 major mandis in the next 3 months

Thank You