introduction - front page | u.s. department of the treasury the high quality market (hqm) corporate...
TRANSCRIPT

1

Introduction
● The High Quality Market (HQM) Corporate Bond Yield Curve for the Pension Protection Act (PPA) uses a methodology developed gy pat Treasury to construct yield curves from extended regressions on maturity ranges.
● This presentation discusses basic concepts for understanding and● This presentation discusses basic concepts for understanding and using the HQM yield curve, and presents an overview of the curve methodology. For links to more detailed documentation and technical descriptions of the curve, see the last slide.p ,
● The methodology for the HQM curve is general. It has been applied to Treasury inflation-indexed securities (TIPS) and has been used to construct other corporate bond yield curves; anbeen used to construct other corporate bond yield curves; an example of a AA curve appears at the end of this presentation.
2

HQM Yield Curve Summary
● A yield curve provides information about a sector of the bond market at a point in time. The information includes yields onmarket at a point in time. The information includes yields on different types of bonds in this sector at various maturities.
● The HQM yield curve pertains to the high quality corporate bond market i e corporate bonds rated AAA AA or A Themarket, i.e., corporate bonds rated AAA, AA, or A. The regression methodology of the HQM curve blends AAA, AA, and A bonds into a single yield curve that represents the market-weighted average quality of high quality bondsweighted average quality of high quality bonds.
● The HQM methodology also projects yields beyond 30 years maturity out through 100 years maturity. The methodology ensures that the projections are consistent with yields before 30ensures that the projections are consistent with yields before 30 years maturity and with long-term investment returns available in the market.
3

Spot Rates
● The yields provided by the HQM Corporate Bond Yield C t t Th HQM id t tCurve are spot rates. The HQM curve provides spot rates for each maturity at half-year intervals for maturities of ½ year up through 100 years, for a total of 200 spot rates.
● The spot rate for any maturity is defined as the yield on a bond that gives a single payment at that maturity. This is called a zero coupon bond.called a zero coupon bond.
● Because high quality zero coupon bonds are not generally available, the HQM methodology computes the spot rates so as to make them consistent with the yields on other high quality bonds.
4

Spot Rates, continued
● The HQM yield curve is calculated late in the day for each b i d d th bli h d thl HQM t tbusiness day, and the published monthly HQM spot rates are averages of rates for all the business days of the month.
● Segment rates required by the PPA are derived from theSegment rates required by the PPA are derived from the monthly average spot rates.
● The next chart plots the 200 monthly average spot rates out through 100 years maturity from the HQM yield curves for July and August of this year. The August curve is below July beyond the shortest maturities.
5

9 9
HQM SPOT YIELD CURVESMonthly Averages, Percent
678
678
456
456
August 2011
23
23July 2011
10 20 30 40 50 60 70 80 90 10001
01Maturity
6

Discounting Liabilities
● The HQM spot rates are used to discount future pension li biliti t id th t f di l l d d fliabilities to provide the present funding level needed for the liabilities. Therefore, regardless of the assets chosen to do the funding, the HQM spot rates give the funding level t k t i ht d hi h dit litat a market-weighted high credit quality.
● A different quality yield curve would give a different funding level: the higher the credit quality of the bonds infunding level the higher the credit quality of the bonds in the yield curve used for discounting, the higher the funding level and the greater the funding burden on the pension plan but also the lower the risk that the plan will becomeplan, but also the lower the risk that the plan will become underfunded.
7

Discounting Liabilities, continued
● Therefore, the choice of the credit quality for the yield curve implies a decision about the tradeoff between higher funding levels and less pension underfunding risk, versus lower funding levels and more risk.
● Consequently, a different yield curve from the HQM yield curve may change funding requirements substantially. E g the use of a Treasury curve would increaseE.g., the use of a Treasury curve would increase significantly the funding burden relative to the HQM curve.
8

Blended High Quality Bonds
● Although no individual bond has the credit quality represented by the HQM yield curve the curve can be usedrepresented by the HQM yield curve, the curve can be used for an appropriate blended set of high quality bonds.
● For example, if 5 percent of the high quality market is AAA rated, 25 percent is AA rated, and 70 percent is A rated, a blended high quality bond of 10 years maturity consisting of 5 percent 10-year AAA, 25 percent 10-year AA, and 70 percent 10-year A can be priced by applying the HQM spot rates to the cash flows from these bonds.
● Th f i i i l i li biliti ld b f d d● Therefore, in principle, pension liabilities could be funded by a portfolio of blended high quality bonds, and the value of this portfolio would track the HQM yield curve.
9

Blended High Quality Bonds, continued
● Of course, this approach is difficult for a variety of reasons, including ratings changes within the portfolio whichincluding ratings changes within the portfolio which require rebalancing, and lack of bonds beyond 30 years maturity.
● Moreover, changes in the relative sizes of the three high quality ratings categories would require changes in the blended bonds to remain consistent with the HQM yield Q ycurve.
● Therefore, it’s no surprise that typical bond portfolios that d t t f th diffi lti d ’t t k th HQMdo not account for these difficulties don’t track the HQM curve exactly.
10

HQM Risk Aspects
● Nevertheless, it’s not clear that any other yield curve would be easier to hedge than the HQM yield curve. Even Treasury coupon issues stop at 30 years maturity, and have special inconsistencies such as on-the-run issues.
● In analyzing hedging, it must also be kept in mind that the HQM yield curve provides a suitable level of pension funding that is both accurate and stable over timefunding that is both accurate and stable over time. Therefore, the HQM curve can be relied upon for planning, and in that sense reduces risk.
11

HQM Risk Aspects, continued
● Also, the monthly average feature of the HQM yield curve may further reduce certain types of risk.
● This is because no portfolio tracks the HQM curve perfectly and therefore it’s important that the curve beperfectly, and therefore, it s important that the curve be stable for planning purposes. The monthly average reduces the possible volatility in the curve that could come f i l b h i t th dfrom special behavior at month-end.
12

Yield Curve Methodology
● The following slides contain an overview of the HQM yield th d lcurve methodology.
● Different yield curve methodologies can produce very different results, which affect pension liabilities anddifferent results, which affect pension liabilities and everything else for which the curve is used. Therefore, it’s essential to develop the methodology that accurately captures market behaviorcaptures market behavior.
● Moreover, an understanding of the HQM methodology aids greatly in the appropriate use of the HQM curve.
13

HQM Methodology Features
The HQM yield curve methodology contains features and capabilities that do not appear in other yield curvecapabilities that do not appear in other yield curve approaches:
● This methodology combines regression variables with the● This methodology combines regression variables with the yield curve.
● The methodology projects yields beyond 30 years.
● The methodology makes use of established bond market characteristics to help generate a stable curve that captures market movementscaptures market movements.
14

HQM Methodology: Regression Variables
● The HQM methodology has the special capability of combining regression variables with the yield curve. The regressionregression variables with the yield curve. The regression terms adjust for the particular attributes of individual bonds.
● The HQM yield curve contains two regression terms. These t dj t t f t th t bl d AAA AA d Aterms are adjustment factors that blend AAA, AA, and A bonds into a single HQM yield curve that pertains to the market-weighted average quality of high quality bonds.
● Other yield curve approaches were typically developed for Treasury securities, and they do not take into account the distinctive characteristics of corporate bonds. Other papproaches do not have regression variables and cannot blend bonds of different qualities.
15

HQM Methodology: Projections
● The HQM methodology projects yields beyond 30 years maturity out to 100 years maturity to get discount rates formaturity out to 100 years maturity to get discount rates for long-dated pension liabilities.
● The methodology ensures that the projections are gy p jconsistent with yields before 30 years maturity and with long-term investment returns available in the market.
Oth i ld h ll t t 30● Other yield curve approaches generally stop at 30 years maturity and contain no provision for projection.
16

HQM Methodology: Established Market Views
● The HQM methodology is derived from basic hypotheses about corporate bond markets. The hypotheses inform the setting of the parameters that underpin the HQM yield curve.
● Other yield curve approaches typically use mathematical functions that don’t have any foundation in market hypotheseshypotheses.
● Consequently, differences among yield curves given by other approaches with different mathematics are arbitrary, pp y,in that there is no way to choose among them.
17

Estimation of HQM Spot Rates
● Estimation of the spot rates in the HQM yield curve starts b h i i t t f b d (d ib d l t )by choosing an appropriate set of bonds (described later).
● The regression terms are computed so that the price of each bond adjusted by the regression terms equals what iteach bond adjusted by the regression terms equals what it would have been if the bond were of market average high quality. (Technical discussion of the regression terms is found in the references )found in the references.)
● The spot rates are chosen to be the rates that give the best statistical fit to all the prices in the bond set. This means that the estimated prices of the bonds, given as their cash flows discounted by the spot rates, come closest on average to their actual prices.
18

Estimation of HQM Spot Rates, continued
● Note that the HQM yield curve estimation employs a model of bond prices The estimation does not directly use bondof bond prices. The estimation does not directly use bond yields or averages of yields.
● However, the description so far of the estimation is too general actually to get spot rates statistically. To carry out the estimation, the spot rates must be assumed to follow a mathematical pattern or functional form.
● The main source of differences among yield curve approaches is their different choices of functional forms, and as noted functional forms in other approachesand as noted, functional forms in other approaches typically are not grounded in market hypotheses. The HQM methodology bases the functional form on hypotheses b t t it i th k t
19
about maturity ranges in the market.

The Forward Rate
● The concept of the forward rate is useful for picking a● The concept of the forward rate is useful for picking a functional form for estimating the spot rates.
● The forward rate is straightforward: for each maturity, consider entering into a contract to invest an amount at the time of that maturity for a small amount of time beyond that maturity. The forward rate at that maturity is the future interest rate on this investment.
20

The Forward Rate, continued
● In general, analogous to spot rates, the market does not g , g p ,provide explicit forward rates, and they must be inferred from other prices in the market.
Th f d t i hi h t i t it h● The forward rate is higher at a given maturity when investors who are trading at that maturity are less eager to lend based on their views of uncertainty and their
i b h k hil bexpectations about the market, while borrowers are more eager to borrow based on their perceptions. The forward rate summarizes market views at each maturity in a single number.
21

Maturity Ranges
● Trading in bonds tends to divide into maturity ranges. The trades that take place in each maturity range on average reflect similar preferences and expectations of traders in that range.
● As a consequence, the forward rates in each maturity range are related, because they reflect the views of traders.
● Therefore, the HQM methodology models the forward rates in each maturity range as a smooth (cubic) function, and joins the functions together smoothly (as a cubic spline).j g y ( p )
22

Maturity Ranges, continued
● The HQM methodology uses five maturity ranges● The HQM methodology uses five maturity ranges, delineated by the maturity points 0, 1.5, 3, 7, 15, and 30 years maturity.
● The choice of fixed maturity ranges increases significantly the stability of the HQM yield curve estimates over time.
23

The Long-Term Forward Rate
● Assumptions must be made in order to project forward p p jrates beyond 30 years maturity so as to obtain spot rates out through 100 years maturity.
Fi t f ll th l t f d t b d 30● First of all, the long-term forward rate beyond 30 years maturity is set to a constant, because there are usually not enough data to estimate accurately movements in the f d t b d 30 t itforward rate beyond 30 years maturity.
24

The Long-Term Forward Rate, continued
● Next the HQM methodology postulates that the long-term forward rate is determined by the same factors that affect forward rates in the longest 15- to 30-year maturity range, since that range is likely sufficiently distant in time to reveal underlying long-term attitudes toward risk.
● Therefore, the constant long-term forward rate from 30 years maturity up through 100 years maturity is taken toyears maturity up through 100 years maturity is taken to be the average forward rate in the 15- to 30-year maturity range.
25

Estimation
● The forward rates in the maturity ranges are estimated by least squares, and the spot rates are derived from the estimated forward rate curve.
● The regression terms and adjustment factors are● The regression terms and adjustment factors are simultaneously estimated. Before estimation, the bond data are weighted. (The adjustment factors and weighting are described in the references )are described in the references.)
26

Data
● The HQM yield curve uses data from a set of high quality corporate bonds rated AAA AA or A that accuratelycorporate bonds, rated AAA, AA, or A, that accurately represent the high quality corporate bond market.
● The bonds are selected from the universe of all high quality g q ybonds based upon several types of characteristics.
● The HQM curve is meant to represent all bonds in the k t S b d th t i i d d il bl f t d imarket. So a bond that is priced and available for trade is
included even if its yield appears to be an outlier relative to yields on other bonds. Such a bond is excluded only if there i h h l i ld f h l iis some reason other than unusual yield for the exclusion.
27

Data, continued
● The basic type of selected bond is analogous to conventional Treasury coupon issues: a bond that pays a y p p yfixed semiannual nominal coupon denominated in U.S. dollars until maturity, when the principal is returned.
Th b d i i h h 30 i h● The bond set covers maturities up through 30 years, with maturities below 1 year filled in by Federal Reserve commercial paper rates. Bid prices are used. Each bond must meet a minimum size threshold in terms of par amount outstanding, currently $250 million.
● The number of corporate bonds that fulfill these● The number of corporate bonds that fulfill these specifications is sufficiently large at all maturities that there is no problem in computing the HQM yield curve.
28

Results
● The following charts present sample results for the HQM i ld f i l d A t 31 2011 th l t d fyield curve for a single day, August 31, 2011, the last day of
August. As noted earlier, the published HQM curve for August is the monthly average.
Characteristics of the bonds included in the August 31 set:
Maturity Range Number of Rating Number of (years) Bonds0 – 1.5 2251.5 – 3 283
BondsAAA 42AA 299 1.5 3 283
3 – 7 5027 – 15 287
AA 299A 1,345
Commercial paper 12
29
15 – 30 401Total 1,698

Results, continued
● The first chart shows the estimated forward rate curve for A t 31 2011 l tt d th h 30 t it dAugust 31, 2011 plotted through 30 years maturity, and projected out through 40 years maturity.
● The chart depicts the forward rate in the five maturity● The chart depicts the forward rate in the five maturity ranges, delineated by the vertical lines at the maturities 0, 1.5, 3, 7, 15, and 30 years.
● The forward curve is fixed at 30 years maturity and beyond at the long-term forward rate of 6.76 percent, which is given by the average of the forward rate in the 15–30 year maturity range.
30

HQM FORWARD RATE CURVE
9 9Knots: 0 1 5 3 7 15 30
HQM FORWARD RATE CURVE8/31/2011, Percent
Projected Beyond 30
678
678Knots: 0,1.5,3,7,15,30 Projected Beyond 30
456
456
Flattens Out
234
234
Average 15 to 30 = Value at 30 = 6.76Becomes
Linear
0 5 10 15 20 25 30 35 4001
01Maturity, Years
Linear
31
Results, continued
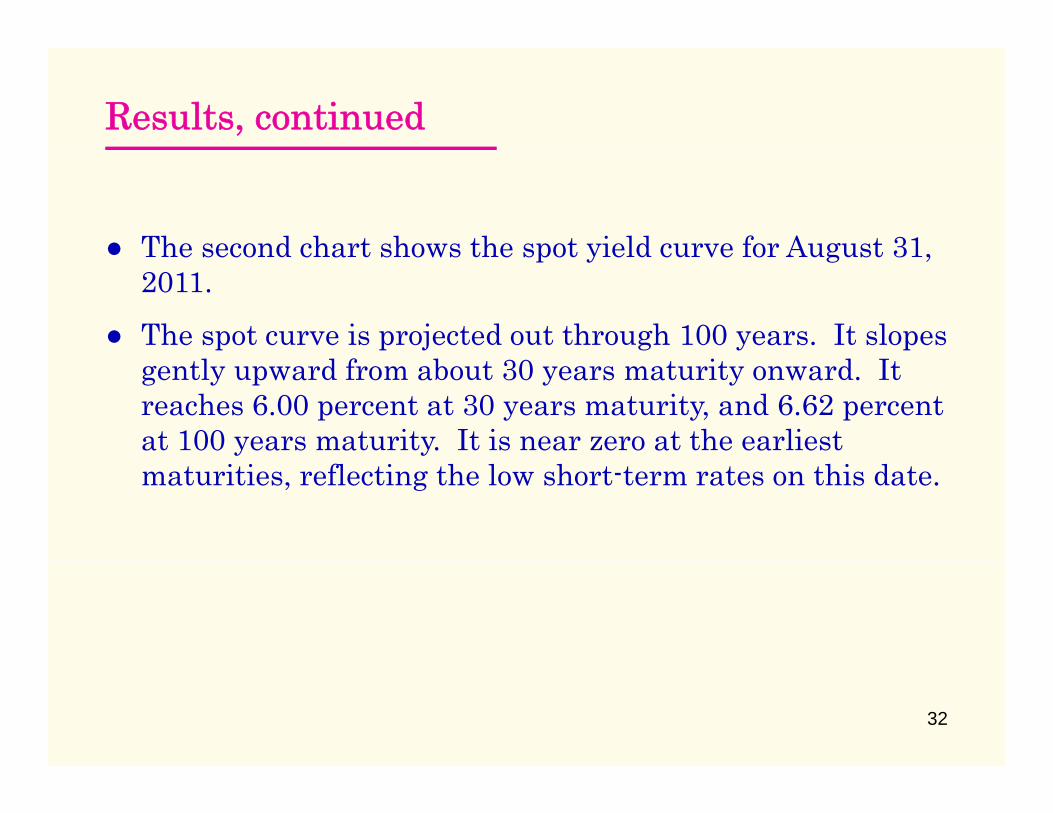
● The second chart shows the spot yield curve for August 31● The second chart shows the spot yield curve for August 31, 2011.
● The spot curve is projected out through 100 years. It slopes gently upward from about 30 years maturity onward. It reaches 6.00 percent at 30 years maturity, and 6.62 percent at 100 years maturity. It is near zero at the earliest maturities, reflecting the low short-term rates on this date.
32

9 9
HQM SPOT YIELD CURVE8/31/2011, Percent
678
678
456
456
123
123
Maturity Years
0 10 20 30 40 50 60 70 80 90 10001
01Maturity, Years
33

Sample AA Yield Curve
● The last chart adds a sample spot yield curve for August 31 2011 t AA lit t th HQM t Pl t31, 2011 at AA quality to the HQM spot curve. Please note that this yield curve is a prototype, and it is not an official Treasury yield curve.
● The sample AA curve was constructed using the HQM methodology modified for AA quality instead of the market-weighted average high quality of the HQM curveweighted average high quality of the HQM curve.
● The AA curve illustrates the fact that the HQM methodology is a general-purpose yield curve methodology that can be applied to different kinds of yield curves.
34

9 9
SPOT YIELD CURVES8/31/2011, Percent
678
678
456
456
HQMAA
123
123
0 10 20 30 40 50 60 70 80 90 10001
01Maturity, Years
35

For More Information
● The High Quality Market (HQM) Corporate Bond Yield Curve for the Pension Protection Act (PPA) is published by the IRS each month and is available on the IRS website.
● For more details on the mathematics behind the curve and for more documentation in general visit the Office of Economicmore documentation in general, visit the Office of Economic Policy website. Go to www.treasury.gov, under “Resource Center” choose “Economic Policy,” then choose “Corporate Bond Yield Curve Papers.”p
● The HQM methodology has been applied to Treasury inflation-indexed securities (TIPS). See papers 0601 and 0501 in the Economic Policy Research Paper Series on the Office of EconomicEconomic Policy Research Paper Series on the Office of Economic Policy website.
36