introduction - home » our land and · web viewthe a1b scenario is a child of the a1...
TRANSCRIPT
Driving Better Programme Investment and Accelerating Challenge Impact Through a Prioritisation Matrix of International and National Perspectives
Short title: The Drivers
Research team: Caroline Saunders, Timothy Driver, Alistair Mowat, Bill Kaye-Blake, Tim Payn, Karen Bayne, John Saunders, Jay Whitehead, Sini Miller, Alice Tang, Meike Guenther and Peter Tait
This report presents the first stage of an overview of international and national drivers which have the potential to affect land use change and/or practice. The report is structured as follows; Chapter 1 will give an introduction and is followed by the methodology for quantifying the importance of these drivers in Chapter 2. Collation and valuation of drivers are described in Chapter 3, followed by scenario analysis to explore different futures in Chapter 4. The report finishes with suggestions for future research in Chapter 5.
A key output of this report is the Drivers Document which contains the international and national drivers, a paragraph describing each driver and references supporting these and the ratings of these; the link to the Drivers Document is here.
1. Introduction
RationaleOptimising our land and freshwater resources on the basis of economic, environmental, social and cultural sustainability is a key outcome of the National Science Challenge for “Our Land and Water”. Therefore identifying areas of highest potential impact, as related to the hierarchy of international and national issues, is needed to provide an evidence base to guide investment and inform the Challenge Research Strategy. To this end it was proposed that a small project be conducted, and regularly refreshed, within the Nexus. The project aims to deliver an overview of international and domestic drivers, as well as issues of relevance to the NZ Primary sector and land use. This overview will be based on a priorities ‘matrix’ that combines as well as rates these international and domestic drivers on changes in land and water use. By using this approach, a summary representation of the level of interest or concern of international ‘consumers’ and customers is produced alongside an overview of domestic issues and stakeholder interests relevant to the primary sector. Where possible, the drivers will be based upon quantifiable evidence. In addition, a representative sample of panellists holding senior roles in Primary Industry stakeholder organisations will prioritise these drivers based on their respective domain knowledge.
While novel, this approach reflects the fact that New Zealand is unique as a developed country. It has a large primary sector that exports a high percentage of its production due to
1

the small domestic market. The prioritised drivers will highlight the issues associated with changes in land and water use while the analysis of these priorities within the matrix will highlight tensions that require further attention and possibly research.
Hypothesis An understanding of international and national drivers, related to changes in land and water use within the primary sector, will improve the effectiveness of Challenge programmes delivering on the Challenge Mission of “improving production and productivity while maintaining and improving the quality of our land and water resources for future generations”.
Objectives Provide market intelligence and foresight information to feed into the overall Challenge
Strategy; Link to the Challenge Research Landscape Map and gap analysis; Give an estimate of the importance of domestic and international drivers to
stakeholders and stakeholder groups at the relevant scale; and Provide evidence for future programmes to focus upon.
IntegrationThe project integrates with the rest of the science challenge. In addition to stakeholders and collaborators, the Directorate, Challenge Theme and programme leaders will be directly involved in the workshops. The Matrix project will work most closely with, and build strongly on the aligned Sustainability Dashboard programme, working with its team (some of the members are also part of this project) to ensure the best methods are utilised in this research. Results will feed through to future research programmes.
2

2. Research Methodology
The project is not a methodology in itself but a method of collating relevant material so it can be readily compared and prioritised. The project draws on other methodologies as appropriate especially meta-analysis and modelling techniques to provide evidence Previous research has highlighted importance of international drivers on land change, including the unintended consequences that can occur from domestic sustainable land-use policies that don’t account for these distant drivers (Meyfroidt et al., 2013). The current project is novel in it the first time we are aware that it assesses the potential impact on land use practice and /or change from national and international drivers in a New Zealand context and also considers their interactions and combined impacts. This builds on work done via the sustainability dashboard (Whitehead, 2016). The drivers have been identified using various methods including a mixture of desk based literature and information surveys, a facilitated workshops and a survey of key informant interviews. Therefore, where possible the drivers will be based upon quantifiable evidence, but panelist opinion from the workshops and surveys will also be used to assess drivers which have yet to be subject to research or developed into strategy. The drivers have been developed for three international regions (Asia, US and Europe) to allow key differences across these regions to be identified and then compared to those in New Zealand.
2.1 Literature review
A wide range of literature was explored to develop the relevant material and inform the choice of drivers. This literature is available from the link to the Drivers Document. The initial selection of drivers was undertaken using key international sources and classed into a revised form of the Political, Economic, Social, Technological, Legal and Environmental (PESTLE) analysis format that can integrate with scenario planning (Walsh, 2005). These included the FAO’s Sustainability Assessment of Food and Agriculture (SAFA) guidelines and Global Trends and Future Challenges documents, the ITC Standards Map Database, as well as a number of future trends documents and additional consultation with the research team.
To determine the domestic drivers, the review included the key strategic documents of government agencies, such as the Business Growth Agenda and the New Zealand Biosecurity Strategy. Strategic documents of regional and local agencies were also reviewed, such as the Canterbury Water Management Strategy. Where publicly available, key information from sector groups and farmer associations were also reviewed. The strategic documents and annual reports of the main industries were then included. Finally the relevant academic literae was assessed. Important regulation was reviewed such as the New Zealand Emissions Trading Scheme, as well as legislative documents such as the Resource Management Act (1991) and Animal Products Act (1999). Some voluntary standards such as AsureQuality Organic standards and Sustainable Winegrowing New Zealand standards were also included.
3

The international drivers were assessed using a number of sources, including assessing key retailer requirements, legislative requirements, government strategic intentions, market access schemes and their requirements (such as GLOBALG.A.P.® or LEAF), as well as the relevant academic literature. These show that the attributes of food and timber influence purchasing behaviour in market.
These attributes include those which are discernible from a product such as price and quality such as colour. However, consumers purchasing decisions are also affected by non-discernible attributes called credence attributes. Credence attributes are qualities believed by a consumer to be present in a product even though they cannot be identified, experienced and inspected by consumers whether before or after purchase (e.g., food safety, animal welfare, environmental protection and cultural authenticity). The values and consumers’ attitudes and preferences towards credence attributes in food have been investigated in several studies worldwide (Eurobarometer 2009; Guenther et al., 2012; Saunders et al. 2013; Synovate 2007).
To quantify the importance of these drivers in international markets a review of the literature showed that there are a number of methods which have identified this. These include choice experiments (see Birol et al. 2006; Carlsson et al. 2005; de Bekker-Grob et al. 2012; Lagerkvist and Hess 2011; Mahieu et al. 2014; Miller et al. 2014). This part of the research has undertaken a literature review of drivers in international markets and this is added in Appendix A.
Other literature was reviewed which has assessed the importance of drivers and the changes in these such as trade modelling research (see Guenther et al. 2014, 2015c), or consumer attitudes and behaviour research (see Barrios and Costell 2004; Hemmerling et al 2015; Wilcock et al. 2004).
From the literature review, a preliminary list of 30 drivers was developed, with relevant literature pertaining to each driver archived. The key references for each driver as well as a summary of each is available within the Drivers Document (see Appendix C).
3. Collation and valuation of Drivers
The overall aim of this part of the research project is to review international and national drivers, to cross reference those national and international drivers, and work to identify and prioritise specific areas seen as important to the Challenge. As stated above, methods used (Anderson and Strutt 2012; Hanley et al. 2001; Hensher et al. 2015; Louviere et al. 2000; Rosegrant et al. 2001) will draw strongly on the approaches used by the Sustainability Dashboard programme (choice modelling, prioritisation) and Lincoln’s AERU Maximising Export Returns (Guenther et al. 2015a,b,c; Guenther and Saunders 2015; Tait et al. 2015) programme (foresighting, market intelligence gathering, consumer insights).
The literature review and research team identified the domestic and international drivers. Drivers were also identified from the strategic documents of relevant organisations including sectors, NGO’s, international agencies, local and national government, and assurance
4
schemes. A hyperlink to the literature and relevant evidence is attached alongside each driver in the Drivers Document (see Appendix C).
In order to assess the relative importance of the drivers across international regions, a workshop was held using a group of panellist drawn from senior roles within primary industry stakeholder organisations. . The workshop took place in Wellington on August 8th 2016, with approximately 16 panellists in attendance. Firstly, the attendees used their domain knowledge to review the drivers to ensure no key drivers were excluded and to adjust the ones which were presented which resulted in some being combined or excluded. The attendees were then split into four groups representing the regions of Europe, Asia, North America and New Zealand respectively. The groups were presented with the 30 identified drivers, shown under economic, environmental, governance and social driver categorised. The groups were then asked to rate the importance of each driver in their assigned region, giving this a High, Medium or Low rating. In the course of the workshop, groups gave intermediate values for some drivers, such as Low-Medium or Medium-High for some drivers. These responses were then summarised by all attendees in the workshop. The results were then given a Likert scale value, with values assigned to each response (e.g. Low = 1, Low-Medium =2, Medium =3, Medium-High = 4, High = 5).
Further to this, a survey was developed to assess the relative importance of the international drivers amongst a wider group of panellists from within New Zealand’s primary sector. This was administered via SurveyMonkey to 56 panellists across New Zealand’s primary sector in August 2016. The survey followed a similar structure to the workshop in that participants were asked to rate the importance of the above drivers (as well as 10 additional drivers) from an international perspective in relation to New Zealand land use change/practice by indicating a Low, Medium or High response. However, the survey did not ask participants to rate the importance of these drivers in specific regions (e.g. Europe, Asia and North America) but instead in total. From the 18 useful responses, scores were weighted (e.g. Low = 1, Medium =3, High = 5) and weighted averages derived for each of the drivers. Further information on the survey methodology is detailed in Appendix D.
The results of the workshop and survey were then collated, with weights for each of the drivers analysed. The combined weighted average for each driver was then derived from the average of workshop and survey response, and the issues ranked according to the weighted average score. Gaps between the workshop and surveys were identified, in general there was consistency in ratings between the workshop and survey participants.
3.1 ResultsThe drivers are classed into economic, social, environmental and governance. The results are summarised in Figure 3.1 which shows for each of the regions including New Zealand the rating of these drivers, high, medium and low.
5
Figure 3.1: Survey results on rating of the drivers
In the case of domestic drivers the environmental drivers were considered to be the most likely to affect land use change /practice in New Zealand followed by the governance ones with social ones being considered the least likely. The most important domestic drivers were biosecurity, soil quality, water footprint/use and water quality. Other important drivers were trade policy and agricultural policy.
Governance as an international driver was considered highly likely to influence land use/practices in New Zealand. Trade policy were considered to be the most important drivers from Europe and North America, possibly reflecting the restricted trade environment in those regions. Agricultural policy in North America was considered high as a driver with the potential to affect land use change/practice in New Zealand compared to medium from the other two regions. This is a bit surprising given the changes in agricultural policy in the EU and also the development of subsides for supporting production in Asia.
The importance of the international environmental drivers to affect land use practice/change in New Zealand varied between the regions. Biosecurity and biodiversity drivers from Europe were considered by participants to be highly likely to affect New Zealand land use practice/change whereas for Asia and North America this was considered to be of low or medium likelihood. The results from the survey did rate the importance of biosecurity as an international driver higher than the workshop attendees. Chemical residues and sustainable supply were considered of highly important as drivers from North America and Europe but only of low importance from Asia. Pasture based production methods were considered an important driver from Europe and medium to high importance from Asia. Extreme weather events in North America were considered to have a high potential to affect land use practice/change in New Zealand but low drivers from the other regions which is interesting as both those regions do also suffer from weather events. Waste/recycling was considered of low importance as an international driver to affect land use practice/change in New Zealand as was soil quality, local food/food miles and air quality.
6
Again this is surprising as some of the literature shows some of these are drivers of international consumer choices. Water quality as an international driver was rated relatively low by attendees at workshop however this was rated high by those who responded to the survey.
From the workshop of the economic drivers only brand in North America and Europe was thought to have a high potential to impact on land use/practice in New Zealand and product quality from Europe. Food safety was thought to have a low impact on land use/practice in New Zealand both as a domestic driver but also international driver from Asia and low to medium in the other regions. Interestingly this was thought an important international driver from the survey compared to the results from the workshop.
The social drivers were generally considered to have less of a potential to affect land use/practice in New Zealand. The most important international social drivers were demographics thought to be of medium importance followed by health and safety. The domestic drivers of medium importance were Maori values and family and community with all the rest considered of low importance.
Therefore the key drivers affecting land use practice in New Zealand were agricultural policy and trade policy from both domestic and international perspectives. Water quality and use were also considered important from both the domestic and international point of view followed by pasture-based production and environmental condition, biosecurity and greenhouse gas emissions.
However, it must be stressed that this is the first stage in ranking or rating of drivers. A wider consultation of stakeholders and experts, both domestic and international, would be needed to valid these results. Moreover, given time frame of the project these result have not been fully cross checked with the literature review and other sources of data to further assess their validity.
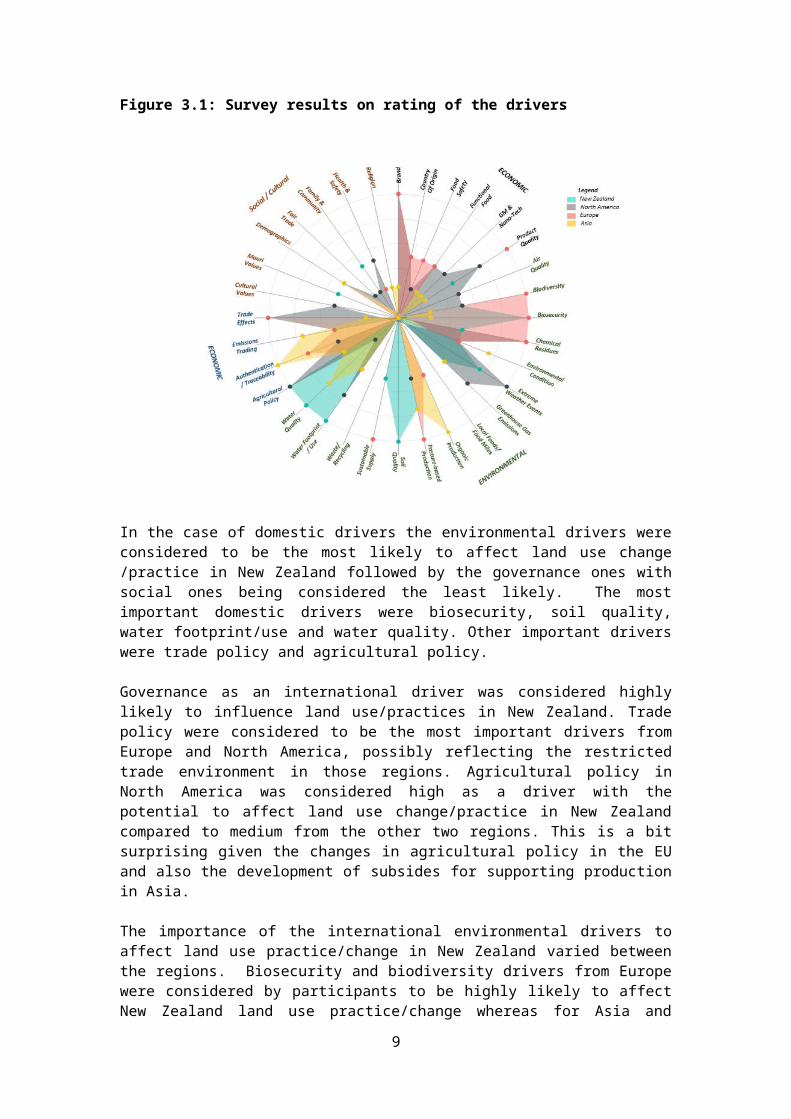
Framed as a two-way matrix, the responses could be summarised in a product value oriented axis, spanning commodity to value-add, projected against a compliance cost oriented axis that combines domestic and international costs that spans from high to low impact (Figure 3.2). The proportion of New Zealand’s primary sector exports within each quadrant of this matrix could have a significant impact on the resources available to adapt to domestic and international drivers, with subsequent implications for land use change. Such a framework may form the basis of further research to validate, quantify and use in scenario analysis.
7
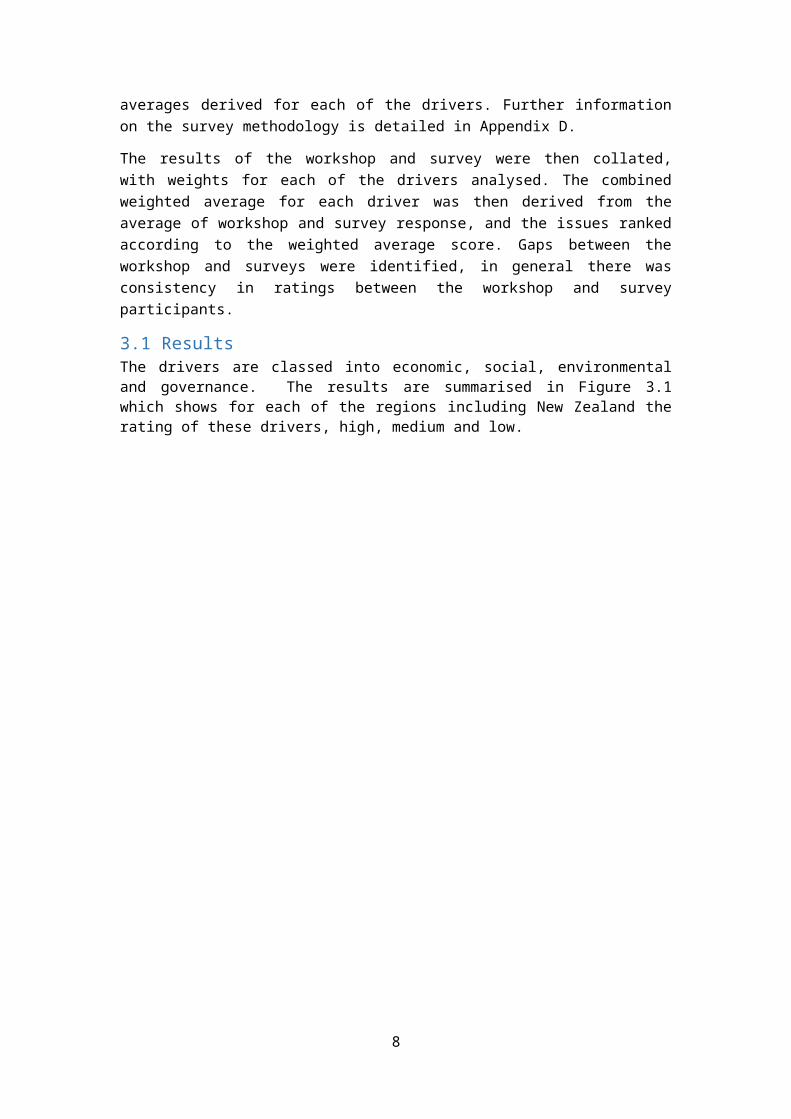
Figure 3.2 Conceptual framework for integrating issues and opportunities raised by panellists for primary industry export trade
8
4. Scenario modellingThe research also used a model to analyse current and potential changes in international markets with the potential to affect land use change/practice in New Zealand. This scenario analysis is to assess the on risks and opportunities from changes in our international markets including the impact of climate change that that need to be taken into account in future land use change, product mix and market choice. A scenario tool was used to identify international opportunities and risks, grounded with industry partners. The adopted tool is the Lincoln Trade and Environment Model (LTEM), developed over the last decade by the AERU using the international VORSIM model (see www.vorsim.com, Saunders and Cagatay 2004, Wreford et al. 2009, Saunders et al. 2013).
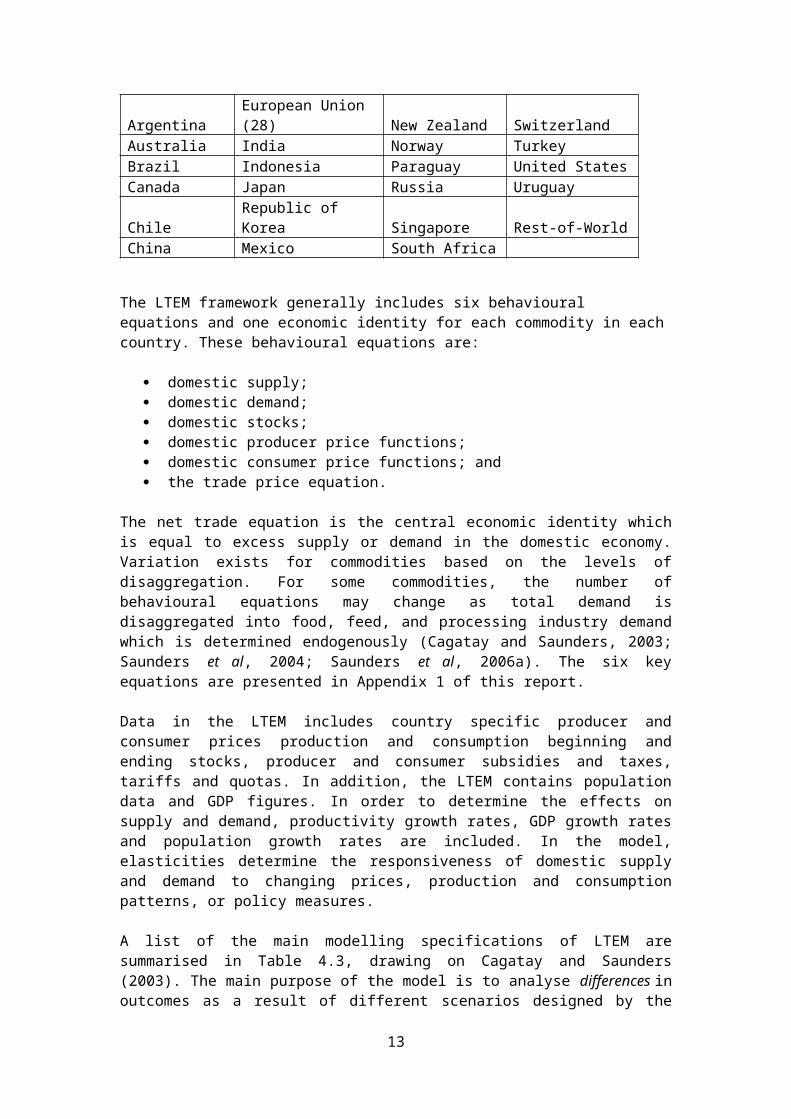
The LTEM is a multi-country, multi-commodity, partial equilibrium framework that focuses on the agricultural sector (Cagatay and Saunders, 2003). It has a specific focus on New Zealand and its main trading partners, key trading commodities and domestic agricultural policies. The model disaggregates agricultural commodities, especially for dairy and oilseeds, and offers flexibility and transparency for adding variables, equations, policies and data. It currently covers the 23 commodities and the 23 countries listed in Tables 4.1 and 4.2 respectively.
Table 4.1: LTEM Commodity coverage
Wheat Oilseed meals Poultry Liquid milkMaize Vegetable oils Eggs ApplesOther grains Beef and veal Butter KiwifruitRice Pork Cheese GrapesSugar Sheep meat Whole milk powder WineOilseeds Wool Skim milk powder
Table 4.2: Countries in the LTEM
Argentina European Union (28) New Zealand SwitzerlandAustralia India Norway TurkeyBrazil Indonesia Paraguay United StatesCanada Japan Russia UruguayChile Republic of Korea Singapore Rest-of-WorldChina Mexico South Africa
The LTEM framework generally includes six behavioural equations and one economic identity for each commodity in each country. These behavioural equations are:
domestic supply; domestic demand; domestic stocks; domestic producer price functions; domestic consumer price functions; and
9

the trade price equation.
The net trade equation is the central economic identity which is equal to excess supply or demand in the domestic economy. Variation exists for commodities based on the levels of disaggregation. For some commodities, the number of behavioural equations may change as total demand is disaggregated into food, feed, and processing industry demand which is determined endogenously (Cagatay and Saunders, 2003; Saunders et al, 2004; Saunders et al, 2006a). The six key equations are presented in Appendix 1 of this report.
Data in the LTEM includes country specific producer and consumer prices production and consumption beginning and ending stocks, producer and consumer subsidies and taxes, tariffs and quotas. In addition, the LTEM contains population data and GDP figures. In order to determine the effects on supply and demand, productivity growth rates, GDP growth rates and population growth rates are included. In the model, elasticities determine the responsiveness of domestic supply and demand to changing prices, production and consumption patterns, or policy measures.
A list of the main modelling specifications of LTEM are summarised in Table 4.3, drawing on Cagatay and Saunders (2003). The main purpose of the model is to analyse differences in outcomes as a result of different scenarios designed by the analyst. The analyst, for example, might construct a scenario in which the amount of irrigated land in New Zealand increases; LTEM then allows the analyst to determine what impact this would have on producer returns or net trade values in 2024 compared to producer returns or net trade values in the base case with no increase in irrigated land. These impacts are reported as percentage changes on the base case levels.
10
Table 4.3: Modelling Specifications LTEM
Model LTEM: Lincoln Trade and Environment ModelModelling Approach Partial equilibriumTemporal Properties Comparative static (+ short term dynamics through
sequential simulation)Solution Type Non-spatial, net global tradeSolution Algorithm Newton's global algorithmParameters SyntheticCommodity Coverage 23Country Coverage 22 plus one for Rest of the WorldBehavioural Equations (per commodity and country) Domestic supply
- feed- food- processing
Domestic demand
Stock variation
Producer price
Consumer price
TradeEconomic Identify Net trade
Source: Cagatay and Saunders, 2003.
The scenarios were chosen in consultation with the research team and from the results of research on drivers; the scenarios are summarised in Table 4.4. These are preliminary scenarios that indicate the direction and scope of this part of the analysis that were possible in the time frame and lead to a paper on scenario modelling.
11
Table 4.4: Scenarios
B Base Business as Usual B1
Base (climate change) B1 SRES scenario
1 Impact of climate change on international agricultural production on trade and New Zealand agriculture.
A1B SRES scenario
2 Impact of extreme weather events internationally on New Zealand agriculture
Increased drought events: Australia and the United States
3 Impact of changing consumer preferences in key markets on New Zealand agriculture
20 per cent increased value in developed and developing countries
50 per cent increased value in developed and developing countries
4 Greater Trade Liberalisation in agricultural commodities
25 per cent decrease of global trade barriers50 per cent decrease of global trade barriers75 per cent decrease of global trade barriers100 per cent decrease of global trade barriers
The initial task to assess the impact of different scenarios is to establish a base from which scenarios can be compared, assuming no changes to agricultural trends or policy. This ‘business as usual’ or ‘base’ scenario model a possible pathway for the agriculture sector out until 2024 based on official projections of population growth, gross domestic product (GDP) growth and productivity growth. Agricultural productivity rates are derived from FAO/OECD projections of the state of agriculture (OECD FAO, 2015). GDP and population growth rates are derived from the IMF world economic outlook (IMF, 2015). This base analysis does not aim to quantify the precise state of agriculture in a decade; rather it provides a benchmark against which modelled futures can be compared, thus isolating the specific impact of the modelled policies compared to the base scenario outcomes. In addressing climate change scenarios, the idea of a ‘no change’ scenario becomes somewhat spurious endeavour, as we must assume to be on a particular pathway. Here we have modelled a ‘low’ temperature increase scenario as our benchmark to contrast the impacts of climate change. Therefore the ‘B1 base scenario’ is used when assessing scenario 1.
12
4.1 Climate change scenario
Based on the IPCC’s Special Report on Emissions Scenarios (SRES) (2000), which outlines 6 projected climate outcomes based on different social and economic responses to climate change. Of these 6 scenarios the A1B scenario has been selected as the base climate change scenario upon which to develop the research questions from the SLMACC work stream. The A1B scenario is a child of the A1 scenario family which is characterised as:
Very rapid global economic growth Global populations peaking at 9 billion during this century Extensive global social and cultural interactions Spread and development of new technologies
The children of the A1 family describe different global foci for satisfying the global demand for energy, in A1FI the energy industry is fossil fuel intensive, and in A1T non-fossil fuel intensive. A1B explores a balance between A1FI and A1T, with both fossil and non-fossil based energy sources being used to satisfy global demand.
The A1B scenario was agreed upon in collaboration with the partners of the research and client group, being thought to represent the ‘most likely’ global response. It is also preferable for the modelling exercise as it is a moderate among all the SRES scenarios. Importantly, the A1B scenario is now used by NIWA for their projections of the effects of climate change upon New Zealand, thus by also using the A1B scenario there is an ability to utilize and compare data and projections from NIWA with the results of the modelling exercise.
The A1B scenario is modelled as a shift in the yield and production potential of agricultural land globally. These yield and production changes have been taken from the IMAGE model with which extensive work modelling the SRES has been completed (IMAGE, 2001). The changes in yield over 20 years for both crops and animal products have been taken from the IMAGE model’s projection of the A1B scenario in order to reproduce the scenario with the focus on New Zealand provided by the LTEM.
To demonstrate the results of the A1B scenario on production and trade in New Zealand, the scenario is presented below against a second SRES scenario: B1 (labelled ‘B1 (Base)’). In contrast to the A1 scenario family the B1 family is the lowest emissions pathway characterised by rapidly changing economic structures toward information and service economies, with an emphasis on global solutions to sustainability. By presenting these two scenarios together the impacts of the ‘most likely’ SRES pathway can be compared with the ‘best-case-scenario’ with climate change.
All results are presented in USD. ‘Total agriculture’ refers to the total of all agricultural commodities modelled in the LTEM. Furthermore all modelling is presented from 2012 to 2024, the first to the final year of the model’s projections. One short-coming with this analysis is in using a model with a 12 year horizon, only the short to medium impacts are assessed, where in some SRES scenarios short term increased in crop productivity due to factors such as CO2 fertilisation will eventually be outweighed by negative impacts of higher temperatures.
13
Figure 4.1: New Zealand producer returns for dairy products (billion USD)
As shown in Figure 4.1, under the A1B climate change scenario world production for dairy decreases, alongside world price, overall this leads to reduced producer returns for dairy commodities in New Zealand, although for individual commodities this is less severe for butter, which experiences a slight increase in production in New Zealand.
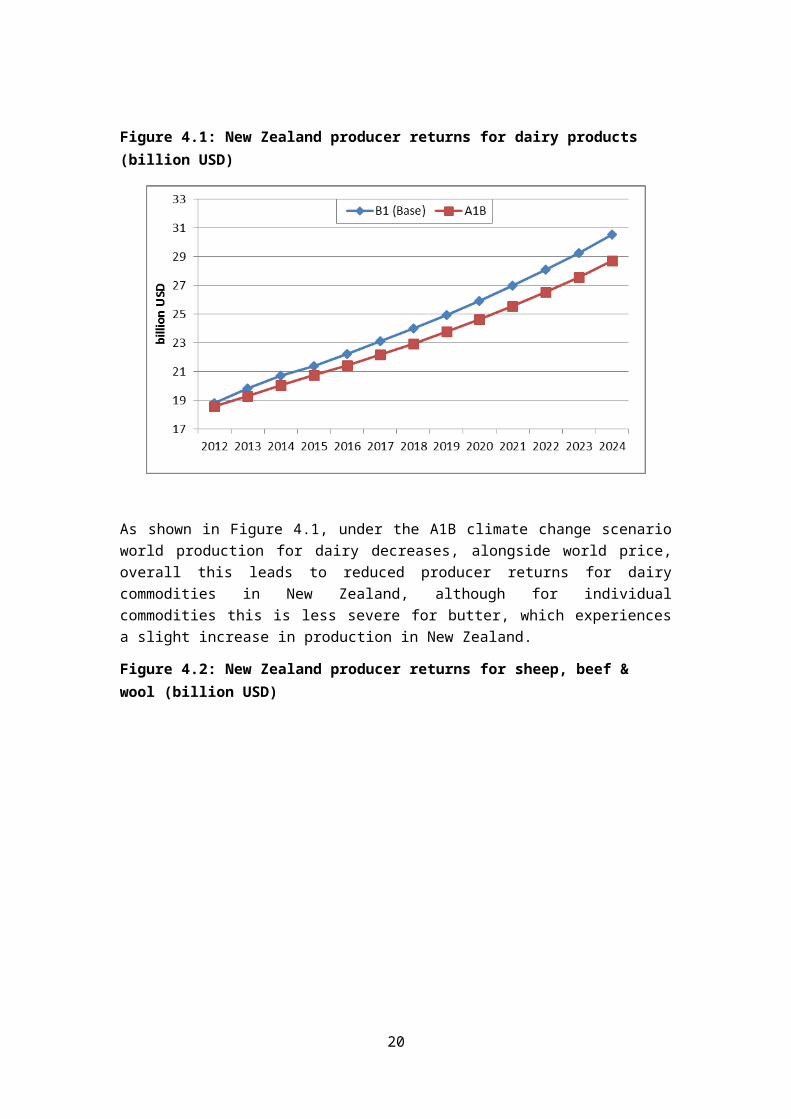
Figure 4.2: New Zealand producer returns for sheep, beef & wool (billion USD)
14

New Zealand producer returns for red meats decline significantly (--22%) in the A1B scenario (see Figure 4.2). Returns for wool also decrease, although less significantly (-11%). These changes are driven by decreases in world price, of over 10 per cent for meat products, which negatively impacts on the value and viability of production in New Zealand.
Figure 4.3: New Zealand producer returns for cereals (million USD)
Unlike the meat sectors, cereal producers in New Zealand increase production under the A1B scenario. Figure 4.3 shows total production of wheat, maize, and other grains increase between 4 and 6 per cent by 2024. This increase is presumed to be due to CO2 fertilisation effect at low levels of atmospheric concentration, under less sever climate change scenarios. The total returns for cereals in New Zealand is somewhat reduced, even with the increases in production due to decreasing world prices for cereal commodities.
15
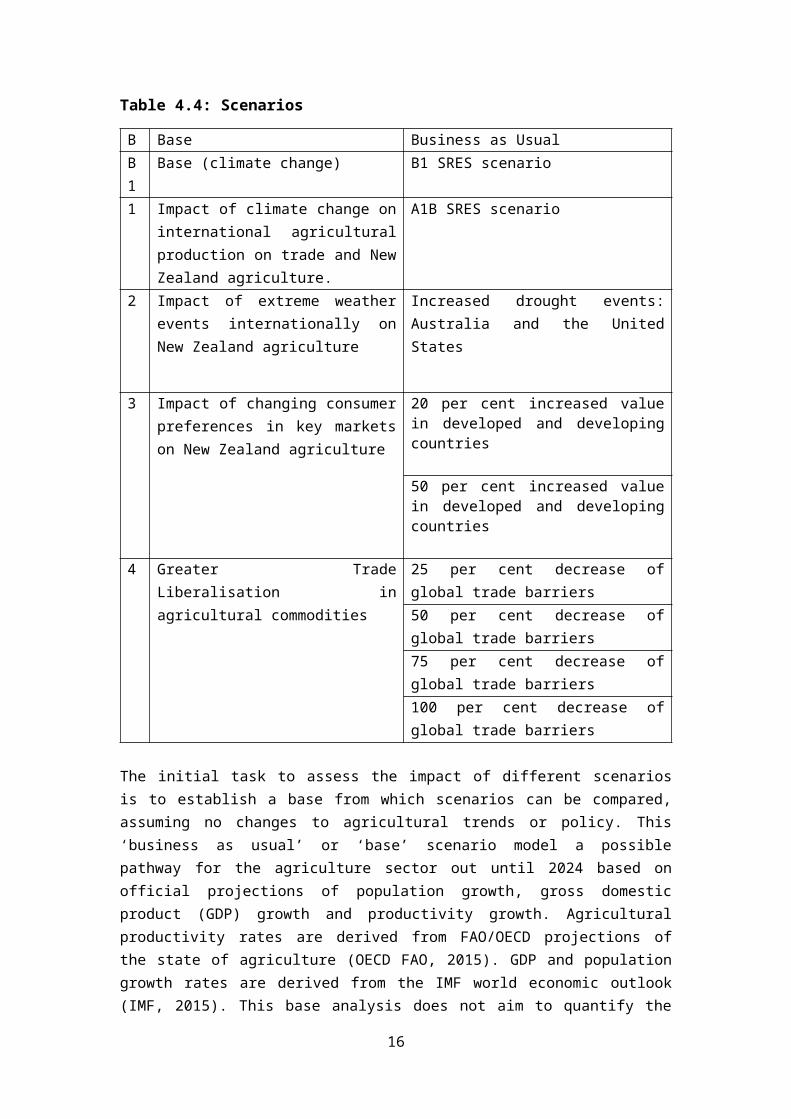
Figure 4.4: New Zealand producer returns total agriculture (billion USD)
Figure 4.4 shows that overall New Zealand producer returns decrease by almost 10 per cent, or over 4 billion USD. This decrease is mainly driven by decreasing world prices associated with increases in world production, where world production is expected to grow faster than world consumption in the IMAGE SRES scenarios. The reduction in producer returns between climate scenarios is most pronounced for sheep meat, which has a reduction of almost one billion USD. This is followed by whole milk powder with a reduction of 730 million USD, and beef with a reduction of 618 million USD. These results are presented in Table 4.5.
Table 4.5: Change in producer returns, 2020 (million USD)
CommodityChange in Producer
Returns mil. USDPercentage
change
Dairy -1,988 -4.9%
Sheep, Beef & Wool
1,686 -21.1%
Cereal -42 -4.9%
Total Ag -4,086 -9.7%
16
4.2 Increased weather events scenario
The frequency of extreme weather events is predicted to increase under higher temperatures associated with climate change. These events add another layer of uncertainty to the state of agriculture into the future.
This increase in extreme weather events has two major implications for New Zealand, the first is directly, in that, NIWA expects New Zealand to experience an increase in drought and flooding events These domestic events will negatively impact on total production in New Zealand and will increase the need for resilience in farming and mitigation technologies. The second implication is that as extreme weather event occur internationally, the resulting decreases in local agriculture will have price impacts for New Zealand as an exporting nation for both producer and consumers.
The scenario presented below simulates a singular drought event in two important markets for New Zealand: Australia and the United States. For the United States, the impacts of a 1993 drought across the Southeast states was simulated in 2018, as of Rosenzweig et al. (2001) this drought event reduced yields in the affected area. With a 90 per cent reduction for maize, and a 50 per cent reduction for wheat and soybeans. For the modelling analysis a 50% reduction was also applied for other grains in the area. While drought also impacts on the production of animal products, no change to fodder or pasture in the United States was included in the analysis. For Australia, with climate change, a ‘once in a decade’ severe drought is expected one every two or four years (Quiggin, 2016). Here the drought event is modelled as a reduction in production for pasture-based ruminants in 2019.
The two drought events are included in the same scenario to give a limited impression of the indirect impacts of extreme weather events internationally. Eventually under the higher climate change scenarios the increase in extreme weather events (not just droughts) is expected to increase worldwide. Thus is reality the impacts and variability associated with these weather events is expected to be larger, however by limiting the scope of these events within the modelling we can examine the type of impacts in New Zealand, specific to each event.
17
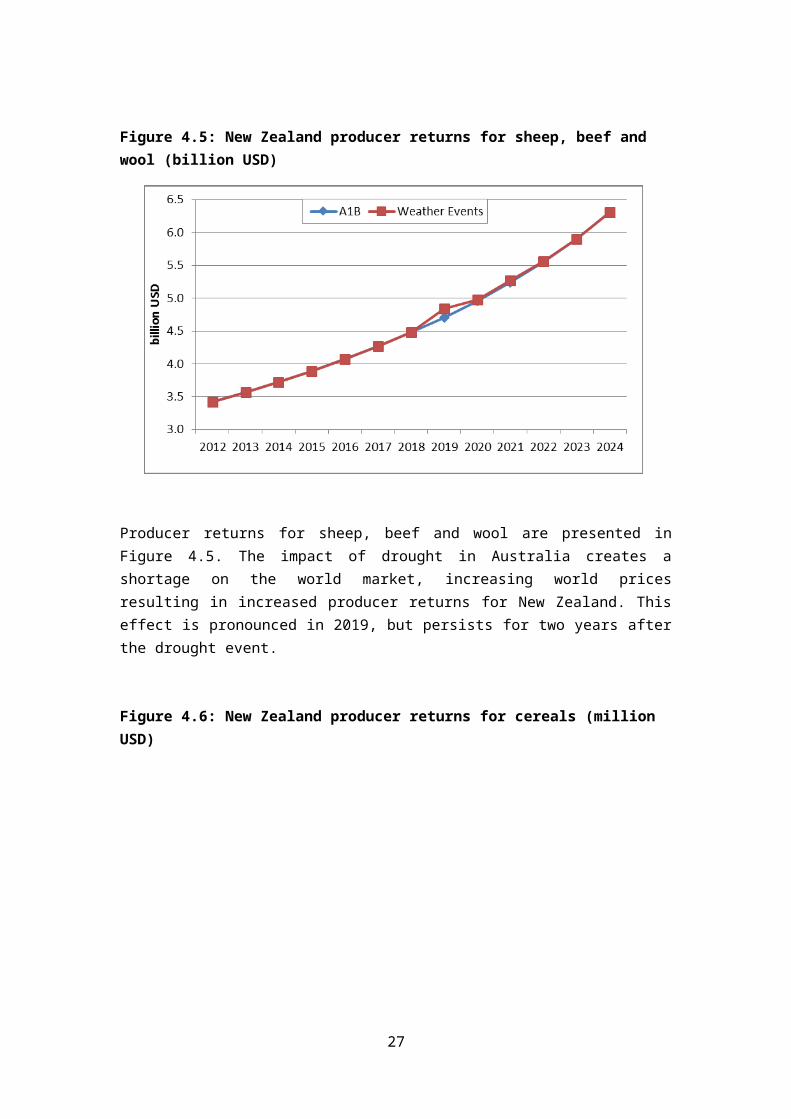
Figure 4.5: New Zealand producer returns for sheep, beef and wool (billion USD)
Producer returns for sheep, beef and wool are presented in Figure 4.5. The impact of drought in Australia creates a shortage on the world market, increasing world prices resulting in increased producer returns for New Zealand. This effect is pronounced in 2019, but persists for two years after the drought event.
Figure 4.6: New Zealand producer returns for cereals (million USD)
18
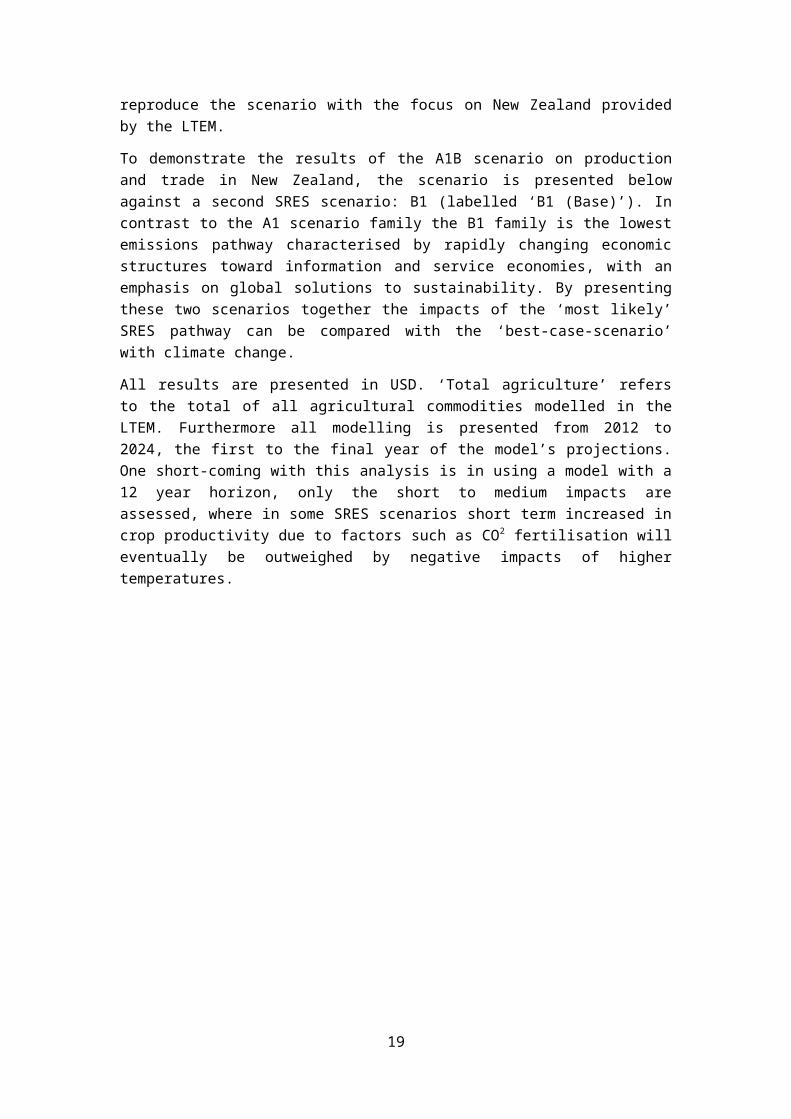
Figure 4.6 shows the impact on New Zealand producer returns for cereals. Here the impact on the world market is less pronounced than with beef, sheep and wool, with a 1.9 per cent increase in producer returns in 2018 and 2.1 per cent in 2019.
Table 4.6 presents the aggregate effect from the first drought event to the final year of the modelling (2012-2024), capturing the total impacts from the events over several years. Drought events in other markets lead to small increases in New Zealand’s agricultural returns due to increasing world prices. While these impacts are relatively small there is a noticeable impact from two world drought events, the cumulative effect of more frequent similar weather events occurring globally could be a significant feature of world markets for agriculture in the future, with increased price volatility due to disruptions of production caused by extreme weather events.
Table 4.6: Change in producer returns, 2011-2024 (million USD)
CommodityChange in Producer
Returns mil USDPercentage
change
Dairy 346 0.11%
Sheep, Beef & Wool
192 0.32%
Cereal 26 0.36%
Total Ag 567 0.15%
4.3 Market segmentation and consumer targeting
Two scenarios were developed in order to estimate the potential impact of varying levels of premiums for food attributes in selected countries as a result of market segmentation and consumer targeting. In scenarios 3.1 and 3.2, it is assumed that New Zealand achieves a premium of 20 per cent and 50 per cent respectively in seven developed countries: Australia, Canada, Europe Union (28), Korea, Japan, and the United States of America, and three developing countries: China, India, and Indonesia.
The value of a 20 per cent premium was based on advice that the most recent New Zealand Primary Sector Bootcamp at Stanford University (28 June to 4 July 2015) had considered that a 20 per cent premium for New Zealand agri-food exports on the basis
19
of the credence attributes of New Zealand production and processing systems is a reasonable aspirational target. The higher value of 50 per cent was chosen to explore the impact if New Zealand achieves outstanding success in this approach. The following pages report the results of each of the scenarios alongside the base.
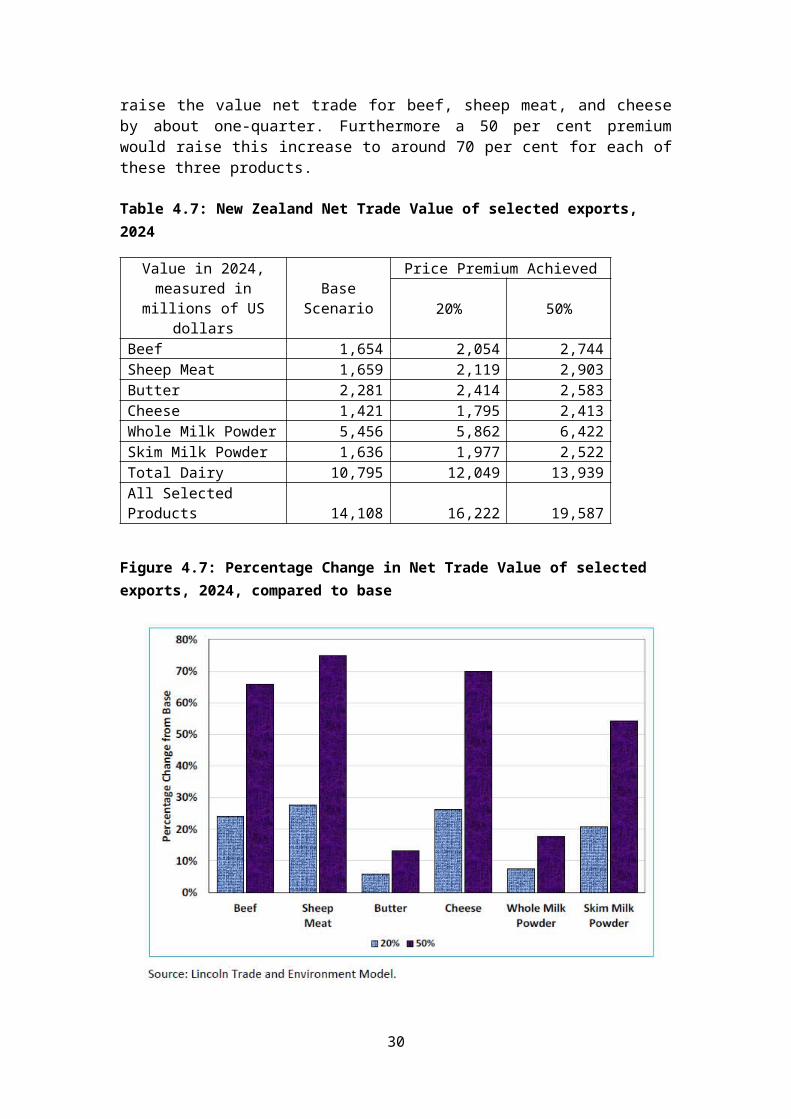
The inclusions of price premiums show a growth in the total net trade value for all commodities, as shown in Table 4.7 and Figure 4.7. The increase for all selected products is about US$2.1 billion in the first scenario and about US$5.5 billion in the second scenario. A 20 per cent premium could raise the value net trade for beef, sheep meat, and cheese by about one-quarter. Furthermore a 50 per cent premium would raise this increase to around 70 per cent for each of these three products.
Table 4.7: New Zealand Net Trade Value of selected exports, 2024
Value in 2024, measured in millions of US dollars Base Scenario
Price Premium Achieved20% 50%
Beef 1,654 2,054 2,744Sheep Meat 1,659 2,119 2,903Butter 2,281 2,414 2,583Cheese 1,421 1,795 2,413Whole Milk Powder 5,456 5,862 6,422Skim Milk Powder 1,636 1,977 2,522Total Dairy 10,795 12,049 13,939All Selected Products 14,108 16,222 19,587
Figure 4.7: Percentage Change in Net Trade Value of selected exports, 2024, compared to base
20

Table 4.8 and Figure 4.8 show the modelled increases in producer returns from meat and dairy in 2024 compared to the base scenario.
Table 4.8: Meat and Dairy Producer Returns in 2024
Value in 2024, measured in millions of US dollars
Base Scenari
o
Price Premium Achieved
20% 50%Beef 2,098 2,564 3,358Sheep Meat 1,987 2,477 3,305Raw Milk 12,642 13,907 15,830
Figure 4.8: Percentage Change in Meat and Dairy Producer Returns, 2024, compared to base
4.4 Greater Trade Liberalisation
One of the factors which has a large negative impact on New Zealand is restricted trade access. Therefore, modelling the impact of greater market access is important. Ideally the modelling could reflect various negotiations under way, including the Trans-Pacific Partnership (TPP) and the EU-NZ free-trade agreement. Given the constraints in this study, the research team analysed the impact of four generic and universal reductions to
21

current trade barriers involving respectively 25%, 50%, 75% and 100% percentage decreases in total tariffs, duties, and market support for all modelled agricultural commodities in all countries of the Lincoln Trade and Environment Model. Thus the results do not aim to reflect the outcomes of any particular trade negotiations, but do show the commodities most affected from trade restrictions. The results from these four scenarios are shown on the following two pages.
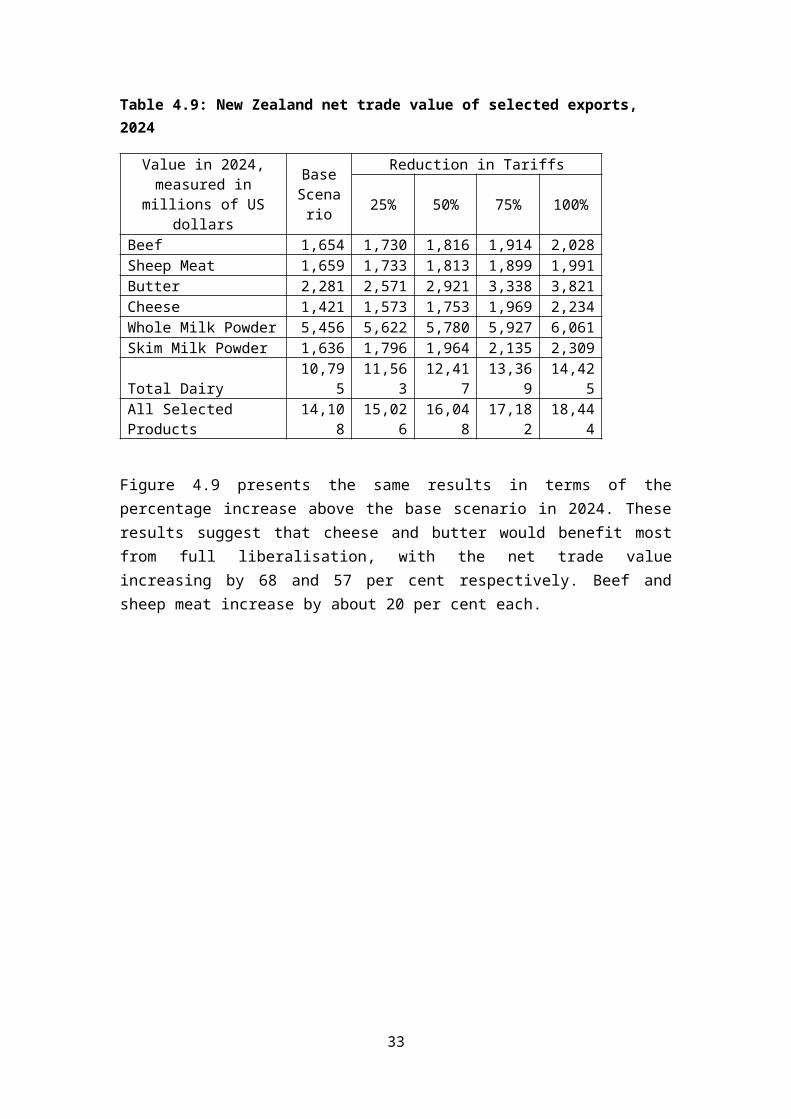
Table 4.9 shows the total value of net trade in New Zealand for the final year (2024) of the modelled scenarios, alongside the ‘base’ scenario. This shows that trade liberalisation has the potential to significantly increase the net trade value for all examined commodities, increasing as trade barriers are further relaxed. Promisingly, total dairy net trade for New Zealand increases US$3.6 billion under 100 per cent reductions in barriers.
Table 4.9: New Zealand net trade value of selected exports, 2024
Value in 2024, measured in millions of US dollars
Base Scenario
Reduction in Tariffs25% 50% 75% 100%
Beef 1,654 1,730 1,816 1,914 2,028Sheep Meat 1,659 1,733 1,813 1,899 1,991Butter 2,281 2,571 2,921 3,338 3,821Cheese 1,421 1,573 1,753 1,969 2,234Whole Milk Powder 5,456 5,622 5,780 5,927 6,061Skim Milk Powder 1,636 1,796 1,964 2,135 2,309Total Dairy 10,795 11,563 12,417 13,369 14,425All Selected Products 14,108 15,026 16,048 17,182 18,444
Figure 4.9 presents the same results in terms of the percentage increase above the base scenario in 2024. These results suggest that cheese and butter would benefit most from full liberalisation, with the net trade value increasing by 68 and 57 per cent respectively. Beef and sheep meat increase by about 20 per cent each.
22

Figure 4.11: Percentage Change in net trade value of selected exports, 2024, compared to base
Furthermore the relaxed trade barriers would increase producer returns in New Zealand, shown in Table 4.10, and Figure 4.10. Reflecting the increases in export value, producer returns are expected to rise given increasing levels of trade liberalisation. The returns for dairy increase 30 per cent given full trade liberalisation, while beef returns increase 20 per cent and sheep meat by 18 per cent.
Table 4.10: Meat and dairy producer returns, 2024
Value in 2024, measured in millions of US dollars
Base Scenario
Reduction in Tariffs25% 50% 75% 100%
Beef 2,098 2,185 2,282 2,392 2,521Sheep Meat 1,987 2,066 2,150 2,241 2,339Raw Milk 12,642 13,429 14,313 15,304 16,408
23
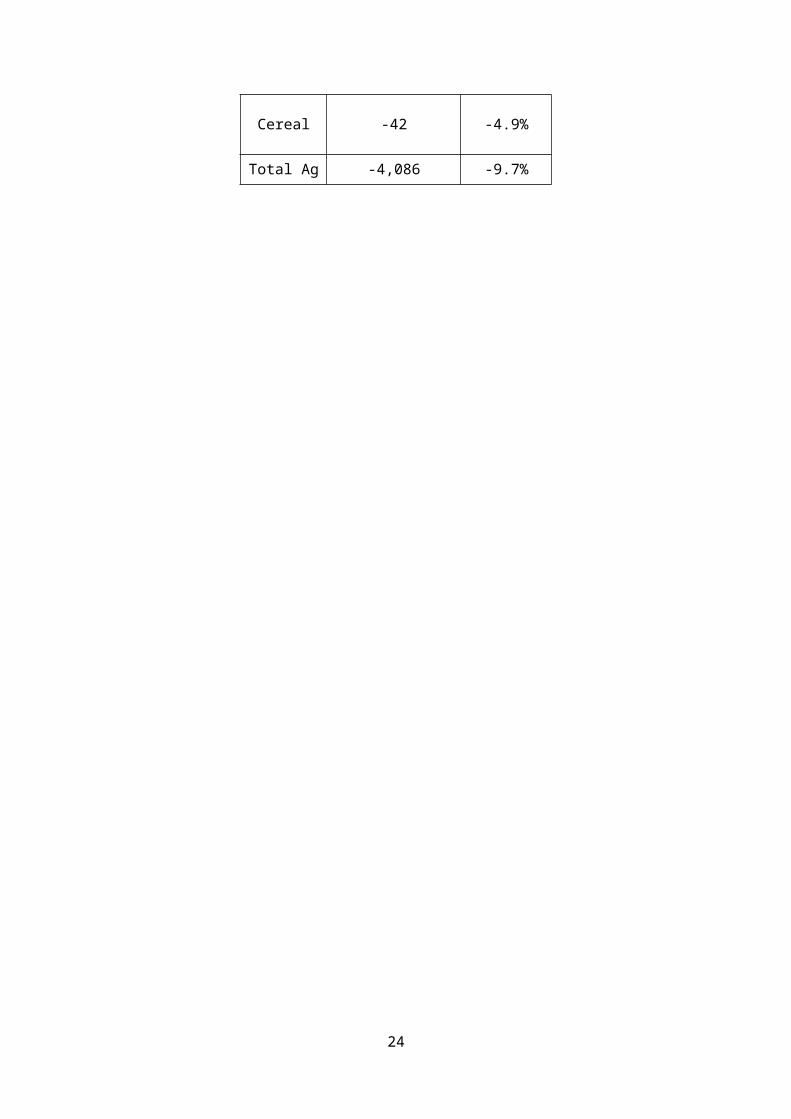
Figure 4.10: Percentage change in meat and dairy producer returns, 2024, compared to base
24

5. Future research
The Challenge research programmes will be mapped across the matrix to investigate the match of research activities (in consultation with the Research Landscape Map) with priority drivers/issues. The process will feed into future Challenge Investments.
5.1 Possible directions for future research
As previously discussed, this stage of the project identified international and national drivers which have the potential to affect land use change/practice in New Zealand. The importance of these was assessed in order to identify and prioritise specific areas seen as important to the Challenge. This work is considered to provide a broad overview of current trends in drivers and to serve as an initial investigation of the relative impact of these drivers. The research also includes scenario analysis which the importance of the drivers can be assessed under different futures.
Therefore, further evaluation of the drivers, the trends, their importance and how these are affected by different future scenarios is important. This includes maintenance and improvement of the current evidence base, including new, up-to-date sources in relation to the existing drivers and a review of these drivers. The rating of these drivers in this report was preliminary and further workshops and/or surveys of a wider range of stakeholders and experts is important. Further trade modelling analysis could also aid the quantification of the drivers by assessing their relative importance, for example, trade access impacts compared to consumer preference drivers and/or environmental drivers.
Having identified a range of international and domestic drivers that could potentially impact on New Zealand land use change/practice, future research could be directed at developing a more in-depth understanding and assessment of these.
As these drivers are more likely to impact earlier or more acutely on some sectors and regions than others we would use case studies. These could include specific food products, and different production systems that present different challenges and opportunities. For example, aspects of dairy production affect land use differently than those of horticulture, including water use, animal welfare, environmental impacts and these are as well as affected by changes in demographics and policies.
The researchers have reviewed the international literature on consumer preferences to identify the key drivers. However, given that the initial stage of this project included a broad literature review, further detail could be provided regarding international and domestic consumer preferences. In particular, more in-depth information regarding consumer concerns associated with the identified drivers could be provided, including the relative degree to which consumers are concerned about different drivers and what triggers these concerns as well as the quantification of these concerns and how they have the potential to impact on New Zealand land use change/practice.
Similarly, further exploration of specific country markets in relation to the identified drivers could be undertaken. For selected countries, this could include a more detailed review of
25

consumer attitudes, preferences and expectations as well as the legislative and market access frameworks surrounding these. The current stage of the project broadly examined this within the regions Europe, North America and Asia, but the next stage could expand this to include specific countries which are key markets for New Zealand, such as China. Furthermore, new regions with potential to gain importance to New Zealand could be analysed, such as South America and/or the Middle East.
Another direction for future research could include consumers’ access to product information. This could examine current methods being used in international and domestic markets to access product information, including their frequency of use, trust in the accuracy and/or authenticity of these sources, and their relative use in relation to different product types. In particular, this could include consumers’ use of digital media and smart technologies such as social media and smartphones in relation to information sourcing.
The basis of this project was to examine international and domestic drivers that could potentially impact on New Zealand land use/practice, a subject of future research could include detailed examination of the impacts of these drivers on New Zealand land use. Specifically, this could include to estimate the relative degree to which each driver is likely to impact on land use change, as well as a more precise analysis of possible impacts. This could be carried out through the use of risk assessment to determine the likelihood of an impact on land use and any potential consequences. This assessment could include the drivers which have high risks associated with them for market access both regulatory but also practices which may mean exclusion from a market. In addition, it could be useful to examine opportunities for and barriers to land use change in New Zealand in relation to particular drivers (i.e. what is allowing producers to or preventing producers from adapting land use in relation to specific drivers?).
Key international drivers identified in the results were agricultural and trade policy. Future research could therefore expand the preliminary scenarios analysis to assess the trade and agricultural policy changes in New Zealand’s main markets and competitors. This could include assessing the impacts of changes in agricultural and trade policies in countries of key interest to New Zealand. For example, assessing the effects of the removal of the European Union dairy quota in 2015; the increase in whole milk powder production capacity in the Netherlands, Ireland and USA; trade policy changes including the Trans-Pacific Partnership, a Free Trade Agreement between India and New Zealand as well as between the European Union and New Zealand, and/or Britain’s exit from the European Union (Brexit). Furthermore, effects of food consumption and demographic changes in New Zealand’s export markets could be assessed, these may include increased meat and dairy consumption in Asian countries (China, India, Indonesia) or African, Sub-Saharan or Middle-Eastern countries; demographic changes such as population growth and urbanisation in Asian countries and/or the growth of the middle class in Asian countries; and changes in agricultural policy in China.
Finally, the review of domestic drivers was concentrated on documented sources and strategies of key stakeholders and agencies. In future research the review could include other perspectives which affect the social licence to operate especially from the urban population. Thus surveys or workshops could be conducted to reflect the values and drivers of the broader population which assess the importance of the drivers from their perspective.
26
The research has developed a series of drivers and the overall aim is to quantify these and their relative importance to influence land use change/practice in New Zealand. This is a similar to a materiality assessment of drivers further research would aim to build on this exercise and determine further their materiality.
27

References
Anderson, K. and Strutt, A. (2012). The changing geography of world trade: Projections to 2030. Journal of Asian Economics, 23(4), 303-323. doi:10.1016/j.asieco.2012.02.001
Barrios, E.X. and Costell, E. (2004). Review: Use of Methods of Research into Consumers’ Opinions and Attitudes in Food Research. Food Science and Technology International December, 10(6), 359-371.
Birol, E., Karousaki, K. and Koundouri, P. (2006). Using economic valuation techniques to inform water resources management: A survey and critical appraisal of available techniques and an application. Science of the Total Environment, 365(1-3), 105–122.
Cagatay, S. and Saunders, C. (2003). Lincoln Trade and Environment Model: An Agricultural Multi-country Multi-commodity Partial Equilibrium Framework. AERU Research Report No. 254, Agribusiness and Economics Research Unit, Lincoln University.
Capone, R., El Bilali, H., Debs, P., Cardone, G., and Driouech, N. (2014). Food system sustainability and food security: connecting the dots. Journal of Food Security, 2(1), 13-22.
Carlsson, F., Frykblom, P. and Lagerkvist, C.L. (2005). Consumer preferences for food product quality attributes from Swedish agriculture. AMBIO: A Journal of the Human Environment, 34(4), 366-370.
Convertino, M., Baker, K. M., Vogel, J. T., Lu, C., Suedel, B., and Linkov, I. (2013). Multi-criteria decision analysis to select metrics for design and monitoring of sustainable ecosystem restorations. Ecological indicators, 26, 76-86.
de Bekker-Grob, E.W., Ryan, M. and Gerard, K. (2012). Discrete choice experiments in health economics: A review of the literature. Health Economics, 21(2), 145-172.
Eurobarometer (2009). Europeans’ attitudes towards the issue of sustainable consumption and production. Analytical report. Conducted by The Gallup. Organisation, Hungary at the request of the Directorate-General for the Environment. Flash EB Series #256. European Commission: Brussels, Belgium.
Guenther, M., Saunders, CM. Tait, PR. (2012). Carbon labeling and consumer attitudes. Carbon Management Journal. Vol 3(5), pp. 445-455.
Guenther, M., Saunders, C., Dalziel, P., Rutherford, P., and Driver, T. (2015a). Maximising export returns: consumer attitudes towards attributes of food and beverages in export markets relevant to New Zealand. Canterbury: Lincoln University. Retrieved from http://hdl.handle.net/10182/6824
Guenther, M., Saunders, C. and Tait, P. (2015b). Impacts of changes in China and India on New Zealand and Europe’s trade in 2020. Paper prepared for presentation at the 2015 EUCN Conference, 23/24 November 2015; Auckland, New Zealand http://eucnetwork.org.nz/eucn-news-archive/191-wp52-euc-conference-report-2015
28
Guenther, M, Saunders, C. and Tait, P. (2015c). Impacts of changes of consumption and production patterns in China and India on New Zealand trade and the environment. Contributed paper prepared for presentation at the 59th Australian Agricultural and Resource Economics Society Annual Conference, Rotorua, New Zealand, 10-13 February, 2015. http://purl.umn.edu/202524
Guenther, M. and Saunders, C. (2015). The market for health-enhancing foods. Auckland, NZ: Briefing papers, AUT. Retrieved from http://briefingpapers.co.nz/2015/11/the-market-for-health-enhancing-foods/
Guenther, M., Saunders, C. and Tait, P. (2014). Impacts of Changes in China and India on New Zealand trade and greenhouse gas emissions. Contributed paper presentation for the NZ Agricultural and Resource Economics Society Annual Conference "Farming to Changing Expectations" 28-29 August 2014 at the Tahuna Conference Centre, Nelson, New Zealand. http://ageconsearch.umn.edu/handle/189051
Hanley, N., Mourato, S. and Wright, R.E. (2001). Choice modelling approaches: A superior alternative for environmental valuation. Journal of Economic Surveys, 15(3), 435-462.
Hensher, D.A., Rose, J.M., and Greene, W.H. (2015). Applied choice analysis (2nd Ed.). Cambridge University Press: UK.
Hemmerling, S., Hamm, U. and Spiller, A. (2015). Consumption behaviour regarding organic food from a marketing perspective: A literature review. Organic Agriculture, 5(4), 277-313.
IMAGE-team (2001). The IMAGE 2.2 implementation of the SRES scenarios. A comprehensive analysis of emissions, climate change and impacts in the 21st century‚ National Institute for Public Health and the Environment‚ Bilthoven, the Netherlands, Accessed at: http://www.pbl.nl/en/publications/2001/Main_disc__The_IMAGE_2_2).
Intergovernmental Panel on Climate Change (IPCC) (2000). Special Report on Emissions Scenarios. https://www.ipcc.ch/pdf/special-reports/spm/sres-en.pdf
International Monetary Fund (IMF) (2015). Uneven Growth: Short- and Long-Term Factors. World Economic Outlook 2015. http://www.imf.org/external/pubs/ft/weo/2015/01/
Lagerkvist, C.J. and Hess, S. (2011). A meta-analysis of consumer willingness to pay for farm animal welfare. European Review of Agricultural Economics, 38(1), 55-78.
Louviere, J.J., Hensher, D.A. and Swait, J.D. (2000). Stated choice methods: Analysis & application. New York USA: Cambridge University Press.
Mahieu, P-A., Andersson, H., Beaumais, O., Crastes, R. and Wolff, F-C. (2014). Is choice experiment becoming more popular than contingent valuation? A systematic review in agriculture, environment and health. French Association of Environmental and Resource Economists (FAERE) FAERE Working Paper, 2014.12. http://faere.fr/pub/WorkingPapers/Mahieu_Andersson_Beaumais_Crastes_Wolff_FAERE_WP2014.12.pdf
Meyfroidt, P., Lambin, E.F., Erb, K.H. and Hertel, T.W., 2013. Globalization of land use: distant drivers of land change and geographic displacement of land use. Current Opinion in Environmental Sustainability, 5(5), pp.438-444.
29
http://dial.uclouvain.be/downloader/downloader.php?pid=boreal:128267&datastream=PDF_01
Miller, S. Driver, T., Velasquez, N. and Saunders, C. (2014). Maximising Export Returns (MER): Consumer behaviour and trends for credence attributes in key markets and a review of how these may be communicated. AERU Research Report No. 332. Agribusiness & Economics Research Unit (AERU): Lincoln University, New Zealand. http://hdl.handle.net/10182/6349
Mullan, B., Porteous, A., Wratt, D. and Hollis, M. (2005). Changes in drought risk with climate change. NIWA Client Report, May 2005. https://www.mfe.govt.nz/sites/default/files/drought-risk-climate-change-may05.pdf
OECD-FAO (2015). OECD-FAO Agricultural Outlook 2015-2024. http://www.fao.org/3/a-i4738e.pdf
Quiggin, J. (2016). Drought, Climate Change and Food Prices in Australia. Accessed at: https://www.acfonline.org.au/sites/default/files/resources/Climate_change_and_food_prices_in_Australia.pdf
Rosegrant, M.W., Paisner, M.S., Meijer, S. & Witcover, J. (2001). Global Food Projections to 2020. Emerging Trends and Alternative Futures. Washington, D.C., USA: International Food Policy Research Institute.
Rosenzweig, C., Iglesius, A., Yang, X. B., Epstein, P.R., and Chivian, E. (2001). Climate change and extreme weather events - Implications for food production, plant diseases, and pests. NASA Publications. Paper 24. Accessed at:http://digitalcommons.unl.edu/nasapub/24
Saunders, Caroline and Selim Çağatay (2004) Trade and the environment: Economic and environmental impacts of global dairy trade liberalization. Journal of Environmental Assessment Policy and Management, 6(3), pp. 1-27.
Saunders, C., Cagatay, S. and Moxey, A. (2004). Trade and the Environment: Economic and Environmental Impacts of Global Dairy Trade Liberalisation. AERU Research Report No. 267, Agribusiness and Economics Research Unit, Lincoln University.
Saunders, C., Barber, A. and Taylor, G. (2006). Food Miles – Comparative Energy/Emissions Performance of New Zealand’s Agriculture Industry. AERU Research Report No. 285, Agribusiness and Economics Research Unit, Lincoln University.
Saunders, C.M., Guenther M., Tait P.R. and Saunders, J. (2013). Assessing consumer preferences and willingness to pay for NZ food attributes in China, India and the UK. Proceedings of the 87th Annual Conference of the Agricultural Economics Society, University of Warwick, United Kingdom, 8-10 April 2013. Banbury, UK: Agricultural Economics Society. Retrieved from http://purl.umn.edu/158381
Synovate (2007). Global Omnibus survey on climate change. Synovate Research, London, UK.
Tait, P.R., Saunders, C., & Guenther, M. (2015). Valuing preferences for environmental sustainability in fruit production by United Kingdom and Japanese Consumers. Journal of
30

Food Research, 4(3), 46-55. Retrieved from http://www.ccsenet.org/journal/index.php/jfr/article/view/45018
Walsh, P.R., 2005. Dealing with the uncertainties of environmental change by adding scenario planning to the strategy reformulation equation. Management Decision, 43(1), pp.113-122.
Whitehead, J. (2016) Prioritizing Sustainability Indicators: Using Materiality Analysis to Guide Sustainability Assessment and Strategy. Bus. Strat. Env., doi: 10.1002/bse.1928.
Wilcock, A., Pun, M., Khanona, J. and Aung, M. (2004). Consumer attitudes, knowledge and behaviour: A review of food safety issues. Trends in Food Science and Technology, 15(2), 56-66.
Wreford, A., S. Cagatay and C. Saunders (2009). Climate Change and Agriculture: Integrating Agricultural Greenhouse Gas Emissions into an Agricultural Trade Model to Assess the Economic and Environmental Implications of Extreme Weather Events and Bio-energy Policy. Aspects of Applied Biology, 93, 41-46
Wijegunawardane, C. (2002) “The Impacts of Trade Liberalisation on the World Rice Market.” Master’s thesis, Lincoln University.
31
Appendix A: Literature review
Prepared for the Our Land and Water – Matrix project
Sini Miller
September 2016
Review of international consumer preference studies: Choice Experiment case studiesThis appendix include a review of 39 choice experiment (CE) studies conducted in international markets. Choice experiment is one economic valuation method used to assess willingness-to-pay (WTP)1 for different attributes of goods or services that can, but does not have to be, trade on the markets. This belongs to the category of stated preference non-market valuation methods (Hanley et al. 2013; Hensher et al. 2015). Therefore this hypothetical nature of CE method becomes very useful in the cases where some attributes or products, that are currently non-existent or not available in the different countries’ markets, can also be considered. Some advantages of CE method include the possibility
to explore consumer preferences for attributes that do not currently exist in markets (Teratanavat and Hooker 2006) due for example new product development or market access; and
to simulate real markets and the product choices involving trade-offs (Carlsson et al. 2005; Mueller Loose and Remaud 2013; Poelmans and Rousseau 2016).
This is due to the way people are asked in surveys to indicate their preferred alternatives which are described as a bundle of product attributes. More details of the method can be found for example in Hensher et al. (2015).
This review complements the large scale literature review provided as part of the Maximising Export Returns (MER) project by Agribusiness and Economics Research Unit (Miller et al. 2014). This review covered studies from 2003 to 2013. In this review, food safety was identified as a key credence attribute across all markets is food safety including a positive WTP in some cases with very high price premiums, such as for food safety in China. This can be understandable due to the general public concerns following the outbreaks of food scarce scandals around the world. Moreover, markets in some developing countries are going through some rapid changes, such as growing urbanisation amongst others. It is possible that these changes can also impact on consumer preferences.
Other main findings in the Miller et al. (2014) review identify quality, or its different indicators, as another popular credence attribute. The examples include freshness in milk or tenderness of steak, while quality could also be associated with the products’ origin where a common finding is that people prefer domestically produced food products over imported ones. Next, there is range of case studies considering production methods, typically 1 WTP can be estimated when the experiment involves a monetary attribute amongst the other product attributes.
32
comparing across organic, genetically modified (GM) and convenient production practices. Firstly, regarding GM food, evidence is mixed while a WTP for organic production (in dairy, fruit and vegetable, wine, oil and flour products) was found to be consistently positive. It has also been shown that consumers can associate organic foods with a range of benefits such as health and limited use of pesticides.
Another health type of attribute is related to functional food which offer health benefits beyond basic nutrition. In China and Singapore, for example, there is growing interest on these type of products designed to enhance the immune system, supplement basic nutrition or assist with aspects of beauty, among other effects. The 2014 literature review includes limited empirical examples covering oil, bread, eggs and wine products.
Finally, the review find some evidence that consumers are concerned with environmental or animal welfare issues, hence relating to ethical dimensions in production. Studies indicate, for example, that consumers in UK, China and India were willing to pay for reduced water pollution, reduced greenhouse gas (GHG) emissions and improved biodiversity in agricultural production (Saunders et al. 2013), and for certified paper towels associated with several environmental attributes in USA (O’Brien and Teisl 2004). Likewise, research have indicated that many people are concerned about the welfare of animals, potentially influencing their purchase decisions. The CE studies have include a general animal welfare or free range attribute alongside other type of attributes or focusing on the preferences across different type of animal welfare determinants.
The next section provides additional review of some more recent case studies. This review is organised by product categories as the credence attributes can vary across and within each CE and they can be compared with varying trade-offs. The product categories include meat, dairy, fruit & vegetable, wine, and other to be broadly consistent with the MER project.
A1.1 Meat and seafood productsTypical attributes for meat and seafood products include animal welfare, food safety, and production methods. For example, Kallas et al. (2015) designed a study to assess the impact of a possible ban on surgical castration of pigs in European Union (EU). Another dimension in this study was to test an impact of hedonic sensory test on consumer choices and WTP, which was done by including a tasting test in between two CEs. Both CE and hedonic test included four alternatives with similar attributes. In addition, participants were given €5 to buy the preferred frankfurter sausage to validate the results of the simulated market setting2. Total 150 Spanish consumers participated in the experiment. As Table A1 shows, people were willing to pay some amount for the welfare attribute while the hedonic sensory impact results in some differences in the estimates WTP, such as the WTP for flavour attribute which changed from negative to a positive WTP of 0.66 euros/package (55% premium) after been exposed to the product tasting. The results also show that WTP were lower to manufacturer brand compared to private brand.
2 A hold-out method is used in the “real CE” studies to validate the results in SP studies by comparing choices from one randomly selected hold-out choice set question requiring “purchase” (e.g., de-Magistris and Gracia 2014; Gracia 2014; Kallas et al. 2015).
33
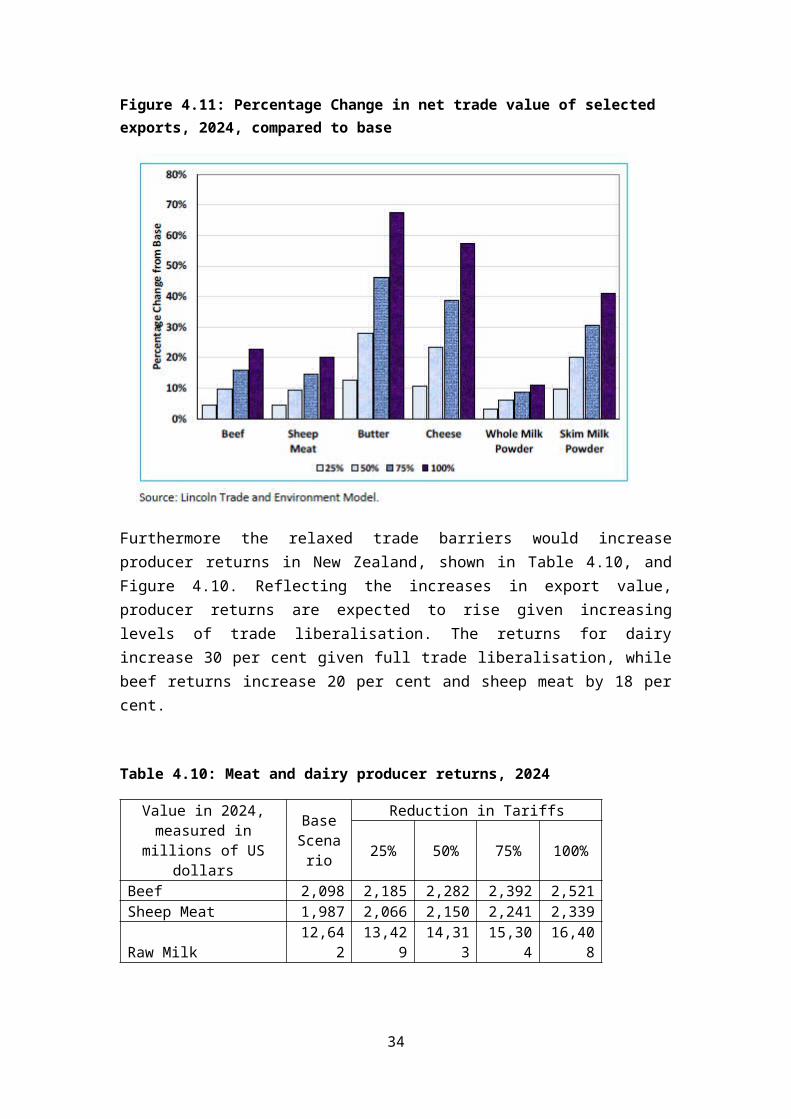
Table A1: Willingness-to-pay for pork sausage attributes, Spain (N= 150*)Pre Sensory CE Post sensory CE
WTP €/package
Premium (%)**
WTP €/package
Premium (%)**
Flavour (vs. Original/ non-flavoured)
With spices and naturally smoked
-0.558 (-47%) 0.660 (55%)
Castration (vs. none)
Meat from castrated pigs or boars
0.340 (29%) - -
Brand (vs. manufacturer)
Private -0.252 (-21%) -0.342 (-29%)
Note: In this adapted Table, WTP was included only if the attribute was statistically significant.* Survey amongst consumers who had purchased/consumed frankfurter sausage at least once in the last month. **Compared to the average of the applied price vector: €1.19/packageSource: Kallas et al. (2015)
In another pork-product CE, Ubilava et al. (2011) compared US consumers’ WTP for the certification on credence attributes between branded and non-branded products. Selected credence attributes included the antibiotic use, animal welfare and environmental-friendliness in the production process where, in a split-sample, some CEs also included a product brand (Hormel, Tyson, Store brand or no brand). The study included 839 completed responses where the majority were the brand-CE survey types. Table A2 reports the WTP results which range from 4 to 28 per cent (0.2 to 1 $/lb) for certified antibiotic-free, environmentally-friendly and animal welfare processes in the production. If looking at WTP as an indication of the ranking of the three credence attributes, it appears that most important attribute on pork chops was the certified antibiotic-free, followed by animal welfare and then environmental attribute. The study also reported a greater variation in WTP the non-branded case which could be related to increased uncertainty when no brand information is given; while it also appear that the attributes as bundles (i.e., attribute interactions) influenced consumer preferences.
34
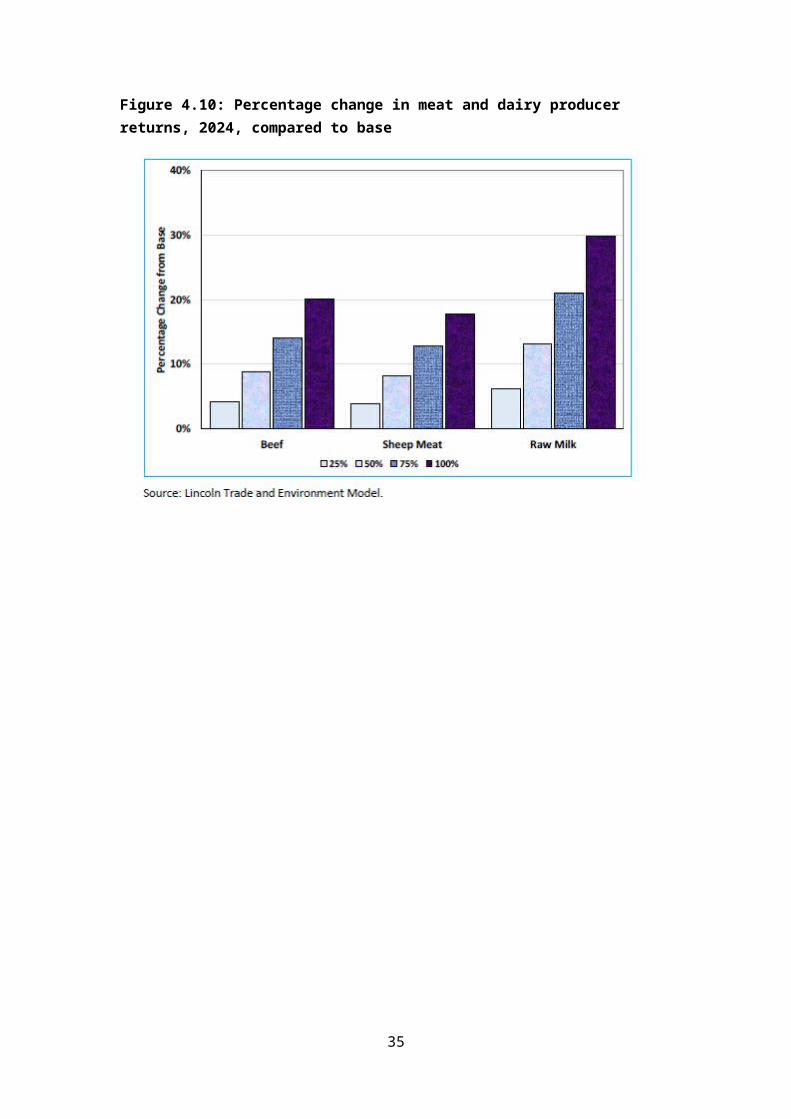
Table A2: Willingness-to-pay for pork chop attributes, USA (N = 839*: brand CEs n = 642, non-brand CEs n = 197)
Choices with brands Choices without Brands
By brand WTP $/lb Premium (%)** WTP $/lb Premium
(%)**
3rd party certified antibiotic-free production
(vs. no certification)
Hormel 0.78 22%
0.63 18%Tyson 0.35 10%
Store Brand 0.61 18%No brand 0.98 28%
3rd party certified environment-friendly
production: water and air quality (vs. no certification)
Hormel 0.76 22%
0.24 7%Tyson 0.26 7%
Store Brand 0.15 4%
No brand 0.32 9%
3rd party certified animal welfare in the production
process (vs. no certification)
Hormel 0.58 17%
0.42 12%Tyson 0.41 12%
Store Brand 0.18 5%No brand 0.67 19%
ANTI*ENVTyson 0.45 13%
0.37 11%Store Brand 0.25 7%
ANTI*WELHormel 0.37 11%
0.31 9%Tyson 0.40 12%Store Brand 0.29 8%
ENV*WELTyson 0.35 10%
0.48 14%Store brand 0.54 16%No brand 0.37 11%
Note: In this adapted Table, WTP was included only if the attribute was statistically significant.ANTI = antibiotic-free production; ENV = environment-friendly production; WEL = animal welfare* A mail survey in 2004 with a sample of 9,600 randomly selected households.** Compared to the average of the applied price vector: US$ 3.475/lbSource: Ubilava et al. (2011)
Animal welfare was also included in the Zanoli et al. (2013) investigation of consumers’ beef product preferences in Italy. In particular, the study contrasted animal welfare with production methods, origin and quality indicators (e.g. fat content and colour). In total 145 consumers participated in the study. Table A3 shows that organic and domestic attributes were the most relevant with a high relative WTP between 24 and 26 euros/kg; or premiums of 109% and 206% of base price, respectively. Of the demographic characteristics, they found that female had a higher WTP for animal welfare.
35
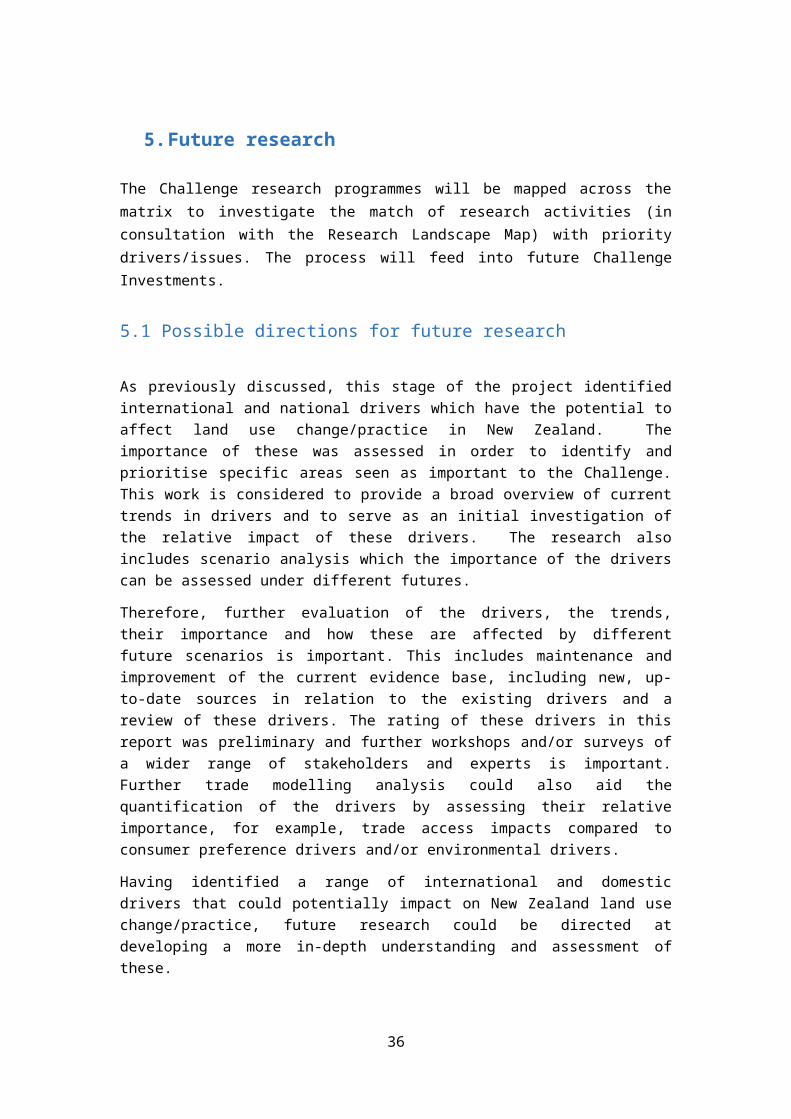
Table A3: Willingness-to-pay for beef attributes, Italy (N = 145*)WTP €/kg Premium
(%)**Production method (vs. not organic)
Organic 26.25 (109%)
Production method (vs. not conventional)
Conventional 12.76 (106%)
Animal welfare (vs. Box) Free-range 17.29 (144%)Place of production (vs. abroad)
Italy 24.69 (206%)
Breed origin (vs. not local) Local 6.40 (53%)* Data were gathered from three different locations (medium-sized towns) in northern, central and southern Italy, in 2008. ** Compared to the basic prices reported in study: €24/kg for the organic beef attribute, and €12/kg for other attributesSource: Zanoli et al. (2013)
Van Loo et al. (2014) combined different environmental and ethical attributes in a CE of chicken product. The attributes were presented in different logos, labels and claims associated with production. The survey was conducted online amongst 359 consumers in Belgium. Interestingly, the authors attempted to capture income effect including an interaction between the price attribute and the variable of high income constrained from a self-identified level of income3. The CE results show that consumers prefer to have product labels or claims versus not having them at all. As Table A4 shows, the average WTP is higher for the free-range claims with a premium between 43 per cent and 93 per cent depending on income level and degree of free-ranging. The respondents also favoured introduction of the domestic or EU-organic logos, and carbon footprint and animal welfare labels. Overall, taking into account the income level, the WTP increased approximately 50% compared to the level lower income.
Table A4: Willingness-to-pay for chicken breast attributes, Belgium (N = 359*)Attributes WTP
euros/kgPremium
(%)**WTP
euros/kgPremium
(%)**Low income High Income
Organic logo (vs. none)
Biogarantie logo (Belgium) 2.16 (23%) 3.18 (34%)EU Organic logo 1.16 (12%) 1.70 (18%)
Animal welfare label (vs. none)
European animal welfare label 2.50 (26%) 3.67 (39%)
Free range claims (vs.
none)
Free range 4.12 (43%) 6.06 (64%)Traditional free range 4.77 (50%) 7.02 (74%)Free range-total freedom 5.99 (63%) 8.81 (93%)
Carbon footprint label
(vs. none)
20% CO2-reduction: 5.6 kg CO2e compared to 7 kg CO2
1.73 (18%) 2.54 (27%)
30% CO2-reduction: 4.9 kg CO2e compared to 7 kg CO2
2.31 (24%) 3.40 (36%)
* Online survey conducted in the northern Belgium, 2012. ** Compared to the average price for conventional chicken breast in Belgium in 2012 (€9.49/kg)Source: Van Loo et al. (2014)
3 The self-identified income was obtained from a 7-point likert-scale ranging from Difficult to Well-off.
36
In Portugal, Viegas et al. (2014) estimated WTP for animal welfare in the context of testing that that different credence attributes can be jointly-produced and hence jointly-valued by consumers. Specifically, they hypothesised that WTP for attribute (e.g., animal welfare) is conditional on the presence of the other attributes (e.g., environmental quality and food safety). The reference alternative included legal minimums and a status quo price. The study included 613 responses for the analysis. Looking at Table A5 (two model specifications with or without interactions), the estimated WTP suggest that highest value was placed on food safety, ranging from 7-16 euros/kg, followed by premiums for animal welfare and environmental protection. An important implication was that the WTP for different combinations of attributes should not be obtained from independent valuation and summation due to significant interaction effects. The authors then applied a conditional approach on estimating attributes WTPs (Table A5, last column) where, for example, the WTP for food safety in the presence of both animal welfare an environment certification decreases the average WTP (from up to 16 euros to negative or close to zero). This suggest that animal welfare and environment may be “cues” for food safety.
Table A5: Willingness-to-pay for beef attributes, Portugal (N = 613*)Attribute Levels Average WTP Conditional WTP***
€/kg(premium %**)
€/kg(premium %**)
main effects
main + interaction
effectsBeef safety (vs. legal standards)
Certified additional level: Reduction/control of the quantity of antibiotic residues in beef
7.31(42%)
16.23(93%)
AW =0 ENV = 0AW = 1 ENV = 0AW = 0 ENV = 1AW = 1 ENV = 1
16.237.477.32-1.43
(93%)(43%)(42%)(-8%)
Animal welfare (vs. legal standards)
Certified additional level 7.30(42%)
12.07(69%)
FS = 0FS = 1
12.083.32
(69%)(19%)
EnvironmentalProtection (vs. legal standards)
Certified additional level: Air, water, soil pollution and reduction/ prevention
4.81(28%)
7.35(42%)
FS = 0FS = 1
7.35-1.55
(42%)(-9%)
* A face-to-face interviews with Lisbon and Oporto residents who were beef consumers and responsible for the household food shopping.**Compared to average of the applied price vector (€17.98/kg)*** 1 indicates the condition, zero otherwise: AW = Animal Welfare; ENV = Environmental Protection; FS = Food SafetySource: Viegas et al. (2014)
Fenger et al. (2015) explored the effect of “storytelling messages” on respondents’ choices. These messages are used in the product labels to create a link between the product and a time, place and/or people4. The CE included product type, health-related properties and price attributes, and the ham product alternatives were presented with pictures without offering an opt-out possibility. 1,087 Danish consumers participated in the online survey that used split-sample of the additional “storytelling part” versus none. The data was analysed using the consumer class approach based on the choice responses resulting in four groups 4 A storytelling example: “Herbal ham with garlic and sage: Naturally preserved with Nordic herbs – a preservation method which has been used for centuries” (Fenger et al. 2015, p. 240 Table 2).
37

conditional to the storytelling condition (yes/no). The groups were labelled as “Basic1” (26.7% of respondents), “Basic2” (26.6%), “Story3” (25%), and “Story4” (21.7%). Basic1 and Basic2 differed in terms of gender and level of “urbanism”; Story3 and Story4 differed in terms or gender and age. While no WTP were estimated in this study, the results suggest that consumers who otherwise might be disinterested of a product may became more positive if exposed to storytelling.
Gracia (2014) investigated consumers’ preferences for a local food in Spain with an additional objective to reduce the risk of hypothetical bias in the results. The participants were given €10 to choose a preferred package of lamb in the end of the interview5. The experiment was conducted amongst 133 participants in the region of Aragón close to the rural area where the “Ojinegra from Teruel” type of lambs are grown. The results shown in Table A6 indicate that consumers are willing to pay a premium between 9 and 13 per cent for local and “Ternasco” lamb, respectively, over unlabelled or “suckling” lamb, respectively.
Table A6: Willingness-to-pay for fresh local lamb attributes, Spain (N = 133*)Attribute WTP €/package (Premium %)**Locally grown label (vs. unlabelled)
Labelled as “Ojinegra from Teruel”
0.29 (9%)
Type of commercial lamb (vs. “Suckling” lamb)
“Ternasco” lamb 0.43 (13%)
* In-store intercept surveys in shops, in 2009, at different days and times. The participants were the main household food shopper and the frequent lamb consumers. ** Reported in the studySource: Gracia (2014)
In the final European meat product example, Van Wezemael et al. (2014) conducted a cross-country study exploring consumer preferences and WTP for nutrition and health claims regarding beef steak. The study tested information/framing effect in a split-sample approach where one sample was shown attributes with nutritional claims only (N sample) and other sample were shown both nutritional and health claims together (NH sample). Data were collected from Belgium, France, The Netherlands and UK with 600 people per country. The results from Table A7 suggest that valuation of nutritional and health claims vary across countries. Across samples, the NH sample had consistently higher WTP, with an exception of the protein claim in UK. This indicated existence of country-specific marketing opportunities when considering nutrition and health claims on beef products, such as protein information in the UK.
5 This is the similar approach to Kallas et al. (2015) of using “real CE” approach.
38
Table A7: Willingness-to-pay for beef steak attributes, Belgium, France, The Netherlands and UK (N = 600/country*)
N sample WTP €/kg Premium (%)**
Iron(vs. no claim)
Nutritional claim: “Source of iron”Netherlands 5.44 (33%)Belgium 4.26 (26%)France 4.11 (25%)UK 5.04 (31%)
Protein (vs. no claim) Nutritional Claim: “‘Rich in protein’’
Netherlands 2.71 (16%)Belgium 3.42 (21%)France 4.96 (30%)UK 5.81 (35%)
Saturated fat (vs. no claim)
Nutritional Claim: ‘‘poor in saturated fat’’ Netherlands 5.78 (35%)Belgium 5.60 (34%)France 6.73 (41%)UK 1.20 (7%)
NH sampleIron (vs. no claim)
Nutritional claim: “Source of iron”Health Claim: ‘‘Iron contributes to the normal cognitive function’’
Netherlands 5.62 (34%)Belgium 5.89 (36%)France 5.49 (33%)UK 4.27 (26%)
Protein (vs. no claim)
Nutritional Claim: “‘Rich in protein’’Health Claim: ‘‘Protein contributes to the growth or maintenance of muscle mass.’’
Netherlands 4.22 (26%)Belgium 6.20 (38%)France 9.70 (59%)UK 4.39 (27%)
Saturated fat (vs. no claim)
Nutritional Claim: ‘‘poor in saturated fat’’Health Claim: “Consumption of saturated fat increases blood cholesterol concentration. Consumption of foods with reduced amounts of saturated fat may help to maintain normal blood cholesterol concentrations.’’
Netherlands 8.45 (51%)Belgium 11.66 (71%)France 11.71 (71%)UK 4.60 (28%)
* Online survey in 2011 with people consuming beef at least once a month. **Compared to average of the applied price vector (€16.5/kg)Source: Van Wezemael et al. (2014)
Tait et al. (2016) contributed another cross-country analysis between the developed and developing economics (UK vs. China and India). They selected lamb product to explore preferences across certified environmental impacts (GHG, biodiversity, and water quality), animal welfare, and food safety, country-of-origin (COO) label and price in lamb products. A generic framing on the product, including percentage price increase, was used to make the cross-country comparison more straightforward. The sample comprised of almost 700 respondents per country. Results reported in Table A8 show that food safety followed by animal welfare appeared to be the most valued attributes with WTP between 9% and 49% more for a certified product. Another similarity across the countries was that of different environmental attributes, the GHG certification was valued most, although not by much. Key differences on the other hand included that while UK consumers preferred domestic products, the consumers in developing markets were not likely to choose domestic product, or pay for it. Another difference was that the Indian respondents had higher WTP for the environmental attributes compared to the UK and Chinese consumers. Overall, this study shows there can be cross-country differences when looking into food attribute preferences but also that similarities might exists for example in terms of which attributes are valued highest.
39
Table A8: Willingness-to-pay for lamb attributes, China, India, UK (N = 2,067*: China n = 686, India n = 695 and UK n = 686)
WTP (in %)**China India UK
Food safety (vs. not certified)
Certified 34% 49% 15%
Farm animal welfare (vs. not certified)
Certified 9% 29% 18%
Water management (vs. not certified)
Certified 7% 21% 6%
Greenhouse Gas (GHG) minimisation (vs. not certified)
Certified 8% 28% 6%
Biodiversity enhancement (vs. not certified)
Certified 5% 26% 4%
Country of origin (vs. no label)
Domestic -27% - 5%Foreign - 13% -5%
Note: In this adapted Table, WTP was included only if the attribute was statistically significant.* Online survey in in 2012 with regular grocery shoppers who had purchased lamb at least once recently (last month). ** Reported in the study Source: Tait et al. (2016)
In United States, Lim et al. (2014) focused on the COO information alongside the trade-offs across quality (i.e., tenderness), production practices (use of hormones and antibiotics), food safety (identified by testing and/or traceability), and price of beef. A nationwide survey was conducted with a sample size of 1000. The WTP were only estimated for the COO attribute, independently or taking into account the respondent specific attitudes and perceptions toward food safety6. The results in Table A9 show that, on average, consumers preferred domestic beef as the WTP were negative for imported products indicating a compensation around $5-$7/lb to achieve these levels. A further analysis show that, ceteris paribus, COO preferences were related to the perceived food-safety level of the country. For example, consumers who had a high-risk perception or distrust about safety of Australian products were willing to pay less for imported beef from Australia, or that people who were risk-averse in regards to food safety had overall a lower WTP for imported products.
Table A9: Willingness-to-pay for beef attributes, USA (N = 1,000*)Attribute Levels WTP US$/lb Premium (%)**Country of Origin (vs. USA)
Canada −5.75 (-53%)Australia −7.33 (-68%)
* A nationwide online survey in 2010. ** Compared to average (USD 10.75) from a vector of low-to-high-end actual market pricesSource: Lim et al. (2014)
Van Loo et al. (2011) assessed US consumers’ WTP for the different organic label types on chicken products. Their analysis focused not just on average WTP but also WTP by different consumer segments based on the purchase-frequency of organic meat (non-buyers,
6 General food safety attitudes and perceptions were explored in a Likert scale question.
40
occasional buyers, and habitual buyers) and on demographics (gender, age, education, household income, and number of children). The survey was conducted online with a sample of 976 respondents. Looking at Table A10, the results indicated positive premiums for both types of organic labelling, being higher for USDA organic label ($3.6/lb or 104% premium) than the generic label ($1.2/lb or 35%). The further analysis showed that WTP differs between demographic groups as well as between different organic buyers. Most respondents (59%) were occasional buyers; around one fourth of the respondents had never bought organic chicken; and only a small group of respondents (15%) bought organic chicken always or often. As expected, the amount of premiums consumers were willing to pay for organic chicken increased by the frequency of buying such product. The consumers WTP estimated for each demographic group show, for example, that females had a higher WTP than male; and that having more children reduced WTP while higher income increased WTP for organic product labels.
Table A10: Willingness-to-pay for chicken meat attributes, USA (N = 256 non-buyer, N = 571 occasional buyers, N = 149 habitual buyers)
WTP full sample $/lb
Premium (%)**
By the type of buyer
WTP$/lb
Premium (%)**
Label (vs. no label)
USDA organic label
3.55 (104%) Non-buyer Occasional Habitual
0.903.338.37
(26%)(97%)
(244%)Generic organic label
1.19 (35%) Non-buyerOccasionalHabitual
-1.011.225.02
(-30%)(36%)
(147%)*Online survey amongst the members of a consumer database in Arkansas. ** Compared to the average price for boneless chicken breast ($3.424/lb) Source: Van Loo et al. (2011)
In Asia, Wu et al. (2015) explored consumer preferences and WTP for a traceability and certification information for pork meat. The sample consisted of consumers in seven Chinese cities that have been designated by the China Ministry of Commerce as pilot cities for a meat and vegetable traceability system. Each respondent was classified by their level of income and education, which was used in the WTP analysis. As shown in Table A11, the estimated WTP, across the full sample, ranged from 2.31 Yuan/kg to 15.80 Yuan/kg (or 19 percent to 32 per cent premiums) for the different product attributes. Looking the consumer profiles, the product traceability information, at different age ranges, had the highest WTP (ranging from 42% to 91% premiums of base price) for the full traceability over no information. Only the consumers with low income/education level were willing to pay towards the minimum traceability information. Likewise regarding the quality certification, most consumers were willing to pay more (ranging from 104% to 149% premiums of base price) for the government certification over none. The high profile consumers were the only one that valued the third-party certification (over no certification), which is consistent with findings that higher education and income are related to the WTP for traceability certification (Zhang et al. 2012). It was also found that the product freshness had a significant effect on respondents’ meat choice preferences.
A separate consumer class based analysis generated four distinct consumer classes based on the respondents’ choices thus further supporting the preference heterogeneity in the
41
sample. These were labelled as “certification-preferred”, “price-sensitive”, “appearance-preferred” and “scared” consumers, where the first class included over half of the respondents. Overall, these findings on Table A12 complement those from above, such as that the WTP for quality certification appears slightly higher than for others, apart from the “Appearance preference” class; and that there are obvious class-specific preferences. The “scared consumers” class was the different to others as they preferred the possibility to opt-out in the given alternatives; furthermore, for this class no WTP are reported here (as the price attribute was not statistically significant).
Table A11: Willingness-to-pay for pork attributes, China (N = 1,489)Attribute WTP full sample
yuan/500g(premium %**)
WTP by age and income/education levelyuan/500g (premium %**)
High Medium Low High income Low education
TraceabilityInformation
*** (vs. none)
Full 8.32(69%)
Age = 35 10.95 7.94 6.70 9.44(91%) (66%) (56%) (79%)
Age = 45 9.78 6.76 5.53 8.26(82%) (56%) (46%) (69%)
Age = 60 8.01 5.00 - 6.49(67%) (42%) - (54)%
Partial 5.72(48%)
Age = 35 8.13 5.72 5.00 7.96(68%) (48%) (42%) (66%)
Age = 45 7.96 5.55 4.83 7.78(66%) (46%) (40%) (65%)
Age = 60 7.71 5.29 4.57 7.43(64%) (44%) (38%) (62%)
Minimum 2.31(19%)
Age = 45 - - 2.29 -(19%) -
Age = 60 - - 2.84 -(24%)
QualityCertification
(vs. no certification)
Government 13.83(115%)
Age = 35 11.35 14.01 15.16 12.84(95%) (117%) (126%) (107%)
Age = 45 12.42 15.09 16.23 13.92(104%) (126%) (135%) (116%)
Age = 60 14.04 16.70 17.85 15.53(117%) (139%) (149%) (129%)
Domestic third-party
15.80(132%)
Age = 35 11.22 10.12 10.33 13.17(94%) (84%) (86%) (110%)
Age = 45 10.19 9.09 9.30 12.15(85%) (76%) (78%) (101%)
Age = 60 8.64 7.54 7.75 10.60(72%) (63%) (65%) (88%)
International third-party -
Age = 35 12.03 - - -(100%)
Age = 45 10.86 - - -(91%)
Age = 60 9.11 - - -(76%)
Appearance (vs. Bad-
looking but edible)
Very fresh-looking
13.74(115%)
Fresh-looking
11.34(95%)
Passable-looking
-
42
Note: In this adapted Table, WTP was included only if the attribute was statistically significant.* In-store intercept interviews, in 2013, in seven cities across different regions of China.**Compared to the average price of pork hindquarters (12 yuan/500g) as reported in the study*** Full traceability information covering farming, slaughter and processing, circulation and marketing; Partial traceability information covering farming, slaughter and processing; Minimum traceability information covering only farming.Source: Wu et al. (2015)
Table A12: Willingness-to-pay for pork attributes, China (N = 1,489)Attribute Class 1* Class 2* Class 3* Class 4*
certification-preferred
price-sensitive appearance-preferred
scared consumers
Class probability 52.7% 12.6% 20.8% 13.9%WTP Yuan/500g (premium %**)
TraceabilityInformation*** (vs. none)
Full 5.24 (44%) - 3.40 (28%) -Partial 2.68 (22%) 0.50 (4%) 2.37 (20%) -Minimum -1.30 (-11%) - - -
QualityCertification (vs. no certification)
Government 8.82 (74%) 0.78 (7%) 3.05 (25%) -Domestic third-party
6.28 (52%) - 2.71 (23%) -
International third-party
4.06 (34%) 0.54 (5%) 3.64 (30%) -
Appearance (vs. Bad-looking but edible)
Very fresh-looking 5.16 (42%) 0.69 (6%) 10.95 (91%) -Fresh-looking 4.76 (40%) - 9.49 (79%) -Passable-looking -4.18 (-35%) - -6.21 (-52%)
Note: In this adapted Table, WTP was included only if the attribute was statistically significant.* In-store intercept interviews, in 2013, in seven cities across different regions of China.**Compared to the average price of pork hindquarters (12 yuan/500g) as reported in the study*** Full traceability information covering farming, slaughter and processing, circulation and marketing; Partial traceability information covering farming, slaughter and processing; Minimum traceability information covering only farming.Source: Wu et al. (2015)
Ortega et al. (2015) explored consumer preferences and WTP for chicken, pork and eggs attributes across various retail channels in China. The retail channel attribute covered wet markets, domestic supermarkets, and International supermarkets, wherein the products may vary in terms of food safety and other attributes such as animal welfare, organic, “green” foods and price. 300 consumers were interviewed for each food product (i.e. pork, chicken and eggs) with equal number of participants from each retail channel. Their results presented in Table A13 show that while consumers WTP for food safety were mostly similar across the different retail channels, with premiums from 165 per cent to 267 per cent compared to the base price, they varied across product types. “Green food” certification was valued more (up to 20 RMB/product or 195% premium) compared to organic certification across all products and retailers. Some differences across retail types can be observed for the WTP for the animal welfare attribute as this was significant only for pork and chicken products and not in the wet markets.
43
Table A13: Willingness-to-pay for chicken, pork and eggs attributes, China (N= 300/product*)
Pork Chicken EggsWTP RMB/product Premium (%)**
Enhanced food safety claim (vs.
no claim)
Wet market 27.73 (213%) 19.94 (199%) 9.93 (199%)Domestic supermarket 23.68 (182%) 26.69 (267%) 9.58 (192%)International supermarket 25.50 (196%) 21.45 (215%) 8.23 (165%)
Animal welfare claim (vs. no
claim)
Wet market - - - - - -Domestic supermarket 7.36 (57%) - - - -International supermarket - - - - 2.28 (46%)
Organic certification (vs.
no claim)
Wet market - - - - 3.28 (66%)Domestic supermarket 11.48 (88%) 15.44 (154%) 5.37 (107%)International supermarket 12.11 (93%) - - 3.89 (78%)
Green food claim (vs. no
claim)
Wet market - - 5.07 (191%)Domestic supermarket 11.79 (91%) 19.69 (197%) 6.76 (135%)International supermarket 19.29 (148%) 16.27 (163%) 6.63 (133%)
Note: In this adapted Table, WTP was included only if the attribute was statistically significant.* In-store (at the point of purchase) interviews in Beijing, 2013. **Compared to average of the applied price vector (pork: RMB 13/jin, chicken: 10 RMB 10/jin and eggs:, and RMB 5/jinSource: Ortega et al. (2015)
Chung et al. (2012) focused on the heterogeneity in WTP for beef attributes. Countries-of-origin of interest included Korea (i.e., domestic), USA and other exporting countries (e.g., New Zealand). They conducted 1,000 interviews amongst Korean consumers. The heterogeneity of the preferences and WTP was explored using the consumer segment based approach. As Table A14 shows, the analysis resulted in three consumer segments based on the respondent’s choices regarding concerns for the GM-beef and use of antibiotics in production. These segments were labelled as “Very concerned” (59% of the sample), “Moderately concerned” (32%) and the smallest group of “Not too concerned” (9%). Thus, over half of the sample were very concerned about the use of GM and antibiotics with WTP around $4.4/lb (20 per cent premium), and about product’s origin with WTP around negative $8/lb (37 per cent premium) for imported meat. This “very concerned” segment hold generally higher WTP values than other segments, and generally these were higher than the weighted averages. Overall, these results suggest that there exists major heterogeneity in Korean (Seoul) consumer preferences towards their meat choices, in particular regards to the attributes about the GM ingredients and antibiotics use in production.
44

Table A14: Willingness-to-pay for beef attributes, Korea (N = 1,000*)Very
ConcernedModerately Concerned
Not too Concerned
Class probability 59% 32% 9%
WTP $/lb Premium (%)**
WeightedAverage WTP
US$/lbPremium (%)**
Marbling Grade (vs. C)
Extra premium 3.01 1.58 0.88 2.35(13%) (7%) (4%) (7%)
Premium 2.13 1.05 0.93 1.67(9%) (5%) (4%) (7%)
Marbling Grade (vs. not A)
A 2.04 0.91 0.62 1.55(9%) (4%) (3%) (7%)
Marbling Grade (vs. not B)
B 0.92 0.39 - 0.66(4%) (2%) (3%)
Freshness (vs. low)
High 2.94 1.69 1.14 2.37(13%) (8%) (5%) (11%)
Medium 1.09 0.76 0.56 0.93(5%) (3%) (2%) (4%)
Chilled versus frozen (vs. yes)
No - freshly chilled
0.63 0.53 0.24 0.56(3%) (2%) (1%) (2%)
Free of antibiotics (vs.
no)
Yes 4.39 1.06 0.81 3.00
(20%) (5%) (4%) (13%)
Free of GM-feed ingredients
(vs. no)
Yes 4.35 0.95 0.59 2.92
(19%) (4%) (3%) (13%)
Country-of-origin (vs.
Korea)
United States -8.38 -3.74 -2.85 -6.39(-37%) (-17%) (-13%) (-28%)
Other exporting countries
-7.25 -3.47 -2.19 -5.57(-32%) (-15%) (-10%) (-25%)
Note: In this adapted Table, WTP was included only if the attribute was statistically significant.* In-store intercept interviews in Seoul, 2007.**Compared to the average of the applied price vector: US$ 22.50/lbSource: Chung et al. (2012)
There is also some emerging research from other developing markets than from Asia. A study from Middle East, by Chalak and Abiad (2012), studied consumers’ preferences and purchasing behaviour in context of shawarma sandwiches7, a Lebanese fast food, which is considered to contain a high level of food safety risk. The study attributes included food safety certification (International Organization for Standardization [ISO] and “ServSafe” food handling program), and the contextual factors such as location, serving size and price. The sample included 284 respondents, where information-effect was tested in a split-sampling approach by providing half-of-the sample with additional descriptions of each type of safety certifications. WTP results, as summarised in Table A15, suggest that, overall, the consumers appreciated convenience in buying sandwich from “around the corner”, and that they also preferred to pay extra 46 per cent for a larger size sandwich, which is around US$1.12 (LBP
7 “Shawarma is a Middle Eastern beef, lamb or chicken-based fast food” (Chalak and Abiad 2012 p. 82).
45

1,677). The information effect was apparent in this study as this increased the average WTP for food safety certification from a range of 282-314 per cent premium to a range of 320-431 per cent premium compared to an average price of a small sized sandwich; these WTP for certification was highest for the ISO 22000 type. This finding suggest a possible existence of information related challenges related to food safety and marketing research.
Table A15: Willingness-to-pay for sandwich attributes, Lebanon (N = 284*: informed n = 145, uninformed n = 139)
Levels WTP LBP/sandwich
Premium (%)**
Location/Convenience (vs. Round the corner < 5 min walk)
Within walking distance (5+ min walk)
-445 (-12%)
Need to go there by car -4,181 (-115%)Delivery order -1,009 (-28%)
Certification (vs. none)
ISO 9001 Uninformed 10,278 (282%)Informed 11,667 (320%)
ISO 22000 Uninformed 11,466 (314%)Informed 15,719 (431%)
ServSafe Uninformed 1 0,372 (284%)Informed 14,366 (394%)
Portion size (vs. Typical small-sized sandwich)
Medium-sized sandwich 1,677 (46%)
LBP = Lebanese pounds; US$1 = LBP1,515* The survey was conducted in Beirut, 2011, excluding participants who had never purchased shawarma sandwiches. ** Compared to an average of LBP3,650 (USD2.41) for a small-sized shawarma sandwich Source: Chalak and Abiad (2012)
Compared to the meat products, consumer preferences toward credence attributes in the context of seafood is relatively unexplored. In United States, Ortega et al. (2014) explored consumer WTP and preferences for imported seafood where the past food contamination and adulteration incidents may have impacted on consumers’ preferences. Two surveys were conducted (one for shrimp products and another for Chinese tilapia) with 335 respondents each. The corresponding CEs included variety of credence attributes: the COO (US, China and Thailand) information was considered only for shrimps and the verification entity (US government, Chinese Government, US Third Party) was considered only for Chinese tilapia. The estimation process included attribute interactions between the credence attributes and COO for shrimps, and between the credence attributes and verification entity. The results in Table A16 show that consumers were willing to pay more for enhanced food safety: $10.65/lb for domestic shrimp, $3.71/lb shrimp from China, and $4.12/lb shrimp from Thailand. The respective premiums were 118 per cent, 41 per cent and 46 per cent. A similar relationship was found for no-antibiotic use and environmentally friendly production which both associated with a higher WTP for the US product by the US consumers.
Regarding the WTP assessments for Chinese Tilapia, as shown in Table A17, the attributes and associated WTP show that consumers were, on average, willing to pay between $4 and $6 per pound (or 89-120 per cent of the base price) for enhanced food safety when verified by US entity. Likewise for the no-antibiotic use and environmental friendly production
46
claims, the only statistically significant evidence was associated with US verification bodies. Overall, the government verification system was valued slightly higher relative to third party verification bodies. Thus these results are consistent with the shrimp results where the US consumers had a higher WTP for domestic than overseas seafood products and verification systems.
Table A16: Willingness-to-pay for seafood (shrimps) attributes, USA (N = 335*) WTP $/lb Premium (%)**
Food safety (vs. no claim)
Enhanced US product 10.65 (118%)Chinese product 3.71 (41%)Thai product 4.12 (46%)
Antibiotic use (vs. permitted)
Not permitted US product 9.83 (109%)Thai product 2.84 (32%)
Production practice (vs. conventional)
Eco-friendly US product 5.40 (60%)
Note: In this adapted Table, WTP was included only if the attribute was statistically significant.* An online survey in 2011. ** Compared to average of the applied price vector (US$9/lb) Source: Ortega et al. (2014)
Table A17: Willingness-to-pay for seafood (imported tilapia) attributes, USA (N = 335*) WTP
$/poundPremium
(%)**Food safety (vs. no claim)
Enhanced US government verified
6.02 (120%)
US third party verified 4.43 (89%)Antibiotic use (vs. permitted)
Not permitted US government verified
5.39 (108%)
US third party verified 2.75 (55%)Production practice (vs. conventional)
Eco-friendly US government verified
2.67 (53%)
Note: In this adapted Table, WTP was included only if the attribute was statistically significant.* An online survey administered by a market research company in 2011. ** Compared to the lowest given price option ($5.00/pound) in the price vectorSource: Ortega et al. (2014)
Uchida et al. (2014) examined Japanese consumer preferences for salmon, including also the two-way interactions motivated by that consumers’ valuations of ecolabels may differ depending on the product characteristics or consumer awareness. The study included a split-sample CE across three types of information effects about fisheries (overfishing and decline of fish-stock): (1) minimal information without the source of the claim; (2) Food and Agriculture Organization (FAO) based information with charts and graphics; and (3) scientific information accompanied by a diagram. Hence, instead of using a conventional approach of “no information” vs. “some information”, they applied minimum information as the baseline. Likert-scales were used to understand general attitudes, information credibility, and the respondents’ level of interest. A nationwide survey included in total 3,370 responses. Looking at Table A18, the Japanese consumers were willing to pay a 27 per cent premium (90 yen/package), for the domestic fish compared to imported fish. A similar premium was found for the ecolabel. Considering these attributes together, the WTP was 149 yen/package which is slightly less than sum of the independent WTP values (90 + 89 = 179). Overall, the interaction effects revealed that value of eco-labels increased value for wild product, in particular for the domestic product. The findings from the information effect
47
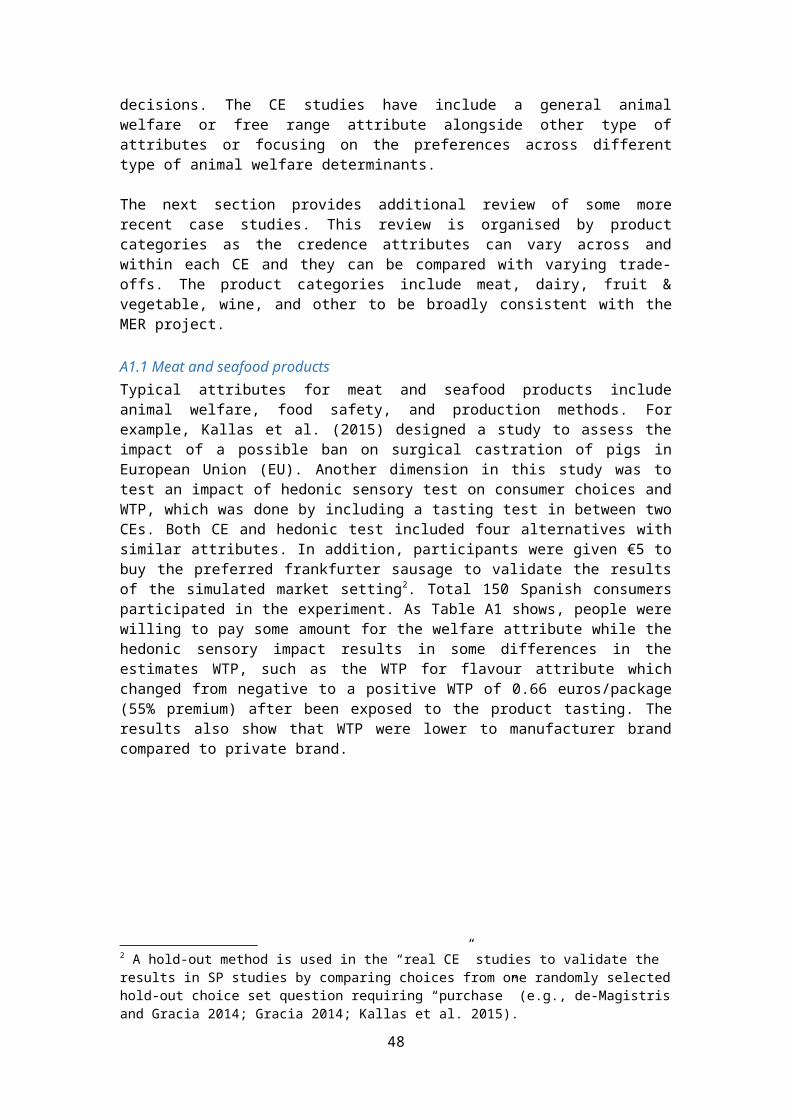
testing revealed that compared to baseline, added information increased the value of the eco-label, although not by much, when the FAO or science based information were considered credible and interesting.
Table A18: Willingness-to-pay for salmon attributes, Japan (N = 3,370*: “minimal information” n = 1,122, “FAO information”, n = 1,118, and “Science information” n = 1,130)
Premium (%)**
Product origin (vs. Chile)Hokkaido (domestic) (26%)Alaska (8%)Norway (7%)
Production (vs. farmed) Wild (10%)Ecolabel (vs. no label) Labeled (26%)
Country of origin x
Wild***
Ecolabel x Hokkaido (44%)Ecolabel x Alaska (27%)Ecolabel x Norway (28%)Ecolabel x Wild (37%)Hokkaido x Wild (52%)Alaska x Wild (36%)Norway x Wild (37%)
Information treatments x Perceptions***
Ecolabel x FAO 22%Ecolabel x Science 20%Ecolabel x FAO x Credible 30%Ecolabel x Science x Credible 28%Ecolabel x FAO x Interesting 29%Ecolabel x science x Interesting 27%Ecolabel x FAO x Interesting 36%Ecolabel x Science x Interesting 34%
* A nationwide online survey in 2009.**Reported in the study***Base levels: Country of origin and wild: ‘‘Chilean farmed salmon with no ecolabel”; and Treatments and perceptions: ‘‘Minimal information perceived neither credible nor interesting’’Source: Uchida et al. (2014)
In Sweden, Lagerkvist et al. (2014) focused on COO and ethical cues in the presence or absence of price attribute, the differences which of should not, in theory, impact on the preferences and structural validity of CE. A large of range attributes with quality and ethical cues were covered in the study (see Table A19) where absence of labelling information was used as a reference point. In addition, a non-parametric test was used to confirm attribute ranking by consumers. Total over 1,000 participants completed the survey. The WTP results in Table A19 are only reported for that part of the sample who saw the CE with price vector (required in the WTP calculation). These results show that consumers were willing to pay on average, for example, 10% premium for a verified SR labelling in beef products which was about four times lower than COO information. COO was also found as the top ranked attribute in both samples. In regards to the comparison between the inclusion and exclusion of the price attributes, one of the results indicated that there was consistently less heterogeneity in the CE without the price attribute.
48
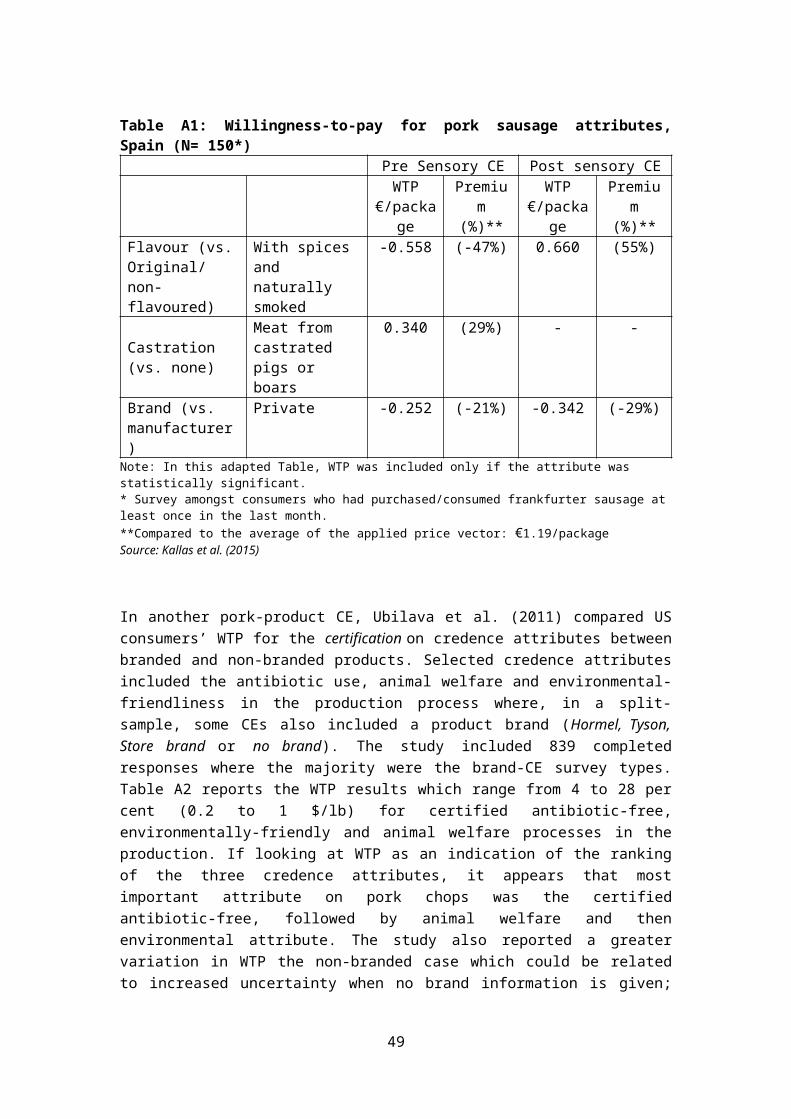
Table A19: Willingness to pay for beef attributes, Sweden (N = 1,070*; n = 630 “no-price sample” and n = 440 “price sample”)
“Price sample” “Price sample”
“No-price sample”
WTP SEK/kg Premium (%)**
Attribute ranking
Origin Information (vs. zone of origin inside or outside EU)
COO (inside or outside EU)
113.7 43% 1 1
Animal specific Reference code (vs. not present)
Information on package
15.0 6% 12 12
Traceability to specific slaughterhouse (vs. not present)
Information on package
32.0 12% 6 6
Traceability to group or specific animal (vs. not present)
Information on package
29.5 11% 7 9
Traceability to specific breeder (vs. not present)
Information on package
32.6 12% 5 4
Verified animal welfare for livestock production (vs. not present)
Information on package
42.1 16% 1 1
Organic production (vs. not present)
Information on package
37.0 14% 4 5
Verified Environmental impact of livestock production (vs. not present)
Information on package
25.6 10% 9 8
Verified health impact from consumption of beef production (vs. not present)
Information on package
21.5 8% 10 10
Verified social responsibility for livestock production (vs. not present)
Information on package
27.4 10% 8 7
Information about medication use (vs. not present)
Information on package
41.2 16% 3 3
Type of animal feed (vs. not present)
Information on package
18.4 7% 11 11
* Online survey in 2012 amongst beef consumers. **compared to the average of the applied price vector: 262.5 SEK per kgSource: Lagerkvist et al. (2014)
A1.2 Dairy productsRegarding the different dairy products, the literature in developing (e.g. Asian) countries, similar to meat products, focuses on food safety whereas the examples from developed countries (e.g., in Europe) are more focused on functional food and related health benefits. In Germany, Bechtold and Abdulai (2014) estimated consumers WTP for functional dairy products, yoghurt and cream cheese where they linked the choice data with the demographic and general attitudes. The choice alternatives were described as bundles of functional ingredients, health claims and product prices. The data included 1,309 responses where each respondent answered CE of both yoghurt and cheese products. The data was analysed using the consumer segment based approach with the class determinants including
49

the socioeconomic and attitudinal variables, the latter generated from principal component analysis (PCA). The results in Tables A20 and A21 show evidence for the class-specific preference heterogeneity when taking into account respondent attitudes, where the Class 2 was found with the most amount of statistically significant attitude and respondent-type associated determinants in relation to the reference group. For example, it was confirmed that “Functional food skeptics” preferred non-functional dairy products, and vice versa by the “Functional food advocates”. Furthermore, majority of consumers valued dairy products with functional ingredients, such as omega-3, highly. These WTP varied from €0.13 to €0.31/serving of yoghurt and €0.35/serving of cream cheese, or premiums between 10 and 23 per cent.
Table A20: Willingness-to-pay for yoghurt attributes, Germany (N = 1,309*)Class 1***
Functional food sceptics
Class 2***Functional food
advocates
Class 3***Functional food
neutrals(reference group)
Class probability (21.5%) (40.5%) (38%)WTP €/200g
Premium (%)**
Functional Food ingredient
Omega-3 fatty acids0.31 0.24 0.13
(24%) (19%) (10%)
Oligosaccharides- 0.10 0.11
(8%) (9%)
Bioactive- -0.10 -0.11
(-8%) (-9%)Polyphenols
Non-functional alternative
0.47 -1.77 -(36%) (-137%)
Health claim
Healthy blood vessels.- -0.41 -0.13
(-32%) (-10%)Healthy blood vessels and
metabolism- 0.23 -0.08
(18%) (-6%)One property depending on
the ingredient- -0.18 0.11
(-14%) (9%)Two properties depending
on the ingredient- - -
Note: In this adapted Table, WTP was included only if the attribute was statistically significant.* Nationwide mail survey, 2010-2011. **Compared to the base price for conventional non-functional food as provided in the study: €1.29/500g***Class determinants: Class 1 Reward from using Functional Foods (FF), Safety of FF, General health interest, Natural product interest, Hysteria; Class 2 Age, Education, Reward from using FF, General health interest, Natural product interest, Hysteria, Necessity for FF, Specific health interestSource: Bechtold and Abdulai (2014)
50
Table A21: Willingness-to-pay for cream cheese attributes, Germany (N = 1,309*)Class 1***
Functional food sceptics
Class 2***Functional food
advocates
Class 3***Functional food
neutrals(reference group)
Class probability (24.8%) (33.9%) (41.3%)WTP €/200g
Premium (%)**
Functional Food ingredient
Omega-3 fatty acids0.35 0.35 -
(23%) (23%)
Oligosaccharides- 0.05 -
(3%)
Bioactive- -0.18 -
(-12%)Polyphenols
Non-functional alternative
0.97 -1.86 -0.02(65%) (-125%) (-1%)
Health claim
Healthy blood vessels.- -0.38 -
(-26%)Healthy blood vessels and
metabolism- 0.24 -
(16%)One property depending on
the ingredient- -0.24 -
(-16%)Two properties depending
on the ingredientNote: In this adapted Table, WTP was included only if the attribute was statistically significant.* Nationwide mail survey, 2010-2011. **Compared to the base price for conventional non-functional food as provided in the study: €1.49/200g***Class determinants: Class 1 Children aged < 12, General health interest, Natural product interest, Hysteria, Necessity for Functional Food (FF), Confidence in FF, Safety of FF; Class 2 Gender, Children < 12years, Reward from using FF, General health interest, Natural product interest, Hysteria, Necessity for FF, Specific health interest, Confidence in FFSource: Bechtold and Abdulai (2014)
Zou and Hobbs (2010) explored consumers’ functional food choices and a labelling effect in a context of Omega-3 enriched milk in Canada. The different health claims covered heart health, generic health claims and more specific risk reduction claims (RRC) and disease prevention claims (DPC). The authors separated these claims from the visual cues (a red heart symbol included in a choice set) and called them as full and partial functional food attributes, respectively. The CE also considered certification and product price. In total 740 people participated on the study. The data-analysis used two approaches, the standard model (Table A22) and the segmented based approach (Table A23). These initial results (as acknowledged by the authors) suggest that consumers respond positively to health claim labels, as well as the verification entities for these claims. Consumers were willing to pay, on average, between $0.12 and $0.51 for different health claims (or 6% to 26% more of the conventional milk price), being highest for the RRC. They were also willing to pay, on average, around 12 per cent more for the verification (vs. none) with little difference on WTP across the type of verification entity. The study also found some sociodemographic influences, such as income which increased WTP for the Omega-3 attribute.
The second analysis confirmed these preferences were consumer group-specific (Table A23). Overall, the full health claims seemed to have a higher absolute WTP (over no claim) when
51

compared to the WTP value of the visual claim (over none), apart from the “Health Claim challengers” group, who were minority of the sample (7%). Looking specifically at the functional ingredient attribute, people were willing to pay, on average, $0.20/litre premium for Omega-3 enriched milk over regular milk, and this WTP was even higher with higher income people and those who have positive attitudes toward functional food in general.
Table A22: Willingness-to-pay for milk attributes, Canada (N = 740*)WTP $/2 Litres Premium (%)**
Omega-3 (vs. regular milk) Contains Omega-3 0.20 (10%)
Health Claims (full labelling) (vs. none)
Function Claim: “Good for your heart health“
0.19 (10%)
RRC: “Reduces the risk of heart disease and cancer“
0.51 (26%)
DPC: “Helps to prevent Coronary Heart Disease and Cancer“
0.33 (17%)
Symbol (partial labelling) (vs. none)
Heart Symbol 0.12 (6%)
VerificationOrganization (vs. none)
Government 0.24 12%Third party 0.23 12%
* Online survey conducted in 2009.** Compared to the lowest price in the given price vector: $1.99/2 litres of conventional milk.Source: Zou and Hobbs (2010
52

Table A23: Willingness-to-pay for milk attributes: The latent class approach, Germany (N = 740*)
WTP $/2 Litres Premium (%)**
Conventional milk
consumers
Functionalfood
believers
Functionalmilk lovers
Health claimchallengers
Class probabilities
48.9% 21.7% 22.1% 7.3%
Omega-3 (vs. regular milk)
Contains Omega-3 - 0.25 1.64 0.29(13%) (82%) (15%)
Omega3 x Factor1 0.11 4.84 0.48 0.74(6%) (243%) (24%) (37%)
Omega3 x Factor2 - -0.25 - -0.23(-13%) (-12%)
Omega3 x Income 1.39 3.85 8.94 -4.37(70%) (193%) (449%) (-220%)
Omega3 x Gender 0.12 3.09 0.96 0.96(6%) (155%) (48%) (48%)
Health Claims (full labelling)
(vs. none)
Function Claim - 0.16 0.49 -(8%) (25%)
RRC - 0.37 1.83 -(19%) (92%)
RRC x Factor1 - -0.14 0.36 0.26(-7%) (18%) (13%)
RRC x Factor3 - - 0.36 -(18%)
RRC x Heart disease - - -0.58 -(-29%)
RRC x Education - - -0.29 -(-15%)
DPC - 0.46 1.74 -(23%) (87%)
Symbol (partial labelling) (vs.
none)
Heart Symbol - - 0.31 0.27
VerificationOrganization
(vs. none)
Government - 0.17 0.98 0.37(9%) (49%) (19%)
Government x Factor3
- 0.09 0.25 0.33(5%) (13%) (17%)
Third party - 0.33 0.70 -(17%) (35%)
Note: In this adapted Table, WTP was included only if the attribute was statistically significant.* Online survey in 2009. ** Compared to the lowest price in the given price vector: $1.99/2 litres of conventional milk.*** Heart disease: “respondent self-reports having heart disease”; Factor 1 “positive attitudes toward and experience consuming functional food”; Factor 2 “more awareness of health and healthy diet behaviours”; Factor 3 “higher levels of trust in health claims and nutrition labels” (Zou and Hobbs 2010 p. 10 Table 2). Source: Zou and Hobbs (2010)
In China, Wu et al. (2014) assessed consumers’ WTP for organic infant formula, including also respondents’ food safety risk perceptions and knowledge level (from Likert-scales) into
53
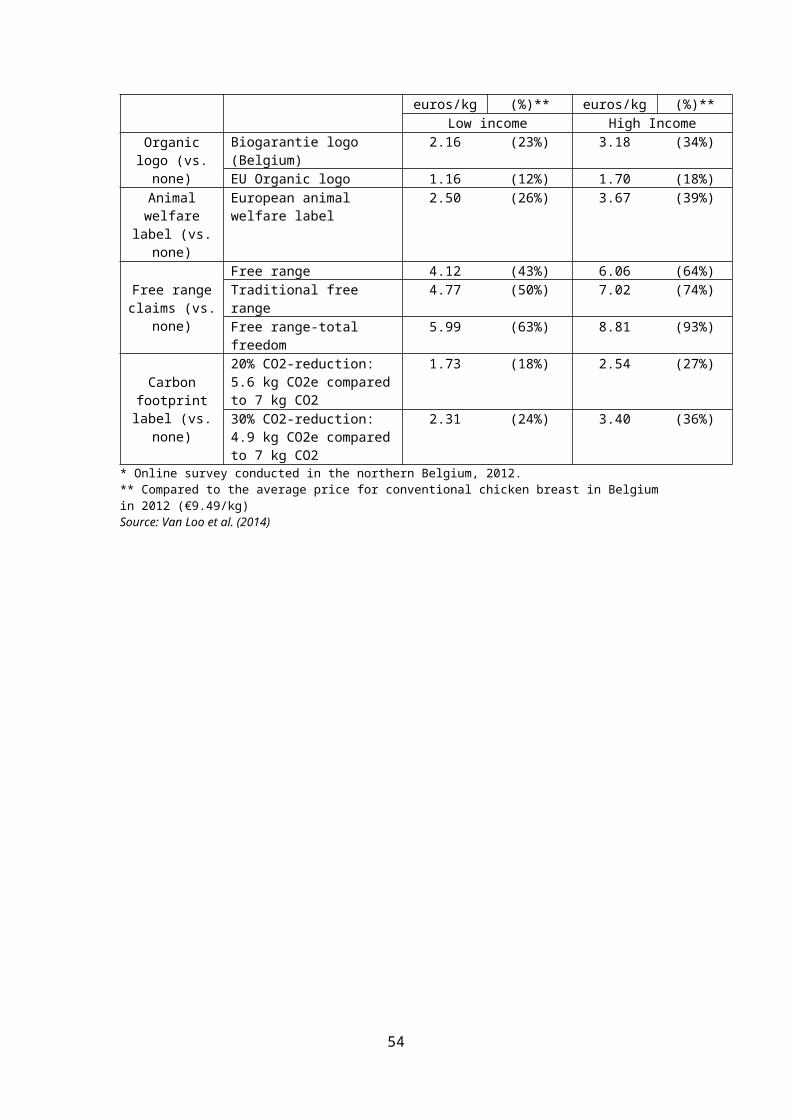
the analysis. The CE attributes included organic label, COO; brand including two Chinese (“unknown” Dele, and well-known Yili) and two foreign brands (European Topfer, and North American Enfamil); and product price The design also included two-way interaction effects between the attributes in order to explain the variance around preferences. The study was conducted in Shandong province, which is China’s third most populous province, resulting in 1,254 completed responses. The result show, firstly, that the respondents’ knowledge and understanding of organic food were relatively low while the perception regarding the food safety risk were relatively high. The CE results in Table A24 show that consumers had a higher average WTP of $5-$10 (or 36-69 per cent of the base price) for the EU and US-based organic labels than for the Chinese label (vs. not having any label). These WTP estimates increased if the level of knowledge and the level of perceived food safety risk were higher, up to 112 per cent and 86 per cent, respectively. Furthermore, the Chinese consumers preferred imported products and brands over domestic ones which is consistent with previous studies (e.g., Saunders et al. 2013). Lastly, the study highlighted two of the significant and positive findings from the attribute interactions (between the US organic label and China-COO, and between Enfamil and China-COO), which imply a potential of complementary relationship where adding these labels/brands to formula produced in China could improve their value.
Table A24: Willingness-to-pay for infant formula attributes, China (N = 1,254*)
Full sample By level of knowledge
By level of risk perception
WTP US$/40
0g
Premium (%)** WTP US$/400g Premium (%)**
Organic label (vs. no label)
Chinese 3.23 (22%)Low 3.49 (23%) 3.84 (26%)Medium 3.84 (26%) 4.28 (29%)High 1.95 (13%) 4.20 (28%)
EU 5.36 (36%)Low 3.81 (25%) 3.75 (25%)Medium 6.93 (46%) 6.02 (40%)High 6.04 (40%) 6.25 (42%)
US 10.40 (69%)Low 10.66 (71%) 9.93 (66%)Medium 16.87 (112%) 12.58 (84%)High 16.55 (110%) 12.89 (86%)
Brand (vs. Dele)
Yili 4.40 (29%)Topfer 6.17 (41%)Enfamil 7.08 (47%)
Country of origin (vs. Germany)
China -2.42 (-16%)the US 3.53 (24%)
* In-store interviews, in 2012. ** Compared to the average of the applied price vector: US$ 15/400gSource: Wu et al. (2014)
A1.3 Fruit & vegetable productsIn the fruit and vegetable category, Denver and Jensen (2014) focused on the organic and local food (apples) preferences in Denmark. As reviewed in the paper, local food can be associated with high quality, freshness and trustworthiness. The study combined CE and
54
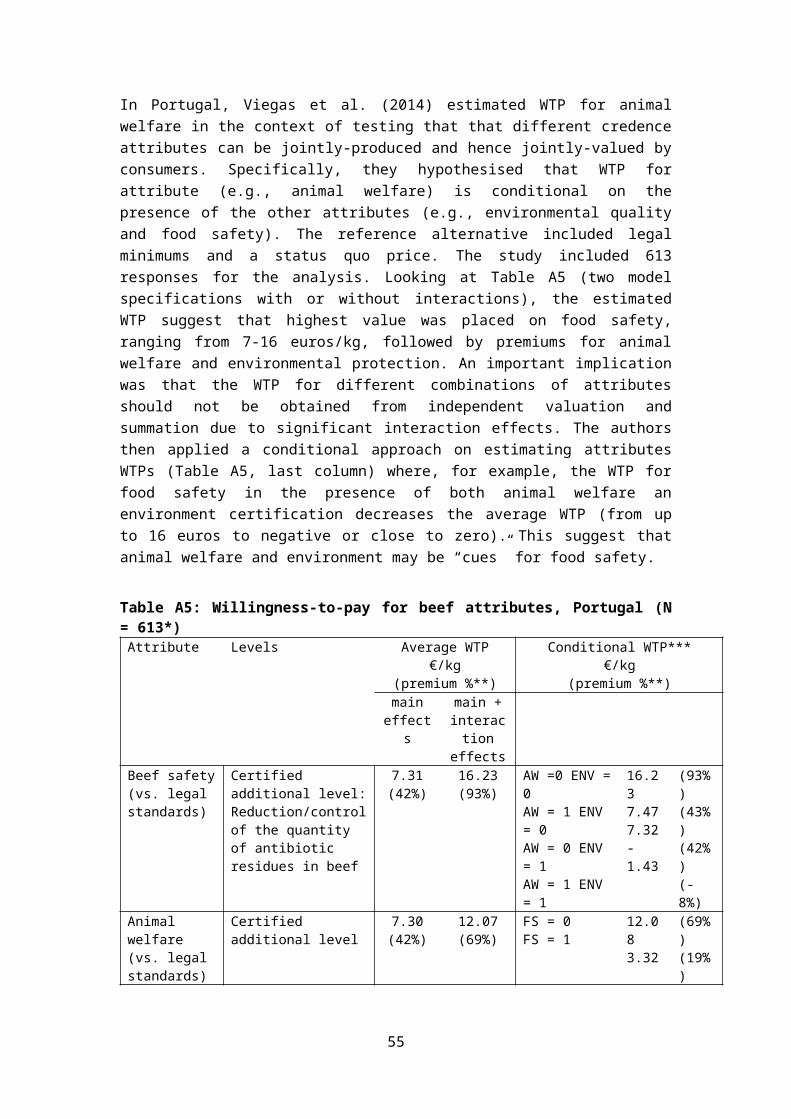
PCA, where the latter was used to aggregate the attitudinal the Likert-scale responses. The CE included attributes of food origin ranging from domestic (local or domestic) to imported apples (within or outside of European Union, EU); production method (organic vs. conventional); alongside colour and taste/texture. The survey included in total 637 respondents. The PCA show essentially two components: one related to organic products and another to locally produced products. While no WTP was calculated, authors provided indication of WTP for these two attributes (Table A25). The participants were willing to pay 5.40 DKK/kg premium for organic apples and 19 DKK/kg for local food. These numbers increased by 97 percentage points if the respondents hold “maximum perception” of the organic attributes based on the PCA. This suggests that, in the case of apples, consumers with positive perception of organic food can also have relatively strong preference for local food but not necessarily vice versa. This asymmetry need to be further explored as suggested by the authors.
Table A25: Willingness-to-pay for the local apple attribute, Denmark (N = 637*)Full sample Those with maximum perception
of the organic attributesWTP DKK/kg Premium (%)** WTP DKK/kg Premium (%)**
Production method (vs. conventional)
Organic 5.40 77% 12.20 174%
Origin(vs. outside EU) Local 19.00 (271%) 22.60 (323%)
* Online survey in 2010. **Compared to current price (status quo option) of a conventional apple 7 DKK/kg Source: Denver and Jensen (2014)
In another European study, Akaichi et al. (2015) assessed consumers WTP for fair-trade (FT), organic and carbon footprint attributes (collectively known as ethical attributes) in bananas. A particular objective was to identify if these attributes compete in different markets. For the study, in total 247 consumers were interviewed in three countries. The CE results (Table A26) show that consumers were willing to pay between €0.08 and €0.14 for fair trade and organic bananas where in French had a slightly higher, and statistically significant, WTP compared to Scots and Dutch. All respondents were also willing to pay, on average, €0.10 (77% premium of the lowest price) to reduce carbon footprint (1kg on the transport). These WTP were statistically significantly higher by Dutch over the Scotts. In order to explore the trade-offs, a within-sample test of WTP differences was applied. These results show that, in Scotland, consumers were willing to pay significantly more for fair trade bananas compared to other attributes, but also that they would choose organic bananas if FT price too high. In the Netherlands sample, there was no evidence for different WTP for attributes; thus these attributes are competing and the price of attribute determines choices. Lastly, French were willing to pay significantly more for organic bananas than fair trade bananas, if price is not too high. Overall, consumers in all countries show positive WTP for all claims/labels, and although generally these ethical claims may not be competing, this study identified that under some circumstances this may change.
55
Table A26: Willingness-to-pay for the banana attributes, Scotland, France and the Netherlands (N = 247*: 100 in Edinburgh, 95 in Clermont-Ferrand and 52 in Amsterdam)
WTP by all respondents WTP by Country€/banana Premium
(%)**€/banana Premium
(%)**Fairtrade Label (vs. no label)
0.10 77% Scotland 0.14 108%Netherland 0.13 100%France 0.09 69%
Organic Label (vs. no label)
0.09 69% Scotland 0.08 62%Netherland 0.09 69%France 0.13 100%
Carbon footprint/ reduction per kg
0.10 77% Scotland 0.09 69%Netherland 0.12 92%France 0.12 92%
* Intercept survey at public places and retail stores with occasional buyers, at minimum, of bananas** Compared to the lowest amount of the price vector: €0.13/bananaSource: Akaichi et al. (2015)
Moving to examples from developing markets, Probst et al. (2012) explore the potential for marketing certified organic vegetables in three West African cities (Cotonou in Benin, Accra in Ghana and Ouagadougou in Burkina Faso). In particular, certified organic production was examined as a potential strategy to improve food safety. Two separate CEs were developed: one for the food vendors’ choices of tomatoes (a common ingredient in meals) and another for the consumers’ meal choices of (continental or traditional) when eating out. The vendor CE included trade-offs across the appearance (freshness, colour and neatness), production method and price attributes, while the consumer CE included trade-offs across the taste, production method and price attributes. In both experiments, the product alternatives were presented with a picture. Both CE targeted different type of retailers ranging from street food sellers to restaurants, where the interviews resulted in 180 vendor responses and 360 consumer responses. There were some differences in between the sample demographics such as the respondent to consumer sample were predominantly female whereas vendors were mostly male. In both CEs, the WTP was only reported for the organic production attribute. Looking first Table A27, the vendors were willing to pay, at median, US$0.85 for organic certification of the fresh tomatoes, which equals to a premium between 12 and 53 per cent of typical retail price. These WTP across the cities vary depending on the season. Next, looking the WTP by consumers, Table A28 shows they were willing to pay, at median, just over US$1 per meal if the food served contained only certified organic vegetables. This equals around 19 per cent premium on average meal price in restaurants; 75 per cent premium in small food business; and 177 per cent premium on average meal price in the street food vendor; thus the latter being relatively much higher compared to other venues.
56
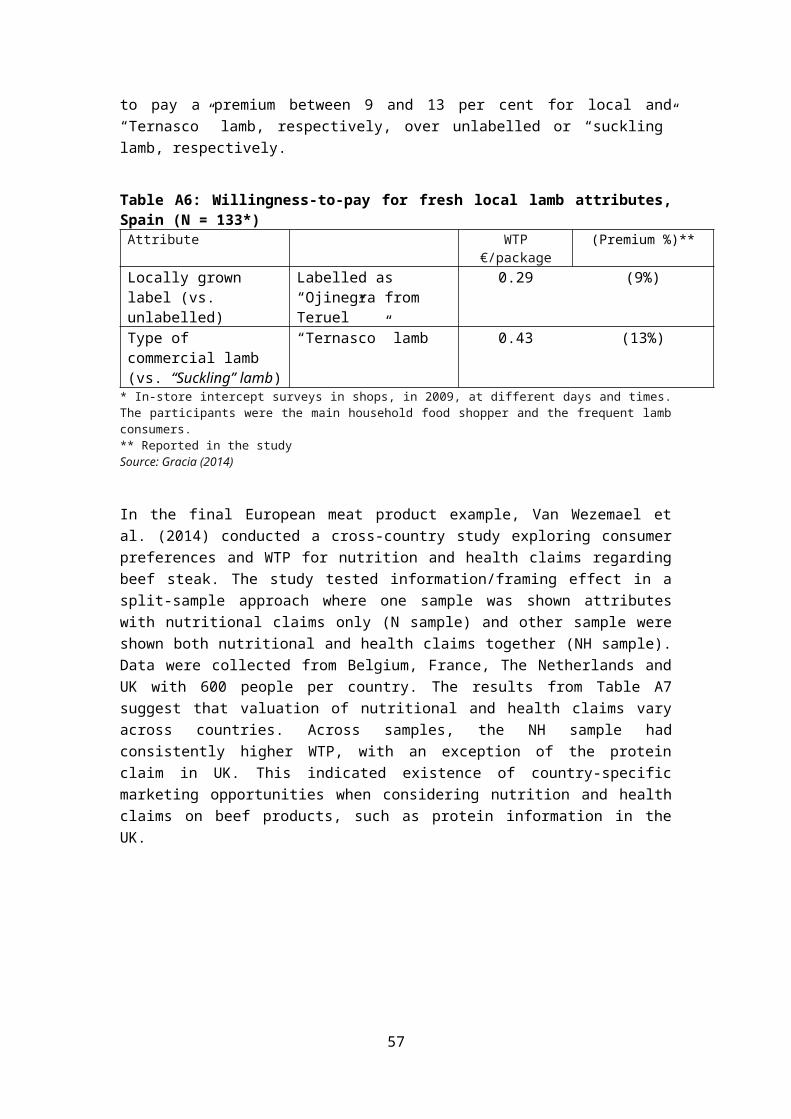
Table A27: Willingness-to-pay for basket of tomatoes attributes (by vendors), Benin, Ghana and Burkina Faso (N = 180*, n = 60/city)
By City Lean season Peak seasonWTP US$/3 kg
basket(premium
%)**(premium
%)**
How vegetables were grown (vs.
not organic)
Certified organic $0.848 Benin (16%) (39.9%)Burkina Faso
(26.7%) (53.4%)
Ghana (12.1%) (23.9%)Note: The WTP values were not estimated for all attributes. * Intercept interviews, in 2009, with street food vendors, small food businesses and restaurants.** Reported in the study. Source: Probst et al. (2012)
Table A28: Willingness-to-pay for meal attributes (by consumers), Benin, Ghana and Burkina Faso (N = 360*)
WTP US$/plate
By retailer (% premium)**
How vegetables added to the
meal were grown (vs. not organic)
Certified organic
vegetables
$1.044 Street food vendor 177%Small food business
75%
Restaurant 19%* Intercept interviews, in 2009, with customers of the street food vendors, small food businesses and restaurants. ** Reported in the study. Source: Probst et al. (2012)
Wongprawmas et al. (2014), also in a developing economy context, estimated Thai consumers’ WTP for food safety labels in fresh produce. These labels included “Q mark” which is the main food safety label in the market; a “Safe Produce” label which, although common in the market, is not supported by a quality assurance system; and two private brands “Royal Project” and “Doctor's Vegetables”, which are well-known and high quality fresh produce brands in the market. To simulate real shopping situations, Q mark always appeared together with the private brands. Other product attributes considered were freshness (in days) and price. In total 350 people participated in the experiment. Looking at Table A29, the results show high premiums (from 117% to 180% compared to regular market prices) on different food safety labels which indicates strong preferences for having a food safety label or information. Lastly, while no retailer-specific WTP were assessed, the separate results provided in the study indicated that the “Claimed safe produce” label was valued more in the fresh-market than in the supermarket contexts.
Table A29: Willingness-to-pay for Chinese cabbage attributes, Thailand (N = 350, supermarket N = 200; fresh market n = 150*)
WTP baht/kg (Premium %)**
Brand and Label (vs. no information)
Claimed "Safe Produce" 58.61 (117%)Q mark (the main food safety label) 87.81 (176%)Royal Project and Q mark 88.47 (177%)Doctor's Vegetables and Q mark 90.06 (180%)
* Intercept interviews at different times and days with vegetable/cabbage consumers who are the main food shopper in a household.** Compared to average price (50 baht/kg) in Bangkok in June-July 2013
57
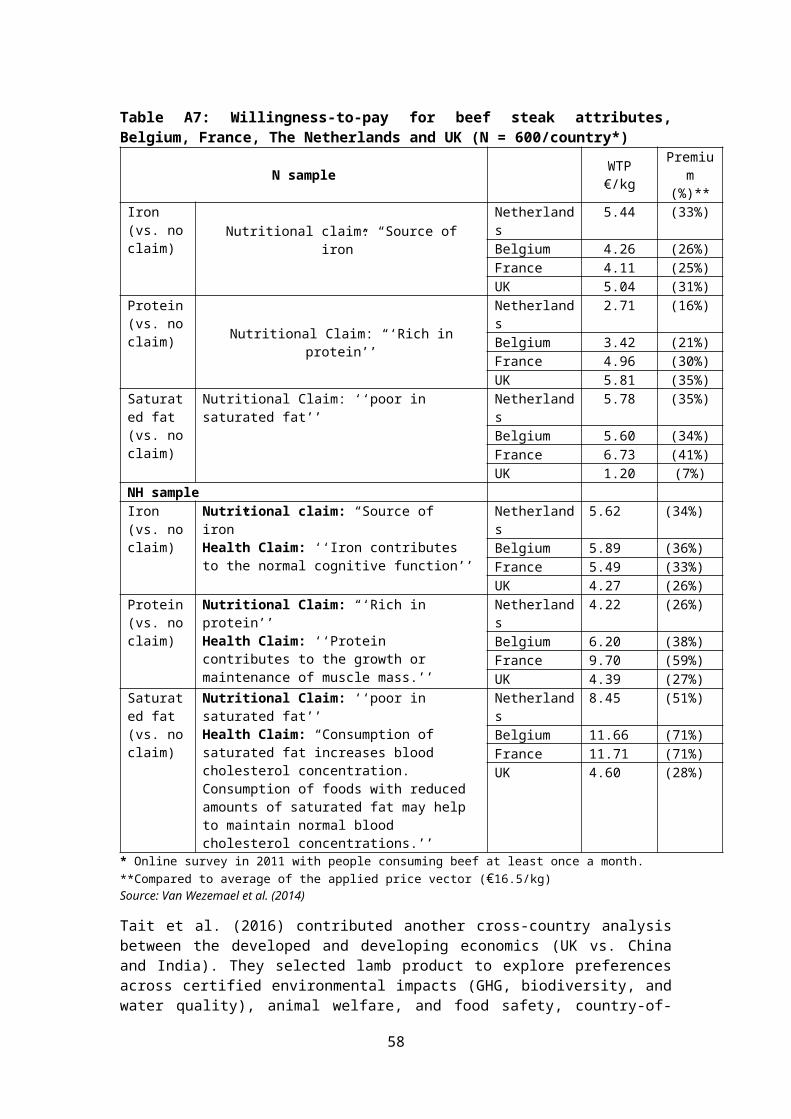
Source: Wongprawmas et al. (2014)
58

A1.4 Wine products
In the wine context, Kallas et al. (2013) focused on elements involved in wine choices for a special occasion, such as origin, people’s experience and knowledge of wine (“wine references”, as the authors called it), grape type and price. In the survey, the respondents were asked to fill two separate wine CEs. The first being a so called “forced choice task” (i.e., no opt-out option), and the second being “non-forced choice task” with an added opt-out alternative. 400 wine consumers participated in the study. The results, shown in Table A30, indicate that the most preferred origins were non-imported wines, in particular the regional Catalonian wine with WTP around 2.60-3.10 €/bottle (or around 30% of the base price). Also experience and type of wine influenced on consumers wine choices as indicated by the relatively higher WTP estimates. The main differences between forced and non-forced choices involved the significantly higher premium for regional wine and Cabernet Sauvignon wine when allowing opting-out, however, the forced choices resulted in higher WTP for national wines as well as lower discount or compensation (negative WTP) for the prestigious wines and imported wines. Overall, the results from the non-forced CE suggest an increasing tendency of statistically significantly higher WTP for most preferred type and origin levels.
Table A30: Willingness-to-pay for wine attributes, Spain (N = 400*)Average WTP €/bottle
(Premium %)**“Forced choices” “Non-forced choices”
Origin
Catalonia (regional) *** 2.65 3.07(27%) (31%)
Spain (national) *** 0.50 0.39(5%) (4%)
Imported (international) *** -3.15 -3.46(-32%) (-35%)
Wine references
previously known/experienced
0.81 0.73(8%) (7%)
Recommended wine -0.17 0.04(-2%) (0.4%)
Prestigious wine*** -0.64 -0.78(-6%) (-8%)
Grape variety
Cabernet Sauvignon (French variety) ***
1.77 2.29(18%) (23%)
Grenache (Spanish variety) -1.18 -1.33(-12%) (-13%)
Merlot (French variety) *** -0.60 -0.96(-6%) (-10%)
* Face-to-face interviews in supermarkets and streets (central city) of Barcelona. ** Compared to average of the applied price vector: 10 €/bottle*** Statistically significant different between the forced and non-forced choices (p < 0.01 or p < 0.10)Source: Kallas et al. (2013)
In another special occasion wine study by Mueller et al. (2010), the objective was to understand the importance of different wine label statements; hence not calculate the WTP. The CE included a relatively large number of attributes as ten different statements (history of the winery; local grape sources; production method; taste descriptor; elaborate taste
59

descriptor; food pairing between wine and type of meal; consumption advice; environmental consciousness; website; and ingredients) were either present or not on the label, plus price. Each alternative was represented with an undefined Australian wine with the same alcohol level to enhance the use of extrinsic cues in the choices. 331 of regular wine consumers in Sydney participated in the laboratory experiment. A sociodemographic comparison indicates that the sample for this study is mostly aligned with the general Australian wine consumer population based on a wine consumer survey from Roy Morgan in 2007 (as cited in Mueller et al. 2010). The data was analysed with the consumer class segmentation approach which resulted in five distinct classes that vary in terms of their preferences on certain label information and price but not in terms of the respondent characteristics. Overall, the most influential label attributes associated with the wine choices were price, history, taste descriptors and food pairing. In contrast, environmental information, ingredients and website information’s in the labels had a relatively smaller, or negative, impact on choices. An additional analysis revealed that just over half of the participants, generally, read the wine labels and find them interesting as well as helpful.
In a Russian case study, Cicia et al. (2013) explored consumer preferences and WTP of red wine. Their CE included seven wine types varying by their geographical origin and quality-dependent price. The survey was done amongst 388 households in three large cities. Based on the estimated WTP (Table A31), the results found three distinct segments: (1) high-quality-high-price Italian and French wines with WTP varying between €4.8-5.7/bottle, or 96-113 per cent of the base price; (2) a medium-quality wines (WTP of €2.96/bottle, or 54%); and (3) lower quality wines with WTP less than one Euro per bottle. Moreover, the non-CE results showed that wine consumption was generally described as occasional and that certification of origin was considered as a proxy for quality which also reflected respondents WTP.
Table A31: Willingness-to-pay for wine attributes, Russia (N = 388*)WTP €/bottle Premium (%)**
Geographical origin (vs. Chile Cabernet)
Italy-Tuscany (Chianti) 5.66 (113%)France (Bordeaux) 4.81 (96%)Spain (Rioja) 2.69 (54%)Italy-Sicily (Cabernet) 0.97 (19%)Russia (Krasnodar Grenache dry) 0.92 (18%)Georgia (Saperavi dry) 0.06 (1%)
* Sample included Russian households located in Moscow, Saint Petersburg and Novosibirsk.**Compared to the lowest value of the applied price vector including Chilean wine, approximately €5/bottle.Cicia et al. (2013)
Lastly, Mueller Loose and Remaud (2013) explored North American and European consumer preferences when the wine choices involve corporate social responsibility claims (i.e., an umbrella term of environmental and social aspects) alongside the product price. Prior to the CE, the participants were also asked about their awareness and trust of different claims in food and wine products. The survey targeting wine consumers resulted in between 982 and 2,027 respondents in different countries. The results show, firstly, that overall the awareness, purchase penetration and trust in regards to social and environment claims were similar across the claims but different across the markets, for example, compared to European markets the North American consumers seemed to have a higher level of trust and claim awareness. Looking at Table A32, the WTP results support the differences across the
60
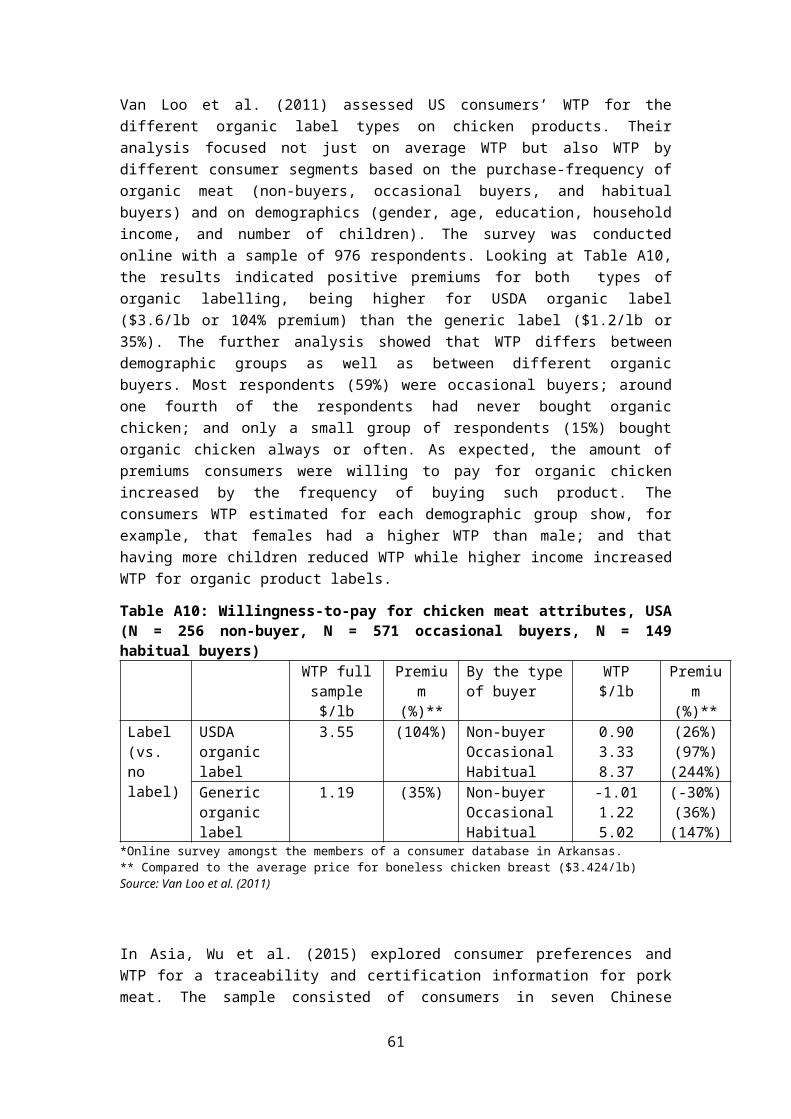
markets, but also across the different label claims. Over all markets, the average WTP was highest for the organic claims about WTP €1.20/bottle (or 14% premium) and this was twice as much than the WTP for the environmental claims. Across the markets, not all attributes were statistically significant in all countries, such as for the social and environmental responsibility. In most of these markets, the organic attribute had the highest WTP, particularly in France and Germany. The negative WTP could interpreted as a consumer demand for a discount, or consumer dislike, if such labels exists in wine, such as socially responsibility in French markets or the reduced glass weight of wine bottles. Overall, this cross-country study illustrates that differences might exists between different developed markets.
Table A32: Willingness-to-pay for wine attributes, USA, Canada, France, Germany and UK (N=11,322*: US n = 1,617 and n = 1,614, Canada n = 1,036 and n = 982, France n = 2,027, Germany n = 2,025, UK n = 2,021)
Average all countries By countryPremium (%)** Premium (%)**
Social responsibility logo (vs. no logo) 2.3% France -3.4%
Environmental responsibility logo (vs. no logo)
6.6%US East coast 10.4%US Midwest 7.3%CAN Anglo 8.8%
Organic logo (vs. no logo)
14.4%
UK 3.8%France 26.1%Germany 27%US East coast 17.6%US Midwest 10.7%CAN Anglo 12.8%CAN Franco 2.9%
Carbon zero logo (vs. no logo)
3.2%
UK 3.4%France -3.1%Germany -0.3%US East coast 9.6%US Midwest 5.2%CAN Anglo 4.0%CAN Franco 3.3%
10 per cent lessglass logo (vs. no logo)
-2.9%
UK -1.4%France -4.3%Germany -8.1%US East coast 1.2%US Midwest 1.7%CAN Anglo -4.6%CAN Franco -4.3%
Note: In this adapted Table, WTP was included only if the attribute was statistically significant.* Online survey, in 2009Samples in US included New York metropolitan area (Northeast) and Chicago metropolitan area (Midwest); samples in Canada included Anglophone and Francophone Canada** reported in the study.Source: Mueller Loose and Remaud. (2013)
A1.5 Other product categoriesThere has been also a number of CE applications that do not fit in any of the previous product categories (meat, dairy, fruit & vegetable, and wine); for example, Van Loo et al. (2015) focused on the preferences for a coffee product, pioneering in sustainability
61
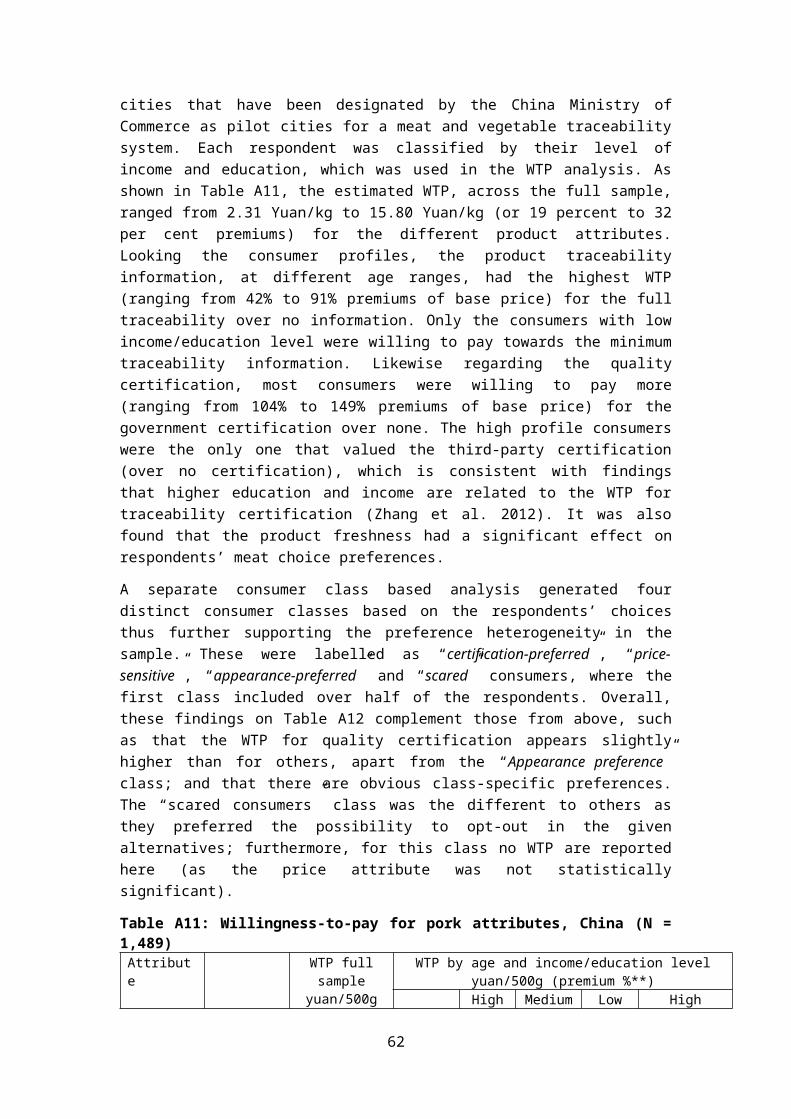
certification. The sustainability labels considered were Fair Trade (FT), Rainforest Alliance, USDA Organic and Carbon Footprint, which of the latter is less common in the US coffee market. A novelty in the study was the visual attention on the choice sets (coffee packages) by the respondents. This was done by an eye-tracking exercise on areas of interest (AOI) using a tracking devise connected to the computer used to complete the surveys; two measures were calculated: time and count of total fixation. In addition, Likert-scales were used to explore people’s attitudes and perceived importance for the sustainability concepts. 81 participants were selected for the experiment. Three consumer segments were discovered based on the cluster analysis8: “Indifferent”, “Sustainability and price conscious” and “Price-oriented” consumers. Looking at the relative WTPs in Table A33 the respondents, on average, were willing to pay most ($1.16/12oz, or 16% premium increase) for USDA certified coffee, and up to 19 per cent of premium increase if they were Sustainability and price conscious consumers, including most of the sample. The results also showed that visual attention to attributes is related to the preferences, or importance, of the attributes where using more time and fixating more attention relate to a higher WTP. Significant interactions with this attention included USDA organic, Fair Trade and Price attributes. Hence this study illustrated that sustainability-motivated consumers are also likely to seek information about sustainability aspects.
Table A33: Willingness-to-pay for coffee attributes, USA (N = 81*)
Full sample
By consumer segments***Sustainability and price
conscious (n = 47)
Price-oriented(n = 26)
WTP $/12 oz Premium (%)** WTP $/12 oz Premium (%)**
Fair Trade – label (vs. label not
present)0.68 (9%)
0.71 (10%)-
Rainforest Alliance – label (vs. label not
present)0.84 (12%)
0.99 (14%)-
USDA Organic – label (vs. label not
present)1.16 (16%)
1.41 (19%)-
Carbon Footprint – label (vs. label not
present)-
0.51 (7%)-
Note: In this adapted Table, WTP was included only if the attribute was statistically significant.* Participants were recruited from a University database, in 2013. ** Compared to average of the applied price vector ($7.30/12 oz)*** Since the “Indifferent consumer” segment consisted of only 8 participants, no WTP was calculated.Source: Van Loo et al. (2015)
Arnoult et al. (2010) focused on COO which can be considered to relate with issues on global food safety scares, although, as the authors recall, COO is just one of many product attributes faced in the purchase choices. Thus for a cross-product CEs, the selected attributes were origin, season, type (GM or organic) alongside the price. The sample size were just under 200 for both products. The WTP results reported in Table A34 indicate strong preferences for local products and aversion of EU imports for both product types.
8 Using the variables from the Likert scale questions and eye-tracking attention scores.
62
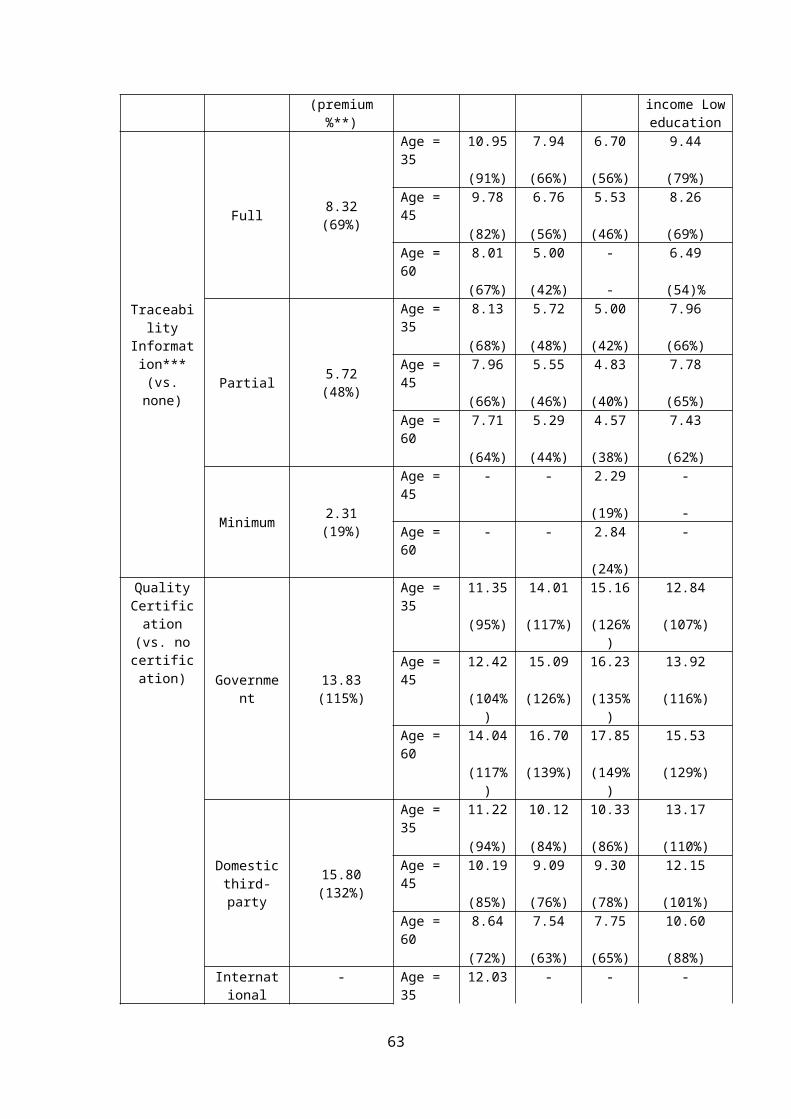
These WTP were just under £1.94/kilo (or 37%-60% premium of the base price) and approximately -£1.10/kg (-22% and -34%). However, some seasonality differences were observed between the product types as the WTP for lamb increased in spring whereas WTP for strawberries increased in summer. Another difference was observed that while organic strawberries had higher WTP tan GM-free berries, the WTP was higher for GM-free lamb than organic lamb. Finally, a number of socio-demographic influences were tested, such as locality of product was valued higher by higher income people; and that higher weekly spending influenced on the WTP on lamb whereas gender influences on the WTP for strawberries over difference seasons.
Table A34: Willingness-to-pay for lamb and strawberry attributes, UK (N = 185 lamb CE and N = 187 strawberry CE*)
Lamb Strawberries
WTP £/kg Premium (%)** WTP £/kg Premium (%)**
Location (vs. Rest of the world)
Local 1.75 37% 1.94 60%
National - - - -
European Union
-1.06 -22% -1.11 -34%
Seasonality (vs. winter season)
Summer 0.58 18%
Autumn -0.52 -11% -0.49 -15%
Spring 0.31 7%
Type 1 (vs. nothing stated)
GM-free0.59 12% 0.40 12%
Type 2 (vs. nothing stated)
Organic0.29 6% 0.64 20%
* Face-to-face interviews in 2005.** Compared to average of the applied price vectors (lamb: £4.74/kg and strawberries: £3.24/kg)Source: Arnoult et al. (2010)
In a Spanish study, de-Magistris and Gracia (2014) used the “food miles” concept as part of the CE where alternatives vary across almonds produced between 100km and 2000km distances, versus no such labelling at all. The survey participants completed two set of choice sets, where the second one was used for validity checking. In addition, at the end of this process each participant were offered €10 with a hold-out set including a purchase option. The sample comprised of 171 participants. The estimated WTP values are described in Table A35 which show positive preferences with WTP of €0.62-€0.68/100g, or 30 to 33 per cent of premium increase, towards an organic-label and a 100km-label. The WTP towards the longer distances were negative and increasing according to the length, hence indicating preferences towards more local products.
63
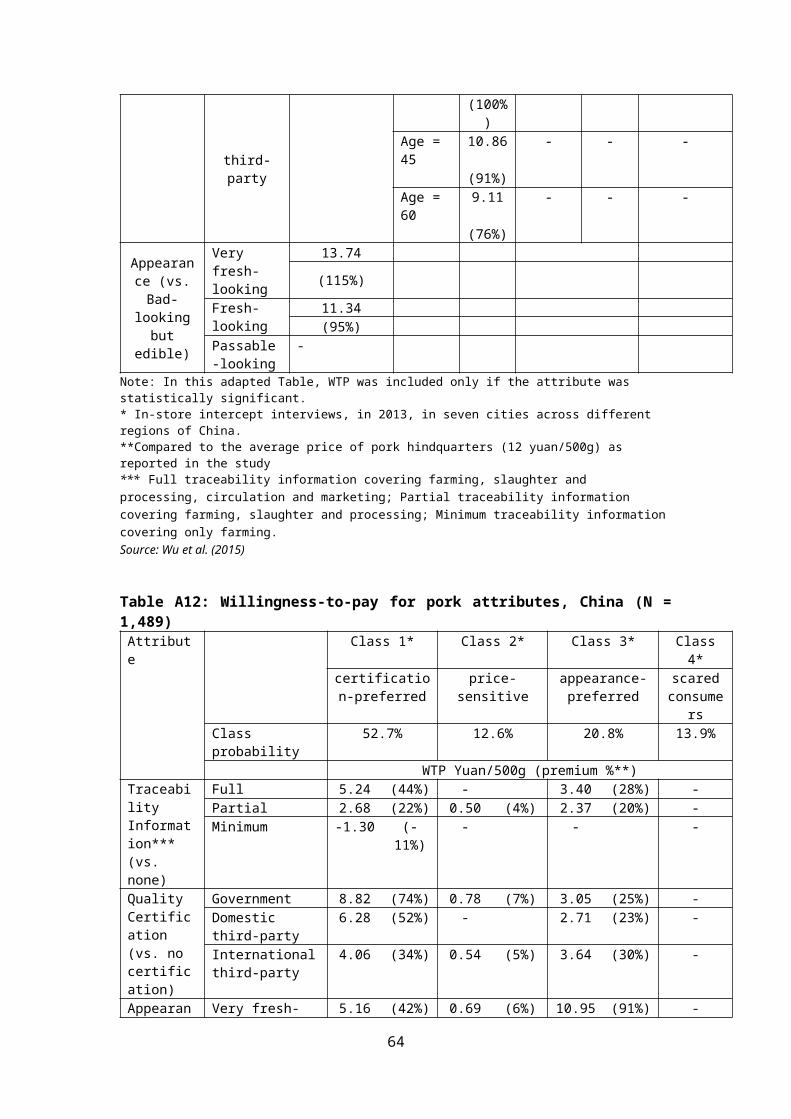
Table A35: Willingness-to-pay for almond attributes, Spain (N = 171*)Average WTP
€/100 g package(Premium %)**
Production method (vs. No label: conventional)
EU organic label 0.62 (30%)
Origin of production (vs. no
information of distance)
100-km label: almonds were produced within 100km (i.e., within province)
0.68 (33%)
800-km label: almonds were produced around 800km (i.e., within Spanish or neighbour regions)
-0.25 (-12%)
2000-km label: almonds were produced around 2000km (i.e., outside Spain but in Europe)
-1.03 (-49%)
* Random sample of respondents across the capital area of Spain.** Compared to average of the applied price vector (€2.085/100g) based on the prices in supermarkets at the time.source: de-Magistris and Gracia (2014)
Aprile et al. (2012), in Italy, assessed values for European Union (EU) geographical and quality labels in the olive oil products. These labels provide a tool to communicate sustainable production or products value-added quality. The labels included Protected Designation of Origin (PDO), Protected Geographical Indications (PGI) and organic farming (OF). In total 200 consumers participated in the study. The results, in general, suggested that all these attributes affected consumers’ preferences in regards to their oil product choices. The WTP, as summarised in Table A36, ranged from €1.52 up to €5.60 per litre, being highest for the PDO label with 86 per cent premium increase of the base price. The second highest WTP was found for the PF label. The authors comment the finding with higher WTP for the PDO label than the PGI label might be due to that olive oils, in the study location, are typically PDO-certified.
Table A36: Willingness-to-pay for olive oil attributes, Italy (N = 200*)WTP €/litre (Premium %)**
Type of olive oil/quality (vs. Virgin)
Extra virgin 4.44 (68%)
European OF label (vs. label absent)
Present 4.78 (74%)
European geographical indication (vs. label absent)
PDO label 5.60 (86%)PGI label 1.52 (23%)
* In-store interviews in grocery stores, 2010 in Naples.** Compared to average of the applied price vector (€6.5/litre).Source: Aprile et al. (2012)
In another Italian study, Cosmina et al. (2015) assessed consumer preference for the honey attributes including product origin and type, landscape of the origin and price. The survey was conducted amongst 427 Italian consumers. Most respondents (over 90% of sample) were honey consumers however typically they consumed this just occasionally. The place of purchase vary between “buying directly from producer” to supermarkets. The result presented in Table A37 are based on the consumer segmentation based approach which results in four consumer classes with similar choice patterns. People in the first class considered only the origin attribute in their choices. The other three classes were labelled as
64

“Environmentally friendly” consumers (35% of the sample), “Pro-intensive production” consumers and “Organic” consumers. As Table A37 shows across these three classes, the Environmentally friendly consumers had a WTP between €4.76 and €3.99 (84 and 70 per cent) for organic and local honey, respectively while having negative WTP for others; whereas the Pro-intensive production and Organic consumers were willing to pay between €2.54 and €8.30 (45 and 146 per cent) for most attributes where type of honey (i.e., crystallisation) was valued the highest in both classes. Thus overall these WTP indicate strong preferences towards the local and organic attributes in honey with some differences in WTP across the consumer segments. Only a small section of respondents (in Class 1) were not willing to pay any premium for other than the local product.
Table A37: Willingness-to-pay for honey attributes, Italy (N = 427*)Class 1 Class 2 Class 3 Class 4
N/A Environmentally friendly
Pro-intensiveproduction
Organic
Class probability 19% 35% 19% 27%WTP €/jar
(premium %) **Geographic origin (vs. other Italian regions)
Friuli Venezia Giulia (local) Region
2.88 3.99 4.53 5.41(51%) (70%) (80%) (95%)
Other countries - -6.45 - -2.54(-114%) (-45%)
Honey crystallisation (vs. semi-solid state)
Liquid (runny) state
- -4.84 8.30 6.70
(-85%) (146%) (118%)
Organic (vs. no) Yes - 4.76 6.57 6.33(84%) (116%) (112%)
Landscape (vs. Skyscraper hives)
Evocative landscape
- - 3.69 2.54(65%) (45%)
Beehives near industrial buildings
- -1.59 6.74 5.23(-28%) (119%) (92%)
* Face-to-face interviews, in 2014 ** Compared to average of the applied price vector (€5.67/jar).Source: Cosmina et al. (2015)
The social responsibility attribute has been included in some, but not many, food and beverage choice studies. Recently Vlaeminck et al. (2016) assessed consumers’ WTP for a Fair Trade (FT) chocolate product in Belgium. The key study objective was to test WTP for a FT label, and the sub-attributes of this label. In practice, this was done in a within-sample test with two separate CEs: a “FT-label experiment” including the label (FT and Bio-FT), quality & taste, origin of cocoa and price attributes; and a “FT-characteristics experiment” with sub-attributes of FT covering environmental standards, price paid to producers, community investment, working conditions and product price. Half of the sample saw the FT-label CE first, and another half a reversed order. 144 consumers participated9 in the 9 Participants received €5 to participate in the study and were told beforehand that they would need to buy a chosen chocolate bar after the experiment.
65
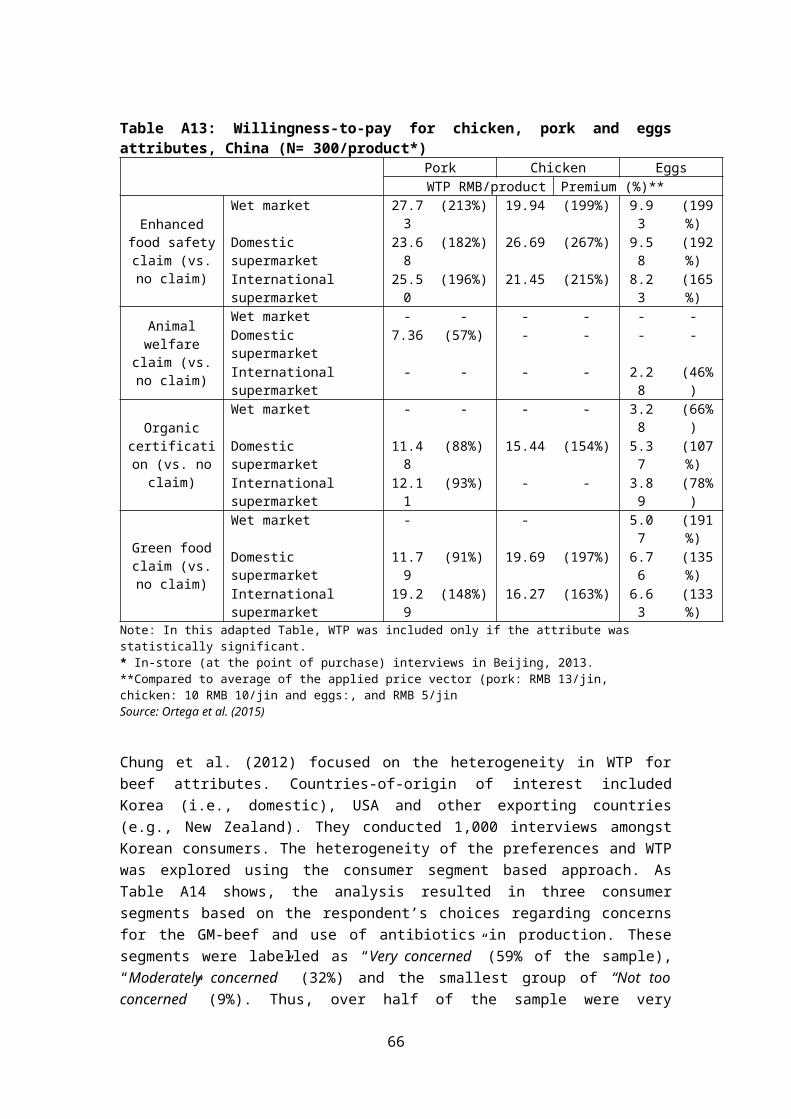
experiment. In this sample, the general purchase habits of FT products in general, if available, was split across (almost) never (approximately 50% of sample), regularly (42%) and always (5%); and only quarter of respondents defined a FT-product correctly. These general results also show that while most people (70%) believed the FT-statement, not everyone care about these issues personally. Summary of the WTP results from the CE analysis are provided in Table A38 and A39. Looking at Table A38, the results of the FT-label experiment show that consumers value the FT-label with a positive WTP of €0.84/100g for the standard FT label and $1.22 for the Bio-FT label. These equals to 207 per cent and 301 per cent premiums, respectively, of the supermarket price. The average WTP for FT-label was then compared to different combinations of the FT-characteristics (FT-high, FT-low, BioFT-high and BioFT-low). Looking Table A39, the WTP for different FT-sub-attributes were between €2.25 and €3.76 (up to 928% premium); hence the consumers valued the bundle of FT attributes, in particular in their highest levels, more than the plain FT labels. The results of the plain FT-label valuation are comparable to the price premium operated in supermarkets indicating that consumer surplus is effectively captured.
Table A38: Willingness-to-pay for chocolate attributes, Belgium (N= 144*)CE with a Fair Trade label
WTP €/100g
Premium (%)**
Label presence (vs. no label)
Fair trade label 0.84 (207%)Bio-Fair trade label 1.22 (301%)
* Face-to-face intercept survey, in 2013. ** Compared to supermarket price of FT chocolate (€0.81/200g or €0.45/100g)Source: Vlaeminck et al. (2016)
Table A39: Willingness-to-pay for chocolate attributes, Belgium (N= 144*)
Attribute bundles
CE with Fair Trade characteristics
WTP(€/200g)
Premium (%)**
FT highest outcomes: EU Environmental standard, price paid to producer, high community investment and frequent controls in working conditions
3.76 (928%)
FT lowest outcomes: EU Environmental standard, average price paid to producer, average community investment and infrequent controls in working conditions
2.54 (627%)
Bio-FT highest outcomes: Organic Environmental standard, fair price paid to producer, high community investment and frequent controls in working conditions
3.47 (857%)
Bio-FT lowest outcomes: Organic Environmental standard, average price paid to producer, average community investment and infrequent controls in working conditions
2.25 (556%)
* Face-to-face intercept survey, in 2013. ** Compared to supermarket price of FT chocolate (€0.81/200g or €0.45/100g)Source: Vlaeminck et al. (2016)
Comparison of GM (or genetically engineered, GE) products and associated health enhancing (or functional food) benefits were explored by Ding et al. (2015) in Canada. In this study, the assessment of consumer preferences on GM-food were linked to consumers trust (generalized trust and trust in the food system) and health-related beliefs. In the context of
66
canola oil product, the selected attributes covered GM or GE information, omega-3 content, COO and price. Consumer trust and health beliefs (i.e., health locus of control, HLC) were measured in Likert-scale statements. In total 1,009 consumers completed the survey. The results in Table A40 show that consumers were willing to pay premium, between 12 and 29 per cent of the base price, for domestic and/or regular or enhanced omega-3 levels over no label, however, this WTP was relatively lower compared to the perceived disutility, or required compensation, from the negative WTP for the GM-products. A further analysis with the interactions show (WTP not reported here) that stronger internal control over health by the respondent will increase their WTP for enhanced omega-3; and that negative preferences of GM-food can be offset or linked to the level trust. Some additional findings included that men valued GM-product more compared to women, older people and those with higher education were less likely to prefer GM-products; and that people with higher income valued the health benefits more.
Table A40: Willingness-to-pay for canola oil attributes, Italy (N = 1,009*)WTP CAN $/1 litre Premium
(%)**Omega-3 content (vs. no label)
Contains omega-3 0.95 19%Enhanced omega-3 0.86 17%
Country of origin (vs. USA)
Canada 1.45 29%
GM (vs. no label information)
Non-GM 0.60 12%Contains GM/GE -1.82 -36%
* Nationwide online survey** Compared to average of the applied price vector ($5 per 1 liter)Source: Ding et al. (2015)
A1.6 Products adopting new technologyFinally, three of the reviewed studies have considered the opportunities provided by technological advancements in relation to food choices. Erdem (2015), in UK, explored consumers’ preferences for reduced food safety risk of chicken. They tested the impact of having a nanotechnology in the food packaging by including this attribute (as a symbol) in one CE and not in the other. Other attributes of consideration were risk of food poisoning and animal welfare level based on the Welfare Quality index. Each subsample was further split into “welfare-improved” chicken consumers and “conventional” chicken consumers according to their reported purchasing behaviour10. Other than the nanotech attribute, the levels used in the status quo option vary according to the current purchasing behaviour. In total 449 consumers completed the survey. As Table A41 show, consumers on average prefer chicken with a lower food safety risk and improved animal welfare, regardless of the presence of nano-sensors. The WTP were found to be higher by the “welfare-improved” consumers compared to the “conventional” consumers; it also appears that presence of the nano-sensors could increase the WTP for food safety and chicken welfare. A choice debriefing question revealed that around half of the respondents considered such nanosensors as “a good idea” while the remaining the sample ranged from “not bothered” to “more than concerned”, and anything between.
10 Approximately 30% of the respondents in both samples were welfare-improved chicken consumers.
67
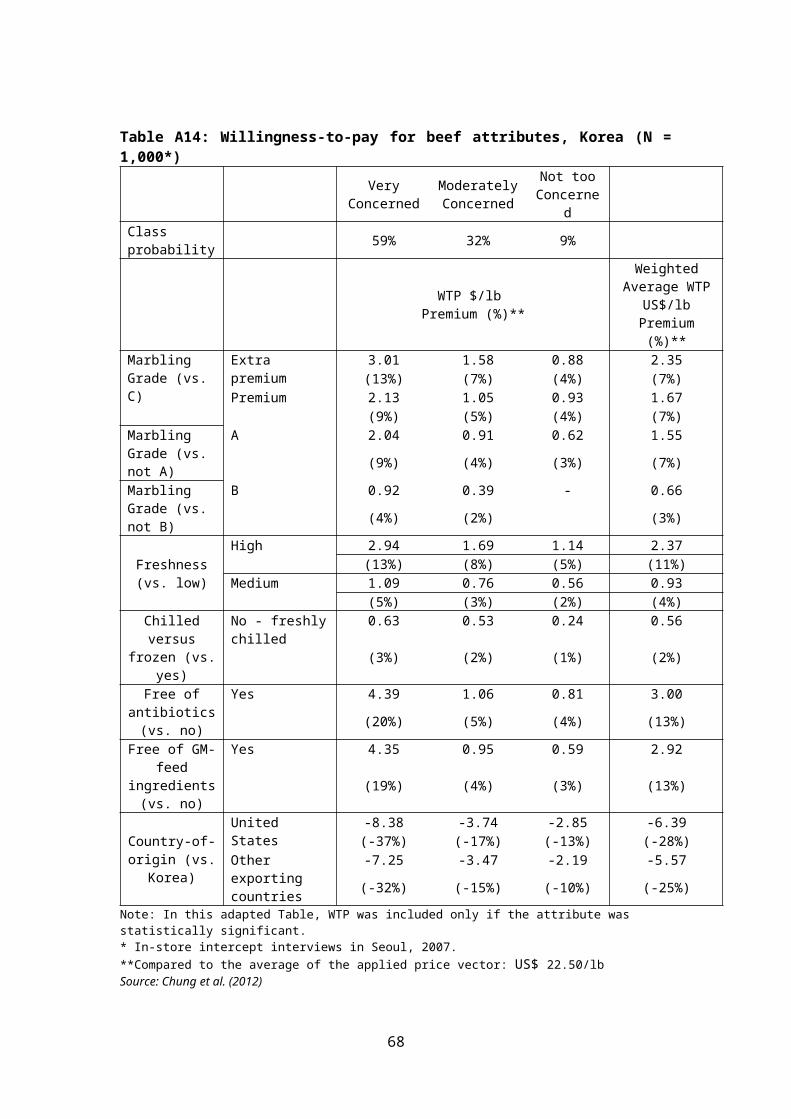
Table A41: Willingness-to-pay for chicken attributes, UK (N = 449*) Consumer type Nano treatment
(n = 225)Non-nano treatment
(n = 224)
WTP (£/chicken)
Premium (%) **
WTP (£/chicken)
Premium (%)
**Food poisoning risk: Reduction from a baseline
Conventional -0.30 (-10%) -0.30 (-3%)Welfare-improved -0.59 (-20%) -0.52 (-5%)
Chicken welfare level (scale 0-100)
Conventional 0.09 (3%) 0.08 (1%)Welfare-improved 0.67 (22%) 0.51 (5%)
* Online survey, in 2010 ** Compared to average price (around £3/chicken).Source: Erdem (2015)
Lilavanichakul and Boecker (2013) explored consumers’ acceptance of and whether there is potential for a premium for a traceability technology in a ginseng product in Canada. This was explored amongst the trade-offs with the products origin and manufacturer attributes. In total 1,647 respondents completed the survey. As summarised in Table A42, the estimated WTP implied a 16 per cent premium of the base price ($2.78/bottle) for having an internal tag of traceability/quality assurance. However, this WTP was relatively lower than a Guarantee label or Canadian Ginseng product. The negative interaction term with a WTP of -$1.67/bottle for the simultaneous use of the ‘Canadian Guaranteed’ and ‘Product of Canada’ labels suggest that these two attributes could be seen as substitutes.
Table A42: Willingness-to-pay for ginseng product attributes, Canada (N = 1,647*)WTP ($/bottle
with 60 capsules)Premium
(%)**Internal tag (vs. no) Yes 2.78 (16%)Manufacturer (vs. Ontario Association of Ginseng Producers)
National Manufacturer Brand -2.34 (-14%)
Canadian Ginseng Guaranteed (vs. no) Yes 9.52 (56%)
Product of Canada (vs. no) Yes 5.74 (34%)Canadian Ginseng Guaranteed* Product of Canada -1.67 (-10%)
* Nationwide online survey** Compared to average of the applied price vector ($16.99/bottle) Source: Lilavanichakul and Boecker (2013)
In the third new-technology orientated CE, Yue et al. (2015) explored US consumer preferences for nano- and GM-food in the context of a rice product. The CE considered the possible benefits (e.g. better food safety), if any, these technologies could provide. The sample consisted of 1,117 consumers in United States. The data was analysed with the class based approach where four distinct consumer groups, based on their choices and characteristics (gender, income, education, race/ethnicity, and political and religious associations), were identified (see Table A42). Most respondents were in the “Benefit orientated group” with a likelihood of 40 per cent belonging into the group. Across all groups, new technologies had a negative WTP, varying between negative 2 and negative 89
68
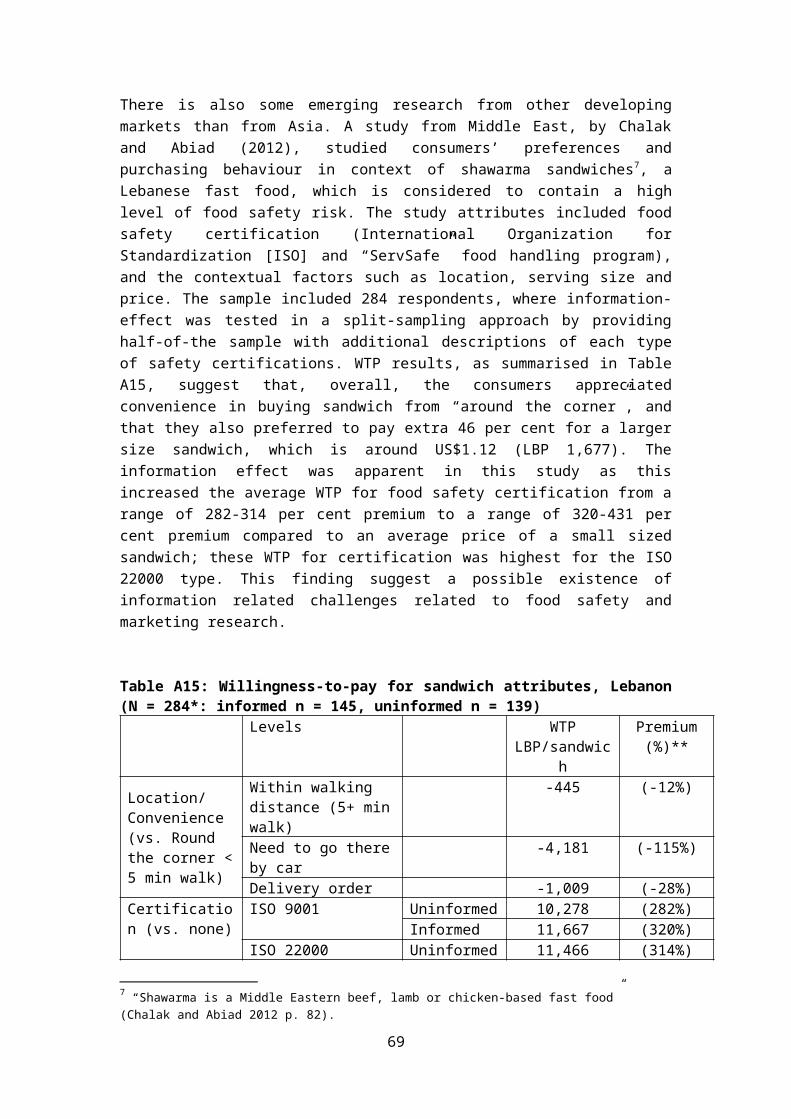
percent premium of the base price, thus the conventional production method was preferred. The most valued benefits vary across the consumer groups. The “price oriented” consumers were willing to pay most for the enhanced nutrients, about 10 per cent premium, and no extra for the improved taste or environmental impacts when compared to the no additional benefits. Other three groups were willing to pay most for the improved food safety, premiums between nine and 136 per cent were the “benefit orientated” consumers had the highest WTP. Thus, these results imply that consumers express highly heterogeneous preferences when distinguishes by their choices and consumer characteristics. While the new technologies had a negative WTP by consumers, the attached benefits were valued differently across the groups. Thus the consumer preferences towards nanotechnology can include a complex set of trade-offs.
Table A42: Willingness-to-pay for (a bag of) white rice attributes: The latent class approach, USA (N = 1,117*)
Class 1***Price
oriented
Class 2***Technology
averse
Class 3***
Benefitoriented
Class 4***New
technologyrejecters
Class probability 18% 17% 40% 25%WTP ($/lb)
premium (%)**Production technology (vs. conventional)
Nanotechnology -0.09 -0.70 -0.94 -3.39(-2%) (-16%) (-21%) (-77%)
GM -0.1 -0.78 -1.06 -3.9(-2%) (-18%) (-24%) (-89%)
Benefit from using the given technology (vs. no additional benefit)
Enhanced nutrition 0.42 0.21 5.16 0.56(10%) (5%) (118%) (13%)
Improved taste - 0.33 2.99 0.56(8%) (68%) (13%)
Improved food safety
0.22 0.39 5.96 1.10(5%) (9%) (136%) (25%)
Less harmful environmental impact during production
- - 4.08 0.37(93%) (8%)
Note: In this adapted Table, WTP was included only if the attribute was statistically significant.* Online survey, in 2013** Compared to average of the applied price vector ($$4.375/lb) ***Statistically significant class determinants: Class 1 reference group; Class 2 Gender; Class 3 Education, Gender, Income, Religion, Politics; Class 4 Gender, ReligionSource: Yue et al. (2015)
A.2 SUMMARYIn conclusion, this review included 39 CE studies regards to food and beverage choices, and associated credence attributes, across the world from years 2010 to 2016. This complements the Miller et al. (2014) review with over 30 international studies. Most of the reviewed studies here were about meat and seafood choices while dairy, fruit & vegetable and wine categories, included between three and four studies each. Another ten studies were reviewed in other product contexts (e.g., coffee and chocolate) or food products adopting
69
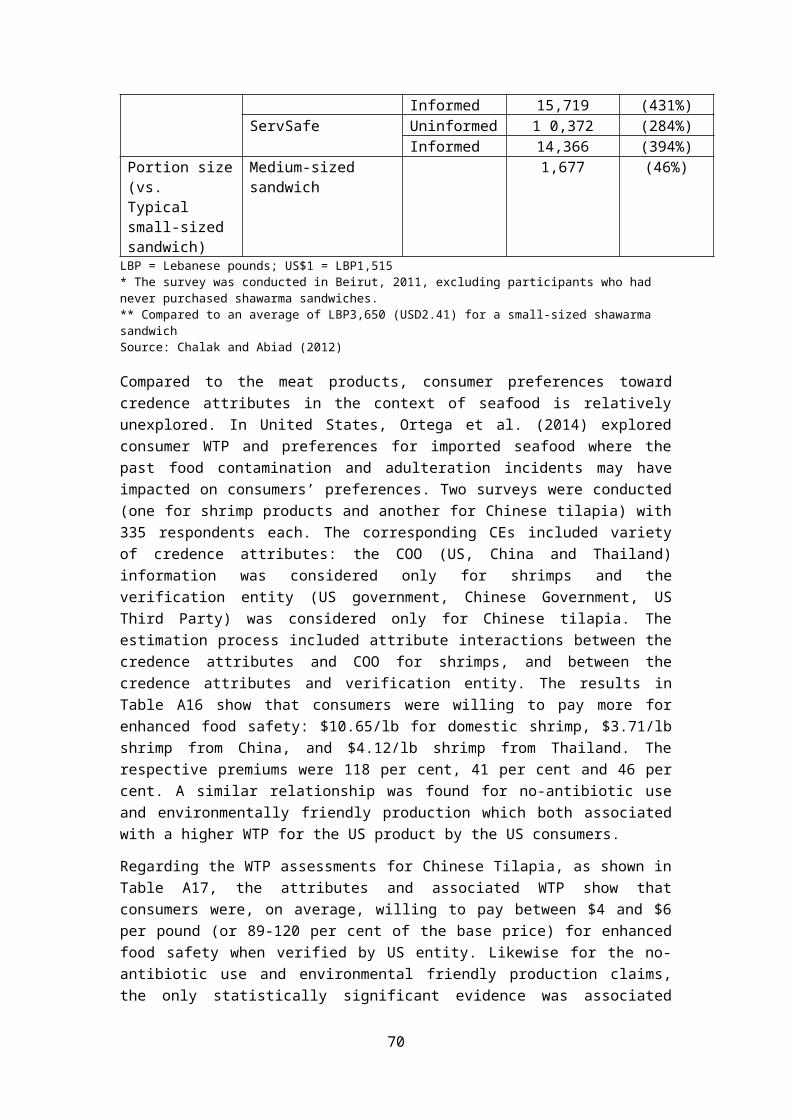
new technology to communicate food safety or traceability. Most studies were interested in the consumer preferences, typically targeting regular purchasers of the type of product; although one study included a comparison between food retailers and food consumers about their preferences towards use of organic ingredients (Probst et al. 2012).
Overall, these findings complement those from Miller et al. (2014). Firstly, people were willing to pay higher premiums for a presence or improvement on various credence attribute in products.
70

Appendix A: References
Akaichi, F., de Grauw, S. and Darmon, P. (2015). Are Fair Trade, carbon footprint and organic attributes competing? Some evidences from Scotland, Netherland and France. Paper presented at the International Association of Agricultural Economists Conference, August 9-14, 2015, Milan, Italy. Retrieved from http://purl.umn.edu/210940
Aprile, M.C., Caputo, V. and Nayga Jr., R.N. (2012). Consumers' valuation of food quality labels: the case of the European geographic indication and organic farming labels. International Journal of Consumer Studies, 36(2), 158-165. DOI: 10.1111/j.1470-6431.2011.01092.x
Arnoult, M., Lobb, A., and Tiffin, R. (2010) Willingness to Pay for Imported and Seasonal Foods: A UK Survey. Journal of International Food & Agribusiness Marketing, 22(3-4), 234-251, DOI: 10.1080/08974431003641331
Bechtold, K.-B. and Abdulai, A. (2014). Combining attitudinal statements with choice experiments to analyse preference heterogeneity for functional dairy products. Food Policy, 47, 97-106. http://dx.doi.org/10.1016/j.foodpol.2014.05.007
Carlsson, F., Frykblom, P., and Lagerkvist, C.J. (2005). Consumer preferences for food product quality attributes from Swedish agriculture. AMBIO: A Journal of the Human Environment 34(4): 366-370.
Chalak, A. and Abiad, M. (2012). How effective is information provision in shaping food safety related purchasing decisions? Evidence from a choice experiment in Lebanon. Food Quality and Preference, 26(1), 81-92. doi:10.1016/j.foodqual.2012.04.001
Chung, C, Briggeman, BC, Han, S. 2012. Willingness-to-pay for beef quality attributes: A latent segmentation analysis of Korean grocery shoppers. Journal of Agricultural and Applied Economics 44(4): 447-459.
Cicia, G, Cembalo, L, Del Giudice, T, Scarpa, R. 2013. Country-of-Origin Effects on Russian Wine Consumers. Journal of Food Products Marketing 19(4): 247-260.
Cosmina, M., Gallenti, G., Marangon, F. and Troiano, S. (2015). Attitudes towards honey among Italian consumers: A choice experiment approach. Paper prepared for presentation at the EAAE-AAEA Joint Seminar ‘Consumer Behavior in a Changing World: Food, Culture, Society” March 25 to 27, 2015 Naples, Italy. Retrieved from http://ageconsearch.umn.edu/bitstream/202733/2/199.pdf
de-Magistris, T. and Gracia, A. (2014). Do consumers care about organic and distance labels? An empirical analysis in Spain. International Journal of Consumer Studies, 38(6), 660-669. DOI: 10.1111/ijcs.12138
Denver, S. and Jensen, J.D. (2014). Consumer preferences for organically and locally produced apples. Food Quality and Preference, 31: 129-134. tp://dx.doi.org/10.1016/j.foodqual.2013.08.014
71

Ding, Y., Veeman, M.M. and Adamowicz, W.L. (2015). Functional food choices: Impacts of trust and health control beliefs on Canadian consumers’ choices of canola oil. Food Policy, 52, 92-98.
Erdem, S. (2015). Consumers’ Preferences for Nanotechnology in Food Packaging: ADiscrete Choice Experiment. Journal of Agricultural Economics, Vol. 66, No. 2, 259–279. doi: 10.1111/1477-9552.12088
Fenger, M.H.J., Aschemann-Witzel, J., Hansen, F. and Grunert, K.G. (2015). Delicious words – Assessing the impact of short storytelling messages on consumer preferences for variations of a new processed meat product. Food Quality and Preference, 41, 237-244. doi:10.1016/j.foodqual.2014.11.016
Gracia, A. (2014). Consumers’ preferences for a local food product: A real choice experiment. Empir Econ, 47, 111-128. DOI 10.1007/s00181-013-0738-x
Hanley, N., Shogren, J.F. and White, B. (2013). Introduction to environmental economics. Oxford: Oxford University Press.
Hensher, D.A., Rose, J.M. and Greene, W.H. (2015). Applied choice analysis (2nd Ed.). Cambridge University Press: UK.
Kallas, Z., Borrisser-Pairó, F., Martínez, B., Vieira, C., Rubio, B., Panella, N., …, Gil, J.M. (2015). The impact of the sensory experience on scale and preference heterogeneity: The GMNL model approach applied to pig castration and meat quality. Paper prepared for presentation at the EAAE-AAEA Joint Seminar ‘Consumer Behavior in a Changing World: Food, Culture, Society. March 25-27, Naples, Italy. Retrieved from http://ageconsearch.umn.edu/bitstream/202708/2/126.pdf
Kallas, Z., Escobar, C. and Gil, J.M. (2013). Analysis of consumers’ preferences for a special-occasion red wine: A dual response choice experiment approach. Food Quality and Preference, 30(2), 156-168. doi:10.1016/j.foodqual.2013.05.008
Lagerkvist, C.J., Berthelsen, T., Sundström, K. and Johansson, H. (2014).Country of origin or EU/non-EU labelling of beef? Comparing structural reliability and validity of discrete choice experiments for measurement of consumer preferences for origin and extrinsic quality cues. Food Quality and Preference, 34, 50-61. http://dx.doi.org/10.1016/j.foodqual.2013.12.009
Lilavanichakul, A. and Boecker, A. (2013). Consumer Acceptance of a New Traceability Technology:A Discrete Choice Application to Ontario Ginseng. International Food and Agribusiness Management Review, 16(4), 25-50.
Lim, K.H., Hu, W., Maynard, L.J. and Goddard, E. (2014). A taste for safer beef? How much does consumers’ perceived risk influence willingness to pay for country-of-origin labeled beef. Agribusiness 30(1): 17-30. DOI: 10.1002/agr.21365
Miller, S., Driver, T., Velasquez, N., and Saunders, C. (2014). Maximising Export Returns (MER): Consumer behaviour and trends for credence attributes in key markets and a review of how these may be communicated. AERU Research Report No. 332. Lincoln University, New Zealand.
72
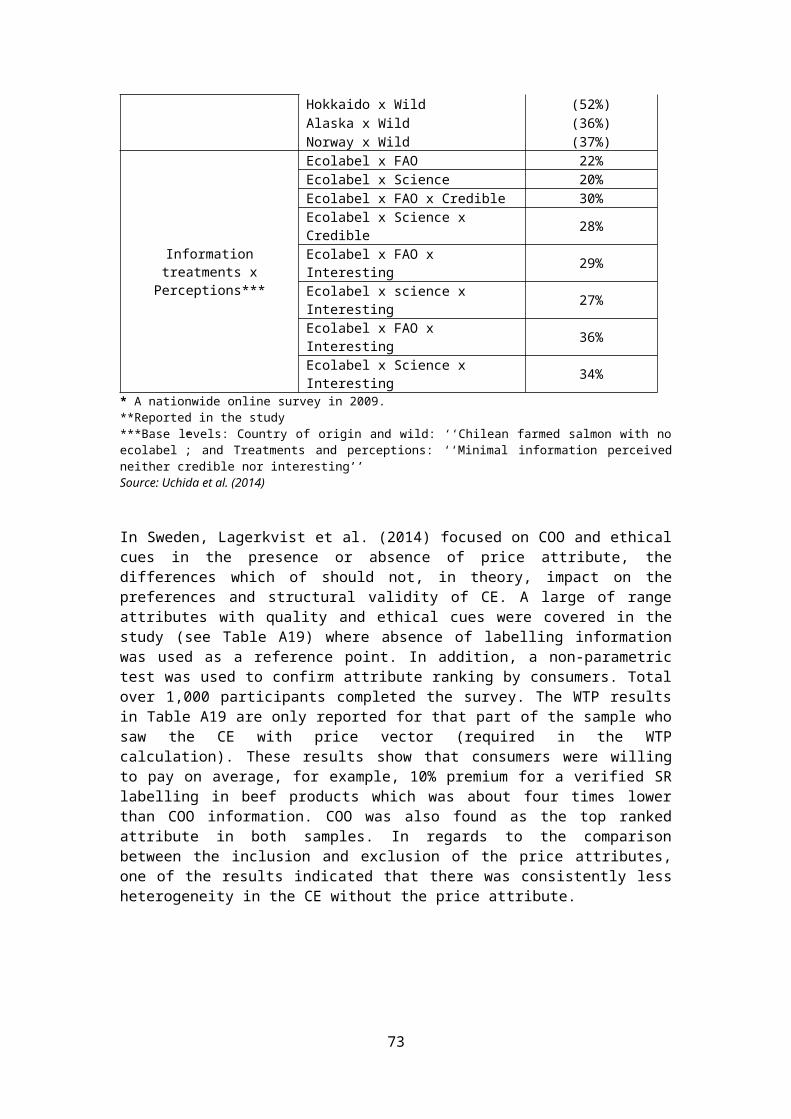
Mueller Loose, S. and Remaud, H. (2013). Impact of corporate social responsibility claims on consumer food choice: A cross-cultural comparison. British Food Journal, Vol. 115(1), 142-166. http://dx.doi.org/10.1108/00070701311289920
O’Brien, K.A. and Teisl, M.F. (2004). Eco-information and its effect on consumer values for environmentally certified forest products. Journal of Forest Economics, 10: 75-96. http://dx.doi.org/10.1016/j.jfe.2004.05.001
Ortega, D.L., Wang, H.H., Wu, L., and Hong, S.J. (2015). Retail channel and consumer demand for food quality in China. China Economic Review 36: 359-366. DOI: http://dx.doi.org/10.1016/j.chieco.2015.04.005
Ortega, D.L., Wang, H.H. and Olynk Widmar, N.J. (2014). Aquaculture imports from Asia: an analysis of U.S. consumer demand for select food quality attributes. Agricultural Economics, 45(5), 625-634. DOI: 10.1111/agec.12111
Poelmans, E. and Rousseau, S. (2016). How do chocolate lovers balance taste and ethical considerations? British Food Journal 118(2): 343-361. DOI: http://dx.doi.org/10.1108/BFJ-06-2015-0208
Probst, L., Houedjofonon, E., Ayerakwa, H.M. and Haas, R. (2012). Will they buy it? The potential for marketing organic vegetables in the food vending sector to strengthen vegetable safety: A choice experiment study in three West African cities. Food Policy, 37(3), 296-308. doi:10.1016/j.foodpol.2012.02.014
Saunders, C., Guenther, M., Tait, P. and Saunders, J. (2013). Assessing consumer preferences and willingness to pay for NZ food attributes in China, India and the UK. Contributed Paper prepared for presentation at the 87th Annual Conference of the Agricultural Economics Society, University of Warwick, United Kingdom.
Tait, P., Saunders, C., Guenther, M. and Rutherford, P. (2016). Emerging versus developed economy consumer willingness to pay for environmentally sustainable food production: A choice experiment approach comparing Indian, Chinese and United Kingdom lamb consumers. Journal of Cleaner Production, 124, 65-72. http://dx.doi.org/10.1016/j.jclepro.2016.02.088
Teratanavat, R., and Hooker, N.H. (2006). Consumer valuations and preference heterogeneity for a novel functional food. Food Science 71(7): S533–S541. DOI: 10.1111/j.1750-3841.2006.00120.x
Ubilava, D., Foster, K.A., Lusk, J.L. and Nilsson, T. (2011). Differences in consumer preferences when facing branded versus non-branded choices. Journal of Consumer Behaviour, 10(2), 61-70.
Uchida, H., Onozaka, Y., Morita, T. and Managi, S. (2014). Demand for ecolabeled seafood in the Japanese market: A conjoint analysis of the impact of information and interaction with other labels. Food Policy, 44, 68–76. http://dx.doi.org/10.1016/j.foodpol.2013.10.002
Van Loo, E.J., Caputo, V., Nayga Jr., R.M., Meullenet, J.-F. and Ricke, S.C. (2011). Consumers’ willingness to pay for organic chicken breast: Evidence from choice experiment. Food Quality and Preference, 22(7), 603-613. doi:10.1016/j.foodqual.2011.02.003
73

Van Loo, E.J., Caputo, V., Nayga Jr., R.M., Seo, H.-S., Baoyue Zhang, B. and Verbeke, W. (2015). Sustainability labels on coffee: Consumer preferences, willingness-to-pay and visual attention to attributes. Ecological Economics, 118, 215-225. doi:10.1016/j.ecolecon.2015.07.011
Van Loo, E.J., Caputo, V., Nayga Jr., R.M. and Verbeke, W. (2014). Consumers’ valuation of sustainability labels on meat. Food Policy, 49, 137-150. DOI: http://dx.doi.org/10.1016/j.foodpol.2014.07.002
Van Wezemael, L., Caputo, V., Nayga Jr, R.M., Chryssochoidis, G. and Verbeke, W. (2014). European consumer preferences for beef with nutrition and health claims: A multi-country investigation using discrete choice experiments. Food Policy 44: 167-176. DOI: http://dx.doi.org/10.1016/j.foodpol.2013.11.006
Viegas, I., Nunes, L.C., Madureira, L., Fontes, M.A. and Santos, J.M. (2014). Beef Credence Attributes: Implications of Substitution Effects on Consumers’ WTP. Journal of Agricultural Economics, 65(3), 600-615. DOI: 10.1111/1477-9552.12067
Vlaeminck, P., Vandoren, J. and Vranken, L. (2016). Consumers’ willingness to pay for Fair Trade chocolate. In The Economics of Chocolate by M.P. Squicciarini and J. Swinnen (Eds.) pp. 180-191. Oxford, UK: Oxford University Press.
Wongprawmas, R., Canavari, M. and Waisarayutt, C. (2014). Are Thai consumers willing to pay for food safety labels? Choice experiment on fresh produce. Paper prepared for presentation at the EAAE 2014 Congress ‘Agri-Food and Rural Innovations for Healthier Societies’ August 26 to 29, 2014 Ljubljana, Slovenia. http://purl.umn.edu/182739
Wu, L., Yin, S., Xu, Y. and Zhu, D. (2014). Effectiveness of China’s organic food certification policy: Consumer preferences for infant milk formula with different organic certification labels. Canadian Journal of Agricultural Economics 62(4): 545-568. DOI: 10.1111/cjag.12050
Wu, L., Wang, S., Zhu, D., Hu, W. and Wang, H. (2015). Chinese consumers’ preferences and willingness to pay for traceable food quality and safety attributes: The case of pork. China Economic Review, 35, 121-136. doi:10.1016/j.chieco.2015.07.001
Yue, C., Zhao, S. and Kuzma, J. (2015). Heterogeneous Consumer preferences for nanotechnology and genetic-modification technology in food products. Journal of Agricultural Economics, 66(2), 308–328. DOI: 10.1111/1477-9552.12090
Zanoli, R., Scarpa, R., Napolitano, F., Piasentier, E. Naspetti, S. and Bruschi, V. (2013). Organic label as an identifier of environmentally related quality: A consumer choice experiment on beef in Italy. Renewable Agriculture and Food Systems, 28(1), 70-79. doi:10.1017/S1742170512000026
Zhang, C., Bai, J. and Wahl, T.I. (2012). Consumers' willingness to pay for traceable pork, milk, and cooking oil in Nanjing, China. Food Control, 27(1): 21-28. doi:10.1016/j.foodcont.2012.03.00
74

Zou, N.-N. and Hobbs, J.E. (2010). The role of labelling in consumers’ functional food choices. Paper prepared for presentation at the 1st Joint EAAE/AAEA Seminar “The Economics of Food, Food Choice and Health” Freising, Germany, September 15 – 17, 2010.
75
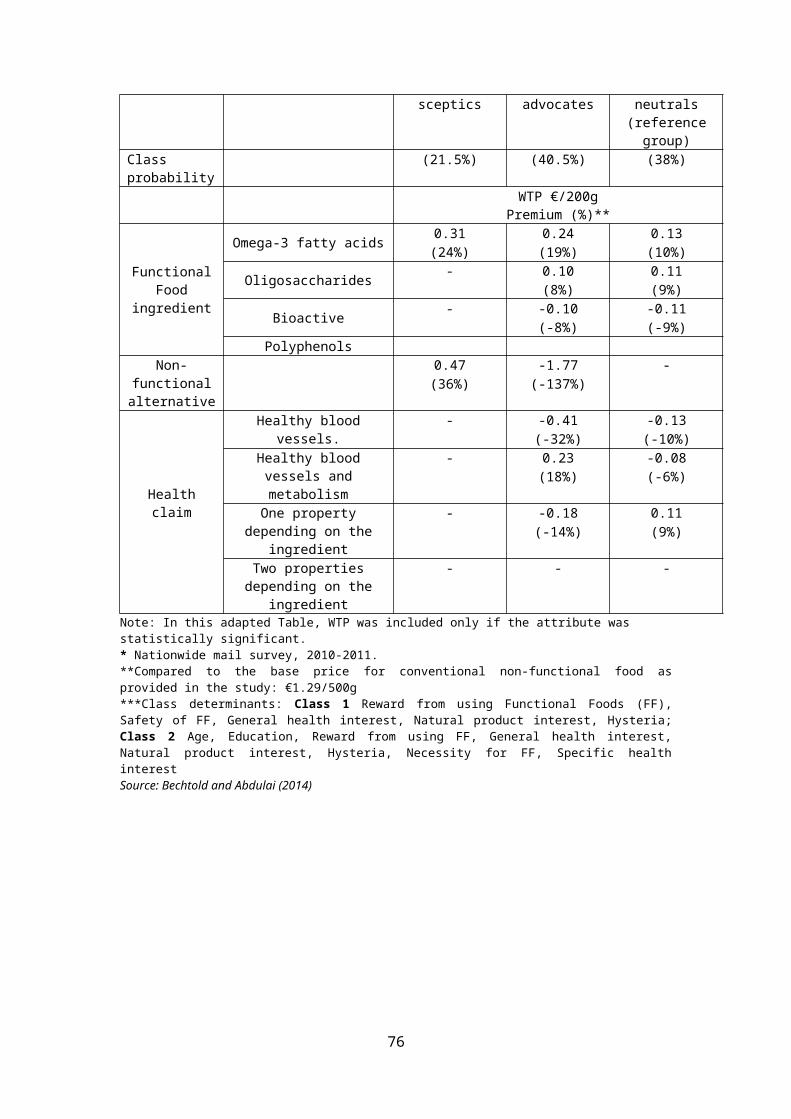
Appendix B: LTEM Framework
76

The LTEM framework generally includes six behavioural equations and one economic
identity for each commodity in each country. These behavioural equations are:
domestic supply, domestic demand, domestic stocks, domestic producer and
consumer price functions and the trade price equation. The net trade equation is the
central economic identity which is equal to excess supply or demand in the domestic
economy. Variation exists for commodities based on the levels of disaggregation. For
some commodities, the number of behavioural equations may change as total
demand is disaggregated into food, feed, and processing industry demand which is
determined endogenously (Saunders et al., 2006b; Cagatay & Saunders 2003;
Saunders et al., 2004).
In the LTEM, global agricultural markets are assumed perfectly competitive. Supply
and demand equations are defined as constant elasticity functions that incorporate
both the own and cross-price effects. As shown in Equation 1 for commodity (i) and
country (j) domestic supply is specified as a function of the supply shifter (ssft ij), a
policy variable (Z) and producer prices of the own (pp ij) and other substitute and
complementary commodities (ppkj) (Cagatay & Saunders, 2003; Saunders et al.,
2004).
qsij = f(ssftij, Zj, ppij, ppkj) (1)
Domestic demand (qdij) is defined as a function of the demand shifter (dsft ij),
consumer prices of the own (pcij) and other substitute and complementary
commodities (pckj), and per capita real income (popj/GDPj), see Equation 2.
qdij = g(dsftij, pcij, pckj, popj/GDPj) (2)
77
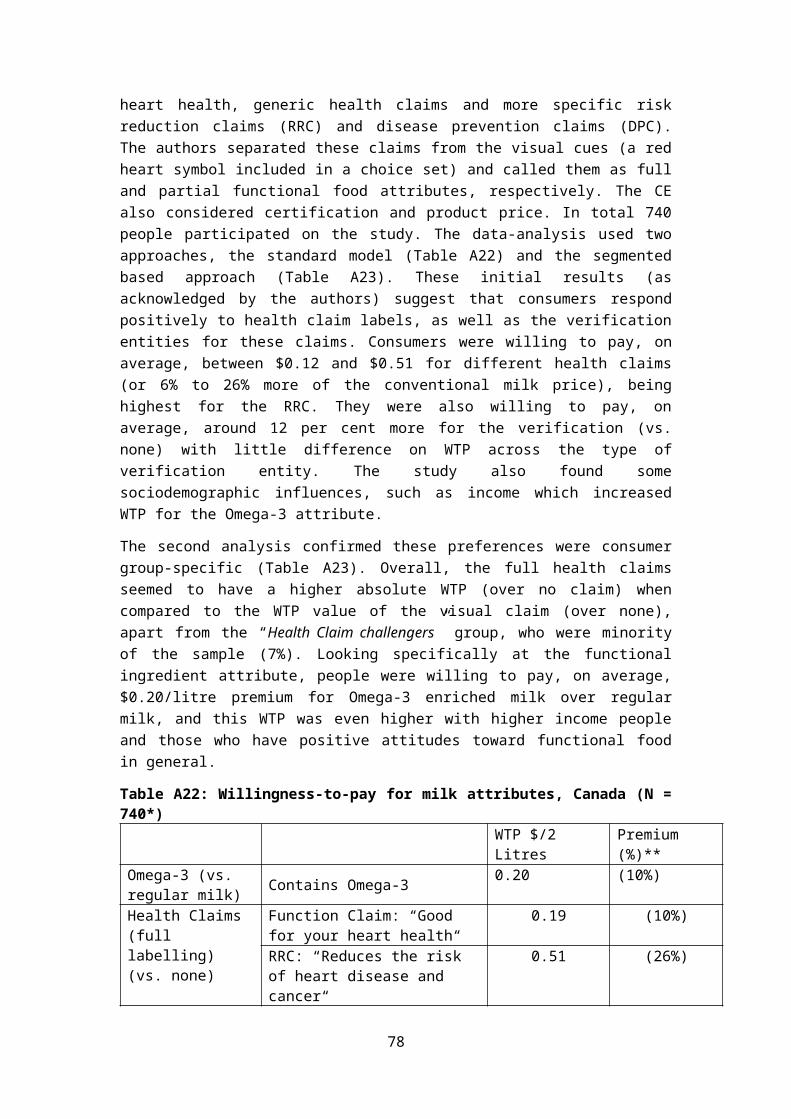
The trade price (pt) of a commodity (i) in a country (j) is determined by the world
market price (WDpti) for that commodity and the exchange rate (ex j), as shown in
Equation 3. The total effect of world market price on trade price of the country is
determined by the price transmission elasticity. Domestic producer (pp ij) and
consumer prices (pcij) are specified as functions of trade price (pt) of a related
commodity (i) and commodity specific production and consumption related
domestic support/subsidy policies, (Zsj, Zdj), which represents the price wedge, see
Equations 4 and 5 (Cagatay & Saunders, 2003; Saunders et al., 2004).
ptij = h(WDpti, exj) (3)
ppij = l(ptij, Zsj) (4)
pcij = m(ptij, Zdj) (5)
In the model, stocks (qstijt=0) are determined as the product of stocks from the
previous year (qstijt-1) and the quantity supplied (qsij) minus the quantity demanded
(qdij) of the commodity (i), as shown in Equation 6. Net trade (qt) of a commodity (i)
in country (j) is determined as the difference between domestic supply and the sum
of domestic demand and stock changes in the related year, see Equation 7. The
LTEM is a synthetic model since the parameters are taken from the literature
(Saunders et al., 2004).
qstijt=0 = qstij
t-1(qsij – qdij) (6)
qtij = qsij– qdij – ∆qstij (7)
For dairy trade, raw milk is not traded because it is assumed to be completely used
in the production of the other dairy products, and the supply of liquid milk is
assumed to be used in domestic consumption. Commodity supply and demand
equations are parameterised to reproduce 2008 base data for each country’s price,
supply, demand and trade. When consumption and production shifts or consumer
and producer support wedges are altered, the model recalculates domestic supply
and demand and re-balances world trade, production, consumption and prices.
78

Prices and quantities observed in the base period can then be compared to the new
values that emerge from the model (Cagatay & Saunders, 2003; Wijegunawardane,
2002).
79
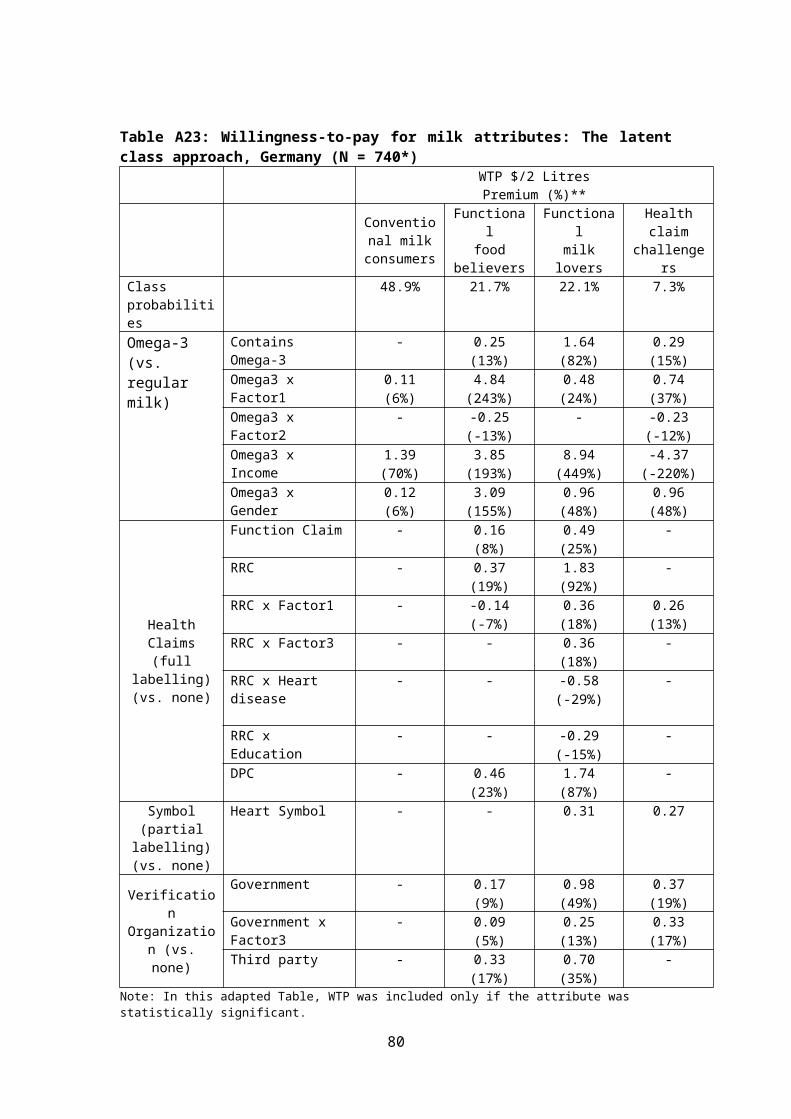
Appendix C: The Drivers DocumentThe Drivers Document, which outlines the 30 drivers for land use change and associated evidence for the Drivers Project, can be accessed here. This document contains a list of the 30 drivers identified in this stage of the project, on both an international and domestic level, with hyperlinks to the relevant literature included.
A full list of drivers, including the total number of international and domestic sources, is summarised in Table C1 below.
Table C1. Outline of Drivers evidence base drivers and associated literature
Driver International source(s) Domestic source(s)Agricultural and trade policy 25 16
Air quality 10 2Animal health & welfare 29 10
Authentication/Traceability 18 3Biodiversity 24 10Biosecurity 16 4
Brand 20 8Chemical residues 12 12
Climate change 24 5Country-of-origin 48 6
Cultural values 14 9Demographics 25 0
Environmental condition 43 18Extreme weather events 14 5Family and community 6 4
Food safety 41 4Functional food 13 4GHG emissions 38 22
GM and nanotechnology 27 10Local foods/Food miles 25 7
Organic production 39 4Pasture-based production 14 0
Product quality 9 1Religion 17 1
Social responsibility and fair trade 17 7
Soil quality 23 8Sustainable supply 35 15
Waste/recycling 14 11Water footprinting/use 12 12
Water quality 11 11
80
Appendix D: Survey Methodology (Extended)
A questionnaire was developed for online survey deployment (via SurveyMonkey) to 56 experts across the primary sector within New Zealand. Experts were selected based on either their seniority, or being known to have an over-arching knowledge of market factors. This criteria was used to ensure those responding were most likely to have the critical knowledge required to provide a high-level interpretation of trends and macro-environmental drivers in the primary land use system.
The questionnaire was designed to address the following aspects for the matrix programme:o Top issues impacting on primary sector exportso Limitations to primary production and tradeo Emerging trade opportunitieso Lessons from the past.
These four qualitative, open-ended comment questions were based on the strategic thinking and scenario technique devised by van der Heijden11 known as the ‘seven questions’ to identify uncertainties, legacies and constraints in the system.In addition, the survey asked the respondents to score each of 40 pre-identified matrix drivers on the basis of ‘High, Medium or Low’ based on perceived impact on New Zealand’s land use practice over the coming decade. The scores were weighted 5 for high; 3 for medium, and 1 for low, for each respondent, and weighted averages derived for each of the 40 drivers.The survey also asked respondents to indicate their knowledge of major trading regions; and which land-based sector they represented.
Following these quantitative results for each driver, a revised matrix with weighted averages was derived using the same scoring system of high=5, medium = 3 and low= 1, for the scores given at the workshop, across the various market regions. The combined weighted average for each driver was then derived from the average of workshop and survey response, and the issues ranked according to the weighted average score.
ResultsThe survey returned 18 useful responses (response rate of 32%). The respondents came from the following sectors:
Sector Number of respondentsMeat 2Wool 0Dairy 4Viticulture 0Horticulture 1Forestry 3Govt 2Arable 1Other 5
11 van der Heijden, K. 1996. “Scenarios: The art of the strategic conversation”. John Wiley and Sons: Chichester. 305pp. (pages 146-147.)
81
Qualitative results
The main issues that respondents saw as impacting on primary exports revolved around three main areas (see ppt):
o The ability to remain cost-competitive, particularly given international pressure from increasing low-cost producers in commodity markets
o The impact of disruptive technologies and increasing automation in the food sector
o The NZ brand and retaining customer confidence in the NZ production quality and provenance.
In addition, issues that surrounded sustainable intensification; our freedom to operate/ licence to operate; changing global market expectations and the impacts from government policy also featured highly.
The major limiting factors to primary trade appeared to revolve around:o Leadership – both within industry/sector, and also a lack of willingness to
co-ordinate efforts between different sectors to increase the NZ brand story or to jointly access and exploit key trading markets/ opportunities. Government leadership was also mentioned, investment in R&D and monetary policy around exchange rate.
o Commodity mentality – not breaking this paradigm and thinking of ways to add value beyond the silo-ed sectoral model.
o Lack of domestic scale
Main trade opportunities that we need to be focussing on:o Producing quality offerings (added value rather than commodity) for the
discerning middle class emerging economies; and wealthy Western consumers – using our brand story. Some saw this as particularly the niche and high-value products.
o Diversification from reliance on China Both these aspects are talking about a more diversified portfolio from our natural
resources – both in terms of product range; and also in terms of the number of markets we serve.
The ‘lesson’ from the past was very varied – nearly every respondent had a different lesson…
Quantitative results – see matrix spreadsheet
The weighted averages ranged from 4.50 (Advanced technologies) through to 1.34 (Religion). There was good consistency in thought and rating between the workshop and survey participants, despite very different soliciting approaches to get their opinions as to ranking for the matrix. Issues where these did not agree (greater than a one point difference in weighted average between the two groups) included:
Food safety Health and safety GM and nanotechnology Family and community values Country of origin Biosecurity Condition of the environment Water quality
82

Soil quality Waste/recycling Cultural values
These aspects should be investigated in more detail in the second Matrix iteration
83