introduction of a new transport service on the finnish market
TRANSCRIPT

Förnamn Efternamn
Introduction of a New Transport Service on the
Finnish Market
Dejie Qi
Examensarbete / Degree Thesis
Utbildningsprogram / Degree Programme
20XX
Degree Thesis
International Business
2011

2
DEGREE THESIS Arcada Degree Programme: International Business Identification number: 10486 Author: Dejie Qi Title: Introduction of a New Transport Service on Finnish Market
Supervisor (Arcada): Sveinn Eldon Commissioned by: Abstract: The aim of the thesis was to identify whether there would be a market for new personal transport service in the Capital region of Finland (Helsinki, Espoo, Vantaa and Kauniai-nen). The service is a driver-rental service that resembles taxi service with the difference being that the customer is driven to his destination in his own car. Research questions were: is the service feasible in Finland and is there a market for it in the Capital region of Finland? To answer these questions the author used literature and electronic sources re-view, Porter’s Five Forces Model, SWOT analysis and a survey to conclude that the ser-vice would indeed be feasible in Finnish Capital region. The thesis was limited in geo-graphic scope to Capital region of Finland, in scope of the analyses done it was limited to strategic analyses and preliminary marketing survey. The results of the strategic analyses show that the prospective market for the service would be a small niche with strong com-petition of substitute services, strong suppliers, strong competition within the industry and moderately strong customers. Should a new entrepreneur enter the market it would face prospect of more threats than opportunities on the market. Survey results show that there is high acceptance level for the service and that the preferred price level of the ser-vice should be below the taxi service prices and prices charged by public transport opera-tors. Keywords: Porter’s Five Forces Model, Market Introduction, Personal
Transport, Strategic Analysis, Finland, Taxi
Number of pages: 52 Language: English Date of acceptance: 31.01.2011

3
CONTENTS
1 Introduction ...................................... .................................................................... 6
1.1 Background ................................................................................................................... 7
1.2 Research Aim ................................................................................................................ 7
1.3 Thesis Structure ............................................................................................................ 8
1.4 Scope and Limitations of the Thesis ............................................................................. 9
1.5 Research Method ........................................................................................................ 10
2 Theoretical Framework ............................. ......................................................... 11
2.1 Porter’s Five Competitive Forces Model ..................................................................... 11
2.1.1 Threat of Entry (of New Competitors) .................................................................. 12
2.1.2 (Bargaining) Power of Suppliers .......................................................................... 13
2.1.3 (Bargaining) Power of Buyers ............................................................................. 14
2.1.4 (Threat of) Substitute Products ........................................................................... 15
2.1.5 Jockeying for Position (Competitive Rivalry) ....................................................... 16
2.1.6 Porter’s Five Forces Model – Conclusion............................................................ 17
2.2 Strengths, Weaknesses, Opportunities, Threats (SWOT) Analysis ............................ 17
2.2.1 Strengths ............................................................................................................. 18
2.2.2 Weaknesses ........................................................................................................ 19
2.2.3 Opportunities ....................................................................................................... 19
2.2.4 Threats ................................................................................................................ 20
2.2.5 SWOT Analysis – Conclusion ............................................................................. 21
2.3 Description of Service S .............................................................................................. 21
2.4 Characteristics of the Market ....................................................................................... 24
3 Analytical Section ................................ .............................................................. 27
3.1 Porter’s Five Forces Analysis ...................................................................................... 27
3.1.1 Threat of Entry of New Competitors .................................................................... 27
3.1.2 The Intensity of Competitive Rivalry .................................................................... 28
3.1.3 The Bargaining Power of Customers .................................................................. 30
3.1.4 Threat of Substitute Products or Services ........................................................... 31
3.1.5 The Bargaining Power of Suppliers ..................................................................... 32
3.1.6 Porter’s Five Forces Model – Conclusion............................................................ 33
3.2 SWOT Analysis ........................................................................................................... 34
3.2.1 Strengths ............................................................................................................. 34
3.2.2 Weaknesses ........................................................................................................ 35
3.2.3 Opportunities ....................................................................................................... 36
3.2.4 Threats ................................................................................................................ 37
4
3.2.5 SWOT Analysis - Conclusion .............................................................................. 38
4 Primary data analysis ............................. ........................................................... 40
4.1 Questionnaire – Basic Facts and Limitations .............................................................. 40
4.2 Analysis of the Questionnaire ...................................................................................... 41
4.2.1 Characteristics of the Respondents .................................................................... 41
4.2.2 Acceptance of the Service by Different Traits ..................................................... 42
4.2.3 Proposed Price Level .......................................................................................... 46
4.3 Questionnaire – Conclusions ...................................................................................... 50
5 Discussion ........................................ ................................................................. 51
5.1 Conclusion ................................................................................................................... 51
5.2 Suggestions for Further Research .............................................................................. 52
References ........................................ ........................................................................ 53
Appendices ........................................ ....................................................................... 55

5
Figures
Figure 1. Porter's five forces graphically represented .................................................... 11
Figure 2. Respondents by Age Groups ........................................................................... 41
Figure 3. Acceptance of the Service by Sex ................................................................... 42
Figure 4. Acceptance of the Service by Stance towards Alcohol ................................... 43
Figure 5. Acceptance of the Service by Age Group ....................................................... 43
Figure 6. Reasons for Not Using the Service ................................................................. 44
Figure 7. Reasons for Not Using the Service by Sex ..................................................... 45
Figure 8. Reasons for Not Using the Service by Age Group ......................................... 46
Figure 9. Proposed Price by Users ................................................................................. 47
Figure 10. Proposed Price by Age Groups ..................................................................... 48
Figure 11. Proposed Price by Stance towards Alcohol .................................................. 49
Figure 12. Proposed Price by Sex ................................................................................... 49
Tables
Table 1. Respondents by Age Groups ............................................................................ 41
Table 2. Proposed Price by Age Groups......................................................................... 47

6
1 INTRODUCTION
Finland, and more concretely its Capital region (Pääkaupunki seutu), has a very well
developed system of mass transport. The system, which is run by municipalities in the
area (Helsinki, Espoo, Vantaa, Kauniainen) and encompasses local rail (in German
speaking countries known as “S-bahn”), Helsinki metro, bus and ferry (to Suomenlinna
sea fortress) modes of transport, ranks regularly around 2nd spot in European survey for
best public transport conducted by the automotive clubs (Helsingin Sanomat 2010). Ac-
cordingly, the public transport system is very popular among its passengers – Europe’s
most satisfied public transport passengers live in Helsinki area (Helsinki Regional
Transport 2010). Other means of paid personal transport in the area are taxi services.
Taxi market in Finland is competitive and thriving, with high average level of service
quality (the cars used are usually mid- to upper class sedans, drivers are required to have
education on the field of personal transport (Länsi-Suomen Lääninhallitus 2010)). The
road network in the area is extensive and well maintained.
However, the frequency and amount of connections, which are served by the public
transport system, drops considerably during nights (only few busses and trains are in
operation during this time) (HSL 2010) and weekends. At these times, the taxis can
serve more customers requiring personal transport (especially during early morning
hours). Weekends and late night, early morning hours coincide with the time when the
most alcoholic beverages are consumed. Drunken driving is prohibited by the law and
inebriated customers have to look for alternative modes of transport home from the pub,
restaurant etc. Part is served by the public transport, part by the taxis, part will walk
home, part will be taken home by a sober friend/family member/acquaintance, and part
will use services of increasingly popular black taxi operators (Takala 2010) or by driv-
ing home under the influence of alcohol.

7
The last two modes of transport, which are used although they dangerous and in case of
drunken driving illegal, clearly show that there is an untapped demand for service which
is not currently offered by any of the traditional personal transport services. Currently
there are no services specifically aimed at customers who come to consume alcoholic
beverages with their vehicle and are in the need of transport afterwards. These custom-
ers could be served by service that would drive them back home in their own vehicle.
Analysis of possibility of launching of this kind of service (called service S in further
text) in the Capital region of Finland along with quantification of demand and evalua-
tion of risks connected with the launch and operation of this novel transportation service
are the main topics of this bachelor’s thesis.
1.1 Background
The author was told by a friend that in Prague (Czech Republic), there are services,
which allow renting a service of a driver to drive the customer to his destination in his
own car. According to him, there are several such a companies in operation, serving
mainly customers under the influence of alcohol. The author was interested in research-
ing whether such a service would be able to operate and be successful in conditions of
Finnish capital area given many similarities of the two areas. Both are inhabited by
1000000+ people (Wolfram Alpha 2010), both have similar GDP per capita (Cox 2009)
and both of the countries in which these capitals lie have similar culture when it comes
to consumption of alcoholic beverages. These similarities are the author thinks that sim-
ilar service might operate well in Finland and to her thinking on scientifically sound ba-
sis, she decided it to be the topic of her thesis.
1.2 Research Aim
This thesis was conducted for the purpose of investigation of possibility to run driver-
renting service in Finnish Capital region. The aim of the thesis was to analyze whether

8
such a business concept is sound within Finnish conditions and whether there is suffi-
cient demand for the service to warrant its realization. Secondary aim was to determine
size and structure of the market segment targeted by our service. In short, the aim of the
thesis is to find out whether a company offering service S would be a successful venture
or not. The author laid out following research questions:
Research question 1:
Is the service S feasible in Finland (from legal, strategic, operational point of view)?
Research question 2:
Is there demand for service S in the capital region of Finland?
(In other words, is service S feasible in Finland from economic point of view?)
With these questions, it was possible to create a thesis that would reflect the decision-
making and information gathering of a company deciding to launch a novel product on
an unknown market utilizing methods and knowledge acquired during author’s studies
at Arcada.
1.3 Thesis Structure
1. Introduction serves as a foundation of the thesis. Motivation, background and re-
search aim are presented here in detail. Structure of the thesis, its limitations and
methods used are described in this part as well.

9
2. Theoretical framework provides necessary theoretical background, shows key
concepts in the researched area. This part is based extensively on review of sec-
ondary material and it forms the foundation for analytical part of the thesis. The
analytical methods, their use, importance and validity of their results are de-
scribed here. Moreover, basic description of the service and the market on which
it is offered is included in this section.
3. Analytical section – comprises of application of analytical tools of strategic
management on the data collected from publicly available sources (mainly press
and Internet) and serves as a basis on which the results of the results section are
judged and decisions are drawn in the discussion section.
4. Primary data analysis section contains analysis of collected empiric data. This
part of the thesis represents marketing management point of view in the thesis.
5. Discussion section integrates results of both marketing research analysis and
strategic analyses and draws conclusions on research questions. Suggestions on
further research finalize the thesis.
1.4 Scope and Limitations of the Thesis
The scope of the thesis is geographically limited only to the Capital area of Finland
(which is with its concentration of customers and wealth the most attractive place where
to launch service S). References to other geographic areas are only included to provide
additional insight.
The thesis does not include a financial analysis of any kind. It is not intended as a busi-
ness plan, but as a kind of a “proof of concept” analysis, which takes place before actual
business plan is created. Thesis utilizes analyses used in strategic and marketing man-
agement. Other analytical approaches (financial management, operational management,
10
management of human resources) are therefore less accented. Due to the language bar-
rier, the amount of the information available to the author (who does not speak the local
language) is smaller than that available to the person speaking Finnish language. This
might influence accuracy of certain claims, however not the validity of the assertions
this work makes as a whole.
1.5 Research Method
Two research methods were used to find answers for the research questions: secondary
and primary research. Secondary research consisted from collecting and analyzing data
from bibliographic and electronic sources. This research method is used in chapters 2
and 3 of this thesis. Primary research is represented in this work by form of a question-
naire. Chapter four of this work is dedicated to analysis of the collected data from the
questionnaire.
Secondary material collected was twofold: part was dealing with the analytic methods
used to analyze the second batch of data, which was dealing with transport markets and
industries related to the market, and industry in which the service S will operate. While
data regarding analyses were obtained from bibliographic sources, most of the data con-
cerning the industry were obtained by direct observation and from electronic sources.
Questionnaire based survey was conducted on sample of 50 respondents in January
2011 in Helsinki and Espoo. Questionnaire was only used in paper form and it can be
found in its entirety in the appendices section of the thesis. There was only one version
used for all of the respondents. Questionnaire was only available in English version.
Questionnaire and its composition are directly related to the second research question
and based on the results of analyses conducted in chapter 3.
2 THEORETICAL FRAMEWOR
2.1 Porter’s Five Competitive Forces Model
Porter’s five forces model is an analytic tool developed by Professor Michael E. Porter
of Harvard Business School in 1979 to assess the profit potential of industries
Scholes and Whittington 2006
form of interaction of only the players in the same industry as a company, but includes
also other industries/sectors that affect the ori
Porter (1998 pp.22-23) recognizes five important competitive forces that shape the
industry and determine its structure:
1. Threat of entry (of new competitors)
2. Bargaining power of suppl
3. Bargaining power of customers
4. Threat of substitute products or services
5. Jockeying for position among current competitors (Competitive rivalry)
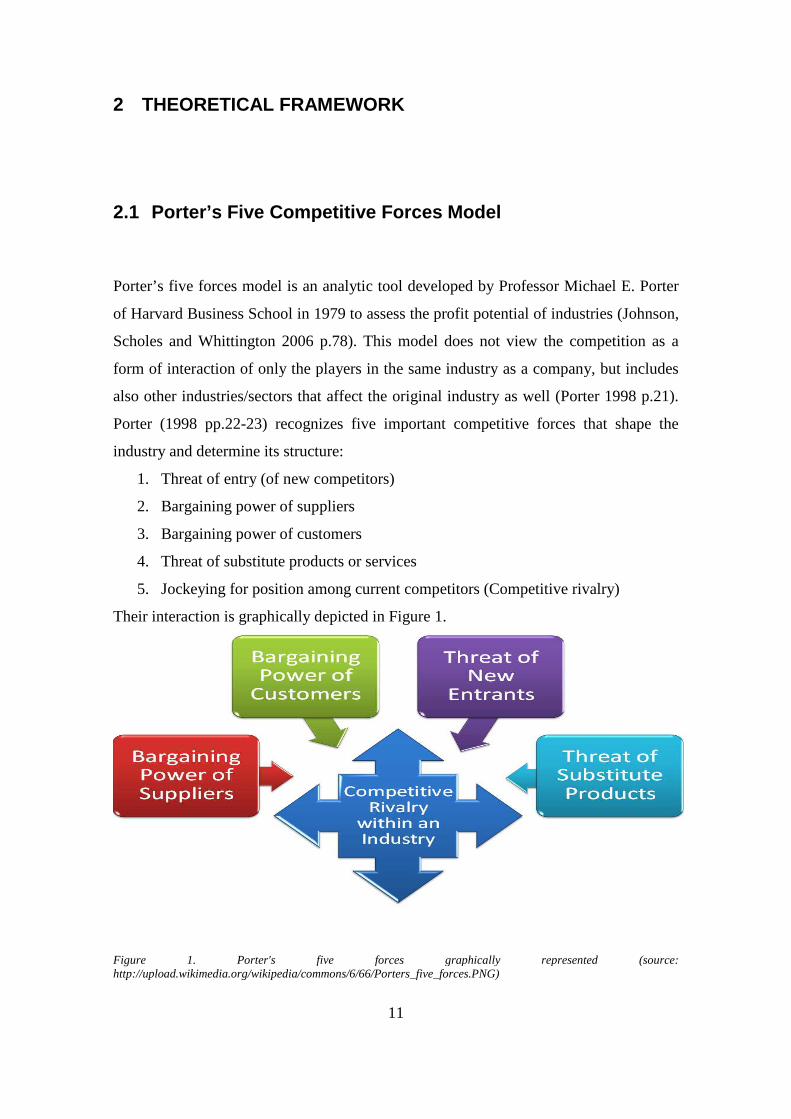
Their interaction is graphically depicted in Figure 1.
Figure 1. Porter's five fhttp://upload.wikimedia.org/wikipedia/commons/6/66/Porters_five_forces.PNG)
11
THEORETICAL FRAMEWOR K
Porter’s Five Competitive Forces Model
Porter’s five forces model is an analytic tool developed by Professor Michael E. Porter
ol in 1979 to assess the profit potential of industries
Scholes and Whittington 2006 p.78). This model does not view the competition as a
form of interaction of only the players in the same industry as a company, but includes
s/sectors that affect the original industry as well (Porter 1998
23) recognizes five important competitive forces that shape the
industry and determine its structure:
Threat of entry (of new competitors)
Bargaining power of suppliers
Bargaining power of customers
Threat of substitute products or services
Jockeying for position among current competitors (Competitive rivalry)
Their interaction is graphically depicted in Figure 1.
. Porter's five forces graphically represented (source: http://upload.wikimedia.org/wikipedia/commons/6/66/Porters_five_forces.PNG)
Porter’s five forces model is an analytic tool developed by Professor Michael E. Porter
ol in 1979 to assess the profit potential of industries (Johnson,
78). This model does not view the competition as a
form of interaction of only the players in the same industry as a company, but includes
ginal industry as well (Porter 1998 p.21).
23) recognizes five important competitive forces that shape the
Jockeying for position among current competitors (Competitive rivalry)
orces graphically represented (source:

12
The stronger the effects of these forces are, the more intense the competition in the ana-
lyzed industry. The more intense competition leads to lower profitability within the in-
dustry and to lower attractiveness of the industry as a whole for the outside investors.
The strongest force(s) are the most important for strategy formulation as they determine
the profitability of the industry the most. In different industries, different forces have the
greatest impact – e.g. in one industry, the customers might hold the most power, in other
it might be threat of substitute products that determines the intensity of the competition
within the industry. Which force(s) is the most important, is dependent on the structure,
economic and technical characteristics of the industry. (Porter 1998 pp.21-23)
2.1.1 Threat of Entry (of New Competitors)
The propensity of new competitors to enter the industry is dependent on the presence of
barriers to entry. New competitors have to overcome these in order to gain position in
the industry. They are usually not permanent and do not necessarily deter all the
potential competitors, but they delay their progress. (Johnson, Scholes and Whittington
2006 p.81)
Porter, 1998 recognizes these six major barriers to entry:
1. Economies of scale – if existing competitors in the industry can utilize
economies of scale, then they force any newcomer to enter the market in large
scale or accept a cost disadvantage (ibid). As economies of scale are connected
with the size of the company, they might also have other important advantages
over newcomers.
2. Product differentiation – by creating brand differentiation the companies within
the industry force any new newcomer to overcome customer loyalty. Tools and
traits determining brand differentiation are: advertising, customer service, being
first in the industry and product differences and other. (ibid)
3. Capital requirements – if new competitor has to invest big amount of resources
beforehand, it might deter him from entering the industry. Sufficiently high
capital requirements greatly reduce amount of potential entrants to the industry.
(ibid)

13
4. Cost disadvantages independent of size – the companies within the industry
might have advantages which are not available to new players such as patents,
favorable location, access to best resources, governernment subsidies,
proprietary technology or reap fruits of the learning curve (they are in the
industry so long that they know how to do things right and in efficient manner).
(ibid)
5. Access to distribution channels – if existing way of distribution of the products
to the customers are firmly in the hand of the existing companies, any newcomer
will have difficulties to deliver his products to the customer. (ibid)
6. Government policy – government regulations may directly or indirectly affect
the possibilities to enter the industry (ibid). Tools governemnts use are:
complusory licenses (in Finland for example in Taxi industry, selling of
weapons), limiting sales of certain products on its area (Finnish example: sale of
liquors - Alko), environmental regulations, safety regulations, forbiding the sale
and purchase of certain products (drugs, etc.) and other.
These barriers differ from industry to idustry and can be combined. For example in oil
extraction industry the established players have advantages of economies of scale, very
high capital requirements are needed to enter the industry, they have cost advantages
independent of size (know how, location), access to distribution channels and are often
protected from competition by the governments.
2.1.2 (Bargaining) Power of Suppliers
Suppliers of the industry if powerful enough can raise the price of their products or
lower their quality regardless of their customers. This in turn can limit profitablility of
their customers (the industry). (Porter 1998 p.28)
Factors influencing the power of the supplier(s) are:

14
1. If supplier industry is “dominated by a few companies and is more concentrated
than the industry it sells to.” (Porter 1998 p.29) Example of this is OPEC
(Organisation of Petroleum Exporting Countries).
2. Their products are unique or differentiated, or their products have high switching
costs (for example if supplier manufactures parts by customers exact
specifications or if their production lines are connected with their customer’s).
(ibid)
3. They are not obliged to compete with other products for sale to the industry.
(ibid) In line with prevoius implication about unique product, if there is no
competition for the supplier industry, then customer industry has to bear the
increased costs. Example of this is Chinese rare earths production and exporting
industry.
4. They can forward integrate into the customer’s industry – this way they
effectively limit bargaining power of their customers. (ibid)
5. If the industry is not an important customer of the suppliers – if the industry is
an important customer, then suppliers are dependent on its well being and will
protect the existing relationships. (ibid)
2.1.3 (Bargaining) Power of Buyers
According to Porter 1998, buyers are important competitive force if they possess fol-
lowing qualities (please note that the mechanisms that work here are similar as in the
case of suppliers):
1. They are concentrated/purchase in large volumes – if they purchase in large vo-
lumes – they are important customers and industry’s well-being is dependent on
theirs as implied in point 5. of previous section.
2. The products they purchase form the industry are standard or undifferentiated –
low or nonexistent switching costs allow customers to choose freely the suppli-
ers, thus increasing the competition for their purchases.
15
3. They generate low profits – financially weak customers are highly price sensi-
tive and as such create pressure for lowering of the prices in the supplier indus-
try.
4. The product of the industry is not important to the quality of their products or
services – if the product is not the core part of their service or product, they will
be price sensitive. Example: Replacement of cream in the ice creams by plant
based oils and milk. This shows that the quality might only be perceived (by the
consumer).
5. The industry’s product does not save their money – if the product can repay it-
self multiple times, the customer is not price sensitive, but looking for quality
instead. Example: investment banking, mineral prospecting. (Porter 1998 p.30)
6. The buyers can realistically integrate backwards to the suppliers industry. Car
companies and their big customers were waging this conflict – as a buyers
threatened suppliers with self-manufacture. (ibid)
2.1.4 (Threat of) Substitute Products
Substitute products represent a threat because they effectively put a price cap on how
much the industry can charge for its products (because of cross elasticity of demand).
Their influence can be lowered by improving quality or differentiating industry’s prod-
uct. If the substitute offers better price/performance ratio, its limiting effect on industry
profitability will be more pronounced. The most dangerous substitutes are those that
improving their price/performance ratio compared to industry’s product and substitutes
produced by highly profitable industry. (Porter 1998 p.32)
Forms of the substitution can be various:
1. Product-for-product substitution – example of this phenomenon is postal service
and e-mail (Johnson, Scholes and Whittington 2006 p.82), printed books and e-
books/e-book readers.

16
2. Substitution of a need – occurs when new product or service that renders exist-
ing service/product redundant (Johnson, Scholes and Whittington 2006 p.82).
Example: mobile phones SMS (Short Message Service) made sending of
telegrams obsolete.
3. Generic substitution – product belongs to the same group when it comes to
customer’s disposable income distribution (ibid). Example: When customer
wants to travel he might consider travelling by bus, train, ship, airplane, car etc.
2.1.5 Jockeying for Position (Competitive Rivalry)
Competitive rivalry in the industry is form of competition where players compete by
price, product introductions and advertising (Porter 1998 p.32). Intensity of competition
depends on:
1. Number of competitors – if it is large or competitors are about the same in the
size and power, there will be intense competition for better position (ibid).
2. Slow industry growth – expansive players will be willing to start to fight for
market share (ibid). This leads from the fact that in the slow growing industry
one of most viable ways how to increase profitability is to maximize market
share.
3. The product of the industry is undifferentiated and/or lacks switching costs –
customer can freely choose from whom to buy (ibid). Low to non-existent cus-
tomer loyalty then creates conditions for fights for customers of the competitors.
4. High fixed costs, perishable product – when demand drops there is strong pro-
pensity to cut the prices (ibid). Propensity to cut the prices stems from the need
to minimize potential losses and it might lead to price wars.
5. Capacity is increased in large increments – this leads to supply demand misbal-
ance and to short term overcapacity and following price cutting (ibid).
6. High exit barriers – stem from very specialized assets (high sunk costs), or man-
agement’s loyalty to given industry. This means that players that would other-
wise leave the industry stay and compete even if their return on investment is
low or negative. This lowers profits of other players in the industry as well. (ibid)
17
2.1.6 Porter’s Five Forces Model – Conclusion
The competitive forces that are the most powerful are those that business must over-
come or use to its advantage in order to succeed in the industry. Important note here is
that the competitive forces and their intensity change in time and place. Example: bar-
riers to entry to space travel industry were so high form most of 20th century, that first
competitors appeared at the end of last century; legislative barriers of entry may and do
differ from country to country – e.g. China has less stringent environment protection
legislation than European union.
Porter’s Five forces model is one of the analyses of external environment of the compa-
ny and one that gives and important insight into how industry in question works and
why. In order to construct the correct strategy for given market/industry it is important
to analyze internal environment of the company as well.
2.2 Strengths, Weaknesses, Opportunities, Threats ( SWOT)
Analysis
SWOT analysis is one of the best-known and widely used analyses not only in business
environment but also in non-profit sphere. SWOT analysis integrates analysis of influ-
ences of internal environment factors of the company (strengths and weaknesses) and
external environment factors (opportunities and threats). “SWOT analysis is grounded
in the basic principle that strategy-making efforts must aim at producing a good fit be-
tween company’s resource capability (as reflected by its balance of resource strengths
and weaknesses) and its external situation (as reflected by industry and competitive
conditions, the company’s own market opportunities, and specific external threats to the
company’s profitability and market standing).” (Thompson Jr. and Strickland III 2004
p.117)

18
2.2.1 Strengths
“Strength is something a company is good at doing or a characteristic that gives it en-
hanced competiveness.” (Thompson Jr. and Strickland III 2004 p.117)
A strength can be:
• A skill or important expertise – know-how, expertise in good customer service,
unique talents, expertise in e-commerce etc. (ibid)
• Valuable physical assets – hi-tech equipment and plants, attractive location,
worldwide distribution facilities, large financial reserves and other can be an
example of valuable assets. (ibid)
• Valuable organisational assets – quality control systems, proprietary technology,
patents, loyal customers and other. (ibid p.118)
• “Valuable intaginble assets – brand name image, company reputation, buyer
goodwill, or a motivated and energized workforce” (ibid)
• Competitive capabilities – fast development and market introduction of products,
strong partnerships with key suppliers, effective research and development, fast
reactions to market conditions and emerging opportunities. (ibid)
• An achievement or attribute that gives the company a market advantage – low
overall costs, biggest market share, strong brand name, wide product range,
exceptional customer service. (ibid)
• Alliances or cooperative ventures – succesfull alliances and partnerships
increase company’s own competiveness. (ibid)
Every company has a different set of strengths. The strengths have synergic effects so
two can give the third (e.g. good research and development capability with large
financial assets make it possible to create a breakthrough product/patent, that will
provide a unique advantage over other competitors).

19
2.2.2 Weaknesses
“A weakness is something a company lacks or does poorly (in comparison to others) or
a condition that puts it at a disadvantage.” (Thompson Jr. and Strickland III 2004 p.119)
The weaknesses can take as many forms as strengths. If company lacks any of strengths
mentioned in section 2.2.1 then this lack is a weakness.
According to Thompson and Strickland 2004, weaknesses can take a form of:
• No clear strategic direction
• Obsolete facilities
• A weak balance sheet
• Higher costs compared to others
• Lacking key skills/capabilities
• Lower profitability than others
• Too narrow product line
• Weak image/reputation
• Weak distribution channels
• Insufficient funds to follow promising strategies
• Underutilized capacity
• Lower technical know-how or lagging in R&D
As was true with strengths every company has its own unique set of weaknesses, which
may also have synergies, which amplify their effects. Example: weak management
skills of the management together with not very loyal/discontented workforce will nega-
tively affect every other aspect of company operation.
2.2.3 Opportunities
Market opportunities represent possibilities for company to grow its profitability, mar-
ket share, improve its brand awareness, break into new market, gain a competitive ad-
vantage of some sort and other possibilities. They are not made all equal and each one
bears a different profit potential (Thompson Jr. and Strickland III 2004 p.126). Every
industry offers different amount of market opportunities (ibid) and they change in time
20
and place. Company might only pursue the opportunities for which it has sufficient re-
sources (Thompson Jr. and Strickland III 2004 p.119), which means that for different
segments on the market and for different companies within the industry there might be
different (attainable) opportunities.
Potential market opportunities are amongst others:
• Falling trade barriers
• Expanding into new segments, geographic markets
• Weakness of competitor(s) – which gives a chance to take his customers over
• Possibility to integrate backwards/forwards
• Possibility to gain new strategic partner
• Possibilities to utilize new technologies
• Sharp increase in demand on the market
• Booming economy
• Possibility to employ expert(s), specialist(s) with unique skills/capabilities
2.2.4 Threats
Threats are factors in company’s external environment that threaten its profitability and
competitive well-being (ibid p.127). The amount of threats in differs from industry to
industry and in time and place. Threats differ in intensity and in probability to hit the
company. The company must identify such threats that have both a high impact on its
profitability and high probability to affect it and prepare defenses against them. Differ-
ent companies (even in the same industry) face different threats –e.g. that what might
destroy small players in the industry might not have any effect on the industry’s leader.
Threats come in many forms:
• Entry of new competitors
• Disruptive technological changes – they might give other players in the industry
a competitive advantage, render company’s product obsolete, increase
price/performance ratio of substitute products.
• Improved substitute draws away the customers
• New government regulations in the industry

21
• Cuts in demand (caused by catastrophes, market crashes, recessions…)
• Supplier industry cartelizes
• Price wars in the industry
• Drop in trade barriers protecting the company
2.2.5 SWOT Analysis – Conclusion
SWOT analysis provides insight into both company’s internal and external environment
and serves as a base for other strategic analyses and company’s strategy formulation.
Kotler and Keller 2006 pp.54 see the usefulness of SWOT analysis in goal formulation
phase of planning process where it is combined with other tools of management by
objectives. Thompson and Strickland 2004 pp.127 see the use of SWOT in drawing
decisions about “how company’s strategy can be matched to both its resource
capabilities and its market opportunities, and how urgent it is for the company to correct
which particular resource weaknesses and guard against which particular external
threats.” This implies that strengths of the company should be utilized to exploit market
opportunities and not to cover/counterweight its weaknesses or fight the threats.
Weaknesses should be eliminated and threats either evaded or be overcome (i.e. a
solution for weakness is its elimination, not growth of some of company’s strength).
2.3 Description of Service S
The service S is an alternative personal transport service with model akin to a taxi ser-
vice. The alternative taxi service works as follows:
1. Customer calls the call center
2. Driver is dispatched to his location (in the car driven by his designated colleague)
3. Driver drives the customer home in customer’s own car
22
4. Driver and the customer arrive at the destination, where the driver is picked up
by his colleague. Payment occurs.
5. Driver is driven to the next customer, or to the center.
The main point of service S is to serve customers that are indisposed to drive their own
car (in the case of the service investigated in this thesis that means under the influence
of alcohol or drugs that lower the ability of the individual to drive a car) to get them
with their car to the destination of their liking (most probably to their home). There are
legal (driving under influence is considered a misdemeanor/felony virtually in all the
European countries) and biological reasons (customer drunk into sleep - transport or-
dered by a friend, person is under influence of a medication that lowers attention etc.)
why a person cannot/should not drive the car and that is where the service steps in.
Usage scenario: A customer drives to the city center to shop and later meet some of his
friends by accident, goes for a dinner and drinks alcoholic beverages. He/she needs to
get himself and his car home. Now he has several options:
1. Call the taxi and get driven back home, return for the car on the next day (paid
service).
2. Use the black taxi and return for the car next day (paid, risky)
3. Use the public transport to get home, return for the car next day (paid service).
4. Drive home under the influence of the alcohol (risky and illegal, free).
5. Get driven home by a sober friend/family member (can be in his own or other
car, free).
6. Get home by walking, distance permitting (risky, free).
7. Hitchhike (risky, improbable, free).
8. Stay where he is until becoming sober and drive home later (improbable scena-
rio, though possible in some cases, free or paid depending on activities/place to
stay).
9. Use service S and get home with a car (paid service)
Most of these options do not include the transport of the car back home, which means
that effectively there is a need to use e.g. taxi or public transport twice if retrieving the
car and if he goes home after retrieving the car, he is effectively travelling the route he
would be travelling once using service S three times.

23
The main competitors in the market are taxi services and public transport (at least in
Finnish capital area, in the areas with worse public transport network the taxi service
will have a market lead).
Service S and common taxi services share similarities in few areas. The similarities with
taxi service are:
• Ordering by phone
• Customer is transported using a motorized vehicle intended for individual trans-
port
• Charging for each kilometer driven, minutes waited etc.
• Price of the trip can be divided among several persons if necessary (car owner +
few of his friends)
Dissimilarities include:
• The customer orders services of driver only, car is provided by him/herself
• Fuel consumed is not included in the price of the transport (because it is custom-
er’s own fuel that is being consumed)
• The customer’s car is transported as well
• No taxi license necessary1 (the service S is not a taxi service, in its core it is a
“driver renting service”, the vehicle used for transport is not provided with the
driver), therefore no permit from the city is necessary when starting the business.
Comparison to public transport service:
Similarities:
• Paid personal transport service
1 Hypothetically, the exact legal status of the service is unknown.

24
Differences:
• Public transport operates on a fixed schedule and on predefined routes. Service S
operates on demand and on customer-defined routes.
• Service S will most probably be more expensive than public transport ticket.
• Public transport does not transport passengers’ motor vehicles (exception: Suo-
menlinna ferry)
• Public transport vehicles are not equipped with payment transactions terminals –
cash payments only.
2.4 Characteristics of the Market
Market for service S comprises of customers that need transport after drinking alcoholic
beverages and have a car to their disposal. As such, the customers are a subset of taxi
and public transport service users. The market is currently serviced by taxi services, il-
legal taxi services (in the capital area) and public transport. There is a limit imposed on
number of taxi services operating in the area – in Helsinki at the time of the writing of
this thesis the number was 1400 licenses (Takala 2010). There are several companies
providing public transport services for the municipalities in the capital region. Illegal
taxi services are relatively new phenomenon, they seem to operate on word of mouth
basis, with driver serving his long-term clientele (Takala 2010).
The demand for the transportation service of intoxicated customers is cyclic in nature
(the most popular days are Friday and Saturday when local population visits the
pubs/bars most often), with sharp spikes in demand on certain days (Vappu, Juhannus,
New Year’s Day) and most of the transport is done during night time (after the
bars/pubs close).2 The exact size of the market in terms of revenue/turnover is hard to
define as the market is fragmented and there is no data concerning specific market seg-
ment the author is interested in (it does not yet exist as such). However, it is possible
2 Based on author’s personal observation.

25
use data from taxi union (Suomen Taxiliitto, further in the text ST), which can provide
an insight into market structure. This is a relevant source of data as business model of
service S is most similar to the business model of taxi operators.
According to ST, the annual revenue of the whole Finnish taxi industry is 830 million
EUR. About 9500 taxi entrepreneurs own around 10000 vehicles in Finland. Amount of
kilometers driven annually is around 830 million, which shows that the average revenue
of kilometer driven is EUR 1. The cities are served by slightly larger amount of taxi op-
erators (55%) than the countryside (45%). One-half of the customers are private cus-
tomers, 30% are local/municipal services and remaining 20% are business customers.
There are approximately 560 customers per taxi entrepreneur. (Suomen Taksiliitto 2010)
For purposes of service S, it would make sense to scale down the market that is relevant
to it. According to ST data arguably 50% of their revenue comes from private customers
(there is no exact data available, so presumption the author made is that there is no price
discrimination in taxi pricing – even if there was, it would most probably be in favor of
businesses and municipalities that have sufficient financing to order large amounts of
services) and therefore revenues from this segment are 415 million EUR. If a presump-
tion is made that one fifth of the population of Finland lives in the Capital area, and that
the distribution of taxi operator’s customers is even throughout the country (not very
probable, big cities should have more than average number of both operators and cus-
tomers) then there is market of around 83 million EUR annually in taxi services for pri-
vate customers in the Capital area. Target market niche of service S is a part of this
market. The exact share of customers willing to use service S can only be obtained
through the market surveys and then by extrapolation of the results on the aggregate
values of the whole market. Most optimistic guess by the author is that about two per-
cent of the customers might be willing to use service S and that would mean market of
size of 1,6 million EUR just from the taxi customers. There are also customers using the
public transport service though, so the aforementioned sum can be used as the bottom
line for the estimation of the market size of the segment.

26
Overall market evaluation: Taxi market in Finland is in its growth phase, it is very
fragmented (with around 9500 mostly small enterprises) and not very consolidated. The
barriers to entry are low (taxi permit) and the barriers of exit are equally low. The mar-
ket overall is competitive, though due to the nature of the service it is not possible to
take total number of taxi entrepreneurs in Finland as universally implying competitive
market (because there might be highly competitive market with hundreds of operators in
Helsinki, while in Nuorgam in the northern Lapland there might only be one locally
monopolistic operator).

27
3 ANALYTICAL SECTION
3.1 Porter’s Five Forces Analysis
3.1.1 Threat of Entry of New Competitors
• Barriers to entry are low to medium: taxi permit is all what is needed – service S
is not a traditional taxi so its operators do not even need a taxi car on their own.
If taxi permit was necessary, the situation would be more complicated – city of
Helsinki imposes the limit on the amount of the taxi licenses and the demand ex-
ceeds supply in this case (Helsingin Sanomat, 2008). The total number of taxi
services in Helsinki did not change in last two years.
• Barriers to exit are low: minimum of long-term liabilities of any kind (no preor-
dered production, minimal staff, capital needs are minimal – no need for finan-
cial leverage by borrowing money), capital investments (car) can be used in pri-
vate life as well.
• In concrete segment of service S very low sunk costs (in line with previous im-
plication)
• Customer loyalty low to medium – in the taxi market the overall quality offered
is uniform, service is not significantly differentiated – the car park is similar
across the industry and the prices have a set minimum. There is not much space
for differentiation and so the customer might well just chose by finding the taxi
at the stand randomly or use telephone number he has obtained from somewhere
(in case of service S the source is the bartender).
• Industry profitability is low to medium – with average revenue per entrepreneur
of 87500 EUR yearly.3
• Capital requirements are low; as we only need a car/scooter, place for an office
and telephone + computer with an Internet connection. Capital requirements of
the competitors are higher as every driver has to have own vehicle + telecom-
3 Calculated from ST’s data

28
munication infrastructure of taxi services is more extensive than that of service S
(they run on TETRA – terrestrial trunked radio service – this is in effect a pri-
vate telephone network (Anttalainen, 2003)).
• Brand equity is low – customers usually use the taxi, which is available regard-
less of its brand. In case of public transport system, there are brands, but they are
also not important from the customer’s point of view.
Overall the barriers to entry and exit are low, however big amount of players already on
the market and relatively low profitability of the industry as a whole make the threat and
probability of entry of new competitors lower.
3.1.2 The Intensity of Competitive Rivalry
• Innovation in the industry is overall low – the taxi services are standardized and
do not evolve over time in any significant matter – usually the services offered
are personal transport, bulk transport services for municipalities/companies
(Suomen Taksiliitto 2010) and sometimes parcel/package delivery. Minor source
of income is also leasing of the car’s exterior as an advertising space.
• Competitive strategies used within the industry are specialization and focus
strategies that often overlap. The focus is in most cases geographic – company
operates within one city/city part/village/important traffic connection (Airport
Taxis, etc.). Specialization strategy then demonstrates in more ways – some
businesses offer transport of bigger amounts of customers at once (through use
of vans and microbuses), other specialize through their car park (by using exclu-
sive, luxury cars); while other might specialize is one group of customers (mu-
nicipal or companies). There is no clear sign of any cost leader, or price wars in
the industry. The structure of the industry with many small players indicates,
that the competition might push the prices down, however due to partitioning of
the taxi companies along the whole country, the taxi companies can also func-
tion as local monopolies or oligopolies. This on the other hand eliminates a big

29
part any pressures on price. The biggest competitive pressure is in the big cities,
where there are more taxi operators on relatively small area.
• Level of advertising expense – taxi operators in Finland do not usually use ag-
gressive forms of marketing and overall marketing expenses tend to be low –
most popular forms of advertising are:4
1. Advertisements on the company cars
2. Advertisements in the local bars, points of contact (train station, airport)
3. Advertisement in local advertisement newspaper (Metro, Lansiväylä)
4. Advertisements in local radio
5. Advertisement on the internet (on the company’s webpage and on the
other pages)
6. Leaflets, business cards - traditional method – leaving promotional and
contact information in the places with high concentration of potential
customers
While the overall expenses are comparatively to other industries low, its impor-
tance on the market with largely uniform product is high. A customer is not
going to use the services of the company of whose existence he does not even
know. This has serious implications for company offering service S, as it will
not have enough of our own cars to make the company visible in normal traffic
like the cars of normal taxi services are. In taxi service market, the customer is
going to use either the taxi he can see or the one whose telephone number he
remembers.
Overall, the level of competition is medium – high, depending on the area.
4 Based on author’s personal observation.

30
3.1.3 The Bargaining Power of Customers
• Customers do not have any form of propensity for bargaining (bargaining is not
customary in Finland); the prices are firmly set and available to the customer be-
fore and during the ride.
• Customers are individual and many – that lowers their bargaining power in
comparison to the service providers. Company and municipal customers are big-
ger and have bigger leverage when it comes to bargaining; however, they are not
our principal customers.
• Buyer information availability is high – the customers are well informed about
the prices and offering of the taxi companies either through the internet or
through the bartenders or local newspapers.
• Availability of existing substitute products is high – customers can use other
modes of paid or free transport that I have described in section 2.3. An important
note here is the fact, that the availability of substitutes is variable in time. During
the day the biggest availability of individual transport, services are between 6 –
7 AM to 10PM. During these hours the public transport system works at full ca-
pacity, person in need of travel can also count on friends/acquaintances/family
members for transport better than during later hours. The availability of public
transport services is also not evenly spread geographically and in later hours,
there are large areas that are not serviced at all. Appeal of the travel by bi-
cycle/on feet also decreases during the night hours (because of the cold weather,
psychological reasons etc.). Taxi services run more or less at stable rate
throughout the day, however their availability during the nighttime is lower than
optimal (Takala 2010). Therefore, during the day, the availability of direct subs-
titutes is very good, but in the night, it is low. As service S is to operate during
the night hours, the availability of substitutes during that time is low.
• Buyer price sensitivity is medium to high – existence of drunken drivers and
black taxi operators suggests that the customer is price sensitive to the point of
risking breaking the law. This might also be increased due to effects of recent
recession, which increased number of unemployed in the whole country and led
to cut backs in customer spending. During the crisis, the amount of customers of

31
the taxi operators at Helsinki International airport fell by around 20% (Helsingin
Sanomat 2009). On the other hand, our principal customers are people under the
influence of alcohol who have often lowered sensitivity thresholds.
Overall, the bargaining power of customers is low to medium during the intended period
of operation of service S (late night/early morning, weekends) and high during the day-
time.
3.1.4 Threat of Substitute Products or Services
• Buyer propensity to substitute is medium. Customers will be more prone to use
substitute services during the day as written in previous section.
• Relative price performance of substitute is high for public transport services and
low to medium for taxi services – tickets for public transport in Helsinki area
can be obtained for prices ranging from 2,50 EUR (4,00 EUR during the night
time) (HSL, 2011) and taxi services start at approximately 8,00 EUR (price you
have to pay no matter how far you travel “entrance fee”) (Suomen Taksiliitto
2010). As service S is aimed as a direct competitor of taxi services, its prices
will have to be similar or lower than theirs (service S cannot compete with pub-
lic transport that utilizes economies of scale to their advantage and is subsidized
by the municipalities).
• Buyer switching costs are zero. The buyer does not lose any money for not using
service S. He can freely choose any other mode of transport but service S.
Switching cost occur only when it comes to transport of his car, which none of
other services offer (customer will therefore have to use another mean of trans-
port to pick up his car at later time what incurs costs). This is what operator of
service S needs to accent in his marketing communication to increase perceived
value of service S for prospective customers.

32
• Perceived level of product differentiation is low – the purpose of transportation
is to get from one place to another and in the city with second best public trans-
port system in Europe the differentiation is even harder for taxi operators.
• Number of substitute products on the market is high, however during the night-
time, their availability is low.
• Ease of substitution - low to medium. In case of taxis, which are primary substi-
tutes of service S, there is no difference if customer orders service S or taxi ser-
vice over the phone. In case of public transport, the substitution is not as easy as
the customer has to get to the nearest station and wait for the transport mean to
arrive according to the timetable. As was said before, the ease of substitution
lowers in the late night, early morning hours.
Overall, the threat of substitute products is high.
3.1.5 The Bargaining Power of Suppliers
The most important suppliers in case of service S are the drivers whose payroll expenses
will represent the largest share of its operator’s operational overhead. Secondary suppli-
ers are the telephone service provider (principal means of contact will be through the
phone), internet service provider (secondary means of contact), landlord (at least one
office will be needed), diesel/petrol provider (for the car/scooter of the driver that will
collect other drivers after their ride with the customer is over, otherwise any costs in-
curred will be paid in full by the customer e.g. the petrol will be used to refuel his car, if
the need be). For purposes of the analysis only the drivers are important, rest of the sup-
pliers are not an important factor.
• Supplier switching costs relative to firm’s switching costs are low, for the com-
pany it is more costly to replace a driver, then for a driver to find a new employ-
er/start his own company. Indeed the drivers who will over time attain a stable

33
clientele may be prone to cut his overhead by eliminating intermediaries (opera-
tor) and provide his services directly to the customer.
• Impact of inputs on costs is high – most of operator’s expenses will be payroll
and most of revenues will come from the drivers, this dependency will increase
their bargaining power when dealing with operator as their employer.
• Supplier concentration – ability to vertically integrate and cut the operator out is
high as the drivers are in direct contact with the customer and their costs to be-
come competitors are low.
• Employee solidarity – unknown at the time before starting the company, howev-
er might be an important factor – the working conditions of the drivers will not
be very pleasant and if united, their claims for better pay (to offset the negative
effects of the working conditions) might drive the prices of service S to levels
where operator might lose competitiveness.
Overall, the bargaining power of suppliers is very high.
3.1.6 Porter’s Five Forces Model – Conclusion
Porter’s five forces analysis has shown that:
• Industry of service S is highly competitive, with low barriers to entry and exit, a
competitor might come and leave at any time, although their total number has to
stay the same.
• Competition among the players in the industry is high, albeit geographically li-
mited.
• At all times, there is threat of substitute products. During the daytime, this threat
is represented mainly by public transport services and during the nighttime by
taxi services.
• Customer bargaining power is low, however they are price sensitive and the of-
fered service is not differentiated.
• Suppliers represented mainly by the drivers are very powerful.

34
These outcomes show that the conditions for newcomers in the industry are difficult and
any new player will have to have well prepared and implemented strategy in order to
succeed.
3.2 SWOT Analysis
Data collected in the theoretical part of the thesis and results of Porter’s five forces
analysis serve as a basis for SWOT analysis. As was said in the section 2.2, the SWOT
analysis provides a unified look at the company from both internal and external envi-
ronment. For purposes of this analysis, the author will assume she is running the com-
pany offering service S, with her husband and several of their friends. This point of
view represents probable form of the company if the author decided to realize it. The
analysis and its outcomes would differ if it were done by e.g. taxi company seeking to
enrich its service portfolio, or that of a company diversifying from other industry.
3.2.1 Strengths
• The first mover advantage – the company will be a first of its kind on the market.
That will allow it to build market share and goodwill before the competitors co-
pying its business model appear. This time will probably not last long, so it is
important to use it to the maximum extent.
• Lower operating overhead compared to taxi businesses – much smaller car park
and lower need to purchase fuel lead to lower operating costs, which means
higher profitability and/or possibility of competing by price.
• Clearly defined product, mission and vision of the company – the company has
clear purpose and target audience. This will be important especially during the
first months of existence of the company, as it will need to attract many custom-
ers with limited workforce. Therefore, focus on one particular group of custom-

35
ers is of essence (in order not to waste any resources on less important customers,
market segments etc.).
• Managerial education of both the author and her husband – they have theoretical
knowledge and practical skills needed to start and run a company.
3.2.2 Weaknesses
• No previous experience in the field
• Never run a company before - no one of potential entrepreneurs has relevant ex-
perience with running a company.
• Foreign background – service S is dependent in big part on customer’s trust and
it is easier to gain the trust if operator/driver similar to the customer (i.e. Finnish
customers might trust Finnish drivers more than foreign ones regardless of lan-
guage barrier).
• High insurance costs – as compared to competitors – service S drivers will need
to have more insurance coverage because of risky conditions in which they will
operate. Both health and accident insurance should cover the driver as well as
accident protection (the car insurance is car owner’s, however the responsibility
for the vehicle is on the driver for duration of the service. Legal defense in case
of accident might be complicated due to fact that the driver is the only sober per-
son in the car and therefore bears more responsibility than the car’s owner bears).
Both health (drunk passengers on board most of the time) and property accidents
(cars owned by the passenger might not be of as high quality or be serviced as
well as those of taxi operators) probability is higher compared to taxi and public
transport.
• No established brand – the company will be a new one and it will have to build
awareness about its service in competition with established players. Further
problem is that it will not have as high exposure through its vehicles as substi-
tute service operators.

36
3.2.3 Opportunities
• Untapped market – market is served by indirect substitutes, primary need is not
entirely satisfied.
• First mover advantage (low direct competition at start). Detailed explanation
given in section 3.2.1 “Strengths”.
• Low capital expenses will give the company a maneuvering space in the first
months of existence of the company. It can operate for relatively long time even
with low amount of customers. That increases chances of company surviving its
first year.
• Customer loyalty is low – this will make getting new customers from the com-
petitors easier.
• The substitute products do not cover the Capital area evenly – the company
might exploit the areas with low presence of competitors as a starting point.
• The services offered by the competitors are not differentiated – the company can
solidify its position by showing to the customers, that it is not another taxi ser-
vice.
• Innovation in the industry is low – by utilizing of modern communication chan-
nels (internet, social networking) the company can differentiate itself from the
competitors and attract customers.
• The use of taxis is declining (Takala 2010) – one of the reasons might be the re-
cent recession (Helsingin Sanomat 2009), which did damages to taxi operators’
financial health and might have reduced the amount of operating businesses in
the field. The other might be the fact that if there are less taxis in use there will
be less turnover overall – customers are left waiting; some may not be served at
all (according to Takala 2010, this is one of the main reasons of popularity of
black taxis). This means that there is a market segment in which the needs of the
customers are not satisfied by current operators – and it is close to company’s
target group.
• Possibility market service as a safer alternative to the black taxis – use of black
taxis, although not illegal is connected with a risk of being robbed, or taken
37
advantage of while under the influence (Helsingin Sanomat 2006). Service S
will take the customers form the same pool as the black taxis. The company can
use its legal operation and form as a form of safety for the customers that use
services of black taxis. Vice-versa it can use this as a safety against cheating
customers, that are connected with the use of black taxis (Takala, 2010).
3.2.4 Threats
• Cultural differences – Finnish customers might not be willing to hand their car
over to another person. This can be further aggravated by foreign background of
the driver.
• Legal threats – in itself service S runs on the creative explanation of the law (not
a taxi service – does not need a license), licensed taxi drivers may successfully
lobby at city council to include service S into the license program which would
effectively raise company’s costs and put a barrier on market entry as those are
seldom awarded in recent years.
• Staffing and staff related difficulties – the nature of the job (nighttime work,
work with people under the influence, uneven workload) might act as a deterrent
to the prospective drivers. Related to it is a very low appeal of service S for
women drivers - as driving a group of drunken men poses serious personal safe-
ty risk. Moreover, due to the status of the passengers it is more probable some
basic level of fitness prowess might be necessary (carrying passed out client to-
from their car etc.). The company might not find enough drivers to cover the
Capital area evenly.
• Systematic risk of transportation of drunken clients - transported persons might
be aggressive towards each other or the driver, might reject to pay the fare, pass
out, have health problems, misbehave, irritate the driver or act recklessly during
being transported, thus directly endangering themselves and the driver. The
company needs a record of accomplishment of being reliable to attract new cus-
tomers and retain the old ones.
• Market niche disappearance – once the novelty of service S wears off, there
might be a steady decline in amount of customers even without competitors ac-

38
tion (service S might not cover their real needs – e.g. customers might not travel
to the pub or bar by car, but use the alternative solutions).
• Pricing very dependent on price levels of competing services – the company
might not go much over the price levels offered by taxi companies/public trans-
port operators as it might face the risk of imperfect differentiation in the eyes of
consumers (you are a taxi, why are you so expensive?). Because of offering a
substitute product, company’s prices are cross elastic.
• Easy to copy concept – as service S operator’s business idea is simple in its core
and easy to copy, operator might face heavy competition soon from the new
companies to companies offering substitute products (e.g. a taxi operator might
just add similar service to service S to their portfolio and reap the advantages of
economies of scale and long market presence – instead of losing customers to
the company, effectively transferring them to other service). Secondarily opera-
tor might run into risk of employees freelancing – especially after transporting
certain clients on regular basis – as they are in direct contact with the customer
and might build a stable customer base. It can be profitable for them to cut the
intermediaries (in this case their employer) and start their own enterprise.
• Not knowing the customer well enough – if the majority of the customers live in
the vicinity of their favorite bars/pubs, their transport might be well executed by
other means, or the trips can be very short – thus making the comany run on low
margins
• Collective bargaining – taxi services have legally binding lower limit on cost per
km driven (Suomen Taksiliitto 2010). If operators of service S were treated the
same way, they will lose the ability to compete with lower price.
3.2.5 SWOT Analysis - Conclusion
The author’s company possesses limited amount of strengths, of which the most impor-
tant are the innovative business idea and personnel. Weaknesses are numerous with li-
mited practical experience being one of the biggest. Opportunities are plentiful with lo-
wering of use of taxi services opening the market for competitors being the strongest

39
one, first mover advantage also provides strong opportunity. Threats are plentiful, some
lead from the fact that the company is a startup, while other are more generic, though
industry-specific. The most important threats are staffing and staff related difficulties in
which the company might run and legal risks on close second place. There have pre-
viously been difficulties with unlicensed “alternative” taxi services in the past, so legis-
lators and legislation might pose a significant danger to the company’s business.

40
4 PRIMARY DATA ANALYSIS
4.1 Questionnaire – Basic Facts and Limitations
In January 2011, the author has conducted a survey on sample of 50 respondents in Es-
poo and Helsinki. The questionnaire can be found in appendices at the end of this work.
It was written in English, no other language mutations were made. All respondents re-
ceived the same questionnaire. All 50 questionnaires were returned (0% loss). The pur-
pose of the questionnaire was threefold:
1. Find if the concept of the service is interesting/acceptable for Finnish customers
2. Find how much are the accepting customers willing to pay for the service
3. Find what are the reasons behind refusal of the service’s concept
There are multiple limitations to the questionnaire:
• Design – the purpose of the questionnaire was to get qualitative data. Questions
were few in order to minimize time needed to fill it and to keep focus on the
main point – service and its description.
• Design flaw – question no. 6 gave too limited options for the respondent (lowest
frequency being once per month). Those that would like to use the service less
often did not have appropriate option available – adding “other” option would
fix the problem, however at this stage the validity of the answers for this ques-
tion was low and therefore it was not analyzed.
• Only 50 copies circulated – due to time constraints it was not possible to create
and distribute more questionnaires. Low total amount makes use of the ques-
tionnaire for statistical analysis purpose unviable (because of high statistical er-
rors at such a low count); however, for finding information about the acceptance
of the concept of the service, this is an acceptable shortcoming, not diminishing
validity of the collected information.
• Availability of the questionnaire in English version only leads to potentially
skewed results. Target market for the service is also customers not speaking
English and their opinion could not be taken into account. This limitation stems
from author’s foreign origin and low language pr
• Respondents answers might have also be influenced by the wording of the que
tionnaire (English is not the author’s nor respondents’ mother tongue), place of
taking the survey, author’s nationality and other influences. Result
should be taken with these limitations in mind.
4.2 Analysis of the Questionnaire
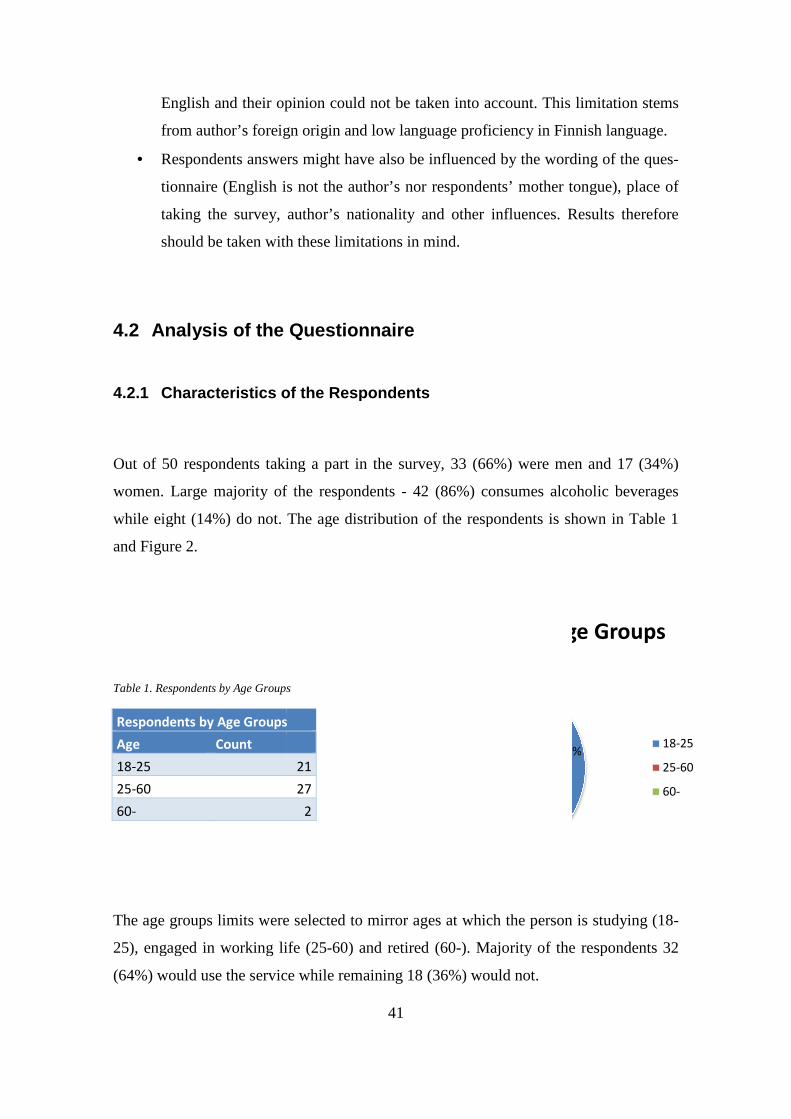
4.2.1 Characteristics of the Respondents
Out of 50 respondents taking a pa
women. Large majority of the respondents
while eight (14%) do not. The age distribution of the respondents is shown in Table 1
and Figure 2.
Table 1. Respondents by Age Groups
The age groups limits were selected to mirror ages at which the person is studying (18
25), engaged in working life (25
(64%) would use the service while remaining
Respondents by Age Groups
Age Count
18-25
25-60
60-
41
English and their opinion could not be taken into account. This limitation stems
from author’s foreign origin and low language proficiency in Finnish language.
Respondents answers might have also be influenced by the wording of the que
tionnaire (English is not the author’s nor respondents’ mother tongue), place of
taking the survey, author’s nationality and other influences. Result
should be taken with these limitations in mind.
Analysis of the Questionnaire
Characteristics of the Respondents
ut of 50 respondents taking a part in the survey, 33 (66%) were men and 17 (34%)
women. Large majority of the respondents - 42 (86%) consumes alcoholic beverages
while eight (14%) do not. The age distribution of the respondents is shown in Table 1
. Respondents by Age Groups
The age groups limits were selected to mirror ages at which the person is studying (18
25), engaged in working life (25-60) and retired (60-). Majority of the respondents 32
(64%) would use the service while remaining 18 (36%) would not.
roups
21
27
2
21, 42%
27, 54%
2, 4%
Respondents by Age Groups
Figure 2. Respondents by Age Groups
English and their opinion could not be taken into account. This limitation stems
oficiency in Finnish language.
Respondents answers might have also be influenced by the wording of the ques-
tionnaire (English is not the author’s nor respondents’ mother tongue), place of
taking the survey, author’s nationality and other influences. Results therefore
rt in the survey, 33 (66%) were men and 17 (34%)
(86%) consumes alcoholic beverages
while eight (14%) do not. The age distribution of the respondents is shown in Table 1
The age groups limits were selected to mirror ages at which the person is studying (18-
). Majority of the respondents 32
21, 42%
Respondents by Age Groups
18-25
25-60
60-
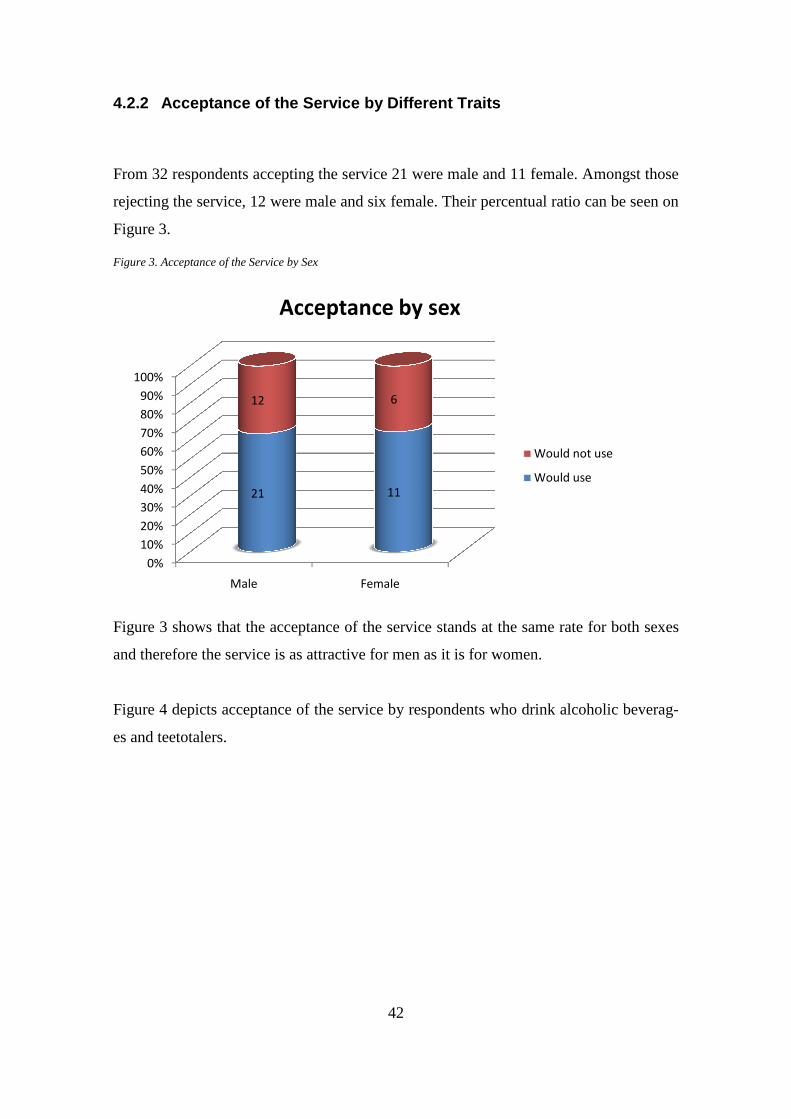
4.2.2 Acceptance of the Service by Different Traits
From 32 respondents accepting the service 21 were male and 11 female. Amongst those
rejecting the service, 12 were male and six female. Their percentual ratio can be seen on
Figure 3.
Figure 3. Acceptance of the Service by Sex
Figure 3 shows that the acceptance of the service stands at the same rate for both sexes
and therefore the service is as attractive for men as it is for women.
Figure 4 depicts acceptance o
es and teetotalers.
0%
10%
20%
30%
40%
50%
60%
70%
80%
90%
100%
Male
21
12
Acceptance by sex
42
Acceptance of the Service by Different Traits
From 32 respondents accepting the service 21 were male and 11 female. Amongst those
rejecting the service, 12 were male and six female. Their percentual ratio can be seen on
. Acceptance of the Service by Sex
Figure 3 shows that the acceptance of the service stands at the same rate for both sexes
and therefore the service is as attractive for men as it is for women.
Figure 4 depicts acceptance of the service by respondents who drink alcoholic bevera
Female
11
6
Acceptance by sex
Would not use
Would use
From 32 respondents accepting the service 21 were male and 11 female. Amongst those
rejecting the service, 12 were male and six female. Their percentual ratio can be seen on
Figure 3 shows that the acceptance of the service stands at the same rate for both sexes
f the service by respondents who drink alcoholic beverag-
Would not use
Would use
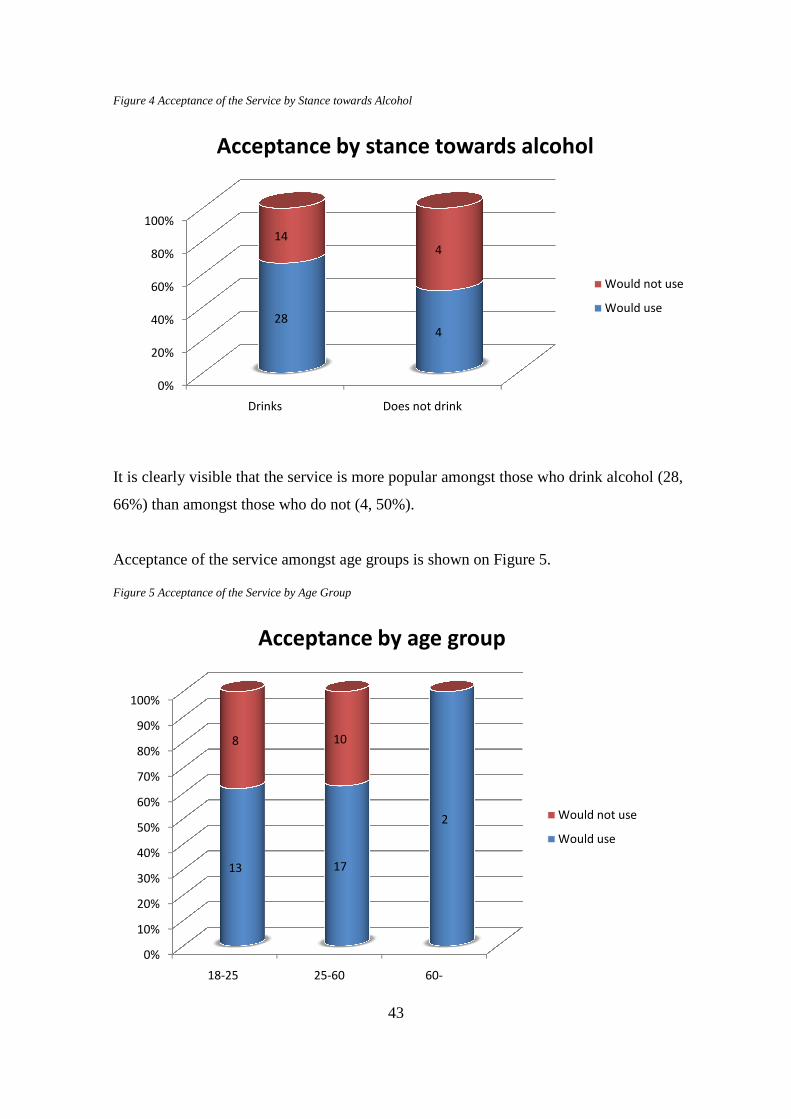
Figure 4 Acceptance of the Service by Stance towards Alcohol
It is clearly visible that the service is more popular amongst those who drink alcohol (28
66%) than amongst those who do not (4, 50%).
Acceptance of the service amongst age groups is
Figure 5 Acceptance of the Service by Age Group
0%
20%
40%
60%
80%
100%
Drinks
28
14
Acceptance by stance towards alcohol
0%
10%
20%
30%
40%
50%
60%
70%
80%
90%
100%
18-25
13
8
Acceptance by age group
43
Acceptance of the Service by Stance towards Alcohol
It is clearly visible that the service is more popular amongst those who drink alcohol (28
66%) than amongst those who do not (4, 50%).
Acceptance of the service amongst age groups is shown on Figure 5.
Acceptance of the Service by Age Group
Does not drink
284
144
Acceptance by stance towards alcohol
25-60 60-
17
2
10
Acceptance by age group
Would not use
Would use
It is clearly visible that the service is more popular amongst those who drink alcohol (28,
Acceptance by stance towards alcohol
Would not use
Would use
Would not use
Would use

There is very little difference amongst two most populous age gr
and 25-60 (17, 59%). This shows that the service is attractive the same for both se
ments. While acceptance of the service among 60+ year olds is 100%, their low count (2
respondents) does not allow drawing any conclusions from this
their distribution would incline towards this of younger respondents would there be
more respondents from this age group
.Reasons for Refusal of the Service by Traits
As shown in section 4.2.1 18 respondents who represent 36% of th
would not use the service. Their reasons for not using it are summarized in Figure 6.
Figure 6. Reasons for Not Using the Service
The total count does not add up to 18, as there was more than one option possible to
Nevertheless, the biggest single reason (44% of respondents who would not use the se
vice) for not using the service is that the respondent does not own a car (which is log
cal). As a second most important reason came satisfaction with currently ava
vices (30%). Unlike in the case of not owning a car, the company can influence this
stance via marketing activities. At the 3
their car to the other person and 15% of respondents who would not use the se
other reasons for doing so.
8, 30%
3, 11%
4, 15%
Reasons for not using the service
44
There is very little difference amongst two most populous age groups 18
60 (17, 59%). This shows that the service is attractive the same for both se
ments. While acceptance of the service among 60+ year olds is 100%, their low count (2
respondents) does not allow drawing any conclusions from this result. Most probably,
their distribution would incline towards this of younger respondents would there be
more respondents from this age group
Reasons for Refusal of the Service by Traits
As shown in section 4.2.1 18 respondents who represent 36% of th
would not use the service. Their reasons for not using it are summarized in Figure 6.
. Reasons for Not Using the Service
The total count does not add up to 18, as there was more than one option possible to
Nevertheless, the biggest single reason (44% of respondents who would not use the se
vice) for not using the service is that the respondent does not own a car (which is log
cal). As a second most important reason came satisfaction with currently ava
vices (30%). Unlike in the case of not owning a car, the company can influence this
stance via marketing activities. At the 3rd place, 11% of respondents would not give
their car to the other person and 15% of respondents who would not use the se
other reasons for doing so.
12, 44%
Reasons for not using the service
Do not own a car
Satisfied with current
services
Would not let other
people drive own car
Other reasons
oups 18-20 (13, 61,5%)
60 (17, 59%). This shows that the service is attractive the same for both seg-
ments. While acceptance of the service among 60+ year olds is 100%, their low count (2
result. Most probably,
their distribution would incline towards this of younger respondents would there be
As shown in section 4.2.1 18 respondents who represent 36% of the whole sample
would not use the service. Their reasons for not using it are summarized in Figure 6.
The total count does not add up to 18, as there was more than one option possible to tick.
Nevertheless, the biggest single reason (44% of respondents who would not use the ser-
vice) for not using the service is that the respondent does not own a car (which is logi-
cal). As a second most important reason came satisfaction with currently available ser-
vices (30%). Unlike in the case of not owning a car, the company can influence this
place, 11% of respondents would not give
their car to the other person and 15% of respondents who would not use the service had

In Figure 7 we can see the reasons for not using the service divided by sex of respo
dents. Clearly, surveyed men did not own a car in larger proportion than women did and
in general, they were more satisfied with t
Women in turn were more reluctant than men to let their car be driven by somebody
else and had more other reasons than men had not to use it.
Figure 7. Reasons for Not Using the Servic
Figure 8 shows the reasons for not using the service by age groups. Not having a car is
occurs with the same frequency among groups 18
more satisfied with current services and less prone to let other people drive
0%
10%
20%
30%
40%
50%
60%
70%
80%
90%
100%
Do not own a car
8
4
Reasons for not using the service by sex
45
In Figure 7 we can see the reasons for not using the service divided by sex of respo
dents. Clearly, surveyed men did not own a car in larger proportion than women did and
in general, they were more satisfied with the services currently available on the market.
Women in turn were more reluctant than men to let their car be driven by somebody
else and had more other reasons than men had not to use it.
. Reasons for Not Using the Service by Sex
Figure 8 shows the reasons for not using the service by age groups. Not having a car is
occurs with the same frequency among groups 18-25 and 25-60. The older group is
more satisfied with current services and less prone to let other people drive
Do not own a car Satisfied with
current services
Would not let
other people drive
own car
Other reasons
6
11
2
23
Reasons for not using the service by sex
In Figure 7 we can see the reasons for not using the service divided by sex of respon-
dents. Clearly, surveyed men did not own a car in larger proportion than women did and
he services currently available on the market.
Women in turn were more reluctant than men to let their car be driven by somebody
Figure 8 shows the reasons for not using the service by age groups. Not having a car is
60. The older group is
more satisfied with current services and less prone to let other people drive their car.
Other reasons
Reasons for not using the service by sex
Female
Male

Figure 8. Reasons for Not Using the Service by Age G
4.2.3 Proposed Price Level
This question was available only for respondents who would use the service were it
available. Table 9 shows their preferred price levels
0%
10%
20%
30%
40%
50%
60%
70%
80%
90%
100%
Do not own a
car
Satisfied with
6
6
Reasons for not using the service by age
46
r Not Using the Service by Age Group
Proposed Price Level
This question was available only for respondents who would use the service were it
available. Table 9 shows their preferred price levels for the service.
Satisfied with
current
services
Would not let
other people
drive own car
Other reasons
21
3
62
1
Reasons for not using the service by age
group
This question was available only for respondents who would use the service were it
Reasons for not using the service by age
25-60
18-25

Figure 9. Proposed Price by Users
The most popular pricing model according to 50% of the respondents would be to set
the price between that charged by the public transport and that of taxi services. Pricing
by fixed price for area was the second most popular option, which was chosen by 31%
of respondents. Remaining 19% of customers would pay the same price like for taxi or
even more.
In Figure 10 and Table 2,
groups.
Table 2. Proposed Price by Age Groups
Proposed price by age group
Age
Between public transport and
taxi
18-
25
25-
60
60-
4, 13%
2, 6%
10, 31%
Proposed price by users
47
The most popular pricing model according to 50% of the respondents would be to set
the price between that charged by the public transport and that of taxi services. Pricing
xed price for area was the second most popular option, which was chosen by 31%
of respondents. Remaining 19% of customers would pay the same price like for taxi or
we can see what level of pricing is preferred by vario
. Proposed Price by Age Groups
Proposed price by age group
Between public transport and Same price as
taxi
Higher price than
taxi
5 2
10 2
1 0
16, 50%
Proposed price by users
Between public transport
and taxi
Same price as taxi
Higher price than taxi
Fixed cost per area
The most popular pricing model according to 50% of the respondents would be to set
the price between that charged by the public transport and that of taxi services. Pricing
xed price for area was the second most popular option, which was chosen by 31%
of respondents. Remaining 19% of customers would pay the same price like for taxi or
we can see what level of pricing is preferred by various age
Higher price than Fixed cost per
area
1 5
1 4
0 1
Between public transport

Figure 10. Proposed Price by Age Groups
The preferred price level changes considerably between groups. Price between that of
public transport and taxi is strongly preferred by age group 18
give equal preferences to lower than taxi, higher than public transport and fixed price
per area. The youngest age group has the largest percentage of respondents who would
pay the same amount or more than taxis charge for the service.
Figure 11 shows how much would alc
the service. Alcohol drinkers show preference for lower than taxi price, but overall are
more generous than teetotalers who would prefer this pricing level in 75% of the cases.
Last figure, Figure 12 shows pricing preferences by sex of the respondents. Both sexes
prefer lower than taxi pricing, but to the different extent, male respondents are most in
favor of this model, while females are less focused. Females as a group are more gene
ous than men (i.e. have larger percentage of respondents who would pay the same
amount or more than taxis charge).
0%
10%
20%
30%
40%
50%
60%
70%
80%
90%
100%
18-25 25
5
2
1
5
Proposed price by age group
48
. Proposed Price by Age Groups
The preferred price level changes considerably between groups. Price between that of
public transport and taxi is strongly preferred by age group 18-25. The rest of groups
erences to lower than taxi, higher than public transport and fixed price
per area. The youngest age group has the largest percentage of respondents who would
pay the same amount or more than taxis charge for the service.
Figure 11 shows how much would alcohol drinkers and teetotalers be willing to pay for
the service. Alcohol drinkers show preference for lower than taxi price, but overall are
more generous than teetotalers who would prefer this pricing level in 75% of the cases.
ws pricing preferences by sex of the respondents. Both sexes
prefer lower than taxi pricing, but to the different extent, male respondents are most in
favor of this model, while females are less focused. Females as a group are more gene
have larger percentage of respondents who would pay the same
amount or more than taxis charge).
25-60 60-
101
2
1
4
1
Proposed price by age group
Fixed cost per area
Higher price than taxi
Same price as taxi
Between public transport
and taxi
The preferred price level changes considerably between groups. Price between that of
25. The rest of groups
erences to lower than taxi, higher than public transport and fixed price
per area. The youngest age group has the largest percentage of respondents who would
ohol drinkers and teetotalers be willing to pay for
the service. Alcohol drinkers show preference for lower than taxi price, but overall are
more generous than teetotalers who would prefer this pricing level in 75% of the cases.
ws pricing preferences by sex of the respondents. Both sexes
prefer lower than taxi pricing, but to the different extent, male respondents are most in
favor of this model, while females are less focused. Females as a group are more gener-
have larger percentage of respondents who would pay the same
Fixed cost per area
Higher price than taxi
Between public transport
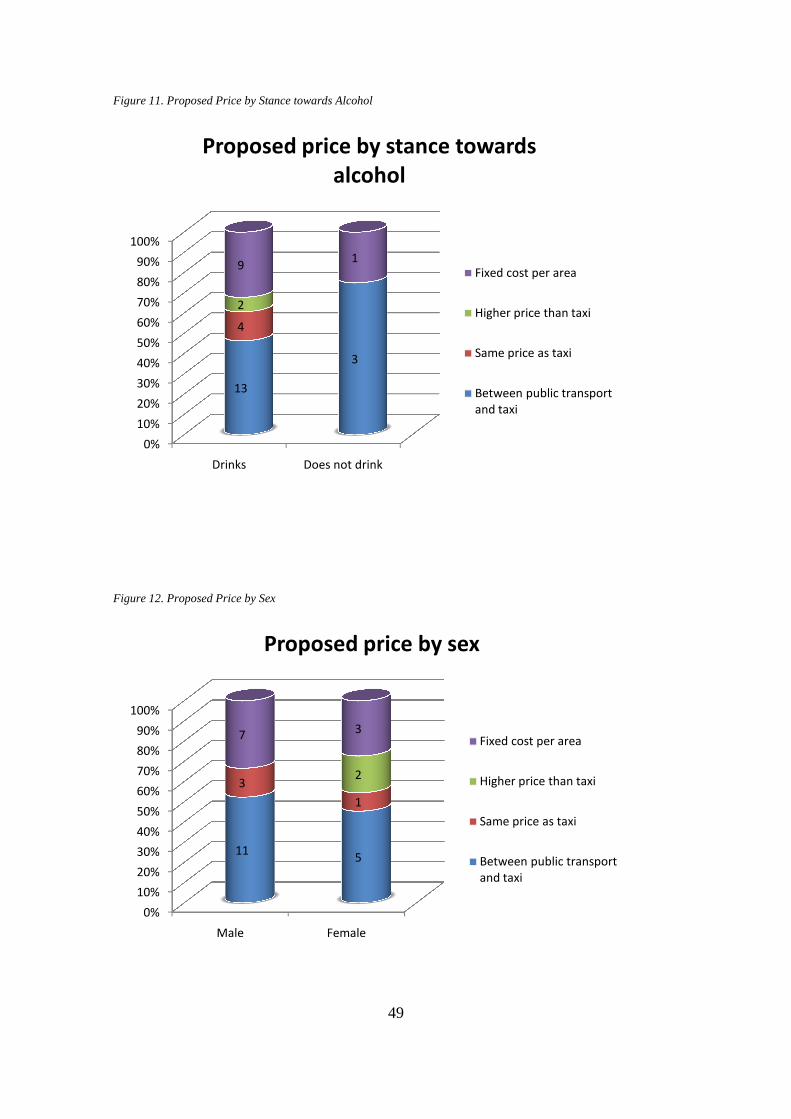
Figure 11. Proposed Price by Stance towards Alcohol
Figure 12. Proposed Price by Sex
0%
10%
20%
30%
40%
50%
60%
70%
80%
90%
100%
Drinks
13
4
2
9
Proposed price by stance towards
0%
10%
20%
30%
40%
50%
60%
70%
80%
90%
100%
Male
11
3
7
Proposed price by sex
49
. Proposed Price by Stance towards Alcohol
Does not drink
3
1
Proposed price by stance towards
alcohol
Fixed cost per area
Higher price than taxi
Same price as taxi
Between public transport
and taxi
Female
5
1
2
3
Proposed price by sex
Fixed cost per area
Higher price than taxi
Same price as taxi
Between public transport
and taxi
Fixed cost per area
Higher price than taxi
Between public transport
Fixed cost per area
Higher price than taxi
Same price as taxi
Between public transport
50
4.3 Questionnaire – Conclusions
Questionnaire has shown that Finns like the idea/concept of the service. It has also
shown that the acceptance of the service does not depend on the sex or age group. Alco-
holic drinks consumers are more willing to use the service, although it has some appeal
for teetotalers as well.
The most popular pricing models are lower price than taxi, higher price than public
transport and fixed price for area. These clearly show the perceived value of the service
and set the price ceiling below prices charged by taxi services. In general young respon-
dents, women and alcohol drinkers are more generous when it comes to preferred price
level.
Reasons for not using the service are led by not owning a car, this was expected and it is
one of the limitations of the service as compared to taxi services. Men and people be-
tween 25 and 60 years are more satisfied with the level of current services offering on
the market.
The questionnaire showed that focus on the young, alcohol drinking populace could
yield the optimal returns. They are relatively numerous, generous and least conservative
in the reasons why not to use the service.

51
5 DISCUSSION
5.1 Conclusion
Analyses in sections 3 and 4 have shown that the service is both feasible in Finnish
conditions and attractive for the customers, which answers positively both of the re-
search questions. There is no reason why the service should not be as successful in Fin-
land’s Capital region as it is in Prague.
While saying so, it is important to note that the business model and the industry (envi-
ronment) are highly challenging for a potential entrepreneur. Industry has low barriers
to entry, high competition, strong substitutes, strong suppliers and moderately strong
customers. Revenues from successful market entry are not high. The market is a very
specialized niche. There is clear acceptance of the service by the populace, but the pre-
ferred price level is set below taxi price levels. Potential entrepreneur launching this
kind of service has to utilize very efficient model of operations to ensure profitability.
Target group of the service should be people of young and working ages who drink al-
coholic beverages.
Thesis represents the first analytic steps that an entrepreneur should take before launch-
ing a new service on a new, unknown market. During thesis writing process, the author
has learned new analytic method and its application on a real life problem faced by
many companies and entrepreneurs. Analytic mindset that needed to be developed for
successful answering of the research questions of this thesis will surely aid the author in
her professional life.

52
5.2 Suggestions for Further Research
The analyses in this thesis have shown that there is both possibility and acceptance of
the service on Finnish market. This calls for better marketing research of the topic in
order to prove the results of this thesis with greater rigor. A logical continuation of this
thesis would be a business plan, which would include results of both this thesis and ne-
cessary financial analyses. From strategic point of view, there is lot to be done and fi-
nished as well, the analyses included here can be reinforced with value chain analyses.
Marketing management insight into problematic of how to advertise this service is
another way of research which may yield interesting results.
53
REFERENCES
Anttalainen, T. (2003) Introduction to Telecommunications Network Engineering, 2nd
edition, Boston: Artech Publishing.
Cox, W. (2009) Rating World Metropolitan Areas: When Money is an Object, 30 July,
[Online], Available: http://www.newgeography.com/content/00934-rating-world-
metropolitan-areas-when-money-object [Accessed: 20 November 2010].
Helsingin Sanomat (2006) Increase in robberies involving unlicensed minicabs, 1 June,
[Online], Available:
http://www.hs.fi/english/article/Increase+in+robberies+involving+unlicensed+minicabs/
1076152882484 [Accessed: 20 December 2010].
Helsingin Sanomat (2008) Granting of further taxi licences in Helsinki halted, 21
November, [Online], Available:
http://www.hs.fi/english/article/Granting+of+further+taxi+licences+in+Helsinki+halted
/1135241292089 [Accessed: 23 November 2010].
Helsingin Sanomat (2009) Recession manifests itself in reduced use of taxicabs, 17
April, [Online], Available:
http://www.hs.fi/english/article/Recession+manifests+itself+in+reduced+use+of+taxica
bs/1135245245106 [Accessed: 25 November 2010].
Helsingin Sanomat (2010) Study: Helsinki has second-best public transport in Europe,
19 February, [Online], Available:
http://www.hs.fi/english/article/Study+Helsinki+has+second-
best+public+transport+in+Europe/1135253061412 [Accessed: 2 December 2010].
Helsinki Regional Transport (2010) Europe's most satisfied public transport passengers
live in Helsinki, 31 May, [Online], Available:
http://www.hsl.fi/en/abouthsl/news/2010/Pages/Page_20100531024849.aspx [Accessed:
2 December 2010].
HSL (2010) Early morning lines, 2 December, [Online], Available:
http://aikataulut.hsl.fi/linjat/en/yolinjat.html [Accessed: 2 December 2010].

54
HSL (2011) Internal tickets 2011 , [Online], Available:
http://www.hsl.fi/EN/ticketsandfares/prices/Pages/internaltickets.aspx [Accessed: 2
January 2011].
Johnson, G., Scholes, K. and Whittington, R. (2006) Exploring Corporate Strategy, 7th
edition, Edinburgh Gate: Pearson Education Limited.
Kotler, P. and Keller, K.L. (2006) Marketing Management, 12th edition, Upper Saddle
River: Pearson Education.
Länsi-Suomen Lääninhallitus (2010) Taksiluvat, [Online], Available:
http://www.intermin.fi/lh/lansi/lii/home.nsf/pages/D12347306F1397E7C2256BD8002B
60EC [Accessed: 1 December 2010].
Porter, M.E. (1998) On Competition, 1st edition, Boston: Harvard Business School
Publishing.
Suomen Taksiliitto (2010) Taksimatkan hinta, [Online], Available:
http://www.taksiliitto.fi/taksiliikenne/hinta/ [Accessed: 15 December 2010].
Suomen Taksiliitto (2010) Yleistä taksiliikenteestä, [Online], Available:
http://www.taksiliitto.fi/taksiliikenne/yleista/ [Accessed: 12 December 2010].
Takala, S. (2010) Unlicensed taxis already have regular customers in Helsinki, 24
August, [Online], Available:
http://www.hs.fi/english/article/Unlicensed+taxis+already+have+regular+customers+in
+Helsinki/1135259585673 [Accessed: 23 November 2010].
Thompson Jr., A.A. and Strickland III, A.J. (2004) Strategic Management: Concepts
and Cases, 13th edition, New York: McGraw-Hill.
Wolfram Alpha (2010) Helsinki Prague, 2 December, [Online], Available:
http://www.wolframalpha.com/input/?i=Helsinki+Prague [Accessed: 2 December 2010].

APPENDICES
Appendix 1. – Questionnaire
Hello, my name is Qi Dejie. I am a student at Arcada University of Applied Sciences in
Helsinki currently working on my Bachelor’s thesis in International Business Degree
Programme. The topic of my thesis is “Introduction of a New Transport Service on the
Finnish Market”.
The service which feasibility on the Finnish market I study works as follows:
My transport service is like a taxi service, but in my transport service, you only order a
driver, not the car. The driver will then drive you to your destination in your own car.
This service can be used in a situation when you came to some place with a car, but for
some reason can not drive it back home by yourself, (the reasons might be consumption
of alcoholic beverages, consumption of prescription drugs that influence perception, for-
feiting of the driver’s license by the police etc.).
Please answer the following questions by ticking ���� one of the options:
1. Please, state your sex:
� Male
� Female
2. Please state your age:
� 18-25
� 25-60
� 60-
3. Do you drink alcoholic beverages?
� Yes
� No

4. Would you use my transport service if it was available?
� Yes
� No
5. (Answer only if you chose “No” in question number 4.) Why would you not
use the service?
� I do not own a car
� I am perfectly satisfied with taxi and mass transport services, no need for addi-
tional service.
� I would not give my car to an unknown person
� Other (Please state the reason):_______________________________________
6. (Answer rest of the questions only if you chose “Yes” in question number 4.)
How often would you use the service per month, if it was available?
� 1 time
� 2-5 times
� 5- times
7. What would be an acceptable price for the service for you?
� Between the price charged by public transport and taxis (Starting from 4 € in the
night time)
� The same as taxis charge (8,30 € minimum in the night time + distance driven)
� Higher than taxi prices
� Fixed cost per area (e.g. 20 € for transport within Helsinki, 30 € for whole region)

Appendix 2. – Questionnaire results
No
Yes
N/A
2-5 time
sFixe
d co
st pe
r area
No
Yes
N/A
2-5 time
sB
etw
ee
n p
ub
lic transp
ort an
d taxi
No
No
Do
no
t ow
n a car, O
the
r reaso
ns
N/A
N/A
18-25 Ye
sYe
sN
/A1 tim
eFixe
d co
st pe
r area
No
No
Do
no
t ow
n a car, Satisfie
d w
ith cu
rren
t service
s, Wo
uld
no
t let o
the
r pe
op
le d
rive o
wn
carN
/AN
/A
18-25 Ye
sYe
sN
/A1 tim
eB
etw
ee
n p
ub
lic transp
ort an
d taxi
18-25 Ye
sN
oO
the
r reaso
ns
N/A
N/A
18-25 Ye
sN
oD
o n
ot o
wn
a carN
/AN
/A
Yes
No
Satisfied
with
curre
nt se
rvices
N/A
N/A
Yes
Yes
N/A
2-5 time
sFixe
d co
st pe
r area
Yes
Yes
N/A
1 time
Same
price
as taxi
18-25 Ye
sN
oSatisfie
d w
ith cu
rren
t service
sN
/AN
/A
Yes
Yes
N/A
1 time
Be
twe
en
pu
blic tran
spo
rt and
taxi
Yes
Yes
N/A
1 time
Be
twe
en
pu
blic tran
spo
rt and
taxi
Yes
Yes
N/A
1 time
Fixed
cost p
er are
a
18-25 N
oYe
sN
/A2-5 tim
es
Be
twe
en
pu
blic tran
spo
rt and
taxi
18-25 Ye
sYe
sN
/A2-5 tim
es
Same
price
as taxi
Yes
Yes
N/A
1 time
High
er p
rice th
an taxi
18-25 Ye
sYe
sN
/A1 tim
eSam
e p
rice as taxi
Yes
Yes
N/A
1 time
Fixed
cost p
er are
a
Yes
Yes
N/A
1 time
Same
price
as taxi
Yes
Yes
N/A
1 time
Be
twe
en
pu
blic tran
spo
rt and
taxi
18-25 Ye
sYe
sN
/A2-5 tim
es
Fixed
cost p
er are
a
Yes
No
Do
no
t ow
n a car, Satisfie
d w
ith cu
rren
t service
sN
/AN
/A
Yes
No
Do
no
t ow
n a car
N/A
N/A
Yes
No
Satisfied
with
curre
nt se
rvices
N/A
N/A
No
No
Do
no
t ow
n a car, W
ou
ld n
ot le
t oth
er p
eo
ple
drive
ow
n car
N/A
N/A
18-25 Ye
sN
oD
o n
ot o
wn
a carN
/AN
/A
Yes
No
Satisfied
with
curre
nt se
rvices
N/A
N/A
Yes
Yes
N/A
2-5 time
sB
etw
ee
n p
ub
lic transp
ort an
d taxi
Yes
Yes
N/A
1 time
Fixed
cost p
er are
a
Yes
Yes
N/A
1 time
Be
twe
en
pu
blic tran
spo
rt and
taxi
Yes
Yes
N/A
1 time
Be
twe
en
pu
blic tran
spo
rt and
taxi
18-25 Ye
sYe
sN
/A1 tim
eFixe
d co
st pe
r area
18-25 Ye
sYe
sN
/A1 tim
eB
etw
ee
n p
ub
lic transp
ort an
d taxi
18-25 Ye
sN
oD
o n
ot o
wn
a carN
/AN
/A
Yes
Yes
N/A
1 time
Be
twe
en
pu
blic tran
spo
rt and
taxi
18-25 Ye
sYe
sN
/A2-5 tim
es
Fixed
cost p
er are
a
18-25 Ye
sYe
sN
/A2-5 tim
es
Be
twe
en
pu
blic tran
spo
rt and
taxi
Yes
Yes
N/A
2-5 time
sB
etw
ee
n p
ub
lic transp
ort an
d taxi
Yes
Yes
N/A
1 time
Be
twe
en
pu
blic tran
spo
rt and
taxi
18-25 Ye
sN
oD
o n
ot o
wn
a car, Satisfied
with
curre
nt se
rvices, O
the
r reaso
ns
N/A
N/A
Yes
Yes
N/A
2-5 time
sB
etw
ee
n p
ub
lic transp
ort an
d taxi