introduction of possible inspection methods for evaluating ... · pdf fileintroduction of...
TRANSCRIPT
i
Introduction of possible inspection methods for evaluating
thermal aging status of existing pre-insulated district heating
systems
Prepared by
Bijan Adl-Zarrabi & Ali Kakavand
Prepared for
Department of Civil and Environmental Engineering
Division of Building Technology
Chalmers University of Technology
Gothenburg, Sweden 2015

ii
Abstract
The development of district heating (DH) systems with the intention of supplying high efficiency
thermal energy to the buildings has become increasingly popular over the past few decades. The thermal
energy in this system is mostly hot water or steam, which is transported by heat-insulated pipelines from
heat generation units to various places of consumption. The insulation performance of pipelines
decreases gradually during time due to degradation of polyurethane (PUR) foam. Consequently, the
requirements for detecting and monitoring the location of potential ‘hot spots’ in DH network are
significantly favorable issue for energy companies. A literature study from several reports and scientific
articles conducted to find out possible methods for remote detection of chemical, electrical and thermal
properties of PUR after natural thermal degradation. Along with this aspect, 17 methods for different
approaches took into consideration to weigh up whether they can be applied for this aim.
Keywords: District heating, degradation, inspection, pipeline, method, PUR

iii
LIST OF CONTENTS
ABSTRACT ........................................................................................................................................................ II
LIST OF CONTENTS .......................................................................................................................................... III
LIST OF FIGURES .............................................................................................................................................. IV
ACKNOWLEDGMENTS ...................................................................................................................................... V
ABBREVIATIONS .............................................................................................................................................. VI
1 INTRODUCTION ............................................................................................................................................. 1
1.1 BACKGROUND ................................................................................................................................................... 1 1.2 PURPOSE .......................................................................................................................................................... 2 1.3 METHODOLOGY ................................................................................................................................................. 2 1.4 LIMITATION AND REQUIREMENTS .......................................................................................................................... 2
2 REVIEW OF STATUS MONITORING METHODS ................................................................................................ 3
2.1 ULTRASONIC METHODS ....................................................................................................................................... 3 2.1.1 Ultrasonic Thickness Gage (UTG) .......................................................................................................... 3 2.1.2 Ultrasonic Pulse Velocity (UPV) ............................................................................................................. 3 2.1.3 Ultrasonic Pulse Echo (UPE) ................................................................................................................... 4 2.1.4 Phased Array Ultrasonic (PAU) .............................................................................................................. 5 2.1.5 Guided Wave Ultrasonic testing (GWUT) .............................................................................................. 6
2.2 CHEMICAL ANALYSIS ........................................................................................................................................... 7 2.2.1 Fourier Transform Infrared Spectrometry (FTIR) ................................................................................... 7 2.2.2 Raman Spectrometry ............................................................................................................................. 7 2.2.3 X-ray Fluorescence (XRF) Spectroscopy ................................................................................................. 8
2.3 ELECTROMAGNETIC METHODS .............................................................................................................................. 9 2.3.1 Eddy current testing .............................................................................................................................. 9 2.3.2 Remote Field testing ............................................................................................................................ 10 2.3.3 Magnetic Flux Leakage testing (MFL) .................................................................................................. 11
2.4 REFLECTOMETRY METHODS ................................................................................................................................ 11 2.4.1 Time domain reflectometry (TDR) ....................................................................................................... 11 2.4.2 Frequency Domain Reflectometry (FDR) .............................................................................................. 12
2.5 VOLTAGE RESPONSE ......................................................................................................................................... 13 2.6 TAN-DELTA ..................................................................................................................................................... 13 2.7 GROUND PENETRATING RADAR (GPR) ................................................................................................................ 14 2.8 INFRARED THERMOGRAPHY TEST ........................................................................................................................ 15
3 EVALUATION PHASE .................................................................................................................................... 17
3.1 WEIGHTING OF CRITERIA ................................................................................................................................... 17 3.1.1 Comment on criteria ............................................................................................................................ 17 3.1.2 Description of weighted decision table................................................................................................ 18
3.2 WEIGHTING OF METHODS .................................................................................................................................. 18 3.3 ARGUMENTATION AND RESULTS .......................................................................................................................... 20
4 CONCLUSION ............................................................................................................................................... 20
5 REFERENCES ................................................................................................................................................ 21

iv
LIST OF FIGURES
Figure 1. Thickness measurement in a multilayer system ....................................................................................... 3 Figure 2. Ultrasonic Pulse Velocity – Indirect Transmission .................................................................................... 4 Figure 3. Typical ultrasonic pulse echo testing ........................................................................................................ 5 Figure 4. Flat probe in PAU – beam angles ............................................................................................................. 5 Figure 5. Ultrasonic guided wave pipe inspection ................................................................................................... 6 Figure 6. Portable FTIR Spectrometer Figure 7. Schematic diagram of FTIR ......................................... 7 Figure 8. Simplified diagram of Raman Spectrometer’s operation ......................................................................... 8 Figure 9. Scheme of X-ray Fluorescence spectrometry ............................................................................................ 9 Figure 10. Producing of eddy currents in the tested specimen................................................................................ 9 Figure 11. Basic principle of Remote Field Eddy Current probe ............................................................................. 10 Figure 12.MFL testing for material without defects Figure 13.MFL testing for material with flaw defects .... 11 Figure 14. TDR principle ........................................................................................................................................ 12 Figure 15. Timing diagram of voltage response method ...................................................................................... 13 Figure 16. Basic principle of Tan Delta measurement ........................................................................................... 14 Figure 17. Schematic principle of GPR ................................................................................................................... 15 Figure 18. Leakage in an aerial thermal image ..................................................................................................... 15

v
ACKNOWLEDGMENTS
Behind each research study, is the work of a whole team, and now I would like to thank all people who
supported me in the past few months with their guidance and advice to prepare this work.
Hereby I would like to thank and express my gratitude to Professor Bijan Adl-Zarrabi for sharing his
knowledge with me and helping me every time I’ve been slowed down by a problem! Without the
continuous thematic support of him, it might not possible to achieve a high level of understanding with
this work.

vi
ABBREVIATIONS
DH……………………………………………………………………………………….District Heating
FDR…………………………………………………….......................Frequency Domain Reflectometry
FFT……………………………………………………………………………..Fast Fourier Transformer
FTIR………………………………………………….……….Fourier Transform Infrared Spectrometry
GPR……………………………………………...…………………………... Ground Penetrating Radar
GWUT…………………………………………….…………………….Guided Wave Ultrasonic testing
LIRA…………………………………………………………………………...Line Resonance Analysis
MFL……………………………………………………………………...Magnetic Flux Leakage testing
NDT………………………………………………………………………………Nondestructive testing
PAU………………………………………………………………………….….Phased Array Ultrasonic
PUR…………………………………………………………………………………………Polyurethane
SDD………………………………………………………………………………..Silicon drift detectors
TDR………………………………………………………………….………Time domain reflectometry
UPE…………………………………………………………….………………….Ultrasonic Pulse Echo
UPV……………………………………………………………………………Ultrasonic Pulse Velocity
UTG..........................................................................................................…...Ultrasonic Thickness Gage
UWB……………………………………………………………………………………..Ultra-wideband
VLF…………………………………………………………………………………..very low frequency
XRF…………………………………………………………….……..X-ray Fluorescence Spectroscopy

1
1 INTRODUCTION
1.1 Background
To decrease the primary energy supply in DH system and provide a cost effective heat distribution
network, it is significant to identify parameters that affect energy loss along the pipelines. Examples of
such parameters might be corrosion of steel pipes, leakage, aging of insulation and ground motion
(Friman et al, 2014). The greatest thermal loss in DH system occurs when hot water is channeled over
long distance from heat generation units to the consumption buildings. According to Technical Research
Institute of Sweden (SP), total annual heat loss in Swedish DH pipelines is approximately one tenth of
produced heat which is mainly related to DH pipe insulation capacity. Therefore it is favorable for many
energy companies to estimate the remaining service life of pre insulated district heating pipes. The
European Standard EN 253:2009 specifies that pre insulated pipes should survive at least 30 years at a
constant operating temperature of 120℃.
Thermal properties of pre insulated pipes, which are normally made of polyurethane (PUR), deteriorate
during the real operation conditions. The degradation of PUR occurs due to diffusion of gas molecules
between the foam and surrounding air. In this process oxygen and nitrogen molecules penetrate from air
to the foam bubbles and replace with blowing agent gases, which are mainly cyclopentane and carbon
dioxide (𝐶𝑂2) (Persson, 2015). In figure 1 the aging of an insulated district pipe with polyurethane
thermal insulation after approximately 16 years of operation is illustrated.
Figure 1 Diffusion of gases due to aging of a district heating pipe
The most significant factor that accelerates the natural aging process of insulation is directly proportional
to the steel fluid pipes temperature (Kręcielewska and Menard, 2014). Thus, when insulation panels are
exposed to high temperature, insulation thermal conductivity coefficient 𝜆 increases subsequently and
grater heat flow (loss) is expected based on Fourier’s law.
𝑞 = −𝜆 ∙ ∇𝑇 [W ∙ 𝑚−2] 𝑒𝑞. 1
Where, 𝑞 [W ∙ 𝑚−2] represents the rate of heat transfer through the material, 𝜆 [W ∙ 𝑚−1 ∙ 𝐾−1] is the
thermal conductivity coefficient and ∇𝑇 [K] stand for the temperature differences.
To detect thermal bridges in existing DH networks, the basic and customary method referred to the
normal operation by digging up the pipes and inspecting the insulation status. Additionally, taking the
DH pipes out and renovating the foam insulation is extremely expensive and time-consuming process.
Therefore, it is largely favorable for energy companies to localize the accurate damage area and heat
loss in the pipeline networks before any excavation and demolition. It should be mentioned that due to
lack of objective information about the capability of non-destructive scanning techniques in this field,
there are still no particular methods to detect the performance of existing pre-insulated DH system
during its life cycle.
2
1.2 Purpose
The objective of this work has been restricted to provide an overview of different possible screening
methods for estimating the status performance of existing pre-insulated DH pipes. This includes:
- Establish a general database of nondestructive (ND) testing methods with respect to the
requirements of this work
- Evaluate the methods based on obtained criteria
1.3 Methodology
A literature study from several reports and scientific articles carried out to estimate the consistency of
different ND inspection methods with respect to the aim of this study. The capable methods collected
based on their suitability for detecting thermal, chemical and electrical changes in degraded materials.
Some of these methods are utilized for a specific condition and the presence of them is to consider their
relative strengths and weaknesses for developments of new methods. Examples include ultrasonic
methods which are basically applied to metallic materials and perhaps they can be developed for
monitoring the status of PUR insulation from internal steel pipes. There is still a lack of laboratory tests
and theoretical calculations to determine the effects of aged polyurethane foam to steel pipe properties.
Afterwards, to sort out and evaluate the possible inspection capabilities of gathered methods, 11 criteria
identified and registered in a weighted decision table with reference to limitations and requirements.
Finally, a decision matrix table developed by using the criteria weight factors to bring out the most
possible and capable methods.
1.4 Limitation and requirements
The scope of this work has been limited to investigate the non-destructive (ND) inspection methods for
evaluating thermal resistance status of existing pre-insulated pipes. The ability of methods should also
be restricted for field operation. The methods collected based on their capability for detecting thermal,
chemical and electrical changes in degraded materials. Due to lack of ND testing information for status
monitoring of PUR, different approaches with different inspection probability are considered. However,
some methods with similar concepts aren’t observed in this study.

3
2 REVIEW OF STATUS MONITORING METHODS
2.1 Ultrasonic methods
2.1.1 Ultrasonic Thickness Gage (UTG)
This nondestructive (ND) technique measures the propagation velocity of longitudinal ultrasonic waves
in materials and converts the values to the thickness according to mathematical equations. In this method
the probe’s transmitter sends a short ultrasonic pulse into tested element. The reflection of the pulse
returns to the probe’s receiver and then converts into a high frequency electrical signal. This signal is
analyzed to determine the thickness of sample. The method is basically used where there is only one
side access to the surface of sample such as pipes, containers, tanks and large sheets of metal and plastic.
All ultrasonic thickness gauges are operated based on very precise measurement of the required time
that the sound pulse passes through the test sample. In this method one side of material surface is needed
for placing the probe therefore it is not suitable for underground investigation because the accuracy of
testing is highly depends to uniformity of coating surface and the surface condition between transducer
face and material. (Trade name: Magna-Mike 8600)
Figure 2. Thickness measurement in a multilayer system
Dependences:
- Density
- Grain Structure
Applications:
- Metals
- Plastics
- Rubber
- Corroded materials
In-situ screening ability: yes
Non-destructive testing: yes
References:
- ASTM D6132 – 13 (2013) Nondestructive Measurement of Dry Film Thickness of Applied Organic
Coatings Using an Ultrasonic Coating Thickness Gage - Meier, J.H. (1969) Ultrasonic Thickness Gage
2.1.2 Ultrasonic Pulse Velocity (UPV)
The propagation velocity of ultrasonic waves inside a solid body depends on the density and elastic
constant. Furthermore, both density and elastic constant vary from one point to another inside materials
due to different parameters, such as structural inhomogeneity, quality changes and production methods
(for instance blowing agent for manufacturing polyurethane foam). In this method the strength and
quality of materials are evaluated by sending ultrasonic pulses from a pulse generation circuit. The
electronic sounds are then transformed to mechanical pulses by a transducer. Deviations from the
average speed, and perceived wave amplitude variations, indicate inhomogeneity and air intrusions into
4
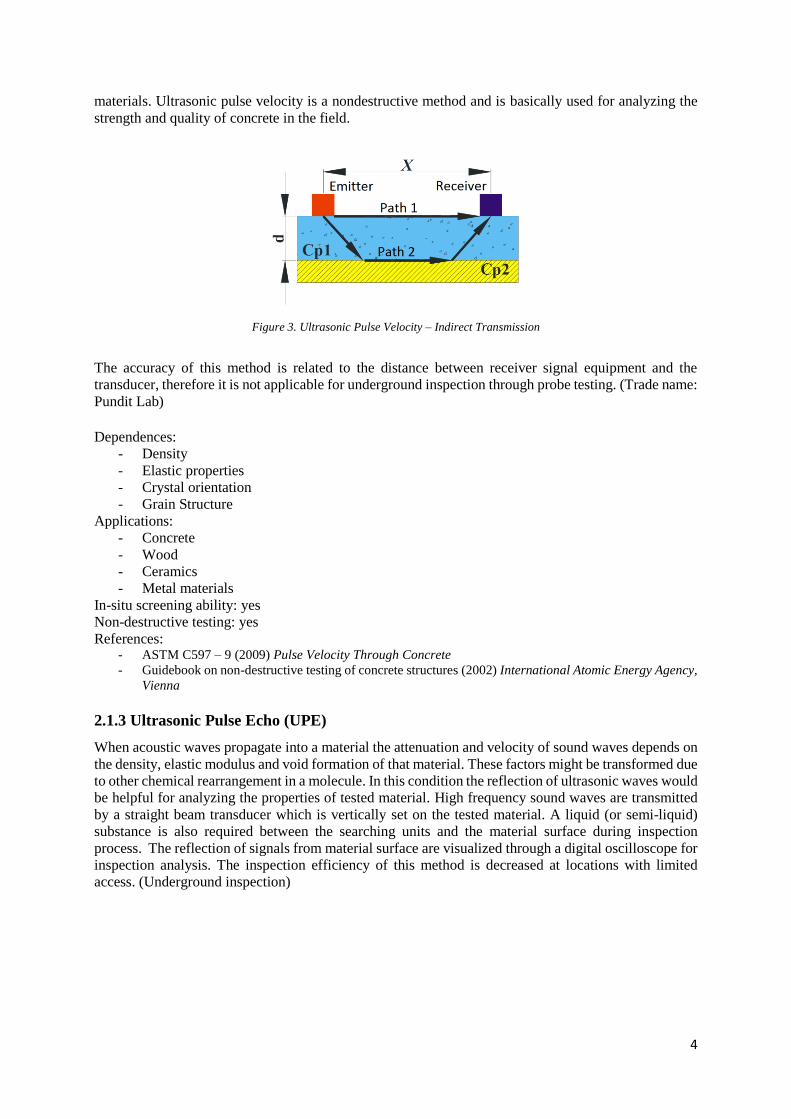
materials. Ultrasonic pulse velocity is a nondestructive method and is basically used for analyzing the
strength and quality of concrete in the field.
Figure 3. Ultrasonic Pulse Velocity – Indirect Transmission
The accuracy of this method is related to the distance between receiver signal equipment and the
transducer, therefore it is not applicable for underground inspection through probe testing. (Trade name:
Pundit Lab)
Dependences:
- Density
- Elastic properties
- Crystal orientation
- Grain Structure
Applications:
- Concrete
- Wood
- Ceramics
- Metal materials
In-situ screening ability: yes
Non-destructive testing: yes
References: - ASTM C597 – 9 (2009) Pulse Velocity Through Concrete
- Guidebook on non-destructive testing of concrete structures (2002) International Atomic Energy Agency,
Vienna
2.1.3 Ultrasonic Pulse Echo (UPE)
When acoustic waves propagate into a material the attenuation and velocity of sound waves depends on
the density, elastic modulus and void formation of that material. These factors might be transformed due
to other chemical rearrangement in a molecule. In this condition the reflection of ultrasonic waves would
be helpful for analyzing the properties of tested material. High frequency sound waves are transmitted
by a straight beam transducer which is vertically set on the tested material. A liquid (or semi-liquid)
substance is also required between the searching units and the material surface during inspection
process. The reflection of signals from material surface are visualized through a digital oscilloscope for
inspection analysis. The inspection efficiency of this method is decreased at locations with limited
access. (Underground inspection)

5
Figure 4. Typical ultrasonic pulse echo testing
Dependences:
- Density
- Elastic modulus
- Void formation
Applications:
- Concrete
- Insulated materials
In-situ screening ability: yes
Non-destructive testing: yes
References: - ASTM E114 – 10 (2010) Ultrasonic Pulse-Echo Straight-Beam Contact Testing
- Guoli Wang, Y.H., Jia, Z. and Xie, H. (2005) Application of Ultrasonic Pulse-echo Method to Insulation
Condition Diagnosis for Large Generators
2.1.4 Phased Array Ultrasonic (PAU)
The phased array ultrasonic technology can be utilized in different sectors, from power generating
station to construction industry. PAU is involved with ultrasound technology in the field of
nondestructive testing. The method can be effectively used for measuring the wall thickness of elements
as corrosion test. In this technique the array is referred to a single large probe which is combined with
several piezoelectric crystals. These piezoelectric crystals are divided in very narrow segments and they
pulse and receive the ultrasonic waves separately. The width of these segments can typically vary from
0.5mm to 2.5mm. Since different beam angles and focal depths can be combined with only one probe,
it is possible to perform several different test separately without changing the transducer. The results of
inspection are clearly stored and available for evaluation.
Figure 5. Flat probe in PAU – beam angles
Dependences:
- Crack size
- Orientation of discontinuities
- Probe size
Applications:
- Weld inspection

6
- Corrosion mapping
- Composite testing
In-situ screening ability: yes
Non-destructive testing: yes
References:
- ASTM E2491 – 13 (2013) Evaluating Performance Characteristics of Phased-Array Ultrasonic Testing
Instruments and Systems - Ciorau, P. and Pullia, L. (2007) How Reliable is Your Call? OPG Phased Array Ultrasonic Inspection
Experience on Siemens- Parson Turbine Blade Roots 2001-2007
2.1.5 Guided Wave Ultrasonic testing (GWUT)
This ND inspection method is widely utilized for assessing corrosion and structural integrity in long-
distance in-service network from a single remote point, for instance above ground metallic pipelines and
rail tracks. During the testing process three different guided wave modes, torsional, longitudinal and
flexural, can be applied into the material body. Each of these guided waves is selected based on the
geometry of element and applied frequency. The system uses low frequency ultrasonic waves (10-100
kHz), which are transmitted along the pipelines in both forward and backward directions. In this
technique an array of transducers, which are equipped by ultrasonic piezoelectric sensors is employed
to produce guided waves (torsional or longitudinal) along the pipe segment. If any discontinuities are
recognized along the pipelines the waves are reflected back to the original location for evaluating the
form and location of damages. The main advantage of this method is related to its ability for inspecting
limited access areas of a system.
Figure 6. Ultrasonic guided wave pipe inspection
Dependences:
- Pipe content
- Pipe diameter
- Surface condition
Applications:
- Detecting pipe corrosion
- Monitoring changes in cross-section of pipes
- Detecting pipe stiffness
In-situ screening ability: yes (efficient method for long distance testing)
Non-destructive testing: yes
References:
- ASTM E2775 – 11 (2011) Guided Wave Testing of Above Ground Steel Pipework Using Piezoelectric
Effect Transduction - Zhang, L. (2014) A Multi-channel Transmitter System for NDT Pipeline Testing using Guided Waves
Ultrasound
- Sonia, D. (2010) Propagation of guided waves in a hollow circular cylinder application to nondestructive
testing

7
2.2 Chemical analysis
2.2.1 Fourier Transform Infrared Spectrometry (FTIR)
The objective of Fourier-transform spectroscopy is to measure infrared spectrum of a particular
substance. FTIR is based on the absorption of light from the spectrum of a light source. In this technique
a monochromatic light beam is emitted into material at different frequency. Some light is absorbed by
tested material and other is transmitted. Consequently, by measuring the amount of molecular absorption
and transmission in the sample, it will be possible to determine the quality and the amount of components
of sample. The possibility of achieving accurate information across the entire infrared frequency at the
same time is the main advantage of this method.
Figure 7. Portable FTIR Spectrometer Figure 8. Schematic diagram of FTIR
http://www.labo.de/spektroskopie/das-tragbare-ftir-spektrometer-ermoeglicht-eine-direkte-analyse-vor-ort.htm
Dependences:
- Molecular bond between atoms
- Density
Applications:
- Polymer and polymer blend
- Rubbers
- Organic material
- Analysis of gaseous compounds
In-situ screening ability: yes
Non-destructive testing: yes
References:
- ASTM D5477 − 11 (2011) Identification of Polymer Layers or Inclusions by Fourier Transform Infrared
Microspectroscopy (FT-IR) - Seguchi, T., Tamura, K., Ohshima, T., Shimada, A. and Kudoh, H (2010) Degradation mechanisms of
cable insulation materials during radiation– thermal ageing in radiation environment
- Rogovin, D. and Lofaro, R. (2005) Evaluation of the Broadband Impedance Spectroscopy
Prognostic/Diagnostic Technique for Electric Cables Used in Nuclear Power Plants
2.2.2 Raman Spectrometry
Raman spectroscopy is a nondestructive analytical technique and gives information about different
chemical components and their molecular rotation and vibration modes. In this technique a
monochromatic light source, such as laser, near ultraviolet and near infrared, is transmitted into material
at specific wave length to excite the vibro-rotational energy level of molecules. The material molecular
composition characteristics will be changed by sending different monochromatic light. A very small
part of reflected light is shifted into energy form which provides valuable data regarding to the
vibrational mode of molecules chemical bounds. It should be noted that monochromator is referred to
filter out the unwanted wavelength of light which are emitted from a light source.

8
Figure 9. Simplified diagram of Raman Spectrometer’s operation
Dependences:
- Chemical components
- Chemical bounds
Applications:
- Identification and characterization of polymers
- Characterization of minerals and soils
In-situ screening ability: yes
Non-destructive testing: yes
References: - ASTM E1840 – 96 (2014) Raman Shift Standards for Spectrometer Calibration
- Peike, C., Kaltenbach, T., Weis, K.A. and Koehl, M. (2011) Non-destructive degradation analysis of
encapsulants in PV modules by Raman Spectroscopy
- Veitmann, M., Jumeau, R., Bourson, P., Ferriol, M. and Lahure, F. (2014) Understanding and Control of
High Temperature Oxidation Flaws of Low-Density Poly (ethylene) with Raman Spectroscopy
2.2.3 X-ray Fluorescence (XRF) Spectroscopy
This method is based on the analysis of X-ray emission energy spectrum for characterizing the chemical
properties of materials. It examines the interaction between excitation of X-ray source and electron
beams with in the sample. The main feature of this method is based on the general principle that each
material has a unique atomic structure which shows a unique collection of peaks in the X-ray spectrum
analysis. Investigating the energy spectrum of such radiation can determine the qualitative and
quantitative composition of the material. The measurement procedure of the material composition can
be considered as below:
Excitation the atoms in a sample by X-ray radiation – generation of fluorescent radiation from
the material
Recording of the fluorescence radiation by the Silicon drift detectors (SDD)
Transmission of signal from the SDD
The pulses are processed by the measuring logic
Trapezoidal filters prevent undesired effects that occur during signal processing due to different
times and energies.

9
Figure 10. Scheme of X-ray Fluorescence spectrometry
Dependencies:
- Atomic properties of tested elements
Applications:
- Soil surveying and Mining
- Bulk chemical analysis for different elements
Petroleum analysis
In-situ screening ability: yes
Non-destructive testing: yes
References: - Verma, H.R. (2007) Atomic and Nuclear Analytical methods - X-ray Fluorescence (XRF) and Particle-
Induced X-ray Emission (PIXE)
- Cobb, D. (2009) Study on the Effectiveness, Precision, and Reliability of X-ray Fluorescence
Spectrometry and Other Alternative Methods for Measuring Lead in Paint
2.3 Electromagnetic methods
2.3.1 Eddy current testing
This technique is one of the nondestructive electromagnetic testing methods which is utilized for
identifying discontinuities and flaws in surface of conductive materials. For investigating the inner layer
of material an alternating magnetic field is generated through a wire coil at a chosen frequency into the
conductor. Basically eddy current is referred to a circular flow of electrons which are produced by
placing the wire coil close to the metal surface. Since discontinuities and flaws in conductive materials
cause disturbance in circulation of electrons, the material impurities and defects are recognized by
applying eddy current. Low cost, portability, great accuracy, time efficiency and receiving real time
result are the main advantages of this method.
Figure 11. Producing of eddy currents in the tested specimen
Dependences:

10
- Surface conditions
Applications:
- Thickness measurement of steel coating layers
- Crack detection
- Electrical resistivity
In-situ screening ability: yes
Non-destructive testing: yes
References:
- ASTM E309 − 11 (2011) Eddy-Current Examination of Steel Tubular Products Using Magnetic
Saturation - IAEA - Eddy Current Testing at Level 2: Manual for the Syllabi Contained IAEA-TECDOC-628/Rev. 2
‘Training Guidelines for Non-Destructive Testing Techniques’
2.3.2 Remote Field testing
This nondestructive inspection technique is based on low frequency alternating current for inspecting
the inside and outside defects of steel pipes. The probe in this method is made up of two different coils,
one is exciter and the other one is detector. When the probe is driven inside the pipe, the exciter coil
which is supplied by a low frequency alternating current sine wave generates an electromagnetic field.
The electromagnetic field is released in axial direction inside the pipe and produced a secondary field
for monitoring the outside condition of pipe wall. The detector coil detects and analyses the magnetic
field which is transmitted from outside of the pipe wall. Fast inspection and monitoring complex joints
such as U-bend and elbow connections are advantages of this method.
Figure 12. Basic principle of Remote Field Eddy Current probe
Dependences:
- Type of material
- Wall thickness
- Residual stress
- Ambient temperature
Applications:
- In-line corrosion inspection of steel pipelines
- Ferromagnetic tubes
In-situ screening ability: yes
Non-destructive testing: yes
References:
- ASTM E2096/E2096M – 10 (2010) In Situ Examination of Ferromagnetic Heat-Exchanger Tubes Using
Remote Field Testing - RUSSELL, D. and Shen, V. (2008) Increased Use of Remote Field Technology for In-Line Inspection of
Pipelines Proves the Value of the Technology for this application
- Sadek, H.M. (2006) NDE technologies for the examination of heat exchangers and boiler tubes –
principles, advantages and limitations

11
2.3.3 Magnetic Flux Leakage testing (MFL)
MFL is a magnetic nondestructive method for detecting and evaluating magnetic properties of metallic
elements. The magnetic characteristic of materials vary due to mechanical and thermal effects such as
corrosion, pitting and wall thickness losses. In this method the steel element is magnetized to saturation
level by a powerful magnetic field. In case of above-mentioned defects are realized during the
inspection, the magnetic flux lines leak out from the surface of material. In this condition the leakage
flux can be measured by magnetic sensors. As long as the leakage magnetic field is propagated
uniformly, the tested equipment is out of defects.
Figure 13.MFL testing for material without defects Figure 14.MFL testing for material with flaw defects
Dependences: - Orientation of discontinuities
Applications:
- Monitoring corrosion of underground steel pipes
- Oil storage tank
- Rail tracks
- Detecting flaws in bridge cables
In-situ screening ability: yes
Non-destructive testing: yes
References: - ASTM E570 – 15 (2015) Flux Leakage Examination of Ferromagnetic Steel Tubular Product
- Xu, J., Wu, X., Cheng, C. and Den, A. (2012) A Magnetic Flux Leakage and Magnetostrictive Guided
Wave Hybrid Transducer for Detecting Bridge Cables
- Pearson, N. (2012) Discrimination of top and bottom discontinuities with MFL and the Surface Topology
Air-gap Reluctance System (STARS)
2.4 Reflectometry methods
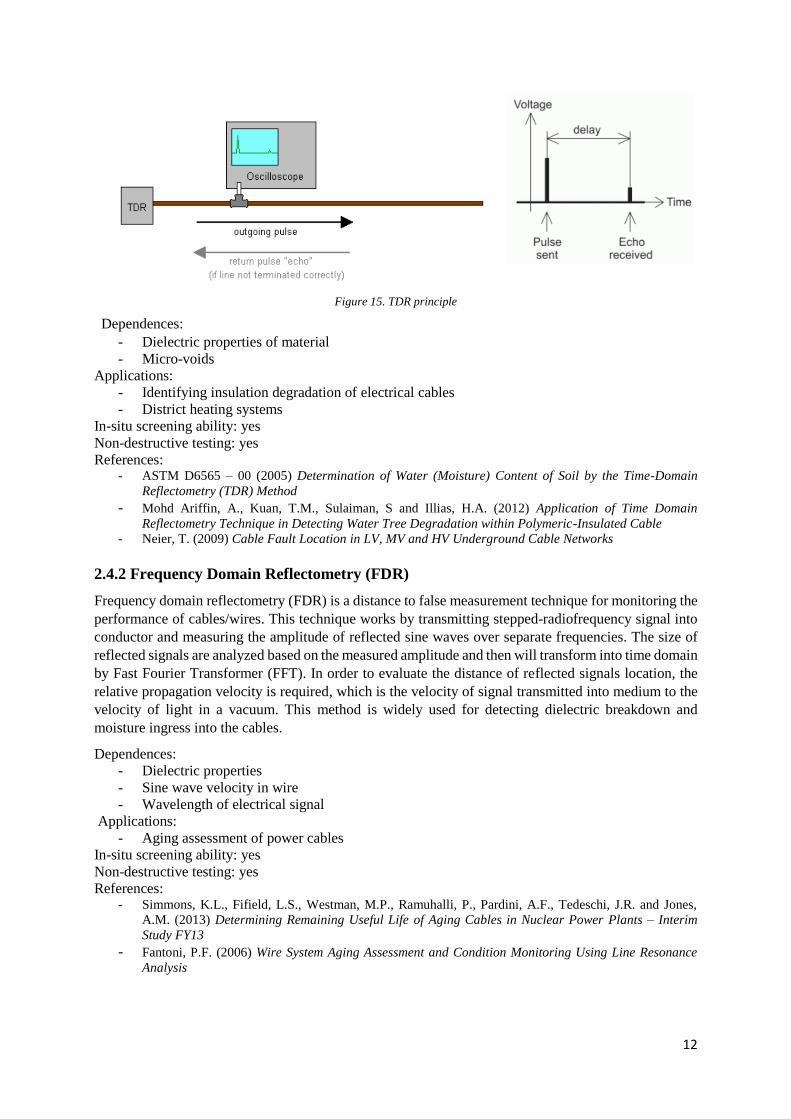
2.4.1 Time domain reflectometry (TDR)
Time domain reflectometry is an accurate NDT method for identifying and measuring dielectric
properties of transmission and distribution lines. In this method a pulse generator generates incident
electrical direct current (DC) signal over a conductor such as alarm wire in district heating system. The
measurement probe registers the reflected voltage if impedance mismatches are detected on the
conductor. Impedance mismatches will cause all or some of the transmitted signal to be sent back
towards the oscilloscope. The oscilloscope monitors the pulses that are generated from TDR. The
distance of discontinuity can also be determined by measuring the reflection time between reflected
impulse and pulse generator.
12
Figure 15. TDR principle
Dependences:
- Dielectric properties of material
- Micro-voids
Applications:
- Identifying insulation degradation of electrical cables
- District heating systems
In-situ screening ability: yes
Non-destructive testing: yes
References: - ASTM D6565 – 00 (2005) Determination of Water (Moisture) Content of Soil by the Time-Domain
Reflectometry (TDR) Method
- Mohd Ariffin, A., Kuan, T.M., Sulaiman, S and Illias, H.A. (2012) Application of Time Domain
Reflectometry Technique in Detecting Water Tree Degradation within Polymeric-Insulated Cable - Neier, T. (2009) Cable Fault Location in LV, MV and HV Underground Cable Networks
2.4.2 Frequency Domain Reflectometry (FDR)
Frequency domain reflectometry (FDR) is a distance to false measurement technique for monitoring the
performance of cables/wires. This technique works by transmitting stepped-radiofrequency signal into
conductor and measuring the amplitude of reflected sine waves over separate frequencies. The size of
reflected signals are analyzed based on the measured amplitude and then will transform into time domain
by Fast Fourier Transformer (FFT). In order to evaluate the distance of reflected signals location, the
relative propagation velocity is required, which is the velocity of signal transmitted into medium to the
velocity of light in a vacuum. This method is widely used for detecting dielectric breakdown and
moisture ingress into the cables.
Dependences:
- Dielectric properties
- Sine wave velocity in wire
- Wavelength of electrical signal
Applications:
- Aging assessment of power cables
In-situ screening ability: yes
Non-destructive testing: yes
References: - Simmons, K.L., Fifield, L.S., Westman, M.P., Ramuhalli, P., Pardini, A.F., Tedeschi, J.R. and Jones,
A.M. (2013) Determining Remaining Useful Life of Aging Cables in Nuclear Power Plants – Interim
Study FY13
- Fantoni, P.F. (2006) Wire System Aging Assessment and Condition Monitoring Using Line Resonance
Analysis

13
2.5 Voltage Response
This diagnostic technique is basically used to evaluate the moisture contents and aging degrees of power
transformer insulation. Degradation of insulation materials occurs due to ingress of moisture and oxygen
in process of time. This method is based on the measurement of decay voltage and return voltage curves
(Figure.13). To measure the return voltage curve different test cycles should be applied during the
measurement procedure. Each test cycle is divided to several phases. In the first phase the insulation is
charged up by a certain DC voltage for a long period of time (𝑡𝑐). In this condition the molecules of
insulation are excited and polarized via charging. In the second phase electrodes are discharged from
insolation by disconnecting the DC voltage (𝑡𝑑). Hence a decay voltage appears in the voltage curve
(Figure.13). The first slope of this curve is directly related to the conductivity of insulation material. The
next phase is related to return voltage measurement when no voltage is dropped across the circuit. The
slope of the return voltage curve represents the intensity of polarization. In this case the position of
polarized insulation is changed into free of charges state (primary state) and then a voltage originates
between dielectric electrodes.
Figure 16. Timing diagram of voltage response method
Dependences:
- Dielectric strength of insulation
Applications:
- Power cable
- Oil paper insulated cables
In-situ screening ability: yes
Non-destructive testing: yes
References:
- Nemeth, E. (1999) Measuring voltage response: a non-destructive diagnostic test method of HV
insulation - Tao, Z. and Jin-ding, C. (2008) Study on Voltage Response Method of Transformer Condition Assessment
- Tamus, Z.A. and Berta, I. (2010) Condition Assessment of Mixed Oil-paper and XLPE Insulated Cable
Lines by Voltage Response Method
2.6 Tan-Delta
In-service performance of insulated cables are decreased over certain period of time due to moister and
water ingress into the cables. Therefore, predicting remained service life and degradation condition of
insulation would be worthwhile. Tan Delta is a diagnostic technique which is utilized to evaluate
dielectric integrity and resistivity of insulated cables. In this method sinusoidal voltage with a very low
frequency (VLF) is applied to the cable through a voltage source. In case that no imperfections in
insulated cables are detected, the insulation behaves as a perfect capacitor. It means that the phase shift
between current and voltage becomes 90 degrees, because when the current is maximum, the voltage
has its minimum amount. Conversely, existence of any discontinuities in insulation case leads a shifted

14
phase between current and voltage which is normally less than 90 degrees. The loss angle 𝛿 indicates
the level of insulation defects and it measures by tangent of the angle 𝛿.
Figure 17. Basic principle of Tan Delta measurement
Dependencies:
- Dielectric properties of insulation
Applications:
- Electrical cables
In-situ screening ability: yes
Non-destructive testing: yes
References:
- Ponniran, A., Akmal Mohd. Jamail, N. and Jalaludin, N.A. (2009) Tan Delta and Capacitance
Characteristics of Underground XLPE Cables – 11 kV
2.7 Ground Penetrating Radar (GPR)
The GPR is a non-destructive technique based on transmission of high frequency electromagnetic waves
into the material under investigation. In geological engineering applications it is utilized for geophysical
surveying and monitoring disturbances in upper layers of soil via reflection of electromagnetic radiation.
Furthermore, in some cases it can also be applied in the field of civil engineering. For instance for
estimating internal concrete inhomogeneity and defects such as localization of reinforcement bars
corrosion, cracks, and voids dimensions. The GPR works by Ultra-wideband (UWB) technology and
emits very short pulses into the material via an antenna. The reflection of signals are then recorded in
the source of electromagnetic waves and displayed to the operator.
Dependencies:
- Electrical properties of the object such as dielectric constant and electrical conductivity
- Transmitting frequency from the antenna
Applications:
- Estimating moisture content in concrete
- Detecting reinforcement corrosion
- Geophysical surveying
- Detecting of pipelines and street surveying
In-situ screening ability: yes
Non-destructive testing: yes
References:
- ASTM D6432 – 11 (2011) Using the Surface Ground Penetrating Radar Method for Subsurface
Investigation

15
- Hong, S. (2014) GPR-Based Periodic Monitoring of Reinforcement Corrosion in Chloride-
Contaminated Concrete
- Yelf, R.J. (2007) Application of Ground Penetrating Radar to Civil and Geotechnical Engineering
Figure 18. Schematic principle of GPR
2.8 Infrared Thermography Test
Thermography analysis is based on the study and interpretation of thermal images. According to
radiation law of black body, all objects at temperature above absolute zero, emits electromagnetic
radiation with a specific wavelength. The infrared radiation emits from an object varies with temperature
changes. Infrared thermography can monitor this temperature changes by converting emitted radiation
into electrical signal. In this method thermographic devices detect infrared radiation from the
electromagnetic spectrum (wavelength between 9 -12 𝜇𝑚). For monitoring the thermal image in large
scale conditions such as leakage detection in district heating systems, the Airborne Thermography can
be utilized as an instrumental technique. The temperature profile of district heating leakages is measured
by the thermal camera for this method.
Figure 19. Leakage in an aerial thermal image
Dependences:
- Depth of the pipeline
- Temperature
- Size of the leakage
Applications:
- Electrical networks
- Heat loss in the insulated building and high temperature equipment
- Power plant machinery
- Detection of leakage location in district heating pipelines

16
In-situ screening ability: yes
Non-destructive testing: yes
References:
- ASTM E1934 − 99a (2014) Examining Electrical and Mechanical Equipment with Infrared
Thermography - Beard, J. (2007) Introduction to infrared thermography
- Friman, O., Follo, P., Ahlberg, J. and Sjökvist, S. (2009) Methods for Large-Scale Monitoring of District
Heating Systems Using Airborne Thermography
- Stockton, G.R. (2007) How aerial IR can be used as a NDT Tool for Asset Management
17
3 EVALUATION PHASE
In order to evaluate and prioritize the possible inspection abilities of above-suggested methods for
detecting chemical, physical and electrical changes in PUR after thermal aging, three phases are taken
into consideration.
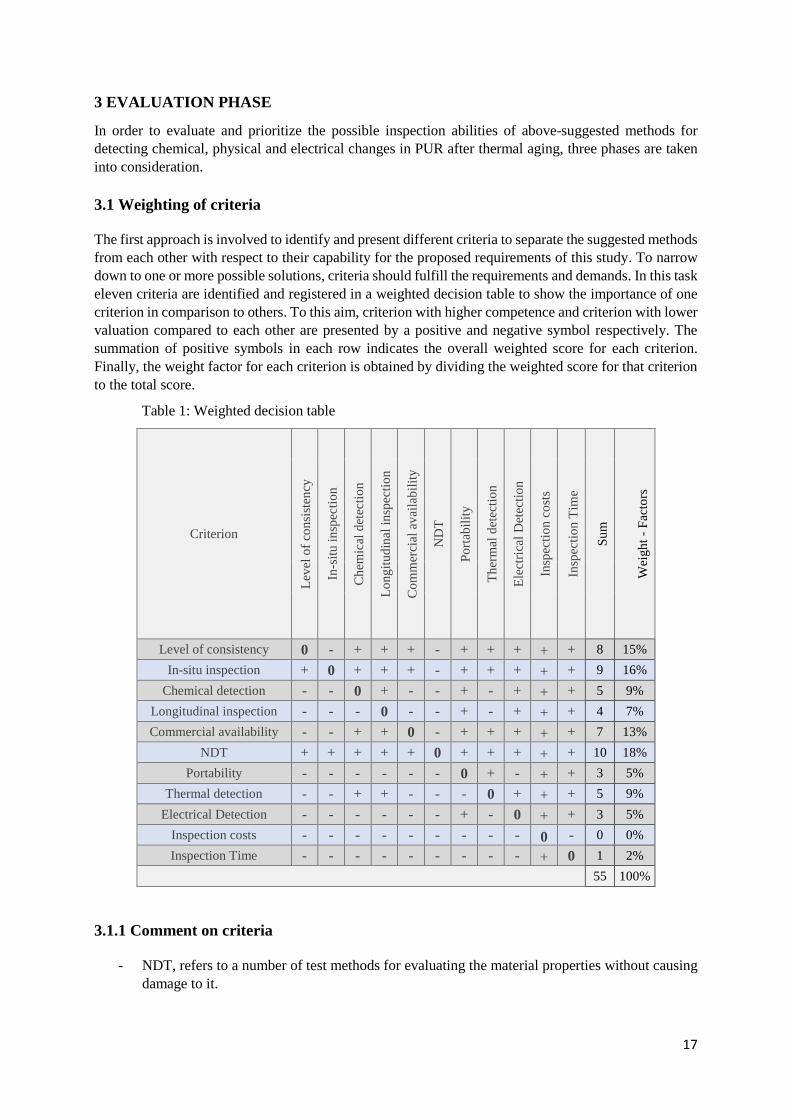
3.1 Weighting of criteria
The first approach is involved to identify and present different criteria to separate the suggested methods
from each other with respect to their capability for the proposed requirements of this study. To narrow
down to one or more possible solutions, criteria should fulfill the requirements and demands. In this task
eleven criteria are identified and registered in a weighted decision table to show the importance of one
criterion in comparison to others. To this aim, criterion with higher competence and criterion with lower
valuation compared to each other are presented by a positive and negative symbol respectively. The
summation of positive symbols in each row indicates the overall weighted score for each criterion.
Finally, the weight factor for each criterion is obtained by dividing the weighted score for that criterion
to the total score.
Table 1: Weighted decision table
Criterion
Lev
el o
f co
nsi
sten
cy
In-s
itu
in
spec
tio
n
Ch
emic
al d
etec
tio
n
Lo
ng
itu
din
al i
nsp
ecti
on
Co
mm
erci
al a
vai
lab
ilit
y
ND
T
Po
rtab
ilit
y
Th
erm
al d
etec
tio
n
Ele
ctri
cal
Det
ecti
on
Insp
ecti
on
co
sts
Insp
ecti
on
Tim
e
Su
m
Wei
gh
t -
Fac
tors
Level of consistency 0 - + + + - + + + + + 8 15%
In-situ inspection + 0 + + + - + + + + + 9 16%
Chemical detection - - 0 + - - + - + + + 5 9%
Longitudinal inspection - - - 0 - - + - + + + 4 7%
Commercial availability - - + + 0 - + + + + + 7 13%
NDT + + + + + 0 + + + + + 10 18%
Portability - - - - - - 0 + - + + 3 5%
Thermal detection - - + + - - - 0 + + + 5 9%
Electrical Detection - - - - - - + - 0 + + 3 5%
Inspection costs - - - - - - - - - 0 - 0 0%
Inspection Time - - - - - - - - - + 0 1 2%
55 100%
3.1.1 Comment on criteria
- NDT, refers to a number of test methods for evaluating the material properties without causing
damage to it.

18
- In-situ inspection, related to ability of methods to survive and work under different level of
outdoor environment.
- Level of consistency, is the inspection method compatibility to monitor degradation changes in
polyurethane.
- Longitudinal inspection, is the ability of methods to inspect the status along tested element from
a single access point.
- Inspection costs, is defined by all costs related to the inspection process, such as work cost,
transports, etc.
- Thermal detection, is related to the methods which are capable for scanning thermal properties
of tested element.
- Chemical detection, is related to the methods which are capable for scanning chemical
properties of the tested element.
- Electrical detection, is related to the methods which are capable for scanning electrical
properties of the tested element.
- Commercial availability, means the equipment availability of methods in market.
- Inspection time, refers to scanning duration time needed for material testing.
3.1.2 Description of weighted decision table
As observed in table 1 prioritized criterion is nondestructive testing, meaning that during the inspection
process the suggested methods shouldn’t damage the casing layer of insulated pipes. It is also significant
to determine whether the detecting methods are capable for field inspection. A laboratory testing method
would be worthless in this task. Moreover, in order to evaluate the degree of compatibility, the methods
should provide sufficient level of consistency to monitor thermal aging changes in polyurethane. As it
is shown in the table some of the criteria have equal weight-factor which means that there is a room for
further development of the final suggested method concept. The inspection cost is placed in the lowest
rank at this level of investigation.
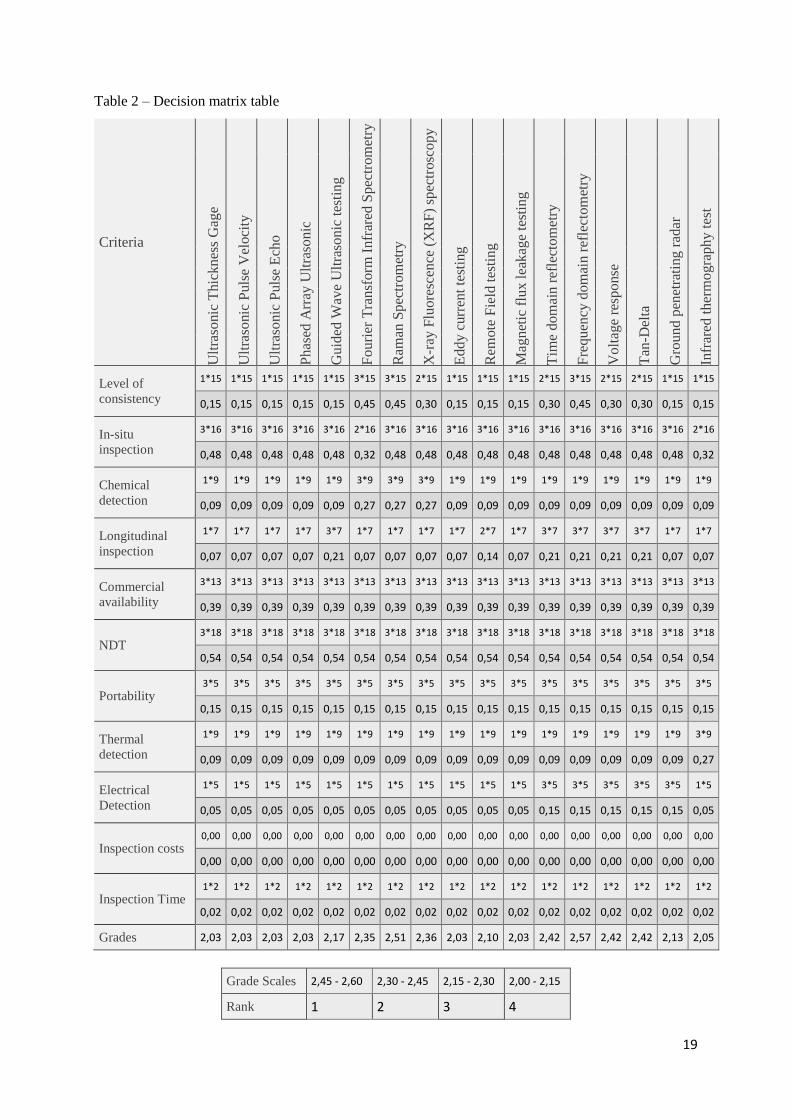
3.2 Weighting of methods
In this section to grade and rank the methods a decision matrix table is developed by means of presented
weight factors at part 3.1. The methods are given a rating scale from 1 to 3 according to their relative
compatibility with criteria. Thus, rating scale 1 indicates lowest relative compatibility level, rating scale
2 indicates medium relative compatibility level and rating scale 3 shows the highest level. The rank of
each method is obtained by multiplying the rating to weight factors for that criterion and summing up
scores across each column. Consequently, methods with highest score are expected to be more capable
for the purpose of this study. In some methods, due to lack of adequate testing information on polymeric
materials, only one point is assigned during the evaluation.
19
Table 2 – Decision matrix table
Criteria
Ult
raso
nic
Thic
kn
ess
Gag
e
Ult
raso
nic
Puls
e V
eloci
ty
Ult
raso
nic
Puls
e E
cho
Ph
ased
Arr
ay U
ltra
son
ic
Gu
ided
Wav
e U
ltra
son
ic t
esti
ng
Fo
uri
er T
ran
sform
In
frar
ed S
pec
trom
etry
Ram
an S
pec
trom
etry
X-r
ay F
luore
scen
ce (
XR
F)
spec
trosc
op
y
Ed
dy
curr
ent
test
ing
Rem
ote
Fie
ld t
esti
ng
Mag
net
ic f
lux
lea
kag
e te
stin
g
Tim
e d
om
ain
ref
lect
om
etry
Fre
qu
ency
dom
ain
ref
lect
om
etry
Vo
ltag
e re
spo
nse
Tan
-Del
ta
Gro
un
d p
enet
rati
ng
rad
ar
Infr
ared
th
erm
ogra
ph
y t
est
Level of
consistency
1*15 1*15 1*15 1*15 1*15 3*15 3*15 2*15 1*15 1*15 1*15 2*15 3*15 2*15 2*15 1*15 1*15
0,15 0,15 0,15 0,15 0,15 0,45 0,45 0,30 0,15 0,15 0,15 0,30 0,45 0,30 0,30 0,15 0,15
In-situ
inspection
3*16 3*16 3*16 3*16 3*16 2*16 3*16 3*16 3*16 3*16 3*16 3*16 3*16 3*16 3*16 3*16 2*16
0,48 0,48 0,48 0,48 0,48 0,32 0,48 0,48 0,48 0,48 0,48 0,48 0,48 0,48 0,48 0,48 0,32
Chemical
detection
1*9 1*9 1*9 1*9 1*9 3*9 3*9 3*9 1*9 1*9 1*9 1*9 1*9 1*9 1*9 1*9 1*9
0,09 0,09 0,09 0,09 0,09 0,27 0,27 0,27 0,09 0,09 0,09 0,09 0,09 0,09 0,09 0,09 0,09
Longitudinal
inspection
1*7 1*7 1*7 1*7 3*7 1*7 1*7 1*7 1*7 2*7 1*7 3*7 3*7 3*7 3*7 1*7 1*7
0,07 0,07 0,07 0,07 0,21 0,07 0,07 0,07 0,07 0,14 0,07 0,21 0,21 0,21 0,21 0,07 0,07
Commercial
availability
3*13 3*13 3*13 3*13 3*13 3*13 3*13 3*13 3*13 3*13 3*13 3*13 3*13 3*13 3*13 3*13 3*13
0,39 0,39 0,39 0,39 0,39 0,39 0,39 0,39 0,39 0,39 0,39 0,39 0,39 0,39 0,39 0,39 0,39
NDT 3*18 3*18 3*18 3*18 3*18 3*18 3*18 3*18 3*18 3*18 3*18 3*18 3*18 3*18 3*18 3*18 3*18
0,54 0,54 0,54 0,54 0,54 0,54 0,54 0,54 0,54 0,54 0,54 0,54 0,54 0,54 0,54 0,54 0,54
Portability 3*5 3*5 3*5 3*5 3*5 3*5 3*5 3*5 3*5 3*5 3*5 3*5 3*5 3*5 3*5 3*5 3*5
0,15 0,15 0,15 0,15 0,15 0,15 0,15 0,15 0,15 0,15 0,15 0,15 0,15 0,15 0,15 0,15 0,15
Thermal
detection
1*9 1*9 1*9 1*9 1*9 1*9 1*9 1*9 1*9 1*9 1*9 1*9 1*9 1*9 1*9 1*9 3*9
0,09 0,09 0,09 0,09 0,09 0,09 0,09 0,09 0,09 0,09 0,09 0,09 0,09 0,09 0,09 0,09 0,27
Electrical
Detection
1*5 1*5 1*5 1*5 1*5 1*5 1*5 1*5 1*5 1*5 1*5 3*5 3*5 3*5 3*5 3*5 1*5
0,05 0,05 0,05 0,05 0,05 0,05 0,05 0,05 0,05 0,05 0,05 0,15 0,15 0,15 0,15 0,15 0,05
Inspection costs 0,00 0,00 0,00 0,00 0,00 0,00 0,00 0,00 0,00 0,00 0,00 0,00 0,00 0,00 0,00 0,00 0,00
0,00 0,00 0,00 0,00 0,00 0,00 0,00 0,00 0,00 0,00 0,00 0,00 0,00 0,00 0,00 0,00 0,00
Inspection Time 1*2 1*2 1*2 1*2 1*2 1*2 1*2 1*2 1*2 1*2 1*2 1*2 1*2 1*2 1*2 1*2 1*2
0,02 0,02 0,02 0,02 0,02 0,02 0,02 0,02 0,02 0,02 0,02 0,02 0,02 0,02 0,02 0,02 0,02
Grades 2,03 2,03 2,03 2,03 2,17 2,35 2,51 2,36 2,03 2,10 2,03 2,42 2,57 2,42 2,42 2,13 2,05
Grade Scales 2,45 - 2,60 2,30 - 2,45 2,15 - 2,30 2,00 - 2,15
Rank 1 2 3 4

20
3.3 Argumentation and results
The outcome of the decision matrix table reveals that the most possible solutions for this task are
Frequency domain Reflectometry and Raman Spectrometry method respectively. In this table some
methods gain equal scores due to their characteristic similarity with presented criteria. Therefore, to
distinguish these methods from each other further investigation and laboratory testing is required. It is
also needed to mention that the best and suitable NDT inspection method is far from fully developed at
this investigation level. Although the results from the evaluation phase give a general indication of how
these methods differentiate. In order to extend Frequency domain Reflectometry to a most appropriate
technique for pre insulated pipe system the inspection capabilities and limitations of this method should
be recognized in greater specifications.
4 CONCLUSION
To find out an appropriate method for remote detection of chemical, electrical and thermal properties of
PUR after thermal degradation, different NDT methods for different approaches are studied briefly.
From the evaluation phase, Frequency domain Reflectometry and Raman Spectrometry methods have
highest inspection capabilities regarding to proposed requirements. However, the test data concerning
the accuracy of these methods for PUR inspection is inadequate. Therefore, further research and
laboratory test are required both on aged and unaged polyurethane foam to realize the critical destructive
aging factors. For instance thermal conductivity could be introduced as a destructive factor of the PUR
because it increases significantly during the aging process. Nevertheless, no well-defined NDT
thermography methods are capable for this aim.

21
5 REFERENCES
ASTM C597 – 9 (2009) Pulse Velocity through Concrete
ASTM D5477 − 11 (2011) Identification of Polymer Layers or Inclusions by Fourier Transform Infrared
Microspectroscopy (FT-IR)
ASTM D6132 – 13 (2013) Nondestructive Measurement of Dry Film Thickness of Applied Organic Coatings
Using an Ultrasonic Coating Thickness Gage
ASTM D6432 – 11 (2011) Using the Surface Ground Penetrating Radar Method for Subsurface Investigation
ASTM D6565 – 00 (2005) Determination of Water (Moisture) Content of Soil by the Time-Domain
Reflectometry (TDR) Method
ASTM E114 – 10 (2010) Ultrasonic Pulse-Echo Straight-Beam Contact Testing
ASTM E1840 – 96 (2014) Raman Shift Standards for Spectrometer Calibration
ASTM E1934 − 99a (2014) Examining Electrical and Mechanical Equipment with Infrared Thermography
ASTM E2096/E2096M – 10 (2010) In Situ Examination of Ferromagnetic Heat-Exchanger Tubes Using
Remote Field Testing
ASTM E2491 – 13 (2013) Evaluating Performance Characteristics of Phased-Array Ultrasonic Testing
Instruments and Systems
ASTM E2775 – 11 (2011) Guided Wave Testing of Above Ground Steel Pipework Using Piezoelectric Effect
Transduction
ASTM E309 − 11 (2011) Eddy-Current Examination of Steel Tubular Products Using Magnetic Saturation
ASTM E570 – 15 (2015) Flux Leakage Examination of Ferromagnetic Steel Tubular Product
Beard, J. (2007) Introduction to infrared thermography
Ciorau, P. and Pullia, L. (2007) How Reliable is Your Call? OPG Phased Array Ultrasonic Inspection
Experience on Siemens- Parson Turbine Blade Roots 2001-2007
Cobb, D. (2009) Study on the Effectiveness, Precision, and Reliability of X-ray Fluorescence Spectrometry
and Other Alternative Methods for Measuring Lead in Paint Fantoni, P.F. (2006) Wire System Aging Assessment and Condition Monitoring Using Line Resonance
Analysis
Friman, O., Fallo, P., Ahlberg, J. and Sjökvist, S. (2014) Methods for Large-Scale Monitoring of District
Heating Systems Using Airborne Thermography
Friman, O., Follo, P., Ahlberg, J. and Sjökvist, S. (2009) Methods for Large-Scale Monitoring of District
Heating Systems Using Airborne Thermography
Guidebook on non-destructive testing of concrete structures (2002) International Atomic Energy Agency,
Vienna
Guoli Wang, Y.H., Jia, Z. and Xie, H. (2005) Application of Ultrasonic Pulse-echo Method to Insulation
Condition Diagnosis for Large Generators
Hong, S. (2014) GPR-Based Periodic Monitoring of Reinforcement Corrosion in Chloride- Contaminated
Concrete
IAEA - Eddy Current Testing at Level 2: Manual for the Syllabi Contained IAEA-TECDOC-628/Rev. 2
‘Training Guidelines for Non-Destructive Testing Techniques’
Kręcielewska, E. and Menard, D. (2014) Thermal conductivity coefficient of PUR insulation material from
pre-insulated pipes after real operation on district heating networks and after artificial ageing process in heat
chamber
Meier, J.H. (1969) Ultrasonic Thickness Gage
Mohd Ariffin, A., Kuan, T.M., Sulaiman, S and Illias, H.A. (2012) Application of Time Domain Reflectometry
Technique in Detecting Water Tree Degradation within Polymeric-Insulated Cable
Neier, T. (2009) Cable Fault Location in LV, MV and HV Underground Cable Networks
Nemeth, E. (1999) Measuring voltage response: a non-destructive diagnostic test method of HV insulation
22
Pearson, N. (2012) Discrimination of top and bottom discontinuities with MFL and the Surface Topology Air-
gap Reluctance System (STARS)
Peike, C., Kaltenbach, T., Weis, K.A. and Koehl, M. (2011) Non-destructive degradation analysis of
encapsulants in PV modules by Raman Spectroscopy
Perzzon, C. (2015) Predicting the Long-Term Insulation Performance of District Heating Pipes
Ponniran, A., Akmal Mohd. Jamail, N. and Jalaludin, N.A. (2009) Tan Delta and Capacitance Characteristics
of Underground XLPE Cables – 11 kV
Rogovin, D. and Lofaro, R. (2005) Evaluation of the Broadband Impedance Spectroscopy
Prognostic/Diagnostic Technique for Electric Cables Used in Nuclear Power Plants
RUSSELL, D. and Shen, V. (2008) Increased Use of Remote Field Technology for In-Line Inspection of
Pipelines Proves the Value of the Technology for this application
Sadek, H.M. (2006) NDE technologies for the examination of heat exchangers and boiler tubes – principles,
advantages and limitations
Seguchi, T., Tamura, K., Ohshima, T., Shimada, A. and Kudoh, H (2010) Degradation mechanisms of cable
insulation materials during radiation– thermal ageing in radiation environment
Simmons, K.L., Fifield, L.S., Westman, M.P., Ramuhalli, P., Pardini, A.F., Tedeschi, J.R. and Jones, A.M.
(2013) Determining Remaining Useful Life of Aging Cables in Nuclear Power Plants – Interim Study FY13
Sonia, D. (2010) Propagation of guided waves in a hollow circular cylinder application to nondestructive
testing
SS-EN 253 Standard (2009) District heating pipes – Pre insulated bonded pipe systems for directly buried hot
water networks - Pipe assembly of steel service pipe, polyurethane thermal insulation and outer casing of
polyethylene - Swedish standards institute
Stockton, G.R. (2007) How aerial IR can be used as a NDT Tool for Asset Management
Tamus, Z.A. and Berta, I. (2010) Condition Assessment of Mixed Oil-paper and XLPE Insulated Cable Lines
by Voltage Response Method
Tao, Z. and Jin-ding, C. (2008) Study on Voltage Response Method of Transformer Condition Assessment
Veitmann, M., Jumeau, R., Bourson, P., Ferriol, M. and Lahure, F. (2014) Understanding and Control of High
Temperature Oxidation Flaws of Low-Density Poly (ethylene) with Raman Spectroscopy
Verma, H.R. (2007) Atomic and Nuclear Analytical methods - X-ray Fluorescence (XRF) and Particle-
Induced X-ray Emission (PIXE)
Xu, J., Wu, X., Cheng, C. and Den, A. (2012) A Magnetic Flux Leakage and Magnetostrictive Guided Wave
Hybrid Transducer for Detecting Bridge Cables
Yelf, R.J. (2007) Application of Ground Penetrating Radar to Civil and Geotechnical Engineering
Zhang, L. (2014) A Multi-channel Transmitter System for NDT Pipeline Testing using Guided Waves
Ultrasound