introduction - rice university - andrew r....
TRANSCRIPT
Introduction
History Very brief history of technique
Discovery; when it came into use Use today
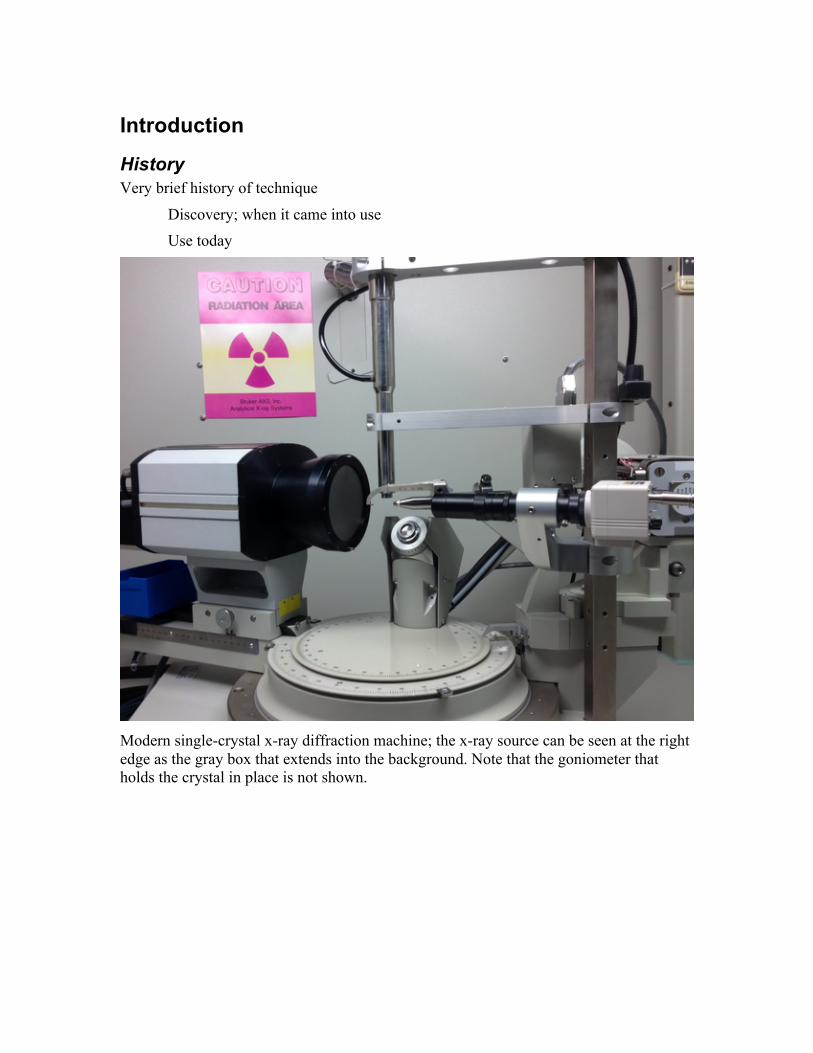
Modern single-crystal x-ray diffraction machine; the x-ray source can be seen at the right edge as the gray box that extends into the background. Note that the goniometer that holds the crystal in place is not shown.
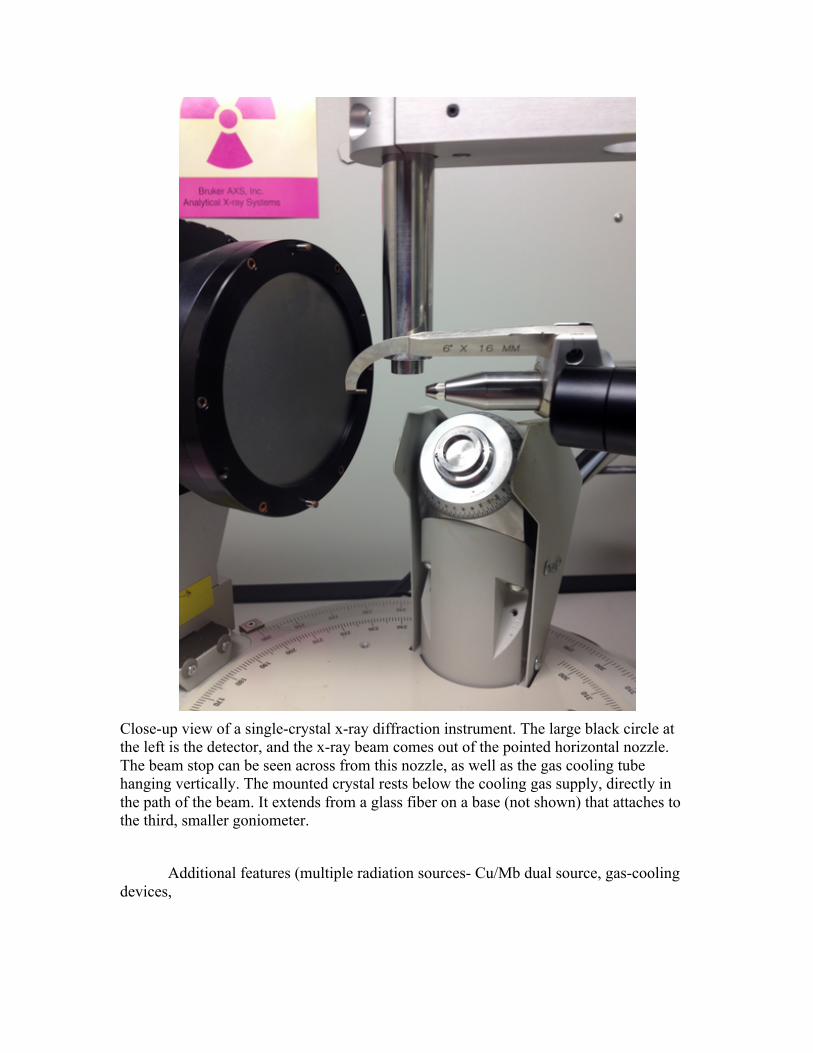
Close-up view of a single-crystal x-ray diffraction instrument. The large black circle at the left is the detector, and the x-ray beam comes out of the pointed horizontal nozzle. The beam stop can be seen across from this nozzle, as well as the gas cooling tube hanging vertically. The mounted crystal rests below the cooling gas supply, directly in the path of the beam. It extends from a glass fiber on a base (not shown) that attaches to the third, smaller goniometer.
Additional features (multiple radiation sources- Cu/Mb dual source, gas-cooling devices,
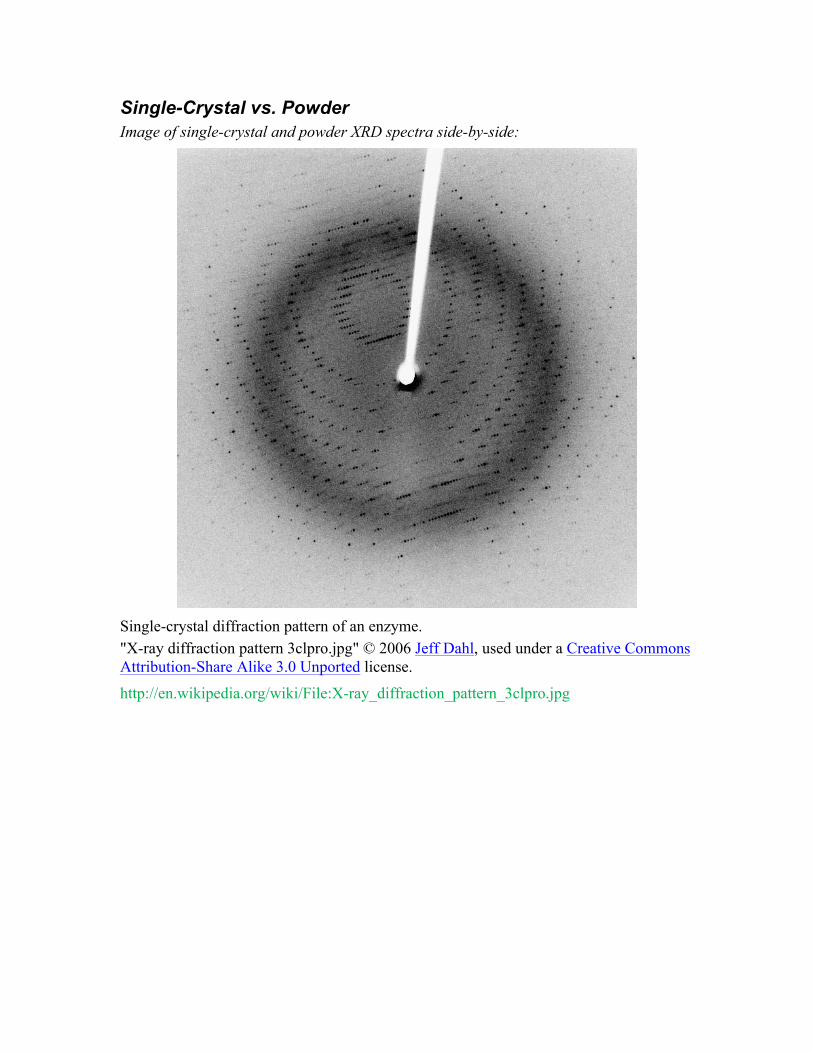
Single-Crystal vs. Powder Image of single-crystal and powder XRD spectra side-by-side:
Single-crystal diffraction pattern of an enzyme. "X-ray diffraction pattern 3clpro.jpg" © 2006 Jeff Dahl, used under a Creative Commons Attribution-Share Alike 3.0 Unported license.
http://en.wikipedia.org/wiki/File:X-ray_diffraction_pattern_3clpro.jpg
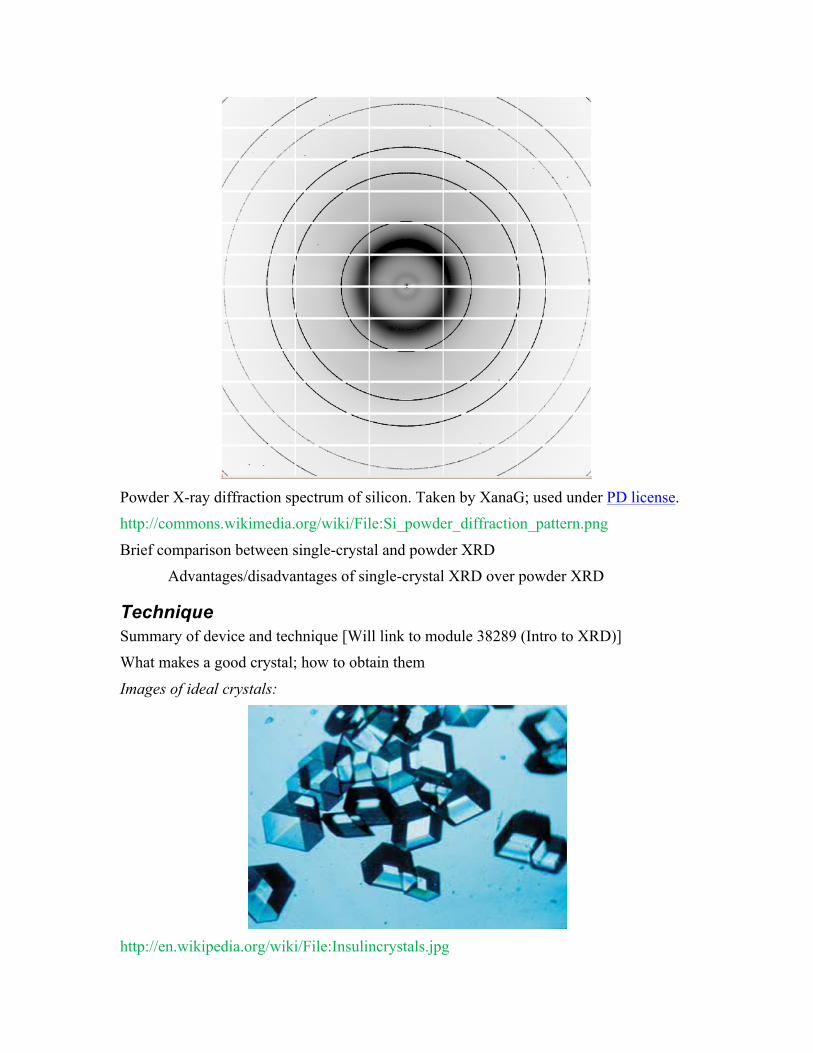
Powder X-ray diffraction spectrum of silicon. Taken by XanaG; used under PD license. http://commons.wikimedia.org/wiki/File:Si_powder_diffraction_pattern.png
Brief comparison between single-crystal and powder XRD Advantages/disadvantages of single-crystal XRD over powder XRD
Technique Summary of device and technique [Will link to module 38289 (Intro to XRD)] What makes a good crystal; how to obtain them
Images of ideal crystals:
http://en.wikipedia.org/wiki/File:Insulincrystals.jpg
Single crystals of insulin, grown in space; taken by NASA. Released under PD license.
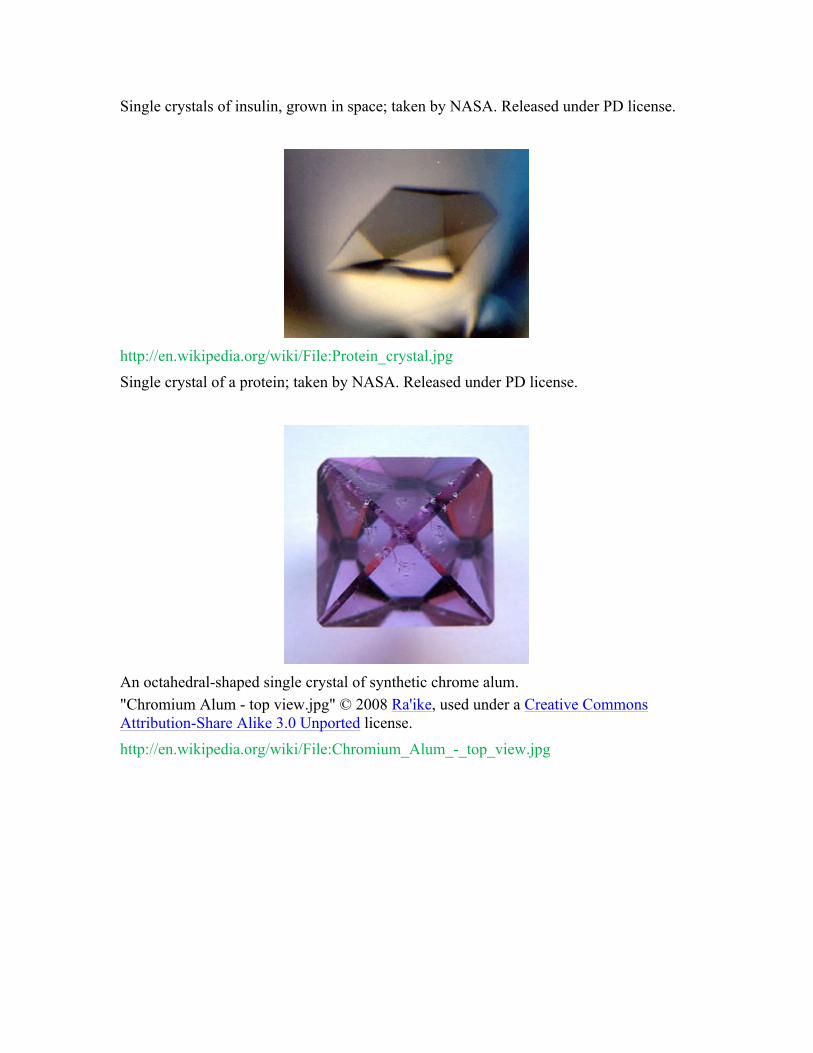
http://en.wikipedia.org/wiki/File:Protein_crystal.jpg Single crystal of a protein; taken by NASA. Released under PD license.
An octahedral-shaped single crystal of synthetic chrome alum. "Chromium Alum - top view.jpg" © 2008 Ra'ike, used under a Creative Commons Attribution-Share Alike 3.0 Unported license. http://en.wikipedia.org/wiki/File:Chromium_Alum_-_top_view.jpg

Single FeSi crystal showing long bar morphology. Cropped from image by Paul Canfield, released under PD license.
http://core.materials.ac.uk/search/detail.php?id=3740
Explanation Explanation of data and parameters for (single-crystal) XRD Figure of a typical report of XRD data [Imitate a publication to generate a mock table for NaCl?] Line-by-line discussion of each element of the reported data:
General information about the crystal analyzed
how it was obtained size
chemical formula and weight crystal system
[link to module 16927 (Crystal Structure)] space group
unit-cell parameters (dimensions, angles, volume) Image for unit cell parameters:
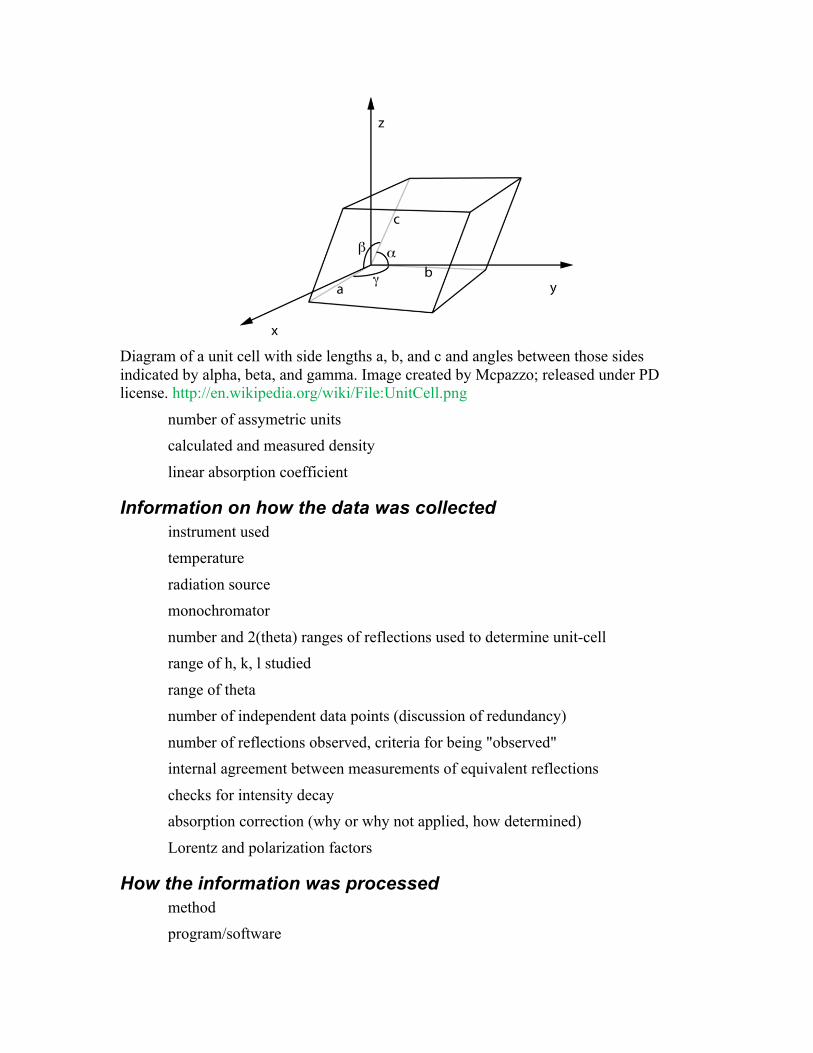
Diagram of a unit cell with side lengths a, b, and c and angles between those sides indicated by alpha, beta, and gamma. Image created by Mcpazzo; released under PD license. http://en.wikipedia.org/wiki/File:UnitCell.png
number of assymetric units calculated and measured density
linear absorption coefficient
Information on how the data was collected instrument used temperature
radiation source monochromator
number and 2(theta) ranges of reflections used to determine unit-cell range of h, k, l studied
range of theta number of independent data points (discussion of redundancy)
number of reflections observed, criteria for being "observed" internal agreement between measurements of equivalent reflections
checks for intensity decay absorption correction (why or why not applied, how determined)
Lorentz and polarization factors
How the information was processed method program/software

Conclusion
Summary of what has been learned
Bibliography