introduction - state of oregon : oregon.gov home page : … · web viewa new fish tank must rest...
TRANSCRIPT

Next Generation Science Standards (NGSS) Cluster/Item Specifications
IntroductionThis document presents cluster specifications for use with the Next Generation Science Standards (NGSS). These standards are based on the Framework for K-12 Science Education. The present document is not intended to replace the standards, but rather to present guidelines for the development of items and item clusters used to measure those standards.
The remainder of this section provides a very brief introduction to the standards and the framework, an overview of the design and intent of the item clusters, and a description of the cluster specifications that follow. The bulk of the document is composed of cluster specifications, organized by grade and standard.
Background on the framework and standardsThe Framework for K-12 Science Education is organized around three core dimensions of scientific understanding. The standards are derived from these same dimensions:
Disciplinary Core Ideas
The fundamental ideas that are necessary for understanding a given science discipline. The core ideas all have broad importance within or across science or engineering disciplines, provide a key tool for understanding or investigating complex ideas and solving problems, relate to societal or personal concerns, and can be taught over multiple grade levels at progressive levels of depth and complexity.
Science and Engineering Practices
The practices are what students do to make sense of phenomena. They are both a set of skills and a set of knowledge to be internalized. The SEPs (Science and Engineering Practices) reflect the major practices that scientists and engineers use to investigate the world and design and build systems.
Cross-Cutting Concepts
These are concepts that hold true across the natural and engineered world. Students can use them to make connections across seemingly disparate disciplines or situations, connect new learning to prior experiences, and more deeply engage with material across the other dimensions. The NGSS requires that students explicitly use their understanding of the CCCs to make sense of phenomena or solve problems.
There is substantial overlap between and among the three dimensions
For example, the cross-cutting concepts are echoed in many of the disciplinary core ideas. The core ideas are often closely intertwined with the practices. This overlap reflects the nature of science itself. For example, we often come to understand and communicate causal relationships by employing models to make sense of observations. Even within a dimension, overlap exists. Quantifying characteristics of phenomena is important in developing an understanding of them, so employing computational and mathematical thinking in the construction and use of models is a very common scientific practice, and one of the cross-cutting concepts suggests that scientists often infer causality by observing patterns. In short, the dimensions are not orthogonal.
The framework envisions effective science education as occurring at the intersection of these interwoven dimensions: students learn science by doing science; applying the practices through the lens of the cross-cutting concepts to investigate phenomena that relate to the content of the disciplinary core ideas.
NGSS Cluster/Item Specifications October 2017 2

Item clustersEach item cluster is designed to engage the examinee in a grade-appropriate, meaningful scientific activity aligned to a specific standard.
Each cluster begins with a phenomenon, an observable fact or design problem that engages student interest and can be explained, modeled, investigated, or designed using the knowledge and skill described by the standard in question.
What it means to be observable varies across practices. For example, a phenomenon for a performance expectation exercising the analyze data practice may be observable through regularities in a data set, while standards related to the development and use of models might be something that can be watched, seen, felt, smelled, or heard.
What it means to be observable also varies across grade levels. For example, elementary-level phenomena are very concrete and directly observable. At the high school level, an observation of the natural world may be more abstract: for example, “observing” changes in the chemical composition of cells through the observation of macroscopic results of those changes on organism physiology, or through the measurement of system- or organ-level indications.
Content limits refine the intent of the performance expectations and provide limits on what may be asked of items in the cluster to structure the student activity. The content limits also reflect the disciplinary core ideas learning progressions that are present in the K-12 Framework for Science Education.
The task or goal should be explicitly stated in the stimulus or the first item in the cluster: statements such as “In the questions that follow, you will develop a model that will allow you to identify moons of Jupiter,” or “In the questions below, you will complete a model to describe the processes that lead to the steam coming out of the teapot.”
Whereas item clusters have been described elsewhere as “scaffolded,” they are better described as providing structure to the task. For example, some clusters begin with students summarizing data to discover patterns that may have explanatory value. Depending on the grade level and nature of the standard, items may provide complete table shells or labeled graphs to be drawn, or may require the student to choose what to tabulate or graph. Subsequent items may ask the student to note patterns in the tabulated or graphed data and draw on domain content knowledge to posit explanations for the patterns.
These guidelines for clusters do not appear separately in the specifications. Rather, they apply to all clusters.
Structure of the cluster specificationsThe item cluster specifications are designed to guide the work of item writers and the review of item clusters by stakeholders.
Each item cluster has the following elements:
The text of the performance expectations, including the practice, core idea, and cross-cutting concept.
Content limits, which refine the intent of the performance expectations and provide limits of what may be asked of examinees. For example, they may identify the specific formulae that students are expected to know or not know.
Vocabulary, which identifies the relevant technical words that students are expected to know, and related words that they are explicitly not expected to know. Of course, the latter category should not be considered exhaustive, since the boundaries of relevance are ambiguous, and the list is limited by the imagination of the writers.
Sample phenomena, which provide some examples of the sort of phenomena that would support effective item clusters related to the standard in question. In general, these should be guideposts, and item writers
NGSS Cluster/Item Specifications October 2017 3

should seek comparable phenomena, rather than drawing on those within the documents. Novelty is valued when applying scientific practices.
Task demands comprise the heart of the specifications. These statements identify the types of items and activities that item writers should use, and each item written should be clearly linked to one or more of the demands. The verbs in the demands (e.g., select, identify, illustrate, describe) provide guidance on the types of interactions that item writers might employ to elicit the student response. We avoid explicitly identifying interaction types or item formats to accommodate future innovations and to avoid discouraging imaginative work by the item writers.
For each cluster we present, the printed documentation includes the cluster, the task demands represented by each item, and its linkage to the practice and cross-cutting concept identified in the performance expectation.
Item cluster specifications follow, organized by grade and standard.
NGSS Cluster/Item Specifications October 2017 4

Performance Expectation 3-ESS2-2Obtain and combine information to describe climates in different regions of the world.
DimensionsObtaining, Evaluating, and Communicating Information Obtain and combine information from books and other reliable media to explain phenomena.
ESS2.D: Weather and Climate Climate describes a range of an area’s typical weather conditions and the extent to which those conditions vary
over years.Patterns Patterns of change can be used to make predictions.
Clarifications and Content LimitsContent Limits
Students do not need to know Complex interactions that cause weather patterns and climate The role of the water cycle in weather.
Science Vocabulary Students Are Expected to Know Prediction Precipitation Glacier Ocean Region Climate Weather Typical
Vegetation Latitude Longitude Drought Temperature Freeze Atmosphere
Science Vocabulary Students Are Not Expected to Know Average High/low pressure Air mass Altitude
Humidity Radiation Water cycle.
PhenomenaSome example phenomena for 3-ESS2-2:
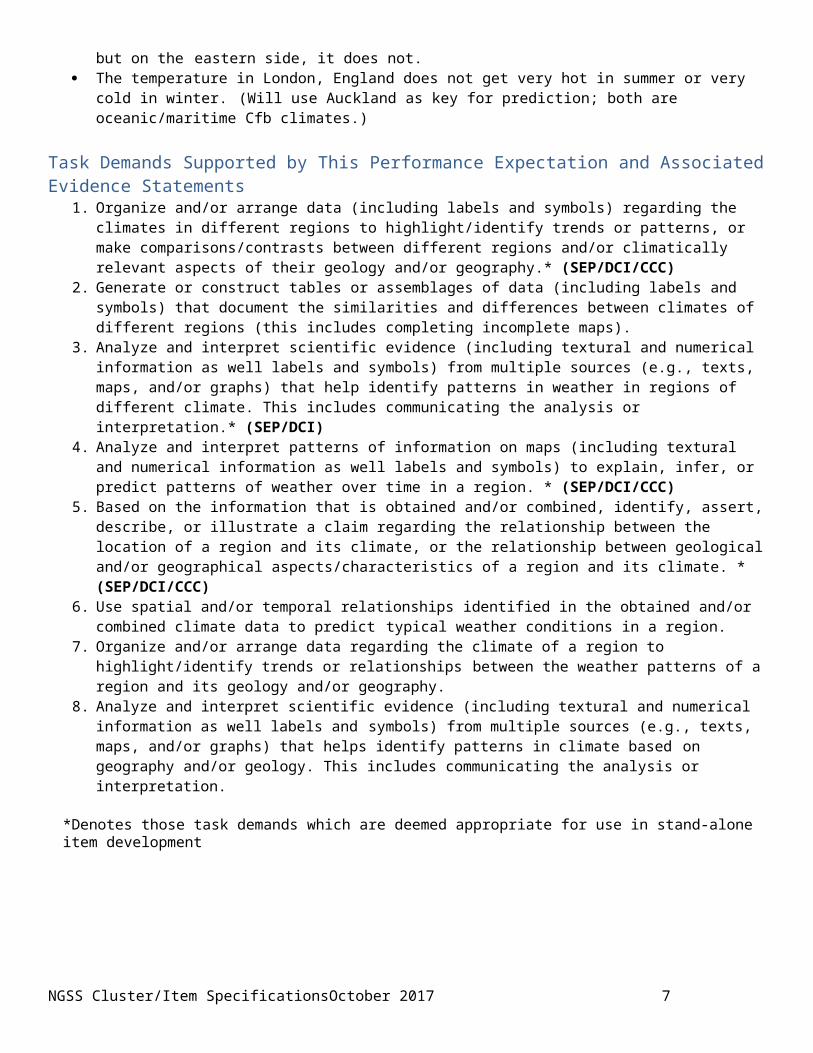
Anchorage, Alaska has cool summers and very cold winters with a lot of snowfall. It often snows in Colorado in July, but it does not often snow in Kansas in July. On the western side of the Cascade Mountains of Oregon, it rains frequently, but on the eastern side, it does
not. The temperature in London, England does not get very hot in summer or very cold in winter. (Will use Auckland
as key for prediction; both are oceanic/maritime Cfb climates.)
Task Demands Supported by This Performance Expectation and Associated Evidence Statements1. Organize and/or arrange data (including labels and symbols) regarding the climates in different regions to
highlight/identify trends or patterns, or make comparisons/contrasts between different regions and/or climatically relevant aspects of their geology and/or geography.* (SEP/DCI/CCC)
NGSS Cluster/Item Specifications October 2017 5

2. Generate or construct tables or assemblages of data (including labels and symbols) that document the similarities and differences between climates of different regions (this includes completing incomplete maps).
3. Analyze and interpret scientific evidence (including textural and numerical information as well labels and symbols) from multiple sources (e.g., texts, maps, and/or graphs) that help identify patterns in weather in regions of different climate. This includes communicating the analysis or interpretation.* (SEP/DCI)
4. Analyze and interpret patterns of information on maps (including textural and numerical information as well labels and symbols) to explain, infer, or predict patterns of weather over time in a region. * (SEP/DCI/CCC)
5. Based on the information that is obtained and/or combined, identify, assert, describe, or illustrate a claim regarding the relationship between the location of a region and its climate, or the relationship between geological and/or geographical aspects/characteristics of a region and its climate. * (SEP/DCI/CCC)
6. Use spatial and/or temporal relationships identified in the obtained and/or combined climate data to predict typical weather conditions in a region.
7. Organize and/or arrange data regarding the climate of a region to highlight/identify trends or relationships between the weather patterns of a region and its geology and/or geography.
8. Analyze and interpret scientific evidence (including textural and numerical information as well labels and symbols) from multiple sources (e.g., texts, maps, and/or graphs) that helps identify patterns in climate based on geography and/or geology. This includes communicating the analysis or interpretation.
*Denotes those task demands which are deemed appropriate for use in stand-alone item development
NGSS Cluster/Item Specifications October 2017 6
Performance Expectation 3-LS2-1Construct an argument that some animals form groups that help members survive.
DimensionsEngaging in Arguments from Evidence Construct an argument with evidence, data, and/or a model.
LS2.D: Social Interactions and Group Behavior Being part of a group helps animals obtain food, defend themselves, and cope with changes. Groups may serve
different functions and vary dramatically in size.Cause and Effect Cause and effect relationships are routinely identified and used to explain change.
Clarifications and Content LimitsClarification Statement: Focus is on how being part of a group helps animals obtain food, defend themselves, and cope with changes,
and does not cover how group behavior evolved as a result of a survival advantage.Content Limits: Assessment does not include the evolution of group behavior.
Students do not need to know: Social hierarchy in animal groups (pecking order, dominance, submissive, altruism)
Science Vocabulary Students Are Expected to Know Environment Survive/survival Prey Predator Characteristic Habitat Species Group behavior
Herd Inherit Trait Diet Mate Parent Color
Science Vocabulary Students Are Not Expected to Know Organism Social Relative Predation Gene/genetic Hereditary Harmful Beneficial Variation Probability Adaptation
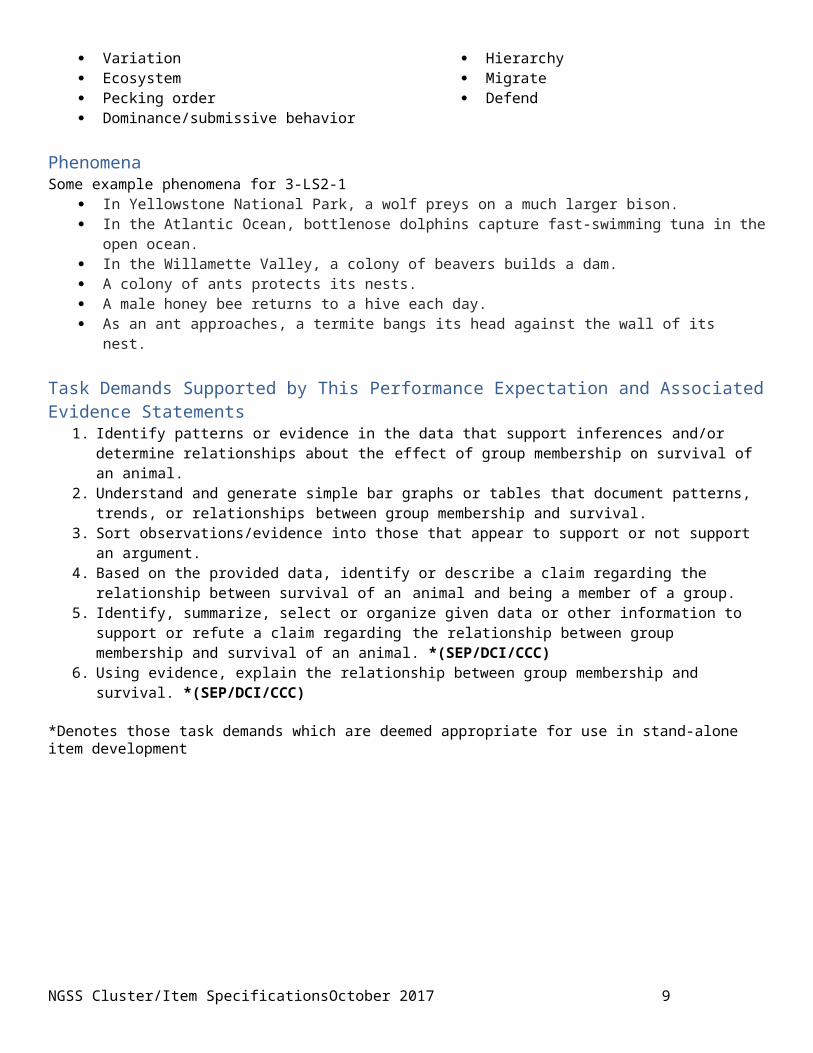
Decrease Increase Behavioral Variation Ecosystem Pecking order Dominance/submissive behavior Hierarchy Migrate Defend
PhenomenaSome example phenomena for 3-LS2-1
In Yellowstone National Park, a wolf preys on a much larger bison. In the Atlantic Ocean, bottlenose dolphins capture fast-swimming tuna in the open ocean.
NGSS Cluster/Item Specifications October 2017 7

In the Willamette Valley, a colony of beavers builds a dam. A colony of ants protects its nests. A male honey bee returns to a hive each day. As an ant approaches, a termite bangs its head against the wall of its nest.
Task Demands Supported by This Performance Expectation and Associated Evidence Statements1. Identify patterns or evidence in the data that support inferences and/or determine relationships about the effect
of group membership on survival of an animal.2. Understand and generate simple bar graphs or tables that document patterns, trends, or relationships between
group membership and survival.3. Sort observations/evidence into those that appear to support or not support an argument.4. Based on the provided data, identify or describe a claim regarding the relationship between survival of an animal
and being a member of a group.5. Identify, summarize, select or organize given data or other information to support or refute a claim regarding the
relationship between group membership and survival of an animal. *(SEP/DCI/CCC)6. Using evidence, explain the relationship between group membership and survival. *(SEP/DCI/CCC)
*Denotes those task demands which are deemed appropriate for use in stand-alone item development
NGSS Cluster/Item Specifications October 2017 8
Performance Expectation 3-LS4-1Analyze and interpret data from fossils to provide evidence of the organisms and the environments in which they lived long ago.
DimensionsAnalyzing and Interpreting Data Analyze and interpret data to make sense of phenomena using logical reasoning, mathematics, and/or
computation.LS4.A: Evidence of Common Ancestry and Diversity Some kinds of plants and animals that once lived on Earth are no longer found anywhere.
Fossils provide evidence about the types of organisms that lived long ago and also about the nature of their environments.
Scale, Proportion, and QuantityObservable phenomena exist from very short to very long periods.
Clarifications and Content LimitsClarification Statements:
Examples of data could include type, size, and distributions of fossil organisms. Examples of fossils and environments could include marine fossils found on dry land, tropical plant
fossils found in Arctic areas, and fossils of extinct organisms. Focus is on the fossils and environment in which the organisms lived, not how the fossils got to where they
are today. Data can be represented in tables and/or various graphic displays. Data collected by different groups can be compared and contrasted to discuss similarities and differences
in their findings.Content Limits:
Assessment does not include identification of specific fossils or present plants and animals. Assessment is limited to major fossil types and relative ages. Graphs and charts can include bar graphs, pictographs, pie charts, and tally charts. Types of math can include simple addition/subtraction. Standard units that can be used to measure and describe physical quantities such as weight, time,
temperature, and volume.
Science Vocabulary Students Are Expected to Know Exist Existence Ecosystem Characteristic Habitat Species Volcanic eruption Climate
Extinct Extinction Predator Time period Earthquake Erosion Weathering
Science Vocabulary Students Are Not Expected to Know Chronological order Fossil record Radioactive dating Descent Ancestry
Evolution Evolutionary Genetic Relative Rock layer
NGSS Cluster/Item Specifications October 2017 9

PhenomenaFor this performance expectation, the phenomena are sets of data. Those are the observed facts that the students will look at to discover patterns. Below, we enumerate some of the patterns that might comprise the data sets (phenomena) to be analyzed.
Some example phenomena for 3-LS4-1: Fossil trees are found in sedimentary rocks in Antarctica. The Redwall Limestone in the Grand Canyon contains many different fossils including corals, clams, octopi,
and fish. Whale fossils have been found in rocks in the Andes Mountains. Fossils of corals and snails are found in Iowa.
Task Demands Supported by This Performance Expectation and Associated Evidence Statements1. Organize or summarize data to highlight trends, patterns, or correlations between plant and animal fossils and
the environments in which they lived.2. Generate graphs or tables that document patterns, trends, or correlations in the fossil record.3. Identify evidence in the data that supports inferences about plant and animal fossils and the environments in
which they lived.
NGSS Cluster/Item Specifications October 2017 10

Performance Expectation 4-ESS1-1Identify evidence from patterns in rock formations and fossils in rock layers to support an explanation for changes in a landscape over time.
DimensionsConstructing Explanations and Designing Solutions Identify the evidence that supports particular points in an explanation.
ESS1.C: The History of Planet Earth Local, regional, and global patterns of rock formations reveal changes over time due to Earth forces, such as
earthquakes. The presence and location of certain fossil types indicate the order in which rock layers were formed.
Patterns Patterns can be used as evidence to support an explanation.
Clarifications and Content LimitsClarification Statement:
Examples of evidence from patterns could include rock layers with marine shell fossils above rock layers with plant fossils and no shells, indicating a change from land to water over time, and a canyon with different rock layers in the walls and a river in the bottom, indicating that over time a river cut through the rock.
Content Limits: Assessment does not include specific knowledge of the mechanism of rock formation or memorization of
specific rock formations and layers. Assessment is limited to relative time Excludes earthquakes―the clarification statement focuses on geomorphology and landscape change through
time. The focus is not on tectonics, despite its mention in the DCI.
Science Vocabulary Students are Expected to Know Weathering Erode Rock Formations Rock Layers Earthquake Glacier Climate Fossil
Landscape Shell River Mountain Canyon Deposit Marine
Science Vocabulary Students Are Not Expected to Know
Rock strata ocean basins glaciation watersheds geological mountain chains
igneous rock metamorphic rock sedimentary rock terrestrial aquatic
NGSS Cluster/Item Specifications October 2017 11

PhenomenaSample phenomena for 4-ESS1-1:
The rock walls on both sides of the Grand Canyon contain layers with marine fossils, interspersed with layers containing terrestrial fossils.
Church Rock, New Mexico, is a very dry place far from the sea. However, exposures of rocks in the area contain many fossils of marine organisms.
Axel Heiberg Island in the Canadian Arctic is too cold for trees to grow. However, sedimentary rocks on the island preserve hundreds of fossil stumps from large evergreen trees.Sihetun, China, is dry and mountainous. Sedimentary rocks exposed in the area preserve thousands of fish fossils. These sedimentary rocks are sandwiched between lava flow rocks. There are no active volcanoes in this part of China.
Task Demands Supported by This Performance Expectation and Associated Evidence Statements 1. Describe, identify, and/or select evidence from patterns of rock formations and/or patterns of fossils in rock
layers to support the explanations of changes in the landscape over time.2. Express or complete a causal chain explaining changes in patterns of fossils in rock layers.3. Identify patterns of rock formations and/or patterns of fossils in rock layers.
NGSS Cluster/Item Specifications October 2017 12

Performance Expectation 4-LS1-2Use a model to describe that animals receive different types of information through their senses, process the information in their brain, and respond to the information in different ways.
DimensionsDeveloping and Using Models Use a model to test interactions concerning the functioning of a natural system.
LS1.D: Information Processing Different sense receptors are specialized for particular kinds of information, which may be then processed by
the animal’s brain. Animals are able to use their perceptions and memories to guide their actions.Systems and System Models A system can be described in terms of its components and their interactions.
Clarifications and Content LimitsClarification Statement: Emphasis is on systems of information transfer.
Content Limits: Assessment does not include the mechanisms by which the brain stores and recalls information or the
mechanisms of how sensory receptors function.
Science Vocabulary Students Are Expected to Know Lens vision hearing senses muscle organ ear middle ear outer ear
inner ear eardrum response habitat eye lens time seconds memory
Science Vocabulary Students Are Not Expected to Know Sensory brain cells retina pupil saliva salivary gland vibration cornea iris brainstem consumer
nerve optic nerve nerve cell nerve tissue nerve impulse connecting nerve nerve fiber, organ system reflex reflex action reaction time cue
PhenomenaSome example phenomena for 4-LS1-2:
A bear cub in the woods cries out. Its mother immediately runs toward it.
NGSS Cluster/Item Specifications October 2017 13

A deer walks in the woods. It turns suddenly and moves off in a different direction. A few minutes later, a skunk appears from the bushes.
A cat sits on a stone wall. A mouse appears at the base of a nearby tree. The cat springs after the mouse. A hawk flies overhead. Suddenly, it dives toward the tall grass. A moment later, it returns to the sky, a snake in
its claws.
Task Demands Supported by This Performance Expectation and Associated Evidence Statements 1. Select or identify from a collection of potential model components the components needed to model the
phenomenon. Components might represent organ systems or parts of a system needed for collection and/or processing of sensory information.
2. Assemble or complete, from a collection of potential model components, an illustration or flow chart that is capable of representing the flow and/or processing of sensory information in an animal. This does not include labeling an existing diagram.
3. Manipulate the components of a model to demonstrate the changes, properties, processes, and/or events that act to result in the phenomenon. *(SEP/DCI/CCC)
4. Given models or diagrams of the flow and/or processing of sensory information in an animal, identify responses to sensory inputs and how they change in each scenario OR identify the properties of organs and/or organ systems that allow animals to respond to sensory information. *(SEP/DCI/CCC)
5. Identify missing components, relationships, or other limitations of a model that shows the flow and/or processing of sensory information in an animal.
6. Describe, select, or identify the relationships among components of a model that describe how sensory information is processed or explain how an animal responds to sensory inputs.
NGSS Cluster/Item Specifications October 2017 14

Performance Expectation 4-PS4-1Develop a model of waves to describe patterns in terms of amplitude and wavelength, and that waves can cause objects to move.
DimensionsDeveloping and Using Models Develop a model using an analogy, example, or abstract representation to describe a scientific principle.
PS4.A: Wave Properties Waves, which are regular patterns of motion, can be made in water by disturbing the surface. When waves
move across the surface of deep water, the water goes up and down in place; there is no net motion in the direction of the wave except when the water meets a beach.
Waves of the same type can differ in amplitude (height of the wave) and wavelength (spacing between wave peaks).
Patterns Similarities and differences in patterns can be used to sort, classify, and analyze simple rates of change for
natural phenomena.
Clarifications and Content LimitsClarification Statements: Examples of models could include diagrams, analogies, and physical models using wire to illustrate wavelength
and amplitude of waves. Acceptable clusters may include: amplitude and wavelength, motion of an object, or both.
Content Limits: Limited to physically visible mechanical waves. Assessment does not include interference effects, electromagnetic waves, non-periodic waves, or quantitative
models of amplitude and wavelength. Examples of objects being moved by waves are limited to up and down motion. Horizontal motion is above
grade level due to the other factors involved. Don’t directly reference energy. Energy is addressed in 4-PS3.
Students do not need to know Types of waves: sound, light, non-periodic, compression Particle movement Quantitative models Behaviors of waves:
o Absorptiono Reflectiono Refractiono Transmissiono Interactions with different materials
(angle of incidence, amount of
reflection or absorption, light being refracted into colors)
o Reflection is limited to the concepto How waves are reflected and the details
of reflection (as well as other behaviors) are covered in MS-PS4-2.
Wave calculations Motion of objects in the ocean due to ocean currents
Science Vocabulary Students Are Expected to Know Wave Amplitude Wavelength Crest
Trough Peak Rate Property
Medium Period Periodic
NGSS Cluster/Item Specifications October 2017 15

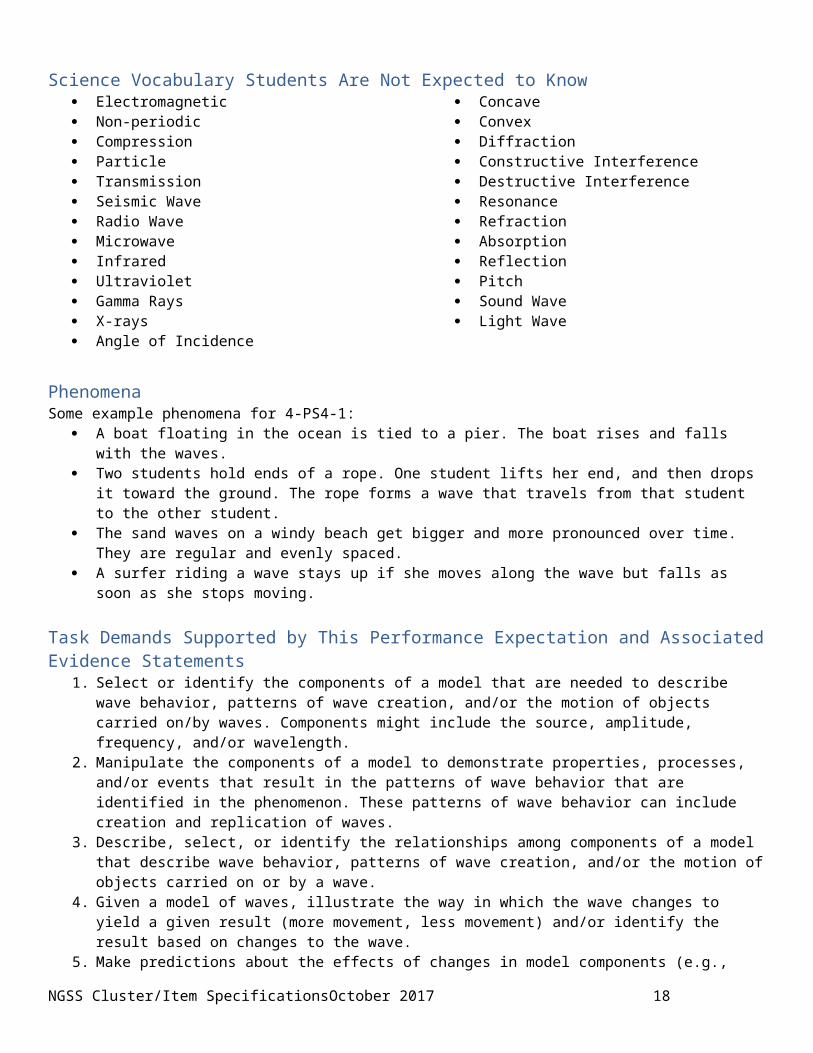
Science Vocabulary Students Are Not Expected to Know Electromagnetic Non-periodic Compression Particle Transmission Seismic Wave Radio Wave Microwave Infrared Ultraviolet Gamma Rays X-rays Angle of Incidence
Concave Convex Diffraction Constructive Interference Destructive Interference Resonance Refraction Absorption Reflection Pitch Sound Wave Light Wave
PhenomenaSome example phenomena for 4-PS4-1:
A boat floating in the ocean is tied to a pier. The boat rises and falls with the waves. Two students hold ends of a rope. One student lifts her end, and then drops it toward the ground. The rope
forms a wave that travels from that student to the other student. The sand waves on a windy beach get bigger and more pronounced over time. They are regular and evenly
spaced. A surfer riding a wave stays up if she moves along the wave but falls as soon as she stops moving.
Task Demands Supported by This Performance Expectation and Associated Evidence Statements 1. Select or identify the components of a model that are needed to describe wave behavior, patterns of wave
creation, and/or the motion of objects carried on/by waves. Components might include the source, amplitude, frequency, and/or wavelength.
2. Manipulate the components of a model to demonstrate properties, processes, and/or events that result in the patterns of wave behavior that are identified in the phenomenon. These patterns of wave behavior can include creation and replication of waves.
3. Describe, select, or identify the relationships among components of a model that describe wave behavior, patterns of wave creation, and/or the motion of objects carried on or by a wave.
4. Given a model of waves, illustrate the way in which the wave changes to yield a given result (more movement, less movement) and/or identify the result based on changes to the wave.
5. Make predictions about the effects of changes in model components (e.g., energy of wave source, distance from wave source), the amplitude or wavelength of a wave, or motion of objects affected by the wave. Item writer: Do not directly reference the energy of the wave source. Instead, show the speed and size of the object causing the wave, etc.
NGSS Cluster/Item Specifications October 2017 16

Performance Expectation 5-ESS1-2Represent data in graphical displays to reveal patterns of daily changes in length and direction of shadows, day and night, and the seasonal appearance of some stars in the night sky.
DimensionsAnalyzing and Interpreting Data Represent data in graphical displays (bar graphs, pictographs, and/or pie charts) to reveal patterns that indicate
relationships.ESS1.B: Earth and the Solar System The orbits of Earth around the sun and of the moon around Earth, together with the rotation of Earth about an
axis between its North and South poles, cause observable patterns. These include day and night; daily changes in the length and direction of shadows; and different positions of the sun, moon, and stars at different times of the day, month, and year.
Patterns Similarities and differences in patterns can be used to sort, classify, communicate, and analyze simple rates of
change for natural phenomena.
Clarifications and Content LimitsContent Limits: Examples of patterns could include the position and motion of Earth with respect to the sun and selected stars
that are visible only in particular months. While the names of celestial objects, stars, or constellations can be included, students are not expected to
identify them. Objects to be used to assess this PE are limited to the sun, Earth’s moon, Earth, and stars/constellations visible
in Earth’s night sky. “Positions of the moon” refers to its location in Earth’s sky and not its appearance (phase). Assessment does not include cause of seasons, lunar phases, or the position of the sun in the sky throughout the
year.
Science Vocabulary Students Are Expected to Know Circular motion Universe Earth’s rotation Galaxy North Pole South Pole Axis Solar system Milky Way
Constellation Moon phases Lunar astronomical Orbit Tilt Annual Rotation Revolution
Science Vocabulary Students Are Not Expected to Know Eclipse Celestial Comet
Light year Astronomical unit Stellar
PhenomenaSome example phenomena for 5-ESS1-2:NGSS Cluster/Item Specifications October 2017 17
The shadow cast by a sundial changes position and size throughout the day. A constellation that is viewed right above someone’s house at 8:00 p.m. one night can no longer be seen at 8:00
p.m. in a few months. The sun is seen in the sky only during the day It gets dark out after the sun goes below the horizon
Task Demands Supported by This Performance Expectation and Associated Evidence Statements 1. Organize, arrange (e.g., using illustrations and/or labels), or summarize data to highlight trends, patterns, or
correlations in how the data changes over time. *(SEP/DCI/CCC)2. Generate/construct graphs, tables, or groups of illustrations and/or labels of data that document patterns,
trends, or correlations in how the data change over time. This may include sorting out distractors. (SEP/DCI/CCC)
3. Use relationships identified in the data to predict whether or not the pattern will continue OR how the data will look at some time in the future. *(SEP/DCI/CCC)
4. Identify patterns or evidence in the data that supports inferences about the phenomena.
NGSS Cluster/Item Specifications October 2017 18

Performance Expectation 5-LS2-1Develop a model to describe the movement of matter among plants, animals, decomposers, and the environment.
DimensionsDeveloping and Using Models Develop a model to describe phenomena.
LS2.A: Interdependent Relationships in Ecosystems The food of almost any kind of animal can be traced back to plants. Organisms are related in food webs in which
some animals eat plants for food and other animals eat the animals that eat plants. Some organisms, such as fungi and bacteria, break down dead organisms (both plants or plant parts and animals) and therefore operate as “decomposers.” Decomposition eventually restores (recycles) some materials back to the soil. Organisms can survive only in environments in which their particular needs are met. A healthy ecosystem is one in which multiple species of different types are each able to meet their needs in a relatively stable web of life. Newly introduced species can damage the balance of an ecosystem.
LS2.B: Cycles of Matter and Energy Transfer in Ecosystems Matter cycles between the air and soil and among plants, animals, and microbes as these organisms live and die.
Organisms obtain gases and water from the environment and release waste matter (gas, liquid, or solid) back into the environment.
Systems and System Models A system can be described in terms of its components and their interactions.
Clarifications and Content LimitsClarification Statement: Emphasis is on the idea that matter that is not food (air, water, decomposed materials in soil) is changed by
plants into matter that is food. Examples of systems could include organisms, ecosystems, and Earth.Content Limits: Assessment does not include molecular explanations.
Science Vocabulary Students Are Expected to Know Organism matter plant animal bacteria fungus algae gas nutrients producer
consumer decomposer cycle matter photosynthesis conserve products break down relationship waste
recycle environment system species balance material model soil
Science Vocabulary Students Are Not Expected to Know Chemical process Reaction Molecule Carbon Carbon dioxide Oxygen Sugar
Aerobic Anaerobic
NGSS Cluster/Item Specifications October 2017 19

PhenomenaSome example phenomena for 5-LS2-1:Insects in a terrarium only survive when bacteria and plants are present. A new fish tank must rest for 2–3 weeks with water before introducing fish or the fish die.Under a microscope, a sample of soil contains many bacteria, but a sample of desert sand does not.Farmers put fish in stock tanks to keep them clean.
Tasks Demands Supported by This Performance Expectation and associated Evidence Statements 1. Select or identify from a collection of potential model components, including distractors, the parts of a model
needed to describe the movement of matter among plants, animals, decomposers, and the environment.2. *(SEP/DCI/CCC)Manipulate the components of a model to demonstrate properties, processes, and/or events
that result in the movement of matter among plants, animals, decomposers, and the environment, including the relationships of organisms and/or the cycle(s) of matter and/or energy.
3. Articulate, describe, illustrate, select, or identify the relationships among components of a model that describe the movement of matter among plants, animals, decomposers, and the environment.
4. Make predictions about the effects of changes in model components, including the substitution, elimination, or addition of matter and/or an organism and the result.
*denotes those task demands which are deemed appropriate for use in stand-alone item development
NGSS Cluster/Item Specifications October 2017 20
Performance Expectation 5-PS1-1Develop a model to describe that matter is made of particles too small to be seen.
DimensionsDeveloping and Using Models
Use models to describe phenomena.PS1.A: Structure and Properties of Matter
Matter of any type can be subdivided into particles that are too small to see, but even then the matter still exists and can be detected by other means. A model showing the gases are made from matter particles that are too small to see and are moving freely around in space can explain many observations, including the inflation and shape of a balloon and the effects of air on larger particles or objects.
Scale, Proportion, and Quantity Natural objects exist from the very small to the immensely large.
Clarifications and Content LimitsClarification Statement:
Examples of evidence supporting a model could include adding air to expand a basketball, compressing air in a syringe, dissolving sugar in water, and evaporating salt water.
Content Limits: Assessment does not include the atomic-scale mechanism of evaporation and condensation or the defining of
the unseen particles. Students are expected to know that matter can neither be destroyed nor created.
Science Vocabulary Students Are Expected to Know Matter Substance Particle Solid Liquid Gas Vapor Steam Air Phase change
Evaporate Boil Condense Freeze Melt Dissolve Mixture Chemical reaction Energy
Science Vocabulary Students Are Not Expected to Know Atom Compound Molecule Chemical bond Solution Homogenous Heterogeneous Colloid
Solute Solvent Precipitant Precipitate Reactant Product Air pressure Law of conservation of matter
PhenomenaSome example phenomena for 5-PS1-1:
A hissing sound can be heard as a bicycle wheel deflates.
NGSS Cluster/Item Specifications October 2017 21

A sour odor can be smelled from milk that has been kept too long (or expired). When you pump air out of a closed bottle that is partially filled with marshmallows, the marshmallows expand in
size. However, when you open the bottle, the marshmallows shrink back to their original size. When you place a lit match into a glass bottle and a boiled egg is set on the bottle opening, the egg eventually
gets sucked into the bottle.
Task Demands Supported by This Performance Expectation and associated Evidence Statements 1. Select or identify from a collection of potential model components, including distractors, the components
needed to model the phenomenon. Components might include solid, liquid, or gas particles; particles of different substances; and representations of particle movement.
2. Assemble or complete — from a collection of potential model components — an illustration, flow chart, or causal chain that is capable of representing the particle nature of matter. This does not include labeling an existing diagram.
3. Manipulate the components of a model to demonstrate the changes, properties, processes, and/or events that act to result in the phenomenon.
4. Make predictions about the effects of changes in the movements of, distances between, or phases of the particles of matter under investigation. Predictions can be made by manipulating model components, completing illustrations, or selecting from lists with distractors.
5. Provided with models or diagrams of the particles of matter under investigation, identify the properties of the particles under investigation and how they change in each scenario. The properties of the particles may include the relative motions of, distances between, and phases of the particles.
6. Describe, select, or identify the relationships among components of a model that explains the observed effects of the particle nature of matter.
NGSS Cluster/Item Specifications October 2017 22

Performance Expectation 5-PS3-1Use models to describe that energy in animals’ food (used for body repair, growth, motion, and to maintain body warmth) was once energy from the sun.
DimensionsDeveloping and Using Models
Use models to describe phenomena.PS3.D: Energy in Chemical Processes and Everyday Life
The energy released [from] food was once energy from the sun that was captured by plants in the chemical process that forms plant matter.
LS1.C: Organization for Matter and Energy Flow in Organisms Food provides animals with the materials they need for body repair and growth and the energy they need to
maintain body warmth and for motion. (secondary)Energy and Matter
Energy can be transferred in various ways and between objects.
Clarifications and Content LimitsClarification Statement:
Examples of models could include diagrams and flow charts.Content Limits: Assessment does not include photosynthesis. Students do not need to know: photosynthesis equation
Science Vocabulary Students Are Expected to Know Energy Matter
Transfer Light
Science Vocabulary Students Are Not Expected to Know Photosynthesis Metabolism Atoms
Chemicals Reaction Radiation
PhenomenaSome example phenomena for 5-PS3-1:
Cows eat grass that grew in the sun. Termites eat the wood in trees. Caterpillars eat leaves and grow big. Koalas mainly eat eucalyptus leaves.
Task Demands Supported by This Performance Expectation and Associated Evidence Statements 1. Select or identify, from a collection of potential model components, including distractors, the parts of a model
need to describe the flow of energy among plants, animals, and the sun.2. Assemble or complete a model representing the flow of energy among plants, animals, and the sun.3. Manipulate the components of a model to demonstrate properties, processes, and/or events that result in the
flow of energy among plants, animals, and the sun, including the relationships of organisms and/or the cycles of energy and/or matter.
4. Articulate, describe, illustrate, select, or identify the relationships among components of a model that describe the movement of matter among plants, animals, and the sun.
NGSS Cluster/Item Specifications October 2017 23

5. Make predictions about the effects of changes in model components including the substitution, elimination, or addition of energy and/or an organism and the result.
NGSS Cluster/Item Specifications October 2017 24
Performance Expectation MS-ESS1-4Construct a scientific explanation based on evidence from rock strata for how the geologic timescale is used to organize Earth’s 4.6-billion-year-old history.
DimensionsConstructing Explanations and Designing Solutions
Construct a scientific explanation based on valid and reliable evidence obtained from sources (including students’ own experiments) and the assumption that theories and laws that describe the natural world operate today as they did in the past and will continue to do so in the future.
ESS1.C: The History of Planet Earth The geological time scale interpreted from rock strata provides a way to organize Earth’s history. Analyses of
rock strata and the fossil record provide only relative dates, not an absolute scale.Scale, Proportion and Quantity
Time, space, and energy phenomena can be observed at various scales, using models to study systems that are too large or too small.
Clarifications and Content LimitsContent Clarification:
Emphasis is on how analyses of rock formations and the fossils they contain are used to establish relative ages of major events in Earth’s history.
Example of Earth’s major events could range from being geologically recent (e.g., the most recent glacial period or the earliest fossils of Homo sapiens) to geologically very old (e.g., the formation of Earth or the earliest evidence of life).
Examples can include the formation of mountain chains and ocean basins, the evolution or extinction of particular living organisms, or significant instances of volcanic activity.
Assessment Content Limits: Assessment does not include recalling the names of specific periods or epochs and events within them.
Students do not need to know the types of unconformities (e.g., disconformity, but they should know that unconformities exist).
Science Vocabulary Students Are Expected to Know Erosion Weathering Fossil Ancient Prehistoric Layer Formation Strata Mineral Sedimentary
Sediment Metamorphic Volcanic Superposition Cross-cutting Fault Fold Geology Geological
Science Vocabulary Students are Not Expected to Know Radioactive dating Bio-geology Geobiology Relative dating Numerical dating Absolute dating
Carbon dating Radiometric dating Igneous Stratigraphy Biostratigraphy Chronostratigraphy
NGSS Cluster/Item Specifications October 2017 25

Sequence Sequence stratigraphy Bed, lamina
Paleoenvironment Paleoecology Paleomagnetic
PhenomenaSome example phenomena for MS-ESS1-4:
A very distinct clay layer tops the Hell Creek Formation in Montana. Below this layer, the Hell Creek is rich in dinosaur fossils; above the layer, no dinosaurs are found.
The landscape of Cape Cod, Massachusetts, is almost entirely small hills of sand and gravel. However, a hole drilled 500 feet into the ground will hit hard metamorphic rock.
In Box Canyon in Ouray, Colorado, metamorphic rocks that are standing vertical are capped by sedimentary rocks that are lying flat.
The St. Peter Sandstone is a very white sandstone rock layer exposed in many places in the mid-western United States. The St. Peter is very uniform in appearance but the rock layer sits on top of different kinds of rocks in the North than it does in Missouri.
Task Demands Supported by This Performance Expectation and Associated Evidence Statements 1. Organize and/or arrange (e.g., using illustrations and/or labels, including taken from or added to, stratigraphic
columns and/or geologic maps), or summarize, data/information so as to highlight trends, patterns, or correlations in paleoenvironmental changes, geological events/processes, and/or the appearance or disappearance in the record of specific organisms. *(SEP/DCI/CCC)
2. Generate/construct graphs, tables, or assemblages of illustrations, and/or labels of data/information that document patterns, trends, or correlations in how rock types and included fossils change over geologic time, recording different events and paleo environments. This may include sorting out distractors. *(SEP/DCI/CCC)
3. Use relationships identified in the data/information to hypothesize the relative age of specific rock layers, formations, or fossils, in a stratigraphic column or on a geologic map. *(SEP/DCI/CCC)
4. Identify patterns or evidence in the data/information that support inferences about what the paleoenvironment was like during time intervals represented in a stratigraphic column or on a geologic map.
5. Describe, identify, and/or select information needed to support an explanation.
*denotes those task demands which are deemed appropriate for use in stand-alone item development. 2/3 of these approved TDs should be combined and used when developing a stand-alone item.
NGSS Cluster/Item Specifications October 2017 26

Performance Expectation MS-ESS2-2Construct an explanation based on evidence for how geoscience processes have changed Earth’s surface at varying time and spatial scales.
DimensionsConstructing Explanations and Designing Solutions
Construct a scientific explanation based on valid and reliable evidence obtained from sources (including the students’ own experiments) and the assumption that theories and laws that describe nature operate today as they did in the past and will continue to do so in the future.
ESS2.A: Earth’s Materials and Systems The planet’s systems interact over scales that rage from microscopic to global in size, and they operate over
fractions of a second to billions of years. These interactions have shaped Earth’s history and will determine its future.
ESS2.C: the Roles of Water in Earth’s Surface Processes Water’s movements―both on the land and underground―cause weathering and erosion, which change the
land’s surface features and create underground formations.Scale, Proportion, and Quantity
Time, space, and energy phenomena can be observed at various scales using models to study systems that are too large or too small.
Clarifications and Content LimitsClarification Statements: Emphasis is on how processes change Earth’s surface at time and spatial scales that can be large (such as slow
plate motions or the uplift of large mountain ranges) or small (such as rapid landslides or microscopic geochemical reactions), and how many geoscience processes (such as earthquakes, volcanoes, and meteor impacts) usually behave gradually but are punctuated by catastrophic events.
Examples of geoscience processes include surface weathering and deposition by the movements of water, ice, and wind.
Emphasis is on geoscience processes that shape local geographic features, where appropriate.Content Limits:
Students are expected to know all of the components/processes of the rock cycle but not specific rock or mineral names.
Students do not need to know Endogenic or exogenic systems, specific intervals of the Geological Time Scale by name, specific volcano types (shield, effusive, composite, etc.).
Science Vocabulary Students are Expected to Know Earthquake Volcanic eruptions Core Crust Mantle Wind Temperature Pressure Continent Erosion Weathering Million, billion, years Magma
Lava Igneous Sedimentary Metamorphic Mineral Meteor Crater Mountain plate tectonics ocean continental drift subduction zone divergent boundary
convergent boundary hot spot fault tsunami hurricane tornado fracture folding Compressing sea floor spreading layer ridge rock cycle
NGSS Cluster/Item Specifications October 2017 27

trench plateau
slope landslides
floods caves
Science Vocabulary Students are Not Expected to Know Endogenic system exogenic system radiometric dating originally horizontality superposition uniformitarianism primordial epoch, eon period liquification Mohorovicic
discontinuity (Moho), seismic waves
Seismograph
Richter scale Fumaroles Mofettes Solfataras Caledonian era Variscan era Alpine era, massif Graben Monolith Monadnock Nappe system Isostasy Pluton Batholith
Stratigraphy Lithification Evaporite Hydrothermal Relief Topography Continental shield Terrain Anticline Syncline Strike-slip fault Horst, orogenesis Tephra Caldera
PhenomenaSome example phenomena for MS-ESS2-2:
A hillside in Oregon experiences an intense rain storm. At the end of the storm, part of the hillside collapses, covering a road with mud and debris.
In Northern Arizona, there is a large circular depression. In southeastern Pennsylvania, the landscape is dotted with a number of irregular holes that lead to caves. When viewed from orbit, the coastline the eastern south line of South America and the Western Coast of Africa
look as though they were joined together, similar to a jigsaw puzzle.
Task Demands Supported by This Performance Expectation and Associated Evidence Statements1. Articulate, describe, illustrate, or select the relationships, interactions, and/or processes to be explained. This
may entail sorting relevant from irrelevant information or features.2. Express or complete a causal chain explaining how a given process(es) acts to modify Earth’s surface in the long
term and/or short term. This may include indicating directions of causality in an incomplete model such as a flow chart or diagram, or completing cause and effect chains.
3. Identify evidence supporting the inference of causation that is expressed in a causal chain for a process(es) that acts to modify Earth’s surface in the long term and/or short term.
4. Use an explanation to predict the effect of the process on Earth’s surface, given a change in conditions (e.g., atmospheric, tectonic, geological, hydrologic).
5. Describe, identify, and/or select information needed to support an explanation for how processes affect Earth’s surface over the short and/or long term.
NGSS Cluster/Item Specifications October 2017 28

Performance Expectation MS ESS2-6Develop and use a model to describe how unequal heating and rotation of the Earth cause patterns of atmospheric and oceanic circulation that determine regional climates.
DimensionsDeveloping and Using Models
Develop and use a model to describe phenomena.ESS2.C: The Roles of Water in Earth’s Surface Processes
Variations in density due to variations in temperature and salinity drive a global pattern of interconnected ocean currents.
ESS2.D: Weather and Climate Weather and climate are influenced by interactions involving sunlight, the ocean, the atmosphere, ice,
landforms, and living things. These interactions vary with latitude, altitude, and local and regional geography, all of which can affect oceanic and atmospheric flow patterns.
The ocean exerts a major influence on weather and climate by absorbing energy from the sun, releasing it over time, and globally redistributing it through ocean currents.
Systems and System Models Models can be used to represent systems and their interactions—such as inputs, processes and outputs—and
energy, matter, and information flows within systems.
Clarifications and Content LimitsClarification Statements:
Emphasis is on how patterns vary by latitude, altitude, and geographic land distribution. Emphasis of atmospheric circulation is on the sunlight-driven latitudinal banding, the Coriolis Effect, and
resulting prevailing winds; emphasis of ocean circulation is on the transfer of heat by the global ocean convection cycle, which is constrained by the Coriolis Effect and the outlines of continents.
Examples of models can be diagrams, maps and globes, or digital representations.Content Limits:
Students do not need to know: names of specific winds, different cloud types (cumulus, cirrus etc.), names of specific ocean currents, or perform any quantitative analyses based on the Coriolis Effect, mathematical calculations beyond trends, or measurements of central tendency.
Science Vocabulary Students Are Expected to Know Weather Climate Temperature Atmospheric pressure Density Current Latitude Altitude Coriolis effect
Convection Condensation Precipitation Cloud, water cycle Air mass circulation Vegetation Latitude Longitude Rain shadow
Science Vocabulary Students Are Not Expected to Know Trade winds Easterlies Westerlies Cumulus Cirrus or other cloud names
Gulf Stream Labrador Ocean current names UV rays
NGSS Cluster/Item Specifications October 2017 29

PhenomenaSome example phenomena for MS-ESS2-6:
In December 2010, Gary, Indiana, on the southeast shores of Lake Michigan, had approximately 30 inches of snow over a three-day period, whereas Chicago, Illinois, 30 miles away, received barely any snow.
Onshore and offshore breezes―in the morning, the breeze comes in from the ocean. At night, the breeze is blowing in the opposite direction.
Wind storms in the Sahara become hurricanes that affect the east coast of North America and the Caribbean, but not the coast of South America.
The Westerlies vs. The Easterlies and the trade winds―why are these wind patterns banded as you move north from the equator?
Task Demands Supported by This Performance Expectation and Associated Evidence Statements1. Assemble or complete an illustration or flow chart that is capable of representing the effect of unequal heating
of Earth’s systems on atmospheric and oceanic circulation. Key components of the model might include: oceans, land forms, wind current, ocean current, energy flows, upwelling, downwelling, water temperature, and salinity.
2. Manipulate the components of a model to demonstrate the changes, properties, processes, and/or events that act to result in a phenomenon.
3. Make predictions about the effects of changes in temperature on a phenomenon. Predictions can be made by manipulating model components, completing illustrations, or selecting from lists with distractors. Make predictions about the effects of changes in water temperature or density, distance from the lake, location, etc.
4. Identify missing components, relationships, or other limitations of a model.5. Describe, select, or identify the relationships among components of a model that explain the effect of unequal
heating of Earth’s systems on atmospheric and oceanic circulation.
NGSS Cluster/Item Specifications October 2017 30

Performance Expectation MS-LS1-1Conduct an investigation to provide evidence that living things are made of cells; either one cell or many different numbers and types of cells.
DimensionsPlanning and Carrying Out Investigations
Conduct an investigation to produce data to serve as the basis for evidence that meets the goals of an investigation.
LS1.A: Structure and Function All living things are made up of cells, which is the smallest unit that can be said to be alive. An organism may
consist of one single cell (unicellular) or many different numbers and types of cells (multicellular).Scale, Proportion, and Quantity
Phenomena that can be observed at one scale may not be observable at another scale.
Clarifications and Content LimitsClarification Statements:
Emphasis is on developing evidence that living things are made of cells, distinguishing between living and non-living things, and understanding that living things may be made of one cell or many varying cells.
Content Limits: Students do not need to know The structures or functions of specific organelles or different proteins Systems of specialized cells The mechanisms by which cells are alive Specifics of DNA and proteins or of cell growth and division Endosymbiotic theory Histological procedures
Science Vocabulary Students Are Expected to Know Multicellular Unicellular Cells Tissues Organ System Organism hierarchy Bacteria Colonies Yeast Prokaryote
Eukaryote Magnify Microscope DNA Nucleus Cell wall Cell membrane Algae, chloroplast(s) Chromosomes Cork
Science Vocabulary Students Are Not Expected to Know Differentiation Mitosis Meiosis Genetics Cellular respiration Energy transfer RNA Protozoa
Amoeba Histology Protista Archaea Nucleoid Plasmid Diatoms Cyanobacteria
NGSS Cluster/Item Specifications October 2017 31

PhenomenaSome example phenomena for MS-LS1-1:
Plant leaves and roots have tiny box-like structures that can be seen under a microscope. Small creatures can be seen swimming in samples of pond water viewed through a microscope. Different parts of a frog’s body (muscles, skin, tongue, etc.) are observed under a microscope, and are seen to
be composed of cells. One-celled organisms (bacteria, protists) perform the eight necessary functions of life, but nothing smaller has
been seen to do this. Swabs from the human cheek are observed under a microscope. Small cells can be seen.
Task Demands Supported by This Performance Expectation and Associated Evidence Statements1. Identify from a list, including distractors, the materials/tools needed for an investigation to find the smallest unit
of life (cell).2. Identify the outcome data that should be collected in an investigation of the smallest unit of living things.3. Evaluate the sufficiency and limitations of data collected to explain that the smallest unit of living things is the
cell.4. Make and/or record observations about whether the sample contains cells or not. *(SEP/DCI/CCC)5. Interpret and/or communicate data from the investigation to determine if a specimen is alive or not.6. Construct a statement to describe the overall trend suggested by the observed data.
*denotes those task demands which are deemed appropriate for use in stand-alone item development
NGSS Cluster/Item Specifications October 2017 32

Performance Expectation MS-LS2-3Develop a model to describe the cycling of matter and flow of energy among living and nonliving parts of an ecosystem.
DimensionsDeveloping and Using Models
Develop a model to describe phenomena.LS2.B: Cycle of Matter and Energy Transfer in Ecosystems
Food webs are models that demonstrate how matter and energy are transferred among producers, consumers, and decomposers as the three groups interact within an ecosystem. Transfers of matter into and out of the physical environment occur at every level. Decomposers recycle nutrients from dead plant or animal matter back to the soil in terrestrial environments or to the water in aquatic environments. The atoms that make up the organisms in an ecosystem are cycled repeatedly between the living and nonliving parts of the ecosystem.
Energy and Matter The transfer of energy can be tracked as energy flows through a natural system.
Clarifications and Content LimitsClarification Statements:
Emphasize food webs and the role of producers, consumers, and decomposers in various ecosystems. Emphasis is on describing the conservation of matter and flow of energy into and out of various ecosystems,
and on defining the boundaries of the system.Content Limits:
Assessment does not include the use of chemical reactions to describe the processes. Assessment does not include identification of trophic levels, understanding of the relative energies of the
trophic levels, nor the knowledge of the 10% energy transfer between trophic levels. Assessment does not include the concept of biomass. Assessment does not include the process of bioaccumulation. Students do not need to identify biomes or to know information about specific biomes.
Science Vocabulary Students Are Expected to Know Food web food chain Producer Consumer Decomposer Herbivore Omnivore Carnivore Algae Fungi Microbe Microorganism Organic matter/waste Nutrients Photosynthesis
Atom Molecule Sugar Carbon Carbon Dioxide Nitrogen Oxygen Law of conservation of matter Law of conservation of energy Predator Prey Atmosphere Aquatic Interdependent
Science Vocabulary Students Are Not Expected to Know Biotic Abiotic
NGSS Cluster/Item Specifications October 2017 33

Trophic level Energy pyramid Nitrogen fixation Exothermic/endothermic Detritivores Biomass Bioaccumulation/biomagnification Autotroph/heterotroph Biosphere
Hydrosphere Geosphere Aerobic Anaerobic Chemical reaction Reactant Product Phosphorous Phytoplankton
PhenomenaSome example phenomena for MS-LS2-3
In the Alaskan tundra, more grass and wildflowers grow on top of underground fox dens than elsewhere. In July, a colony of lava crickets is found to inhabit lava flows from a May eruption, but the first plant does not
appear in the area until November. Fox-inhabited islands in the Aleutian Islands have less vegetation than islands not inhabited by foxes. Giant clams and tube worms are found in the darkest parts of the oceans in the hot water near hydrothermal
vents.
Task Demands Supported by This Performance Expectation and associated Evidence Statements 1. Identify, assemble, or complete from a collection of potential model components, including distractors,
components of a food-web model that describe transfers of matter and/or energy among producers, consumers, decomposers, or some subsets of those, potentially including transfers between living and nonliving organisms.
2. Describe, select, or identify the relationships among components of a food-web model that describes how parts of the food web (producers, consumers, and decomposers) interact to continually cycle matter and to transfer energy among living and nonliving parts of an ecosystem.
3. Manipulate the components of a food-web model to demonstrate how the interactions among producers, consumers, and/or decomposers result in changes to the cycling of matter and/or transfer of energy among living and nonliving parts of an ecosystem.
4. Select, describe, or illustrate predictions about the effects of changes in the organisms or nonliving components of the environment on the cycling of matter, transfer of energy, and/or other organisms in the environment. Predictions can be made by manipulating model components, completing illustrations, or selecting from lists with distractors.
5. Select or identify missing components or relationships of a food web model that describes the transfers of matter and/or energy among living and nonliving parts of an ecosystem.
NGSS Cluster/Item Specifications October 2017 34
Performance Expectation MS-LS3-2Develop and use a model to describe why asexual reproduction results in offspring with identical genetic information and sexual reproduction results in offspring with genetic variation.
DimensionsDeveloping and Using Models
Develop and use a model to describe phenomena.LS1.B: Growth and Development of Organisms
Organisms reproduce, either sexually or asexually, and transfer their genetic information to their offspring (secondary).
LS3.A: Inheritance of Traits Variations of inherited traits between parent and offspring arise from genetic differences that result from the
subset of chromosomes (and therefore genes) inherited.LS3.B: Variation of Traits
In sexually reproducing organisms, each parent contributes (at random) half of the genes acquired by the offspring. Individuals have two of each chromosome and hence two alleles of each gene, one acquired from each parent. These versions may be identical or may differ from each other.
Cause and Effect Cause and effect relationships may be used to predict phenomena in natural systems.
Clarifications and Content LimitsClarification Statements: Emphasis is on using models such as Punnett Squares, diagrams and simulations to describe the cause and effect
relationship of gene transmission from parent(s) to offspring and resulting genetic variation.Content Limits: Assessment does not include phases of mitosis or meiosis. Students do not need to know process of recombination.
Science Vocabulary Students Are Expected to Know Breed Transfer Development Germination Plant structure Plumage Reproductive system Fertilizer Gene Genetic Variation
Allele Dominant trait Recessive trait Hereditary information Punnett square Transmission Chromosome Sexual reproduction Asexual reproduction Protein
Science Vocabulary Students Are Not Expected to Know DNA DNA replication Sex-linked trait Recombination Gene expression Segment
Sex cell Sex chromosome Cell division Mutation Meiosis Amino acid
Amino acid sequence Haploid Diploid
NGSS Cluster/Item Specifications October 2017 35

PhenomenaSome example phenomena for 7.4.1:
Jellyfish will produce both clones and genetically diverse offspring during different stages of their life cycle. Strawberry plants grow another stem from a core stem that extends horizontally on the ground. This new stem
will become a separate strawberry plant. A flatworm is cut in half. Rather than dying, both halves regenerate their lost portions to form two new,
distinct, and fully functioning worms. A plant (Bryophyllum diagremontianum) native to Madagascar has what appears to be miniature clusters of
leaves lining the edges of a much larger leaf.
Task Demands Supported by This Performance Expectation and Associated Evidence Statements1. Select or identify from a collection of potential model components, including distractors, the components
needed to model the phenomenon. Components might include alleles, genotypes, and phenotypes.2. Assemble or complete, from a collection of potential model components, an illustration or flow chart that is
capable of representing different types of reproduction. This does not include labeling an existing diagram.3. Manipulate the components of a model to demonstrate the changes, properties, processes, and/or events that
act to result in a phenomenon.4. Make predictions about the effects of genetic variation from reproduction. Predictions can be made by
manipulating model components, completing illustrations, or selecting from lists with distractors.5. Given models or diagrams of types of reproduction, identify the types of reproduction and how they change in
each scenario OR identify the properties of the different types of reproduction that cause genetic variation.6. Identify missing components, relationships, or other limitations of the model.7. Identify, calculate, or select the relationships among the components of a model that describe the types of
reproduction, the environmental conditions under which reproduction occurs, or explain the genetic variation that results from reproduction.
NGSS Cluster/Item Specifications October 2017 36
Performance Expectation MS-LS4-5Gather and synthesize information about technologies that have changed the way humans influence the inheritance of desired traits in organisms.
DimensionsObtaining, Evaluating, and Communicating Gather, read, and synthesize information from multiple appropriate sources and assess the credibility, accuracy,
and possible bias of each publication and method used, and describe how they are supported or not supported by evidence.
LS4.B: Natural Selection In artificial selection, humans have the capacity to influence certain characteristics of organisms by selective
breeding. One can choose desired parental traits determined by genes, which are then passed on to offspring.
Cause and Effect Phenomena may have more than one cause, and some cause and effect relationships in systems can only be
described using probability.
Clarifications and Content LimitsClarification Statements:
Emphasis is on synthesizing information from reliable sources about the influence of humans on genetic outcomes in artificial selection (such as genetic modification, animal husbandry, and gene therapy) and on the impacts these technologies have on society as well as the technologies leading to these scientific discoveries.
Content Limits: Students do not need to know: overlapping DNA sequences, Hardy-Weinberg calculations, biodiversity,
mechanisms of gene transfer, dominant/recessive genes.
Science Vocabulary Students Are Expected to Know Natural / Artificial selection Evolution Adaptation Resources Reproduction Offspring Breeding Traits Organisms Genetic engineering
DNA, cloning Inherit Hereditary Proteins
Science Vocabulary Students Are Not Expected to Know Chromosomes Genetic variation Genetic combination Meiosis Mitosis Replications
Mutations Gene regulation Allele DNA sequences RNA sequences Amino acid sequences
PhenomenaSome example phenomena for MS-LS4-5:
Different methods for transferring genes have different rates of success: Scientists insert the pGLO plasmid into plants so that the plants glow when they are ready to harvest. There is no wild plant that looks like modern corn (soft starchy kernels lined up in a row). Farmers isolated wild cabbage plants to create a variety of vegetables, including broccoli and kale.
The wild cabbage plants were selected for their different flavors, textures, leaves, and flowers. Scientists are currently working to breed sheep that do not burp in order to reduce methane emission.
NGSS Cluster/Item Specifications October 2017 37

Scientists want to breed strong and more resistant bees that won’t be damaged by disease and other parasites. Scientists have created pest-resistant cotton that is toxic to certain insects that eat the plant. Scientists are working to produce drought-resistant sugarcane for farming in dry areas. Scientists are working to create animals that have a smaller environmental impact (Enviro-Pig). Scientists are working to create plants with immunities to plant diseases. Scientists are creating bacteria that produce some specialized substances (insulin, other proteins,
medicines). Scientists are making animal models of human diseases for study.
Task Demands Supported by This Performance Expectation and associated Evidence Statements
1. Generate or construct tables or assemblages of data that document the similarities and differences between traditional and modern gene selection.
2. Organize and/or arrange data of the success rates of different methods to highlight trends or patterns.3. Use relationships identified in the data to predict the best gene selection method to use in a given situation.4. Identify, among distractors, the potential real-world uses of this data.
NGSS Cluster/Item Specifications October 2017 38

Performance Expectation MS-PS1-1Develop models to describe the atomic composition of simple molecules and extended structures.
DimensionsDeveloping and Using Models Develop and/or use a model to predict and/or describe phenomena.
PS1.A: Structure and Properties of Matter Substances are made from different types of atoms, which combine with one another in various ways. Atoms
form molecules that range in size from two to thousands of atoms. Solids may be formed from molecules, or they may be extended structures with repeating subunits (e.g.,
crystals).Scale, Proportion, and Quantity Time, space, and energy phenomena can be observed at various scales, using models to study systems that are
too large or too small.
Clarifications and Content LimitsClarification Statements: Emphasis is on identifying elements vs. compounds and their basic units of atoms and molecules. Emphasis is on developing models of molecules that vary in complexity. Examples of simple molecules could include ammonia, methanol, methane, water, carbon dioxide, etc. Examples of molecular-level models could include drawings, 3D ball and stick structures, or computer
representations showing different molecules with different types of atoms.Content Limits: Assessment does not include valence electrons and bonding energy, discussing the ionic nature of subunits of
complex structures, or a complete description of all individual atoms in a complex molecule or extended structure is not required.
Modelling should be limited to molecules that have only one type of bond, no combination of bonds; the structure of the molecule is easy to model; single bonded molecules.
Examples of extended structures could include sodium chloride or diamonds. Students are not expected to memorize the atomic characteristics of any element. Students do not need to know: valence electrons and bonding energy, discussing the ionic nature of subunits of
complex structures, a complete description of all individual atoms in a complex molecule or extended structure, memorization of atoms found in different molecule, VSEPR or geometric arrangements, the difference between single, double, and triple bonding, periodic table patterns and how it affects bonding, oxidation numbers, polyatomic ions.
Science Vocabulary Students Are Expected to Know Atoms Molecules Element Compound Mixtures Homogenous
Heterogeneous Pure substances Solution Solvent Solute
Science Vocabulary Students Are Not Expected to Know Valence electrons subatomic particles such as protons Electrons Neutrons
Neutrinos etc. ions positive or negative charges covalent bond
NGSS Cluster/Item Specifications October 2017 39

ionic bond
PhenomenaSome example phenomena for MS-PS1-1:
Submarines can stay underwater for months using sea water as a source of oxygen for air. Special machines run electricity through large amounts of sea water, generating oxygen from the water.
Water and hydrogen peroxide are both made up of hydrogen and oxygen. When water ispoured on a chunk of CaCO3, there is no reaction. When hydrogen peroxide is poured on a chunk of CaCO3, it fizzes.
Graphite is an extremely soft substance and diamonds are the hardest substance known. Both are made completely of carbon atoms in different arrangements.
Oxygen (O2) is a gas we breathe to stay alive. Ozone (O3), also made only of oxygen atoms, is unhealthy to breathe.
Task Demands Supported by This Performance Expectation and associated Evidence Statements 1. Identify or assemble from a collection of potential model components, including distractors, components of a
model that describes the structures of atoms, molecules, or extended molecules and/or how they interact, or explains how atoms of the same/different element(s) are arranged in repeated patterns in extended structures.
2. Describe, select, and/or identify the relationships among components of a model that describes the structures of atoms, molecules, or extended molecules and/or how they interact, or explains how atoms of the same/different element(s) are arranged in repeated patterns in extended structures.
3. Assemble, illustrate, describe, and/or complete a model or manipulate components of a model to describe the structure of an atom, molecule, or extended molecule and/or how they interact, or to explain or predict how atoms of the same/different element(s) are arranged in repeated patterns in extended structures.
NGSS Cluster/Item Specifications October 2017 40

Performance Expectation MS-PS2-3Ask questions about data to determine the factors that affect the strength of electrical and magnetic forces.
DimensionsAsking Questions and Defining Problems Ask questions that can be investigated within the scope of the classroom, outdoor environment, and museums
and other public facilities with available resources and, when appropriate, frame a hypothesis based on observations and scientific principles.
PS2.B: Types of Interactions Electric and magnetic (electromagnetic) forces can be attractive or repulsive, and their sizes depend on the
magnitudes of the charges, currents, or magnetic strengths involved and on the distances between the interacting objects.
Cause and Effect Cause and effect relationships may be used to predict phenomena in natural or designed systems.
Clarifications and Content LimitsClarification Statements:
Examples could include electromagnets, electric motors, or generators. Examples of data could include the effect of the number or turns of wire on the strength of an electromagnet,
or of increasing the number or strength of magnets on the speed of an electric motor.Content Limits:
Quantitative responses are limited to proportional reasoning and algebraic thinking.
Science Vocabulary Students Are Expected to Know Attraction Charge Conductor Electric charge Electric current Electric field Electric force Electromagnetic field Electromagnet Frequency Induction
Insulator Magnetic field Magnetic field lines Magnetic force Permanent magnet Polarity Repulsion Resistance Voltage
Science Vocabulary Students Are Not Expected to Know Lorentz force Electric potential Electromotive force
PhenomenaSome example phenomena for MS-PS2-3:
A radio emits music from its speakers. After a magnet in the speakers is removed, no sound can be heard. More electrical current is produced by a windmill when the wind speed is greater. Merchandise from a store that uses electromagnetic anti-shoplifting devices will set off an alarm at the exit if
the tag is not removed. An electromagnet at a junkyard can lift old cars, while a homemade electromagnet cannot pick up much more
than a few paper clips.
NGSS Cluster/Item Specifications October 2017 41
Task Demands Supported by This Performance Expectation and associated Evidence 1. Make and/or record observations about the factors that affect electromagnets, electric motors, or generators.2. Organize and/or arrange (e.g., using illustrations and/or labels), or summarize data to highlight trends, patterns,
or correlations.3. Generate/construct graphs, tables, or assemblages of illustrations and/or labels of data that document patterns,
trends, or correlations in the factors that affect the strength of electric and magnetic forces. This may include sorting out distractors.
4. Explain or describe the causal processes that lead to the observed data.5. Use relationships identified in the data to predict the strength of electric and/or magnetic forces.
NGSS Cluster/Item Specifications October 2017 42
Performance Expectation MS-PS4-1Use mathematical representations to describe a simple model for waves that includes how the amplitude of a wave is related to the energy in a wave.
DimensionsUsing Mathematics and Computational Thinking
Use mathematical representations to describe and/or support scientific conclusions and design solutions.
PS4.A: Wave Properties A simple wave has a repeating pattern with a specific wavelength, frequency, and amplitude.
Patterns Graphs and charts can be used to identify patterns in data.
Clarifications and Content LimitsClarification Statements:
Emphasize describing waves with both quantitative and qualitative thinking. Examples could include using graphs, charts, computer simulations, or physical models to demonstrate
amplitude and energy correlation. All equations and formulas must be provided and be age-appropriate.
Content Limits: Assessment does not include electromagnetic waves and is limited to standard repeating waves. Assessment does not include identifying or knowing characteristics of different types of waves (mechanical,
electromagnetic, sonic, etc.). Students do not need to know: how two waves carrying the same energy can have different amplitudes when
introduced into materials of different densities and elasticities.
Science Vocabulary Students Are Expected to Know Speed Force Kinetic energy Proportional Sound wave
Wavelength Frequency Resting position Medium
Science Vocabulary Students Are Not Expected to Know Elastic Seismic wave Crest
Trough Oscillate
PhenomenaSome example phenomena for MS-PS4-1:
The 1896 Sanriku earthquake off the coast of Japan generated ocean waves that reached a height of 100 feet (30 m).
Compared to a megaphone that sends sound messages up to 300 meters away, a Long Range Acoustic Device (LRAD) sends messages that can be heard up to 5,500 meters away.
Scientists at the Swiss Federal Institute in Zurich caused a toothpick to levitate using sound waves. A wave travels down a rope from one student to another when the first student shakes it.
NGSS Cluster/Item Specifications October 2017 43

Task Demands Supported by This Performance Expectation and associated Evidence Statements 1. Compile and analyze data to make an inference about the relationship between amplitude and energy of a
wave. This may include sorting out relevant from irrelevant data in the given information.2. Organize and/or arrange (e.g., using illustrations and/or labels) or summarize data to highlight trends, patterns,
or correlations that reflect how energy changes with amplitude of a wave and vice versa.3. Identify how wave characteristics correspond to physical observations (e.g., wave amplitude corresponds to
sound volume).4. Use relationships identified in the data to predict the energy or amplitude change of a wave if the other
parameter is changed.5. Based on data, calculate or estimate one property of a wave (energy or amplitude) and the relationships
between different properties of a wave.6. Use graphs, charts, simulations, or physical models to demonstrate amplitude and energy correlation.
NGSS Cluster/Item Specifications October 2017 44

Performance Expectation HS-ESS2-1Develop a model to illustrate how Earth’s internal and surface processes operate at different spatial and temporal scales to form continental and ocean-floor features.
DimensionsDeveloping and Using Models
Develop a model based on evidence to illustrate the relationships between systems or between components of a system.
ESS2.A. Earth Materials and Systems Earth’s systems, being dynamic and interacting, cause feedback effects that can increase or decrease the
original changes.ESS2.B. Plate Tectonics and Large-Scale System Interactions
Plate tectonics is the unifying theory that explains the past and current movements of the rocks at Earth’s surface and provides a framework for understanding its geologic history.
Plate movements are responsible for most of continental and ocean-floor features and for the distribution of most rocks and minerals within Earth’s crust.
Stability and Change Change and rates of change can be quantified and modeled over very short or very long periods of time. Some
system changes are irreversible.
Clarifications and Content LimitsClarification Statements:
Emphasis is on how the appearance of land features (such as mountains, valleys, and plateaus) and sea floor features (such as trenches, ridges, and seamounts) are a result of both constructive forces (such as volcanism, tectonic uplift, and orogeny) and destructive mechanisms (such as weathering, mass wasting, and coastal erosion).
Content Limits: Students do not need to know: the details of the formation of specific geographic features of Earth’s surface.
Science Vocabulary Students Are Expected to Know Plate tectonics Tectonic uplift Erosion Seismic waves Feedback effect Irreversible, temporal Spatial, Earth’s magnetic field Electromagnetic radiation Inner core Outer core, mantle Continental crust Oceanic crust
Sea-floor spreading Isotope Thermal convection Radioactive decay Weathering, rock composition Rock strata Continental boundary Ocean trench Recrystallization Nuclear Geochemical reaction Mass wasting
Science Vocabulary Students Are Not Expected to Know Geomorphology Anticline Syncline Monocline
NGSS Cluster/Item Specifications October 2017 45

PhenomenaSome sample phenomena for HS-ESS2-1:
A limestone cliff that contains Cambrian-aged fossils extends several hundred feet above the surface of the ocean. A large section of the cliff has collapsed.
An oceanic trench 10,000 is meters below sea level. Inland, 200km away, a chain of active volcanoes is present. 1.8 billion year old rocks in the Black Hills of South Dakota are capped by 10,000 year old gravel terraces. A photograph from March shows large Precambrian-aged pink granite boulder at the top of a 100 m tall hill. A
photograph in April shows the same boulder sitting in a pile of soil and sediment in the valley below the hill.
Task Demands Supported by This Performance Expectation and associated Evidence Statements 1. Select or identify from a collection of potential model components, including distractors, the components that
are relevant for explaining the phenomenon. Components might include different rock types, rates of uplift and erosion, surface environments on Earth where these processes occur and where different rock types exist, and layers within Earth where these processes occur. Sources of energy (radiation, convection) that drive the cycling (but not the creation of) matter should also be included as components. *(SEP/DCI/CCC)
2. Manipulate the components of a model to demonstrate the changes, properties, processes, and/or events that act to result in the phenomenon of Earth’s internal and surface processes.
3. Make predictions about the effects of changes in the magnitude and/or rate of Earth’s internal and surface properties. Predictions can be made by manipulating model components, completing illustrations, or selecting from lists with distractors.
4. Given models or diagrams of land features, internal and surface processes, identify factors that affect constructive and destructive forces, feedback effects and how they vary in different scenarios OR identify the constructive and destructive mechanisms that operate at different spatial and temporal time scales and how this causes changes in the appearance of continental and ocean-floor features.
5. Identify missing components, relationships, or other limitations of the model of how Earth’s internal and surface processes form continental and ocean-floor features.
6. Describe, identify, or select the relationships among components of a model that describe the formation of continental and ocean-floor features with respect to spatial and temporal variability in internal and external surface processes or explains how changes in these processes affect the formation of continental and ocean- floor features. *(SEP/DCI/CCC)
7. Express or complete a causal chain explaining how changes in the flow of energy (interval vs. surface processes) affect the formation of continental and ocean-floor features. This may include indicating directions of causality in an incomplete model such as a flow chart or diagram, or completing cause and effect chains.
*denotes those task demands which are deemed appropriate for use in stand-alone item development
NGSS Cluster/Item Specifications October 2017 46
Performance Expectation HS-ESS2-4Use a model to describe how variations in the flow of energy into and out of Earth’s systems result in changes in climate.
DimensionsDeveloping and Using Models
Use a model to provide mechanistic accounts of phenomena.ESS1.B: Earth and the Solar System
Cyclical changes in the shape of Earth’s orbit around the sun, together with changes in the tilt of the planet’s axis of rotation, both occurring over hundreds of thousands of years, have altered the intensity and distribution of sunlight falling on Earth. These phenomena cause a cycle of ice ages and other gradual climate changes. (secondary)
ESS2.A: Earth Materials and Systems The geologic record shows that changes to global and regional climate can be caused by interactions among
changes in the sun’s energy output of Earth’s orbit, tectonic events, ocean circulation, volcanic activity, glaciers, vegetation, and human activities. These changes can occur on a variety of timescales from sudden (e.g., volcanic ash clouds) to intermediate (ice ages) to very long-term tectonic cycles.
ESS2.D: Weather and Climate The foundation for Earth’s global climate system is the electromagnetic radiation from the sun, as well as its
reflection, absorption, storage, and redistribution among the atmosphere, ocean, and land systems and this energy’s re-radiation into space. Cause and Effect
Empirical evidence is required to differentiate between cause and correlation and make claims about specific causes and effects.
Clarifications and Content LimitsClarification Statements:
Examples of the causes of climate change differ by time scale, over 1-10 years: large volcanic eruption, ocean circulation; 10-100s of years: changes in human activity, ocean circulation, solar output; 10-100s of thousands of years: changes to Earth's orbit and the orientation of its axis; and 10-100s of millions of years: long-term changes in atmospheric composition.
Content Limits: Assessment of the results of changes in climate is limited to changes in surface temperatures, precipitation
patterns, glacial ice volumes, sea levels, and biosphere distribution. Students do not need to know: chemical mechanisms of fossil fuel combustion or ozone depletion.
Science Vocabulary Students Are Expected to Know Earth’s orbit Cyclic, dependent Interdependence Solar radiation Chemical process Solar flare Biosphere Atmospheric circulation Ocean circulation Climatic pattern Carbon dioxide Climate change Sea level Glacier Atmospheric composition
Hydrosphere Greenhouse gas Fossil fuel Human impact Combustion Global warming
NGSS Cluster/Item Specifications October 2017 47
Science Vocabulary Students are Not Expected to Know Acidification Cryosphere
PhenomenaSome example phenomena for HS-ESS2-4:
Temperatures were warmer in 1990 than in the 5 previous years. In 1992 and 1993, the global temperatures were 1°F cooler than in 1991. (volcanic eruption of Mount Pinatubo)
11,000 years ago large portions of the northern United States contained glaciers. Today, very little of this area contains glaciers. (changes to Earth’s orbit)
Earth experiences 4 distinct seasons. Venus does not experience distinct seasons. (tilt of planet’s axis) 25,000 years ago, the level of carbon dioxide in the atmosphere was around 180 parts per million (ppm).
Today, carbon dioxide levels exceed 400 ppm. (atmospheric composition)
Task Demands Supported by This Performance Expectation and associated Evidence 1. Select or identify from a collection of potential model components, including distractors, the components that
are relevant for explaining the phenomenon. Components might include factors that affect the input, storage, redistribution, and output of energy in Earth’s systems.
2. Manipulate the components of a model to demonstrate the changes, properties, processes, and/or events that act to result in the phenomenon of the flow of energy in Earth’s systems.
3. Make predictions about the effects of changes in energy flow on Earth’s climate.4. Given models or diagrams of energy flow in Earth’s systems, identify factors that affect energy input, output,
storage, and redistribution and how they change in different scenarios OR identify the changes in energy flow that cause changes in Earth’s climate.
5. Identify missing components, relationships, or other limitations of the model of energy flow in Earth’s systems.6. Describe, identify, or select the relationships among components of a model that describe changes in the flow of
energy in Earth’s systems or explains how changes in energy flow affect climate.7. Express or complete a causal chain explaining how changes in the flow of energy in Earth’s systems affects
climate. This may include indicating directions of causality in an incomplete model such as a flow chart or diagram, or completing cause and effect chains.
NGSS Cluster/Item Specifications October 2017 48

Performance Expectation HS-ESS3-3Create a computational simulation to illustrate the relationships among the management of natural resources, the sustainability of human populations, and biodiversity.
DimensionsUsing Mathematics and Computational Thinking
Create a computational model or simulation of a phenomenon, designed device, process, or system.ESS3.C: Human Impacts of Earth Systems
The sustainability of human societies and the biodiversity that supports them require responsible management of natural resources.
Stability and Change Change and rates of change can be quantified and modeled over very short or very long periods of time. Some
system changes are irreversible.
Clarifications and Content LimitsClarification Statements:
Examples of factors that affect the management of natural resources include the costs of resource extraction and waste management, per-capita consumption, and development of new technologies.
Examples of factors that affect human sustainability include agricultural efficiency, levels of conservation, and urban planning.
Content Limits Assessment for computational simulations is limited to using provided multi-parameter programs or
constructing simplified spreadsheet calculations.
Science Vocabulary Students Are Expected to Know Biosphere Geosphere Hydrosphere Atmosphere Renewable Non-renewable Mitigation Economic cost Irreversible Reversible Exponential Logarithmic Basin Sustainability Ecological Biome Recycle
Reuse Ecosystem Pollution Species Fresh water Mineral Vegetation Societal Wetland Groundwater Human activity Human impact Metal Consumption Per-capita Biodiversity Stabilize
Resource availability Fossil fuel Mining Conservation Extract Agriculture Timber Fertile land Solar radiation Biotic Abiotic Depletion Extinction Economics Manufacturing Technology
Science Vocabulary Students Are Not Expected to Know Trigonometric Derivative Feedback Regulation Dynamic
Aquifer Hydrothermal Geopolitical Harvesting of resources,
oil shale
Tar sand Urban planning Waste management Fragmentation
NGSS Cluster/Item Specifications October 2017 49

NGSS Cluster/Item Specifications October 2017 50

PhenomenaSome example phenomena for HS-ESS3-3:
The number of birds and other wildlife in an area decreases by 30% after a shopping mall is built in northern California.
Two 1,330 square-foot homes are side by side in northern California. One has six solar panels on the roof, and the other does not. During one month in June, the one with solar panels produces less carbon dioxide than the other house by 384 pounds.
Beetles are present throughout a forest. Chemicals are sprayed at intervals needed to control the beetles on one acre. Fifty years later, this acre is the only part of the forest that has oak trees.
Three species of fish, the Colorado squawfish, the roundtail chub, and the bonytail chub became extinct in the years immediately following construction of the Glen Canyon Dam in Colorado.
Task Demands Supported by This Performance Expectation and associated Evidence Statements 1. Use data to calculate or estimate the effect of an action or solution on natural resources, the sustainability of
human populations, and/or biodiversity.2. Illustrate, graph, or identify features or data that can be used to determine the effects of an action or solution
on natural resources, the sustainability of human populations, and/or biodiversity.3. Estimate or infer the effects of an action or solution that affects natural resources, the sustainability of human
populations, and/or biodiversity. *(in combination with TD4 only)4. Compile the data needed for an inference about the impacts of an action or solution on natural resources, the
sustainability of human populations, and/or biodiversity. This can include sorting out the relevant data from the given information (or choosing relevant inputs for a simulation). *(SEP/DCI – in combination with 3 to hit CCC)
5. Using given information, select or identify the criteria against which the solution should be judged.6. Using a simulator, test a proposed action or solution and evaluate the outcomes; may include proposing
modifications to the action or solution. *(SEP/DCI/CCC)7. Evaluate and/or critique models, simulations, or predictions in terms of identifiable limitations and whether or
not they yield realistic results. *(SEP/DCI/CCC)*denotes those task demands which are deemed appropriate for use in stand-alone item development. NOTE: If TD 3 or TD4 are used, they must be paired with another approved TD.
NGSS Cluster/Item Specifications October 2017 51

Performance Expectation HS-ESS-3-5Analyze geoscience data and the results from global climate models to make an evidence-based forecast of the current rate of global or regional climate change and associated future impacts on Earth’s systems.
DimensionsAnalyzing and Interpreting Data Analyze data using computational models in order to make valid and reliable scientific claims.
ESS3.D: Global Climate Change Though the magnitudes of human impacts are greater than they have ever been, so too are human abilities to
model, predict, and manage current and future impacts.Stability and Change Change and rates of change can be quantified and modeled over very short or very long periods of time. Some
system changes are irreversible.
Clarifications and Content LimitsClarification Statements: Examples of evidence, for both data and climate model outputs, are for climate changes (such as precipitation
and temperature) and their associated impacts (such as sea level, glacial ice volumes, or atmosphere and ocean composition).
Content Limits: Assessment is limited to one example of a climate change and its associated impacts.
Science Vocabulary Students are Expected to Know Carbon dioxide Climate change Cyclical Distribution Latitudinal Longitudinal Orientation Probabilistic Redistribute Time scale Volcanic ash Concentration Electromagnetic radiation Radiation
Sea level Geochemical reaction Geoscience Greenhouse gas Atmospheric change Earth’s systems Biosphere Global temperature Global warming Climate science Sea level Ice core Methane Glacier
Science Vocabulary Students Are Not Expected to Know Anthropogenic Absorption spectrum Determinant
NOX Carbon Footprint
PhenomenaSome example phenomena for HS-ESS3-5:
The model predictions for the Great Lakes region of the United States consist of increased precipitation of 5-30% during the spring and decreased precipitation of 5-10% in the summer.
Concentrations of CO₂ under the higher emissions scenario for 2100 could reach as high as 850 parts per million (ppm).
NGSS Cluster/Item Specifications October 2017 52

Global warming of 2°C is predicted by the year 2050. The model mean global temperature change for a high emissions scenario is 4-6°.
Task Demands Supported by This Performance Expectation and associated Evidence Statements 1. Organize and/or arrange (e.g., using illustrations and/or labels), or summarize data to highlight trends, patterns,
or correlations in global or regional climate models and their associated future impacts on Earth’s systems.2. Generate/construct graphs, tables, or assemblages of illustrations and/or labels of data that document patterns,
trends, or correlations in global or regional climate models to forecast regional climate change and the associated future impacts on Earth’s systems. This may include sorting out distractors.
3. Use relationships identified in the data to forecast the current rate of global or regional climate change and how it will affect Earth’s systems.
4. Identify patterns or evidence in the data that supports inferences about how the changing of global or regional climates will affect Earth’s systems in the long term.
NGSS Cluster/Item Specifications October 2017 53

Performance Expectation HS-LS1-3Plan and conduct an investigation to provide evidence that feedback mechanisms maintain homeostasis.
DimensionsPlanning and Carrying Out Investigations Plan and conduct an investigation individually and collaboratively to produce data to serve as the basis for
evidence. In the design decide on types, how much, and accuracy of data needed to produce reliable measurements and consider limitations on the precision of the data (e.g., number of trials, cost, risk, time), and refine the design accordingly.
LS1.A: Structure and Function Feedback mechanisms maintain a living system’s internal conditions within certain limits and mediate behaviors,
allowing it to remain alive and functional even as external conditions change within some range. Feedback mechanisms can encourage (through positive feedback) or discourage (negative feedback) what is going on inside the living system.
Stability and Change Feedback (negative or positive) can stabilize or destabilize a system.
Clarifications and Content LimitsClarification Statements: Examples of investigations could include heart rate response to exercise, stomate response to moisture and
temperature, and root development in response to water levels.Content Limits: Assessment does not include the cellular processes involved in the feedback mechanism.
Science Vocabulary Students Are Expected to Know Equilibrium Steady state Stable state Balanced state Feedback loop Positive feedback mechanism/loop Negative feedback mechanism/loop Stimulus, receptor Biotic factor Abiotic factor External environment Internal environment Cell, tissue, organ Muscle Nerve
Hormone Enzyme Chemical regulator Gland, system Metabolism/metabolic Disturbance, fluctuation Maintenance Concentration Input Output Hibernation Convection Conduction Radiation Evaporation
Science Vocabulary Students Are Not Expected to Know Effector Osmoregulation Conformer Set point Sensor Circadian rhythm
Acclimatization Thermoregulation Endothermic Ectothermic Integumentary system Countercurrent exchange
Bioenergetics Basal metabolic rate Standard metabolic rate Torpor Poikilotherm
Homeotherm Countercurrent heat exchange
NGSS Cluster/Item Specifications October 2017 54

PhenomenaSome example phenomena for HS-LS1-3:
Fruit ripeness (positive feedback loop):In nature, a tree or bush will suddenly ripen all of its fruits or vegetables without any visible signal.
Human blood sugar concentration (negative feedback loop):The liver both stores and produces sugar in response to blood glucose concentration.The pancreas releases either glucagon or insulin in response to blood glucose concentration.
Water content of plant cells (negative feedback loop):Stomata are generally open during the daytime when photosynthesis is active and are closed at night. However, scientists observe that stomata may even close during the day under hot, dry conditions.Guard cells surrounding the stomata expand and dilate in response to turgor/water pressure.
Human digestion (positive feedback loop):Once digestion begins, it becomes a self-accelerating process.
Dragonfly posture (negative feedback loop):Dragonfly’s obelisk posture is an adaptation that minimizes the amount of body surface exposed to the sun. Posture helps reduce heat gain by radiation.
Sunning lizards (negative feedback loop):Lizards sun on a warm rock to regulate body temperature.
Thermoregulation in dolphins due to counter-current arrangement of veins around arteries (negative feedback loop):
The counter-current system minimizes the loss of heat incurred when blood travels to the different parts of dolphins’ bodies.
Hawk-moths shiver as a preflight warm up (includes both negative and positive feedback):Hawk-moths shiver to contract and warm up their thoracic muscles before flight.
Incubation of Burmese pythons’ eggs (negative feedback loop):A Burmese python wraps herself around her eggs and contracts her muscles to keep the eggs warm.
Ectotherms vs Endotherms (negative feedback loop):Cold-blooded fish use the environmental temperature to control their internal temperatures and therefore cannot maintain a constant metabolic rate. In contrast, warm-blooded whales use homeostasis to maintain their internal temperatures and therefore can maintain a constant metabolic rate.
Task Demands Supported by This Performance Expectation and associated Evidence Statements 1. Identify the outcome data that should be collected in an investigation to provide evidence that feedback
mechanisms maintain homeostasis. This could include measurements and/or identifications of changes in the external environment, the response of the living system, stabilization/destabilization of the system’s internal conditions, and/or the number of systems for which data are collected.
2. Make and/or record observations about the external factors affecting systems interacting to maintain homeostasis, responses of living systems to external conditions, and/or stabilization/destabilization of the systems’ internal conditions. *(SEP/DCI/CCC)
3. Identify or describe the relationships, interactions, and/or processes that contribute to and/or participate in the feedback mechanisms maintaining homeostasis that lead to the observed data.
4. Using the collected data, express or complete a causal chain explaining how the components of (a) mechanism(s) interact in response to a disturbance in equilibrium in order to maintain homeostasis. This may include indicating directions of causality in an incomplete model such as a flow chart or diagram, or completing cause and effect chains. *(SEP/DCI/CCC)
5. Evaluate the sufficiency and limitations of data collected to explain the cause and effect mechanism(s) maintaining homeostasis.
*denotes those task demands which are deemed appropriate for use in stand-alone item development
NGSS Cluster/Item Specifications October 2017 55
Performance Expectation HS-LS2-3Construct and revise an explanation based on evidence for the cycling of matter and flow of energy in aerobic and anaerobic conditions.
DimensionsConstructing Explanations and Designing Solutions Construct and revise an explanation based on valid and reliable evidence obtained from a variety of sources
(including students’ own investigations, models, theories, simulations, and peer review) and the assumption that theories and laws that describe the natural world operate today as they did in the past and will continue to do so in the future.
LS2.B: Cycles of Matter and Energy Transfer in Ecosystems Photosynthesis and cellular respiration (including anaerobic processes) provide most of the energy for the
processes.Energy and Matter Energy drives the cycling of matter within and between systems.
Clarifications and Content LimitsClarification Statements: Emphasis is on conceptual understanding of the role of aerobic and anaerobic respiration in different
environments. Emphasis is on conceptual understanding that the supply of energy and matter restricts a system’s operation;
for example, without inputs of energy (sunlight) and matter (carbon dioxide and water), a plant cannot grow.Content Limits: Assessment does not include the specific chemical processes of either aerobic or anaerobic respiration. Students do not need to know: lactic acid vs. alcoholic fermentation, chemical equations for photosynthesis,
cellular respiration, or fermentation.
Science Vocabulary Students Are Expected to Know Energy flow Organic compound synthesis Reaction Chemical processes and chemical reaction Carbon dioxide Molecule, photosynthesis Cellular respiration Compound
Flow of matter Net transfer Biomass Carbon cycle Solar energy Derive Transform matter and energy
Science Vocabulary Students Are Not Expected to Know Lactic acid fermentation Alcoholic fermentation Glycolysis
Kreb’s cycle Electron transport chain
PhenomenaSome example phenomena for HS-LS2-3:
After running for a long period of time, human muscles develop soreness and a burning sensation, and breathing rate increases.
Bread baked with yeast looks and tastes differently than bread that is baked without yeast. A plant that is watered too much will have soft, brown patches on their leaves and will fail to grow. Cyanobacteria differ from other bacteria in that cyanobacteria appear blue-green in color and also lack flagella.
NGSS Cluster/Item Specifications October 2017 56

Task Demands Supported by This Performance Expectation and associated Evidence Statements 1. Describe, identify, or select evidence supporting or contradicting a claim about the role of photosynthesis and
aerobic and anaerobic respiration in the cycling of matter and energy in an ecosystem.2. Identify and justify additional pieces of evidence that would help distinguish between competing hypotheses.3. Express or complete a description of the flow of energy and/or matter between organisms. This may include
indicating directions of causality in an incomplete model such as a flow chart or diagram, or completing cause- and-effect chains.
4. Articulate, describe, or select the relationships, interactions, and/or processes to be explained. This may entail sorting relevant from irrelevant information or features of the reactants and products.
5. Given an appropriate explanation for a phenomenon, predict the effects of subsequent changes in environmental conditions on the flow of matter and energy between organisms.
NGSS Cluster/Item Specifications October 2017 57

Performance Expectation HS-LS3-1Ask questions to clarify relationships about the role of DNA and chromosomes in coding the instructions for characteristic traits passed from parents to offspring.
DimensionsAsking Questions and Defining Problems
Ask questions that arise from examining models or a theory to clarify relationships. LS1.A: Structure and Function
All cells contain genetic information in the form of DNA molecules. Genes are regions in the DNA that contain the instructions that code for the formation of proteins. (secondary)LS3.A: Inheritance of Traits
Each chromosome consists of a single very long DNA molecule, and each gene on the chromosome is a particular segment of that DNA. The instructions for forming species’ characteristics are carried in DNA. All cells in an organism have the same genetic content, but the genes used (expressed) by the cell may be regulated in different ways. Not all DNA codes for a protein; some segments of DNA are involved in regulatory or structural functions, and some have no as-yet known function.
Cause and Effect Empirical evidence is required to differentiate between cause and correlation and to make claims about specific
causes and effects.
Clarifications and Content LimitsClarification Statements: All cells in an organism have identical DNA but certain genes are expressed in specific cells, causing cell
differentiation. At this level, the study of inheritance is restricted to Mendelian genetics, including dominance,
codominance, incomplete dominance, and sex-linked traits. Focus is on expression of traits on the organism level and should not be restricted to protein production.
Content Limits: Assessment does not include the phases of meiosis or the biochemical mechanism of specific steps in the
process. Assessment does not include mutations or species-level genetic variation including Hardy- Weinberg
equilibrium.
Science Vocabulary Students Are Expected to Know Genome Genotype Phenotype Transcription Translation Mitosis Meiosis Zygote Fertilization Dominant Recessive Codominance Incomplete dominance Sex-linked Allele
Punnett square Sequencing Protein Pedigree Parent generation F1, F2 Haploid Diploid Replication
NGSS Cluster/Item Specifications October 2017 58

Science Vocabulary Students Are Not Expected to Know Epigenetics Interphase Prophase Metaphase
Anaphase Telophase Cytokinesis Epistasis
PhenomenaSome example phenomena for HS-LS3-1:
DNA sequencing shows that all people have the gene for lactase production, but only about 30% of adults can digest milk.
Polydactyl tabby cat Jake holds the world record for most toes, with seven toes on each paw. Albinism exists in all mammals. E. coli bacteria are healthful in mammalian intestines, but makes mammals sick when ingested. E. coli bacteria are used to produce human insulin.
Task Demands Supported by This Performance Expectation and associated Evidence Statements 1. Identify or construct an empirically testable question based on the phenomenon that could lead to design of an
experiment or model to define the relationships between the role of DNA and/or chromosomes in the inheritance of traits.*(SEP/DCI/CCC)
2. Based on an empirically testable question, assemble or complete, from a collection of potential model components, an illustration, flow chart, or pedigree that is capable of representing the role of DNA and/or chromosomes in coding the instructions for inheritance. *(SEP/DCI/CCC)
3. Construct a question that arises from examining a model or theory to clarify the connections between DNA/chromosomes and inheritance of traits.*(SEP/DCI)
4. Make predictions about the pattern of inheritance based on a model derived from the empirically testable question. Predictions can be made by manipulating model components, completing illustrations, or selecting from lists with distractors.
*denotes those task demands which are deemed appropriate for use in stand-alone item development
NGSS Cluster/Item Specifications October 2017 59

Performance Expectation HS-LS4-6Create or revise a simulation to test a solution to mitigate adverse impacts of human activity on biodiversity.
DimensionsUsing Mathematics and Computational Thinking
Create or revise a simulation of a phenomenon, designed device, process, or system.LS4.C: Adaptation
Changes in the physical environment, whether naturally occurring or human induced, have thus contributed to the expansion of some species, the emergence of new distinct species as populations diverge under different conditions, and the decline―and sometimes the extinction―of some species.
LS4.D: Biodiversity and Humans Humans depend on the living world for the resources and other benefits provided by biodiversity. But human
activity is also having adverse impacts on biodiversity through overpopulation, overexploitation, habitat destruction, pollution, introduction of invasive species, and climate change. Thus, sustaining biodiversity so that ecosystem functioning and productivity are maintained is essential to supporting and enhancing life on Earth. Sustaining biodiversity also aids humanity by preserving landscapes of recreational or inspirational value.
ETS1.B: Developing Possible Solutions When evaluating solutions, it is important to take into account a range of constraints, including cost, safety,
reliability, and aesthetics, and to consider social, cultural, and environmental impacts (secondary). Both physical models and computers can be used in various ways to aid in the engineering design process.
Computers are useful for a variety of purposes, such as running simulations to test different ways of solving a problem or to see which one is most efficient or economical, and in making a persuasive presentation to a client about how a given design will meet his or her needs (secondary).
Cause and Effect Empirical evidence is required to differentiate between cause and correlation and make claims about specific
causes and effects.
Clarifications and Content LimitsClarification Statements
Emphasis is on designing solutions for a proposed problem related to threatened or endangered species, or to genetic variation of organisms for multiple species.
The simulation should model the effect of human activity and provide quantitative information about the effect of solutions on threatened or endangered species or to genetic variation within a species.
Content Limits Students do not need to know: Calculus/advanced mathematics (e.g., exponential growth and decay)
Science Vocabulary Students Are Expected to Know Climate change Genetic variation Invasive species Adverse Anthropogenic Efficient Overexploitation Urbanization Acidification Deforestation Carbon dioxide Concentration
Radiation Greenhouse gas Surface runoff Civilization Consumption Mass wasting Urban development Per- capita Degradation Pollutant Best practice Cost-benefit
NGSS Cluster/Item Specifications October 2017 60
Extract Harvesting of resources
Regulation
Science Vocabulary Students Are Not Expected to Know Oligotrophic and eutrophic
lakes/eutrophication Littoral zone Exponential population growth Logistic population growth Ecological footprint
Ecosystem services Extinction vortex Minimum viable population Effective population size Critical load
PhenomenaSome example phenomena for HS-LS4-6:
The habitat of the Florida Panther is only 5% of its former range, causing the species to become endangered.
The café marron plant is critically endangered due to massive habitat destruction on the Island of Rodrigues in the Indian Ocean, as a result of deforestation for agricultural use.
The population of Atlantic Bluefin Tuna has declined by more than 80% since 1970 due to overfishing. In the past 120 years, about eighty percent of suitable orangutan habitat in Indonesia has been lost from
expansion of oil palm plantations. At the same time, the estimated number of orangutans on Borneo, an island in Indonesia, has declined from about 230,000 to about 54,000.
Task Demands Supported by This Performance Expectation and Associated Evidence Statements1. Use data to calculate or estimate the effect of a solution on mitigating the adverse impacts of human activity on
biodiversity.2. Illustrate, graph, or identify features or data that can be used to determine how effective a solution is for
mitigating the adverse impacts of human activity on biodiversity.3. Estimate or infer the properties or relationships that lead to mitigation of the adverse impacts of human activity
on biodiversity, based on data.4. Compile the data needed for an inference about the impacts of human activity on biodiversity. This can include
sorting out the relevant data from the given information.5. Using given information, select or identify the criteria against which the solution should be judged.6. Using a simulator, test a proposed solution and evaluate the outcomes; may include proposing modifications to
the solution.*
*In order to satisfy this PE, the student must use a simulator. Therefore, this task demand must always be used.
NGSS Cluster/Item Specifications October 2017 61

Performance Expectation HS-PS1-1Use the periodic table as a model to predict the relative properties of elements based on the patterns of electrons in the outermost energy level of atoms.
DimensionsDeveloping and Using Models
Use a model to predict the relationships between systems or between components of a system.
PS1.A: Structure and Properties of Matter Each atom has a charged substructure consisting of a nucleus, which is made of protons and neutrons,
surrounded by electrons. The periodic table orders elements horizontally by the number of protons in the atom’s nucleus and places
those with similar chemical properties in columns. The repeating patterns of this table reflect patterns of outer electron states.
Patterns Different patterns may be observed at each of the scales at which a system is studied and can provide evidence
for causality in explanations of phenomena.
Clarifications and Content LimitClarification Statements
Examples of properties that could be predicted from patterns could include reactivity of metals, types of bonds formed, numbers of bonds formed, and reactions with oxygen.
Content Limits Assessment is limited to main group elements. Assessment does not include quantitative understanding of ionization energy beyond relative trends. Students do not need to know: Properties of individual elements, names of groups, anomalous electron
configurations (Chromium and Copper)
Science Vocabulary Students are Expected to Know Proton Electron Neutron Valence shell Filled shell Ion Cation Anion Solid Liquid Gas Metal Nonmetal Metalloid Group
Period Family Atom Molecule Matter Elements States of matter Pure substance Physical property Chemical property Atomic number Atomic symbol Atomic weight Chemical formula Ionic bond
Covalent bond S P D F orbitals Electron configuration Core electrons Nucleus Single, double, triple
bond(s) Molar mass Atomic radius Melting point Boiling point Electronegativity
NGSS Cluster/Item Specifications October 2017 62

Science Vocabulary Students are Not Expected to Know Oxidation state Diatomic Polyatomic ions Empirical formulas
Molecular formulas Quantum Photon
Heisenberg Uncertainty Principle
Hund’s Rule Pauli Exclusion Principle
PhenomenaSome example phenomena for HS-PS1-1:
Potassium chloride (KCl) tastes similar to table salt (sodium chloride (NaCl)). Balloons are filled with helium gas instead of hydrogen gas. Scientists work with silicate substrates in chambers filled with Argon instead of air. Diamond, graphene, and fullerene are different molecules/materials that are only made of carbon.
Task Demands Supported by This Performance Expectation and Associated Evidence Statements1. Select or identify from a collection of periodic table components (periods, groups, etc.), including distractors, the
components needed to model the phenomenon.2. Make predictions about the properties of elements based on the number of valence electrons. Predictions can
be made by completing illustrations or selecting from lists with distractors.3. Identify missing components, relationships, or other limitations of the model. (Hydrogen similar to Alkali metals,
one valence electron, and Halogens, missing only one valence electron).4. Describe, select, or identify the relationships among components of the periodic table that describe the
properties of valence electrons, or explains the properties of elements.
NGSS Cluster/Item Specifications October 2017 63
Performance Expectation HS-PS2-2Use mathematical representations to support the claim that the total momentum of a system of objects is conserved when there is no net force on the system
DimensionsUsing Mathematics and Computational Thinking
Use mathematical representations of phenomena to describe explanation
PS2.A: Forces and Motion Momentum is defined for a particular frame of reference; it is the mass times the velocity of the object. If a system interacts with objects outside itself, the total momentum of the system can change; however, any
such change is balanced by changes in the momentum of objects outside the system
Systems and System Models When investigating or describing a system, the boundaries and initial conditions of the system need to be
defined.
Clarifications and Content LimitsClarification Statements
Emphasis is on the quantitative conservation of momentum in interactions and the qualitative meaning of this principle
Students should not be deriving formulas but can be using and manipulating them
Content Limits Assessment is limited to systems of no more than two macroscopic bodies moving in one dimension. Students do not need to know:
o How to use a derivation to show that momentum is conserved only when there is no net force.o How to derive formulas regarding conservation of momentum.o How to resolve vectors and apply the understanding that momentum must be conserved in all
directions.o Newton’s Laws by name
Science Vocabulary Students are Expected to Know Friction Conservation Transfer Deceleration Frame of reference Net force Acceleration Velocity
Internal External Conversion Closed system Newton’s Second Law Collision Vector
Science Vocabulary Students are Not Expected to Know Elastic collision Inelastic collision Inertial frame of reference
NGSS Cluster/Item Specifications October 2017 64

PhenomenaSome example phenomena for HS-PS2-2:
A pool player hits a cue ball towards a stationary 8-ball. The cue ball collides with the 8-ball, causing the 8-ball to move. The 8-ball slows down until it comes to a rest 5 seconds after the collision.
Two pool balls collide with each other and two soccer balls collide with each other. After the collision, the soccer balls come to a stop quicker than the pool balls.
A pool player hits a cue ball towards a stationary 8-ball. The cue ball collides with the 8-ball. The velocity of the 8-ball 1 second after the collision is greater than the velocity of the 8-ball 2 seconds after the collision.
Two hockey pucks collide during an ice hockey practice. A player realizes that the two pucks take a long time to come to rest on the ice. After practice, he makes two street hockey pucks collide on pavement. The pucks come to a stop more quickly than the ones on the ice did.
Task Demands Supported by This Performance Expectation and Associated Evidence Statements1. Make simple calculations using given data to calculate or estimate the total momentum in the system OR the
momentum of individual objects within the system.2. Illustrate, graph, or identify relevant features or data that can be used to calculate or estimate the total
momentum in the system OR the momentum of individual objects within the system.3. Calculate or estimate properties or relationships between momentum and other forces based on data from one
or more sources.4. Identify data or compile from given information, the information needed to support inferences about net force
and/or how momentum is conserved within a system. This can include sorting out the relevant data from the given information.
NGSS Cluster/Item Specifications October 2017 65

Performance Expectation HS-PS3-2Develop and use models to illustrate that energy at the macroscopic scale can be accounted for as a combination of energy associated with the motions of particles (objects) and energy associated with the relative positions of particles (objects)
DimensionsDeveloping and Using Models Develop and use a model based on evidence to illustrate the relationships between systems or between
components of a system
PS3.A: Definitions of Energy Energy is a quantitative property of a system that depends on the motion and interactions of matter and
radiation within that system. That there is a single quantity called energy is due to the fact that a system’s total energy is conserved, even as, within the system, energy is continually transferred from one object to another and between its various possible forms.
At the macroscopic scale, energy manifests itself in multiple ways, such as in motion, sound, light and thermal energy.
These relationships are better understood at the microscopic scale, at which all of the different manifestations of energy can be modeled as a combination of energy associated with the motion of particles and energy associated with the configuration (relative position of the particles). In some cases the relative position energy can be thought of as stored in fields (which mediate interactions between particles). This last concept includes radiation, a phenomenon in which energy stored in fields movers across space.
Energy and Matter Energy cannot be created or destroyed; it only moves between one place and another place, between objects
and/or fields, or between systems.
Clarifications and Content LimitsClarification Statements Examples of phenomena at the macroscopic scale could include:
o The conversion of kinetic energy to thermal energyo The energy stored due to position of an object above the Eartho The energy stored between two electrically-charged plates.
Examples of models could include diagrams, drawings, descriptions, and computer simulations
Content Limits Students do not need to know:
o Thermodynamics in detail o Gravitational fieldso Thermonuclear fusion
Science Vocabulary Students are Expected to Know Force Exert Store Transfer Electrical charge
Mechanical energy Potential energy Kinetic energy Electric field Magnetic field
NGSS Cluster/Item Specifications October 2017 66

Conservation of energy Microscopic scale Macroscopic scale Thermal energy Molecular energy Heat conduction
Circuit Current Heat radiation Law of Conservation of Energy Work
Science Vocabulary Students are Not Expected to Know Entropy Second Law of Thermodynamics Thermodynamics Root mean velocity
Boltzmann’s constant Gravitational fields Fusion Fission
PhenomenaSome example phenomena for HS-PS3-2:
Two electrically charged plates, one with a positive charge and one with a negative charge, are placed a certain distance apart. Electron 1 is placed in the middle of the two plates. It accelerates to the positive plate and hits it with a certain velocity. Electron 2 is then placed closer to the negative plate. This electron gains more speed before reaching the positive plate.
A gas is placed inside a container and sealed with a piston. The outside of the container is heated up. The piston begins to move upwards.
A person rubs their hands together. Afterwards their hands feel warm. A block is attached to a spring and placed on a horizontal table. When the spring is un- stretched, the
spring and block do not move. When the spring is stretched to a certain distance (x), the block oscillates back and forth.
A ball is raised to a height (h) above Earth. When it is dropped it hits the ground with a certain velocity (v). The ball is then raised to twice the previous height. When it is dropped, the ball hits the ground with a greater velocity than it did previously.
Task Demands Supported by This Performance Expectation and Associated Evidence Statements1. Select or identify from a collection of potential model components, including distractors, the components
needed to model the phenomenon. Components might include equations used to calculate energy or objects used to set up the experimental model. The model can be a conceptual model (flow chart).
2. Manipulate the components of a model to demonstrate how energy at the macroscopic scale can be accounted for as a combination of energy associated with the workings of particles at the microscopic scale, result in the observation of the phenomenon.
3. Make predictions about the effects of changes in the motion or relative position of objects in the model. Predictions can be made by manipulating model components, completing illustrations, or selecting from lists with distractors.
4. Identify missing components, relationships, or other limitations of the model showing how energy at the macroscopic scale is affected by the motion and positioning of particles at the microscopic scale.
5. Describe, select, or identify the relationships among components of a model that describes, or explains, how energy is related to the motion and relative position of objects.
NGSS Cluster/Item Specifications October 2017 67

Performance Expectation HS-PS4-1Use mathematical representations to support a claim regarding relationships among the frequency, wavelength, and speed of waves traveling in various media.
DimensionsUsing Mathematics and Computational Thinking
Use mathematical representations of phenomena or design solutions to describe and/or support claims and/or explanations.
PS4.A: Wave propertiesThe wavelength and frequency of a wave are related to each other by the speed of travel of the wave, which depends on the type of wave and the media through which it is passing.
Cause and EffectEmpirical evidence is required to differentiate between cause and correlation and make claims about specific causes and effects.
Clarifications and Content LimitsClarification Statements Examples of data could include electromagnetic radiation traveling in a vacuum and glass, sound waves traveling
through air and water, and seismic waves traveling through Earth.Content Limits Assessment is limited to algebraic relationships and describing those relationships qualitatively. Students are not expected to produce equations from memory, like Snell’s Law, but the concepts and
relationships should be assessed.
Science Vocabulary Students are Expected to Know Simple wave Frequency Wavelength Vacuum Properties of waves Electromagnetic radiation Radiation Wave source
Index of refraction Snell’s Law Angle of incidence Angle of reflection Normal at the point of incidence Critical angle Interface
Science Vocabulary Students are Not Expected to Know Clausius–Mossotti relation Dielectric constant Fermat’s principle
Phase velocity Permittivity Permeability
PhenomenaSome example phenomena for HS-PS4-1:
A person uses their car horn in an effort to attract the attention of their friend who is swimming in a pool a short distance away. The friend hears only muffled noises.
A person opens their curtains so that the sun shines in the window. A diamond in their necklace begins to sparkle brightly.
An earthquake occurs in Japan. The vibrations are recorded in Brazil, but not in Miami. A person sees a fish through the glass wall of a rectangular fish tank. The person moves and looks through the
end of the tank. The fish appears to be in a different place.
NGSS Cluster/Item Specifications October 2017 68

Task Demands Supported by This Performance Expectation and Associated Evidence Statements1. Make calculations using given data to calculate or estimate relationships among the frequency, wavelength,
speed of waves, and the media that they travel in.2. Illustrate, graph, or identify relevant features or data that can be used to calculate or estimate relationships
among the frequency, wavelength, speed of waves, and the media that they travel in.3. Calculate or estimate properties or relationships among the frequency, wavelength, and speed of waves in
various media based on data from one or more sources.
NGSS Cluster/Item Specifications October 2017 69