introduction to active trader pro®...trader pro® for illustrative purposes only. 4 . 5 benefits of...
TRANSCRIPT

3
Introduction to Active Trader Pro®
Fidelity Brokerage Services, Member NYSE, SIPC, 900 Salem Street, Smithfield, RI 02917. © 2017 FMR LLC. All rights reserved. 686285.7.0

4
This workshop will…
• Illustrate how to use the tools to track the market, manage your accounts, place trades and more
• Highlight key features and
tips to efficiently utilize the platform
• Get you excited and ready to use Active Trader Pro® For illustrative purposes only.
4
5
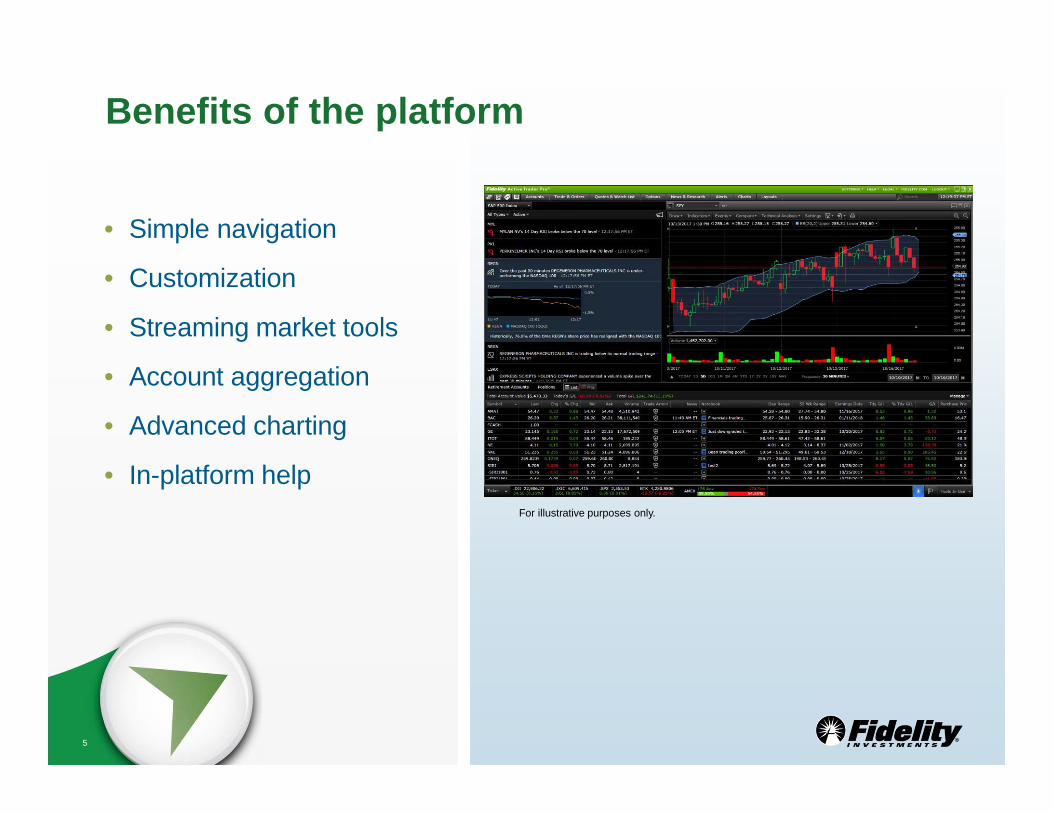
Benefits of the platform
• Simple navigation
• Customization
• Streaming market tools
• Account aggregation
• Advanced charting
• In-platform help For illustrative purposes only.
5
6
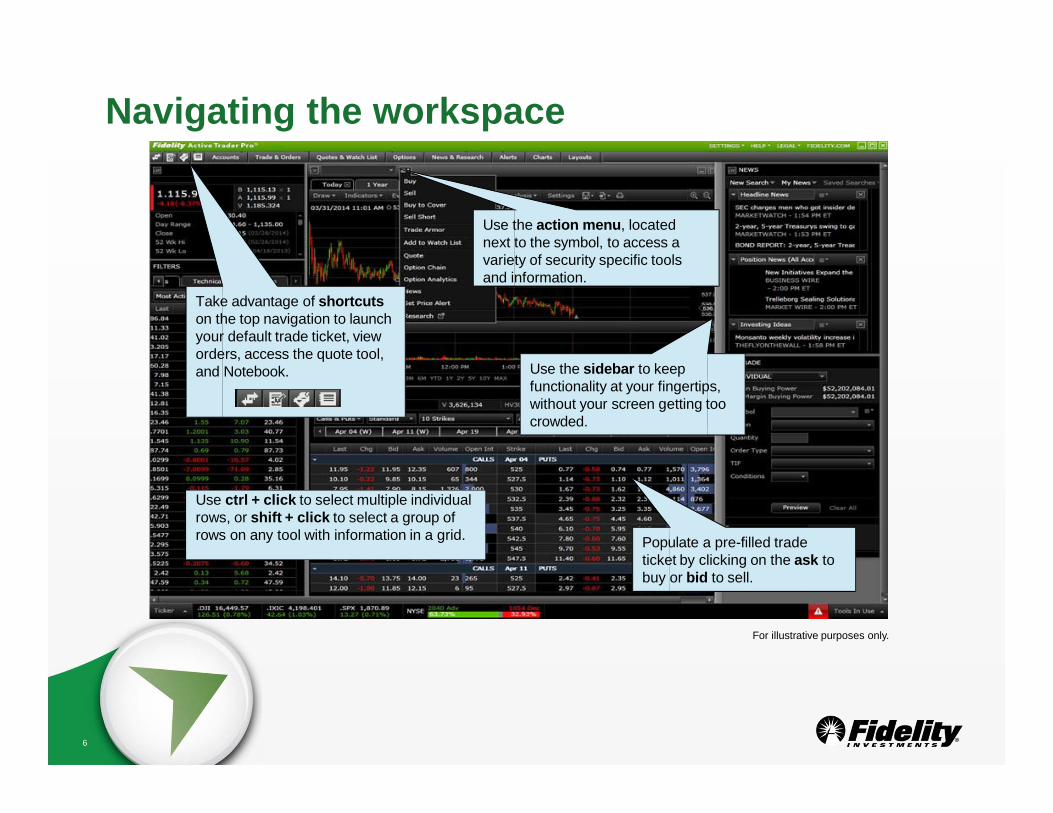
Navigating the workspace
For illustrative purposes only.
Use the action menu, located next to the symbol, to access a variety of security specific tools and information.
Take advantage of shortcuts on the top navigation to launch your default trade ticket, view orders, access the quote tool, and Notebook. Use the sidebar to keep
functionality at your fingertips, without your screen getting too crowded.
Populate a pre-filled trade ticket by clicking on the ask to buy or bid to sell.
Use ctrl + click to select multiple individual rows, or shift + click to select a group of rows on any tool with information in a grid.
6

7
Customize your trading experience
For illustrative purposes only.
Leverage a predefined layo customize a predefined layo create a new layout.
Use the link tool to allow data in one tool to automatically update the other.
ut, ut or
Use Settings to personalize ATP: • Select a default account • Set background color • Change font size • Select a default trading account • Select a default trade ticket • Skip trade preview and/or confirmation • Choose the columns that display for
positions and watch lists • Select option chain defaults
7

8
Multiple ways to enter an order…
For illustrative purposes only.
Stage and save up to 50 orders using the Multi-Trade ticket.
Single-Trade ticket is dynamic and easy to use.
Use Trade Armor to visually explore and manage potential profit and loss scenarios and then enact an entry or exit strategy using trades or alerts.
8

9
Interactive charting with tabbed views
For illustrative purposes only.
Create up to 10 different tabs within a single chart for a symbol.
Draw - add notes or draw trend, support, or resistance lines, regression channels, and more.
Indicators – three ways to select: Type to Search, Recently Used, or scroll through the carousel .
Technical Analysis – display both anticipated and confirmed technical events using Recognia.®
Be sure to save your chart, you can also make the chart your default from this view.
9
12
Charting in Active Trader Pro PlatformsSM
12
Fidelity Brokerage Services, Member NYSE, SIPC, 900 Salem Street, Smithfield, RI 02917. © 2016 FMR LLC. All rights reserved.
693857.5.0 1.9859728.102

13
This workshop will…
• Highlight available tools and various ways to customize charts to help visualize your ideas
• Illustrate how to access and use the Technical Analysis feature to view anticipated and confirmed technical patterns and events
• Showcase how to use charts to help evaluate investment opportunities
For illustrative purposes only.
13

14
14
Customize your charting experience
1. Time periods – use to view price and volume for a security from today to 30 years, coupled with a range of frequencies
2. Settings – use to select your preferred chart type, choose colors that work for you or decide what to show/hide
3. Draw menu – use to add notes, draw trend, support, or resistance lines, Fibonacci retracement and more
4. Indicators menu – use to choose from over 60 indicators
For illustrative purposes only.
1
2
3 4

15
Take advantage of Recognia’s Chart Recognition • Recognia is a third-party
leader in the field of chart pattern recognition.
• To get started with this automated, simplified process:
1. Navigate to Technical Analysis > Patterns & Events
2. Decide on the Trading Horizon
3. Select the Active or Anticipated Events that you want to display
For illustrative purposes only.
1
2 3
Recognia and Fidelity are unaffiliated. 15
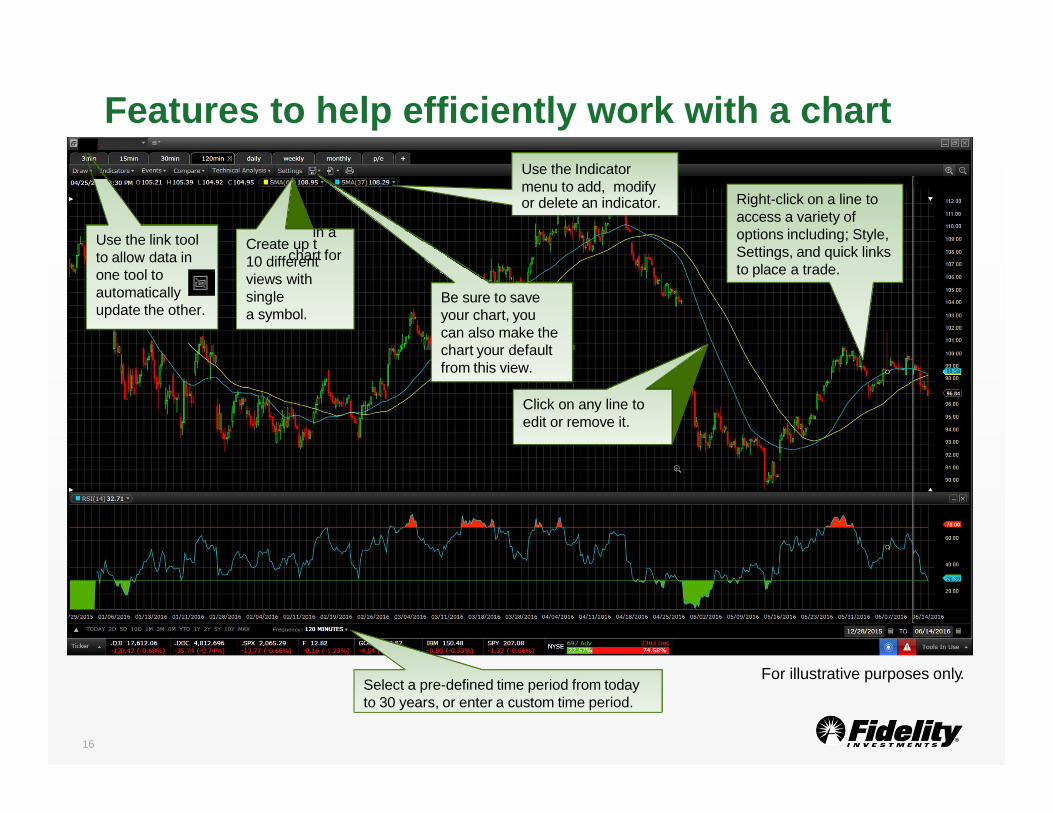
Features to help efficiently work with a chart
For illustrative purposes only.
Click on any line to edit or remove it.
Right-click on a line to access a variety of options including; Style, Settings, and quick links to place a trade.
Use the link tool to allow data in one tool to automatically update the other.
Create up t 10 different views with single a symbol.
o
in a chart for
Be sure to save your chart, you can also make the chart your default from this view.
Use the Indicator menu to add, modify or delete an indicator.
Select a pre-defined time period from today to 30 years, or enter a custom time period.
16

17
Trading the way you want with Active Trader Pro PlatformsSM
17
Fidelity Brokerage Services, Member NYSE, SIPC, 900 Salem Street, Smithfield, RI 02917. © 2016 FMR LLC. All rights reserved. 688797.5.2 1.9859274.103
18
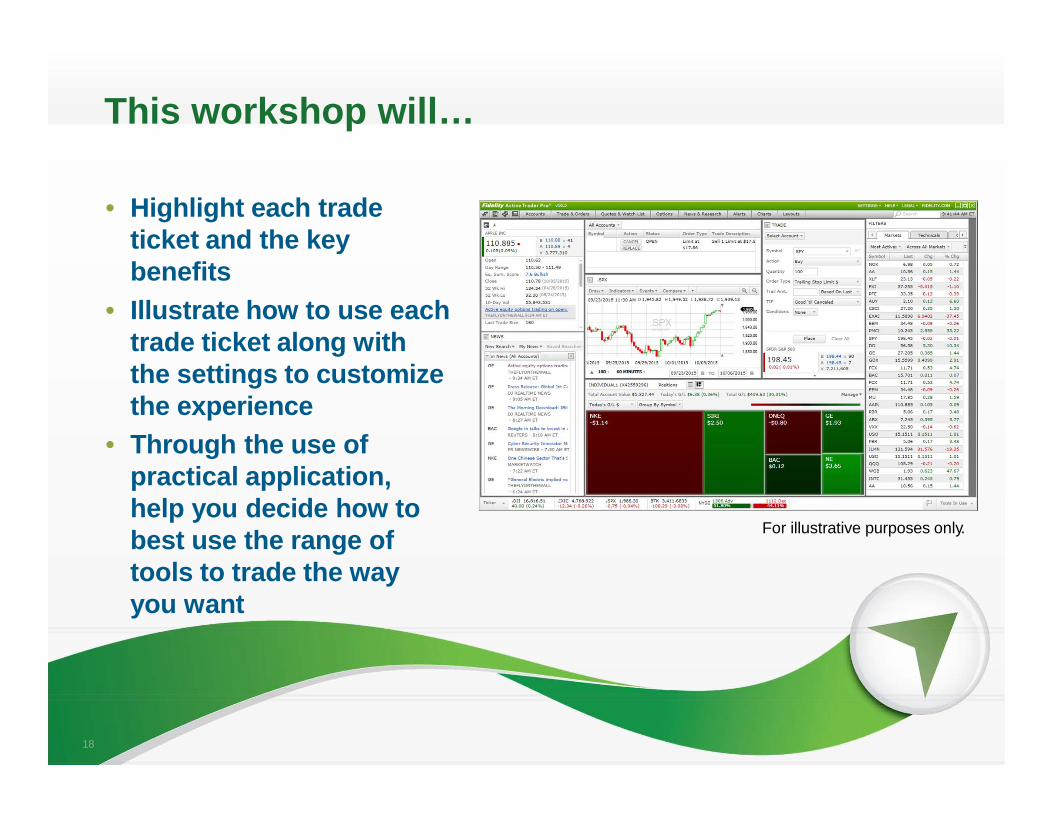
This workshop will…
• Highlight each trade ticket and the key benefits
• Illustrate how to use each trade ticket along with the settings to customize the experience
• Through the use of practical application, help you decide how to best use the range of tools to trade the way you want
For illustrative purposes only.
18

19
Single Trade Ticket Dynamic for quick order entry
This compact trading ticket offers:
– Buying power balances at a glance – Streaming quote data to help decide the
right time to place a trade - this portion of the window may be collapsed
– LOTS button to identify specific lots for tax reporting purposes
For illustrative purposes only.
19

20
Multi-trade Ticket Stage and save up to 50 orders
For illustrative purposes only.
Use this tool to trade stocks, options, and ETFs: – Most commonly used from a Positions List or Watch List to multi-select and
queue up orders – Place orders individually or simultaneously, now or later – Use shift + click, or control + click, to highlight orders on the ticket – Right-click to preview, delete, or duplicate multiple orders
20

21
Trade Armor™ Innovative visual approach
All within this powerful tool:
– View position level unrealized and year-to-date realized gain/loss information
– Place a variety of order types – Drag the price points on the chart
to adjust the price of an order – Easily create and manage alerts
For illustrative purposes only.
21
22
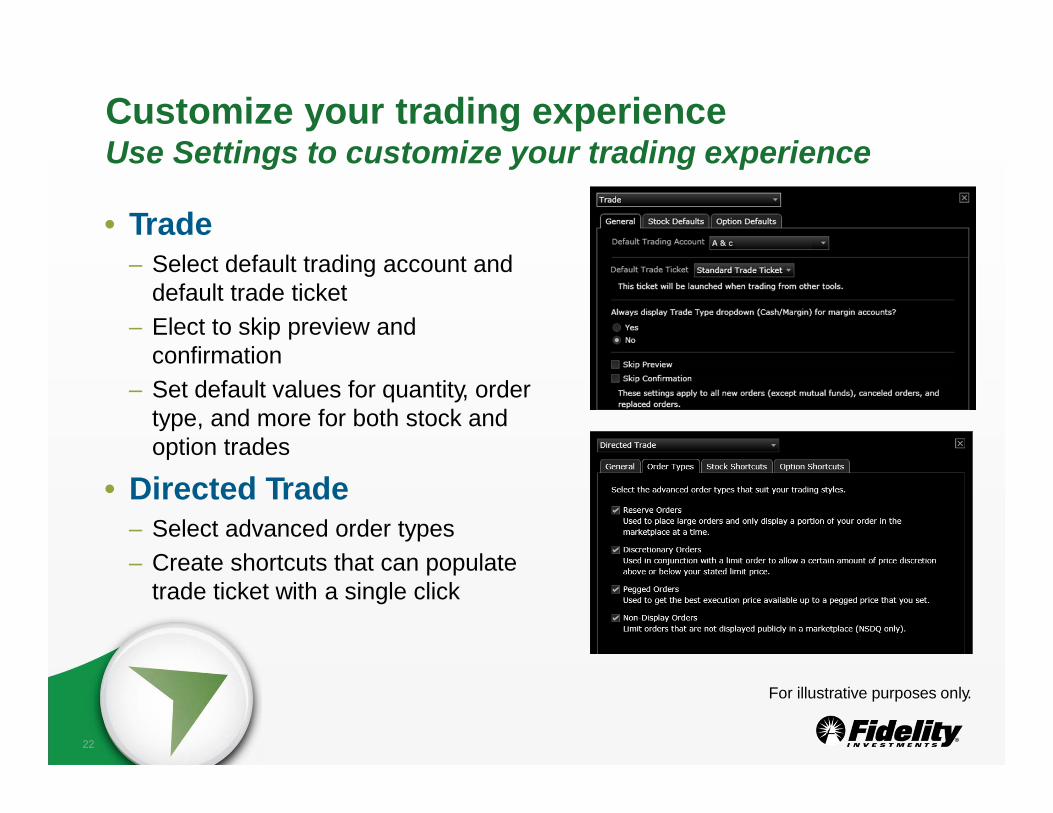
Customize your trading experience Use Settings to customize your trading experience
• Trade – Select default trading account and
default trade ticket – Elect to skip preview and
confirmation – Set default values for quantity, order
type, and more for both stock and option trades
• Directed Trade – Select advanced order types – Create shortcuts that can populate
trade ticket with a single click
For illustrative purposes only.
22
26
Maximizing Options Tools in Active Trader Pro®
Fidelity Brokerage Services, Member NYSE, SIPC, 900 Salem Street, Smithfield, RI 02917. © 2016 FMR LLC. All rights reserved. 646710.4.0 1.963907.103

27
• Introduce Option Analytics • Demonstration
– Option Chain – Option Statistics – Today’s Biggest Trades – Probability Calculator – Profit/Loss Calculator – Strategy Ideas – Trading Options
• Single Trade, Multi-Trade, Directed Trade, Multi-Leg
27
AGENDA

28
This workshop will…
• Provide an overview
• Assist you in using the powerful tools and resources available to conduct options research and help validate trading ideas
• Outline how to leverage each of the available trade tickets
For illustrative purposes only.
28

29
Benefits of Option Analytics in Active Trader Pro® • Multiple access points
• Validate existing positions or new trading ideas
• Access in-depth, high
quality analytical market data
• Integrated tools For illustrative purposes only.
29
31
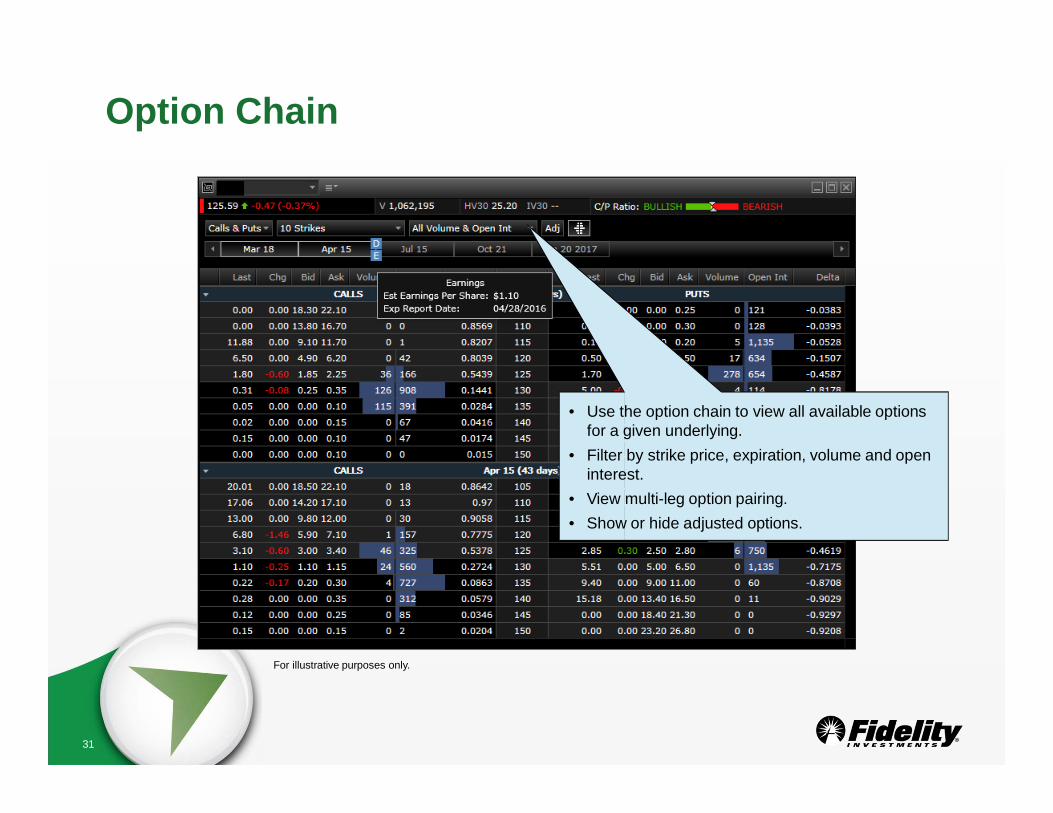
Option Chain
For illustrative purposes only.
• Use the option chain to view all available options for a given underlying.
• Filter by strike price, expiration, volume and open interest.
• View multi-leg option pairing. • Show or hide adjusted options.
31

32
Option Filters
For illustrative purposes only.
• Real-time scans of the options market to find underlying securities and options with unique trading characteristics.
• Filter for High Option Volume, Exploding IVs, IV vs. HV differentials, and more.
32
33
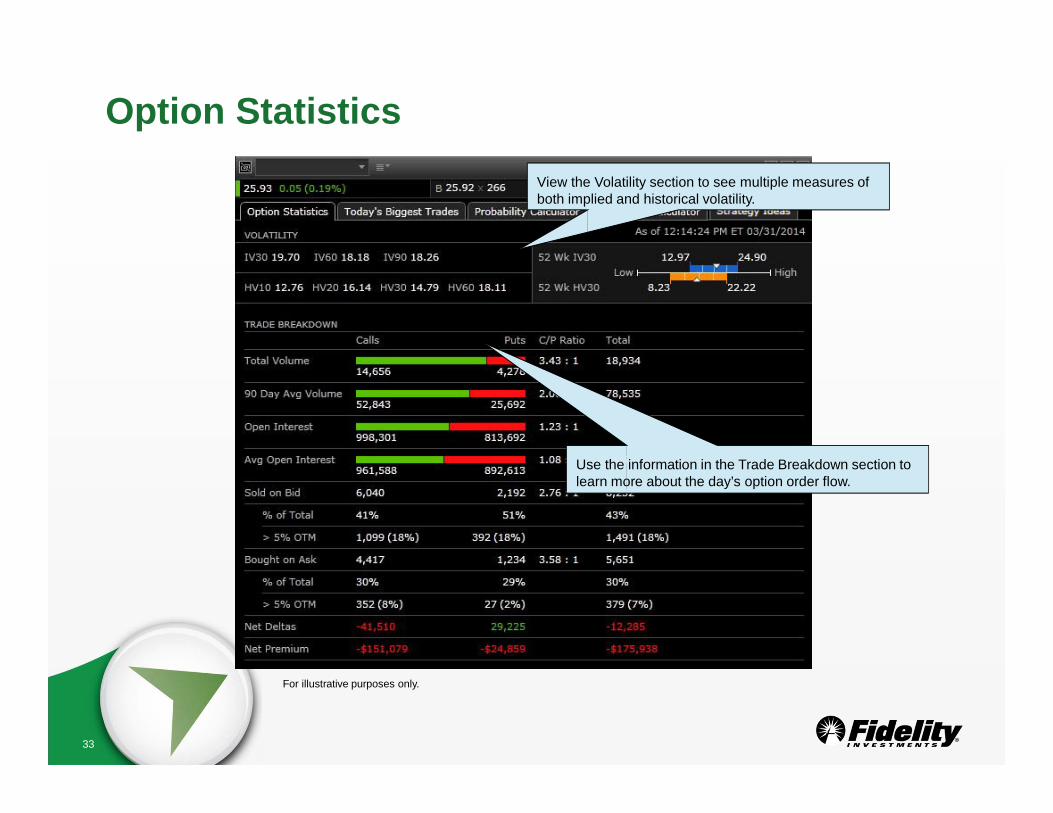
Option Statistics
For illustrative purposes only.
View the Volatility section to see multiple measures of both implied and historical volatility.
Use the information in the Trade Breakdown section to learn more about the day’s option order flow.
33

34
Today’s Biggest Trades
For illustrative purposes only.
• Today’s Biggest Trades displays the top 20 trades in real- time sorted by quantity, highest to lowest.
• Both equity and option traders can use this information to identify potentially unusual trading activity
34
35
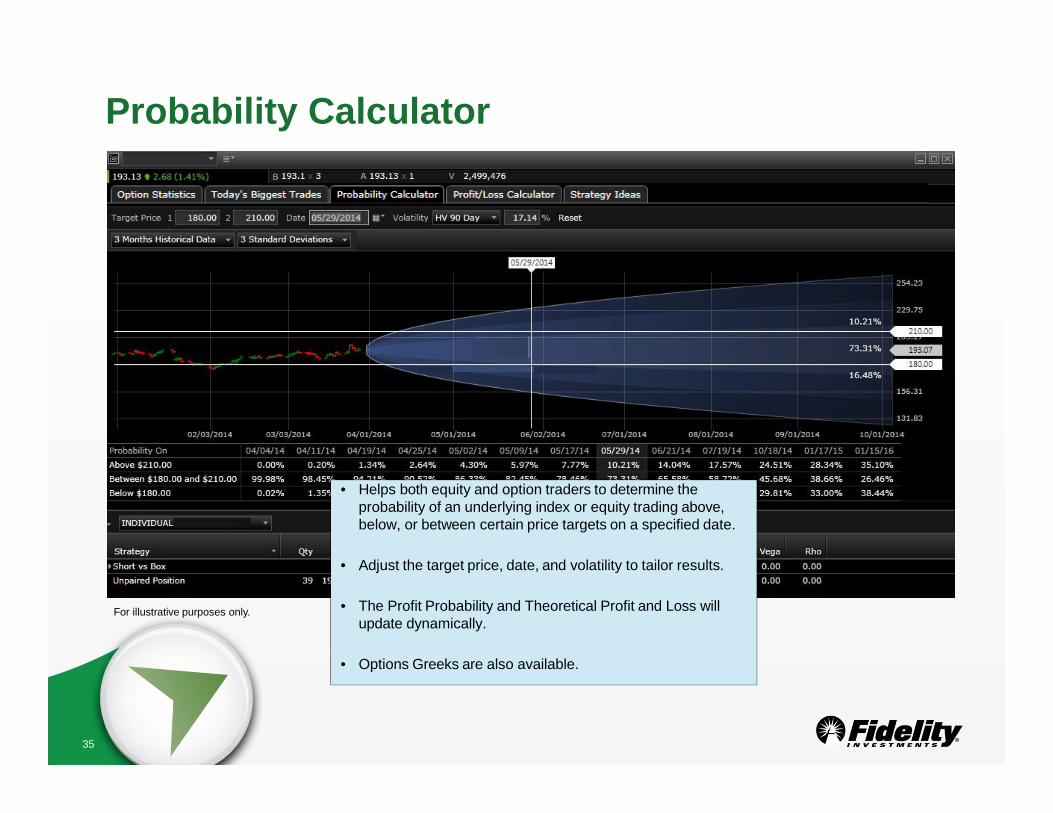
Probability Calculator
For illustrative purposes only.
• Helps both equity and option traders to determine the probability of an underlying index or equity trading above, below, or between certain price targets on a specified date.
• Adjust the target price, date, and volatility to tailor results. • The Profit Probability and Theoretical Profit and Loss will
update dynamically. • Options Greeks are also available.
35

36
Profit/Loss Calculator
For illustrative purposes only.
• Support advanced decision making by charting the profit and loss potential of your existing positions or to evaluate option trades before you place them.
• Based on the underlying security you are evaluating, your
owned positions will automatically be imported for the account in focus, or enter up to 20 simulated positions.
36

37
Strategy Ideas
Backtest covered calls or cash covered puts by entering specific criteria.
Leverage quick links to place your next trade.
Choose from 9 different custom covered call strategies by selecting a timeframe and strategy.
View 2 years of performance data.
For illustrative purposes only.
37

38
Multiple ways to enter a single-leg order…
For illustrative purposes only.
Stage and save up to 50 orders using the Multi-Trade ticket.
Single-Trade ticket is dynamic and easy to use.
Use the Directed Trade Options ticket to view depth of market and route orders to an exchange of your choice.
38
For illustrative purposes only. For illustrative purposes only.
39
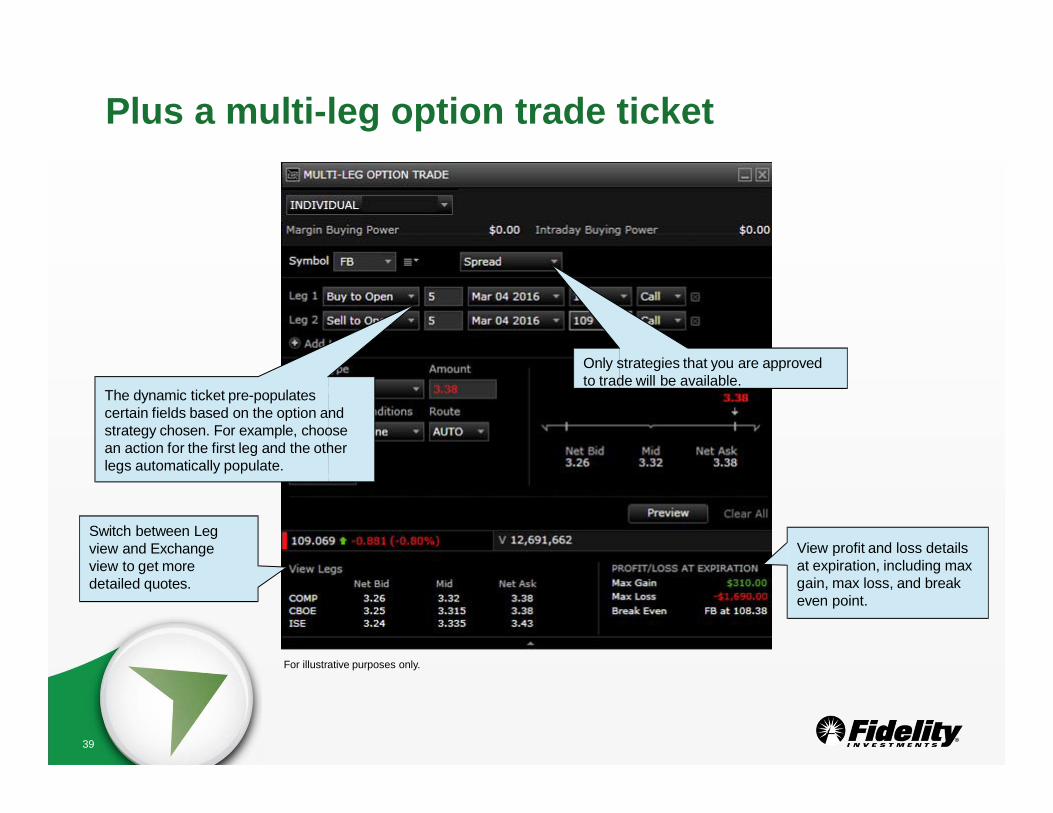
Plus a multi-leg option trade ticket
For illustrative purposes only.
Only strategies that you are approved to trade will be available.
The dynamic ticket pre-populates certain fields based on the option and strategy chosen. For example, choose an action for the first leg and the other legs automatically populate.
View profit and loss details at expiration, including max gain, max loss, and break even point.
Switch between Leg view and Exchange view to get more detailed quotes.
39

Use the Fidelity Learning Center at home to…
Visit Fidelity.com and select Research > Learning Center to obtain more information and insight on trading and investing.
Get more information
Complete Making the most of Active Trader Pro®, a series of demos illustrating “how to” use the many tools available to track the market, manage your accounts, and place trades.
Take a course
Attend seminars/webinars Register for a seminar at your local investor center, or view one of our online monthly webinars on Fidelity.com, register here www.fidelity.com/webinars.
40
42
Important Legal Information
Fidelity Brokerage Services, Member NYSE, SIPC, 900 Salem Street, Smithfield, RI 02917. © 2018 FMR LLC. All rights reserved.
829830.2.0
Options trading entails significant risk and is not appropriate for all investors. Certain complex options strategies carry additional risk. Before trading options, please read Characteristics and Risks of Standardized Options . Supporting documentation for any claims, if applicable, will be furnished upon request. Any screenshots, charts, or company trading symbols mentioned, are provided for illustrative purposes only and should not be considered an offer to sell, a solicitation of an offer to buy, or a recommendation for the security. System availability and response times may be subject to market conditions. Investing involves risk, including risk of loss.
42
Technical analysis focuses on market action – specifically, volume and price. Technical analysis is only one approach to analyzing stocks. When considering what stocks to buy or sell, you should use the approach that you're most comfortable with. As with all your investments, you must make your own determination whether an investment in any particular security or securities is right for you based on your investment objectives, risk tolerance, and financial situation. Past performance is no guarantee of future results.