introduction to clinical nutrition nfsc 370 d. bellis mccafferty
Post on 19-Dec-2015
238 views
TRANSCRIPT

Introduction to Clinical NutritionIntroduction to Clinical Nutrition
NFSC 370NFSC 370
D. Bellis McCaffertyD. Bellis McCafferty
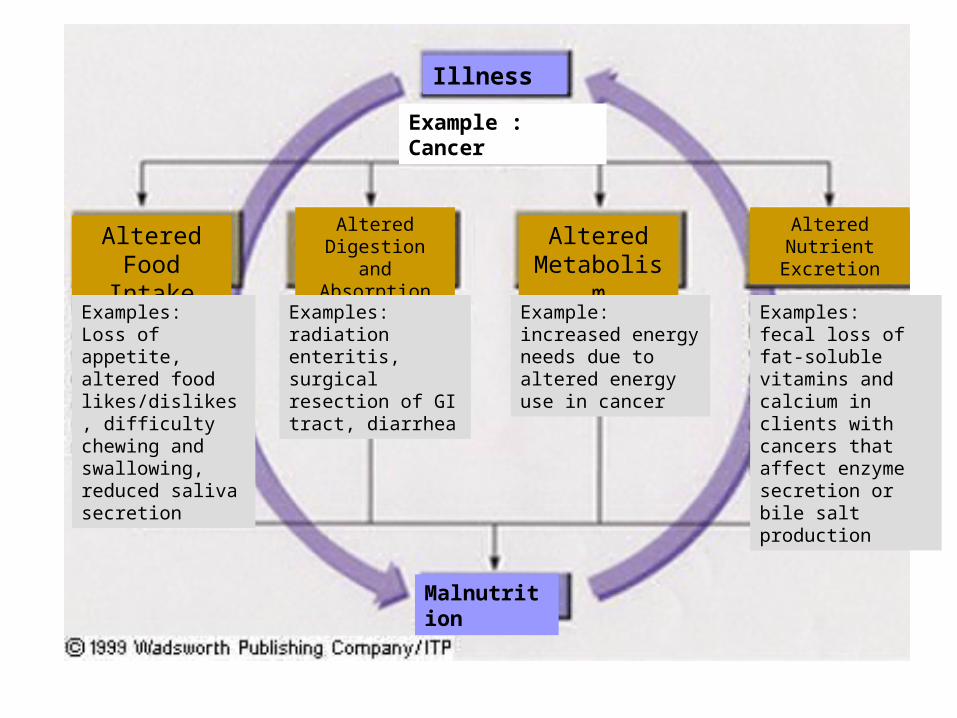
Illness
Malnutrition
Example : Cancer
Altered Food
Intake
Altered Digestion and
Absorption
Altered Metabolism
Altered Nutrient Excretion
Examples: Loss of appetite, altered food likes/dislikes, difficulty chewing and swallowing, reduced saliva secretion
Examples: radiation enteritis, surgical resection of GI tract, diarrhea
Example: increased energy needs due to altered energy use in cancer
Examples: fecal loss of fat-soluble vitamins and calcium in clients with cancers that affect enzyme secretion or bile salt production

Clinical NutritionClinical Nutrition(Medical Nutrition Therapy)(Medical Nutrition Therapy)
Purpose Purpose – To achieve or maintain good nutritional status.To achieve or maintain good nutritional status.
American Dietetic Association American Dietetic Association – Professional organization representing Professional organization representing
Registered Dietitians (RD) and Dietetic Registered Dietitians (RD) and Dietetic Technicians (DTR)Technicians (DTR)
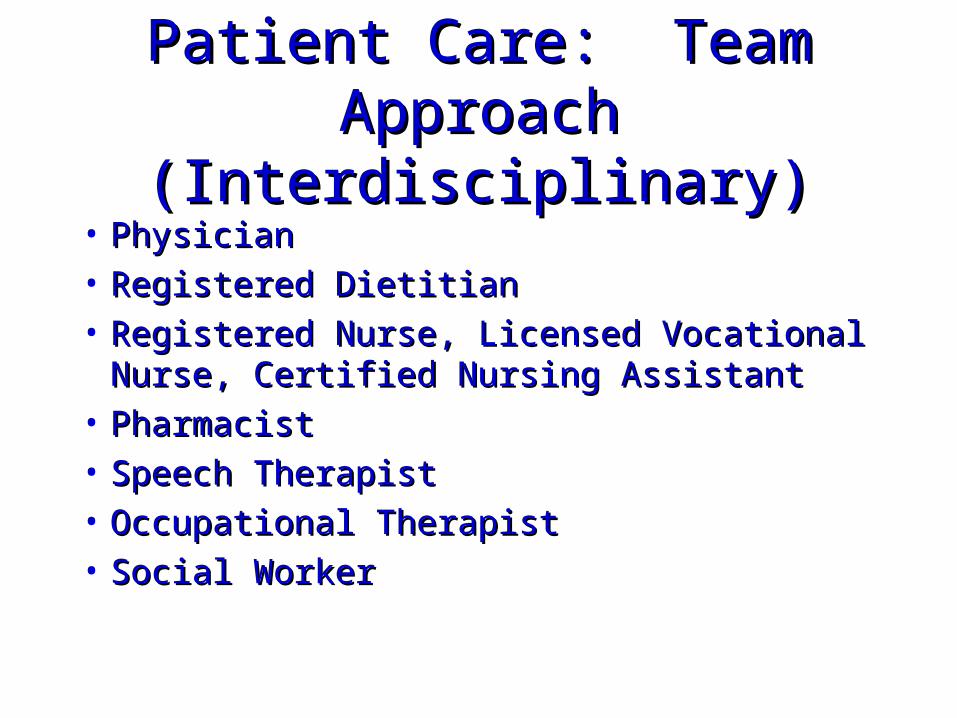
Patient Care: Team ApproachPatient Care: Team Approach(Interdisciplinary)(Interdisciplinary)
• Physician Physician
• Registered DietitianRegistered Dietitian
• Registered Nurse, Licensed Vocational Nurse, Registered Nurse, Licensed Vocational Nurse, Certified Nursing Assistant Certified Nursing Assistant
• PharmacistPharmacist
• Speech TherapistSpeech Therapist
• Occupational TherapistOccupational Therapist
• Social WorkerSocial Worker
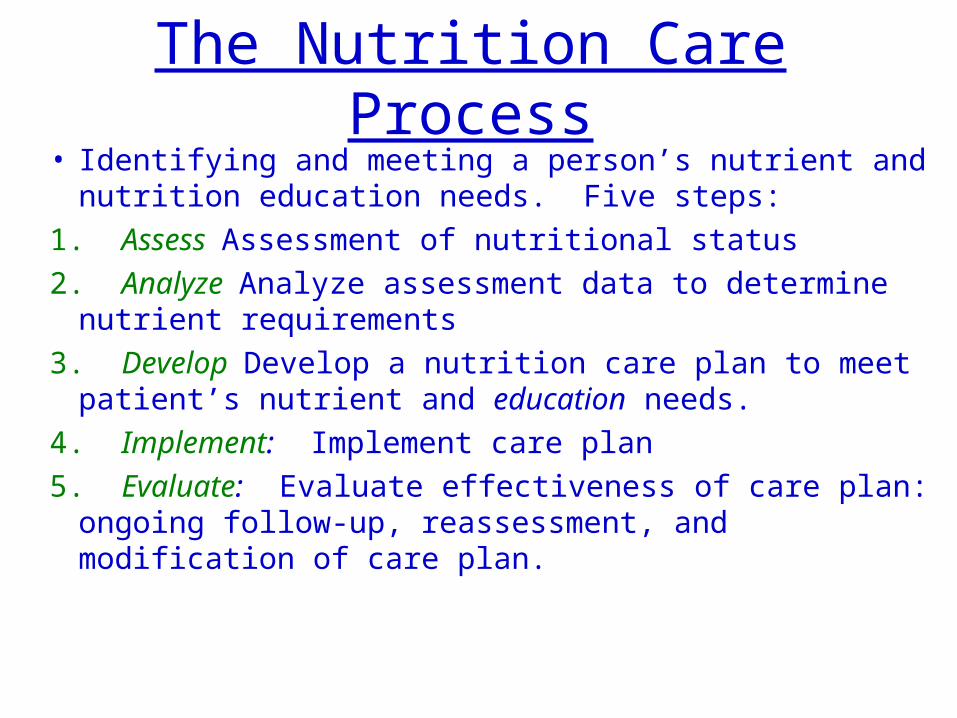
The Nutrition Care Process• Identifying and meeting a person’s nutrient and nutrition
education needs. Five steps:
1. Assess Assessment of nutritional status
2. Analyze Analyze assessment data to determine nutrient requirements
3. Develop Develop a nutrition care plan to meet patient’s nutrient and education needs.
4. Implement: Implement care plan
5. Evaluate: Evaluate effectiveness of care plan: ongoing follow-up, reassessment, and modification of care plan.
THE PATIENT THE PATIENT SHOULD BE AN ACTIVE SHOULD BE AN ACTIVE PARTICIPANT IN THE PARTICIPANT IN THE
CARE PROCESS!CARE PROCESS!
Assessing Nutritional Status
• Historical Information• Physical Examination
• Anthropometric Data
• Laboratory Analyses
Historical Information
• Health History (medical history) - current and past health status
– diseases/ risk factors for disease
– appetite/food intake
– conditions affecting digestion, absorption,
utilization, & excretion of nutrients
– emotional and mental health

Historical Information
• Drug History – prescription & OTC meds – illicit drugs– nutrient supplements, HERBS and other
“alternative” or homeopathic substances – multiple meds (who’s at risk?)
Meds can alter intake, absorption, metabolism, etc.
Foods can alter absorption, metabolism, & excretion of meds.
Historical Information
• Socioeconomic History - factors that affect one’s ability to purchase, prepare, & store food, as well as factors that affect food choices themselves.– Food availability (know local crops/produce)
– occupation/income/education level
– ethnicity/religious affiliations
– kitchen facilities
– transportation
– personal mobility (ability to ambulate)
– number of people in the household
Historical Information• Diet History—analyzing eating habits, food intake,
lifestyle, so that you can set individualized, attainable goals.– Amount of food taken in
– Adequacy of intake – omission of foods/food groups
– Frequency of eating out
– IV fluids
– Appetite
– Restrictive/fad diets
– Variety of foods
– Supplements (overlaps)

Historical Information
• Tools for taking a diet hx:– 24 hour recall– Usual intake – can find trends, such as breakfast/snacks– Food Frequency Questionnaire/Checklist– Food Records– Observing food intake
• Analysis of Food Intake Data• INDIVIDUAL NEEDS FOR NUTRIENTS VARIES

Assessing Nutritional Status
• Historical Information• Physical Examination
• Anthropometric Data
• Laboratory Analyses

Physical Examination: “A picture is worth a thousand words.”
• weight status
• mobility
• confusion
• signs of nutrient deficiencies/malnutrition
– esp. hair, skin, GI tract including mouth and tongue
• Fluid Balance (dehydration/fluid retention)
Physical Examination: “A picture is worth a thousand words.”
• Limitations of Physical Findings– Depends on assessor!– Many physical signs are nonspecific: ie. cracked lips
from sun/windburn vs. from malnutrition, dehydration…

Assessing Nutritional Status
• Historical Information
• Physical Examination
• Anthropometric Data• Laboratory Analyses
Anthropometric Data - physical measurement of the body
anthropos = human metric = measure
• Indirect assessment of body composition and development• Used in Nutrition Assessment:
– Measures using height and weight– Measures of body composition (fat vs. lean tissue)– Functional Measures
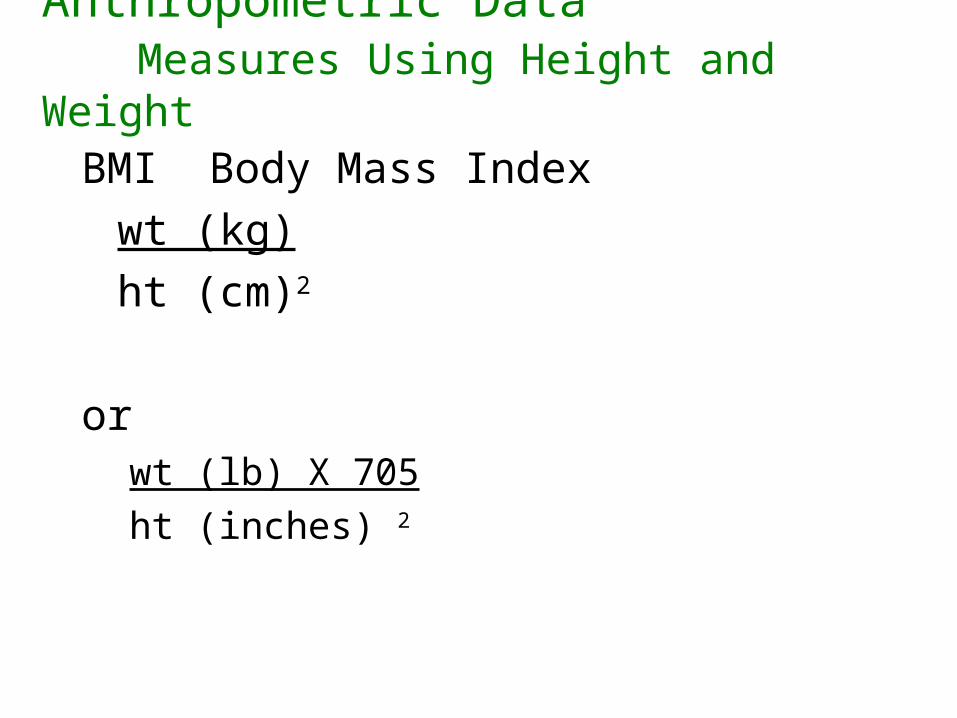
Anthropometric Data Measures Using Height and Weight
BMI Body Mass Index
wt (kg)
ht (cm)2
orwt (lb) X 705
ht (inches) 2

Anthropometric Data Measures Using Height and Weight
• 18.5-24.9• 25+• 30+• Pros:
– many studies have identified the health risks associated with a wide range of BMIs
– easy to look up on chart – screening tool

Anthropometric Data Measures Using Height and Weight
• Cons: BMI can misclassify up to one out of four people.– Does not account for fat distribution– Doesn’t account for LBM - may misclassify
frail/sedentary or very muscular people
Met Life Insurance weight-for- height tables– Weights based on lowest mortality
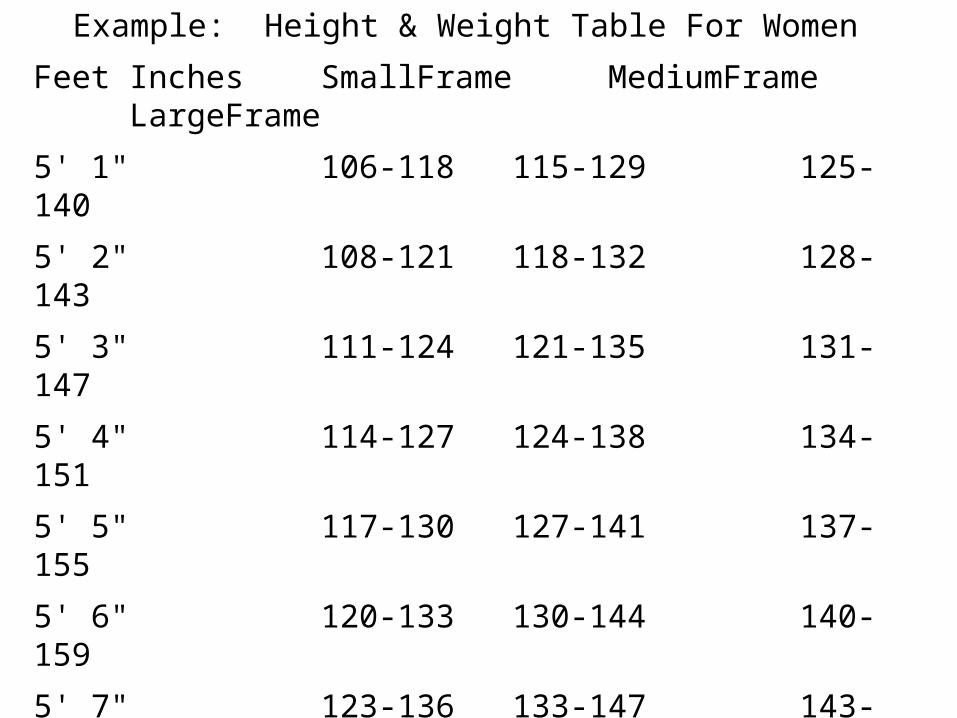
Example: Height & Weight Table For Women
Feet Inches SmallFrame MediumFrame LargeFrame
5' 1" 106-118 115-129 125-140
5' 2" 108-121 118-132 128-143
5' 3" 111-124 121-135 131-147
5' 4" 114-127 124-138 134-151
5' 5" 117-130 127-141 137-155
5' 6" 120-133 130-144 140-159
5' 7" 123-136 133-147 143-163
5' 8" 126-139 136-150 146-167
5' 9" 129-142 139-153 155-176
Weights at ages 25-59 based on lowest mortality. Weight in pounds according to frame (in indoor clothing weighing 3 lbs.; shoes with 1" heels)

Anthropometric Data Measures Using Height and Weight
Assessing “Ideal Body Weight”
Hamwi Equation:
• Females: 100# for first 5’ of height, plus 5# per inch over five feet
• Males: 106# for first 5’ of height, plus 6# per inch over five feet
• +/- 10% to calculate a range
(for those under 5’ tall, subtract 2 lb. per inch under 5’)
** Amputations, immobility:
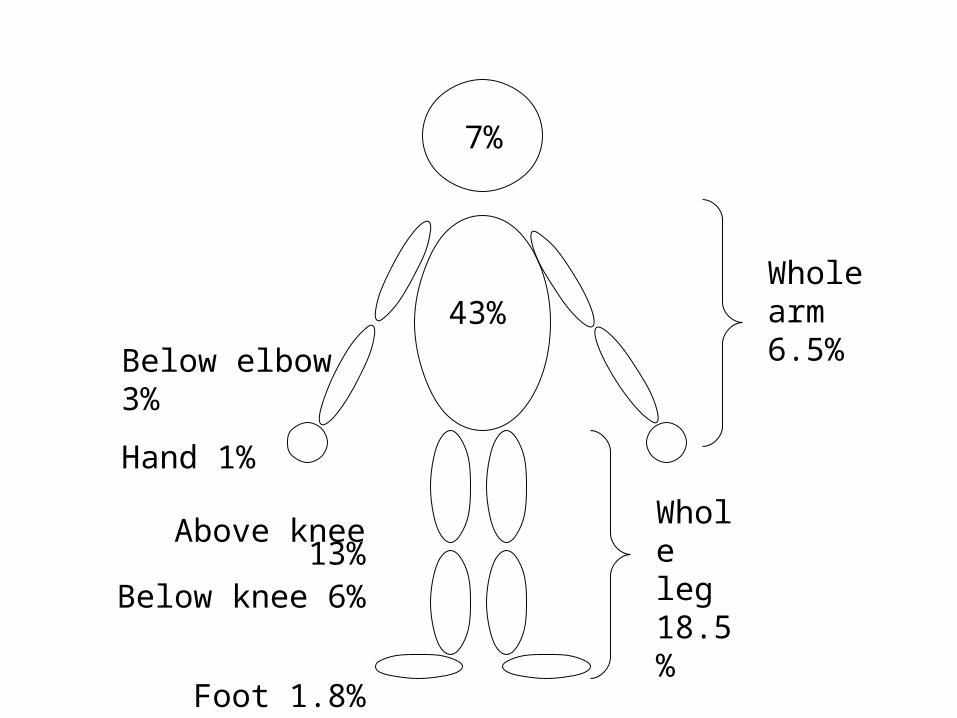
7%
43%
Whole arm 6.5%
Whole leg 18.5%
Below elbow 3%
Hand 1%
Above knee 13%
Below knee 6%
Foot 1.8%
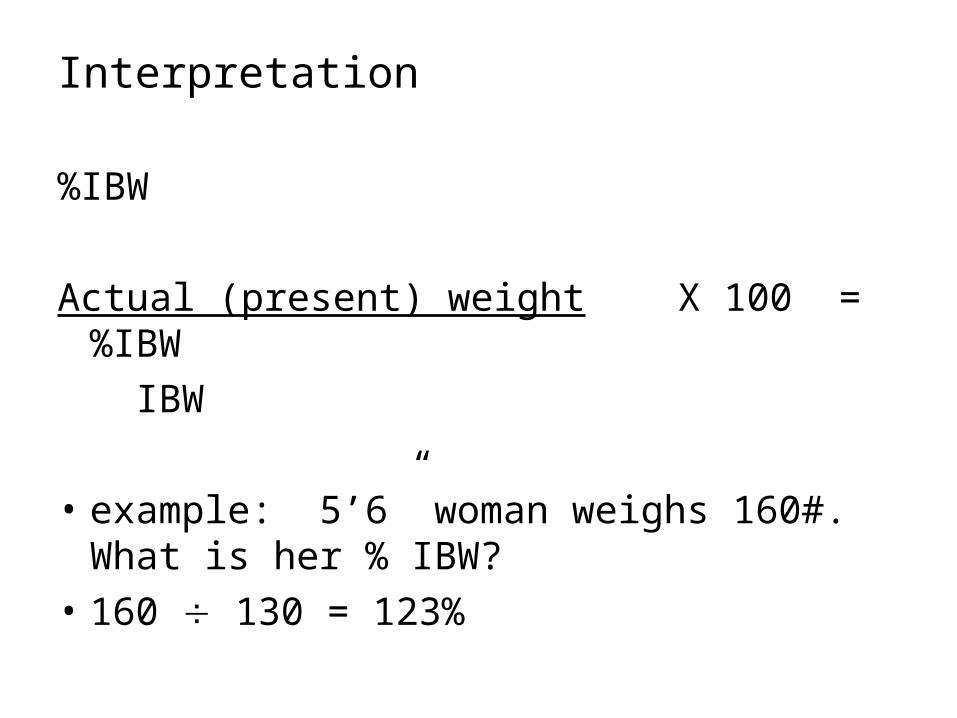
Interpretation
%IBW
Actual (present) weight X 100 = %IBW
IBW
• example: 5’6” woman weighs 160#. What is her % IBW?
• 160 130 = 123%
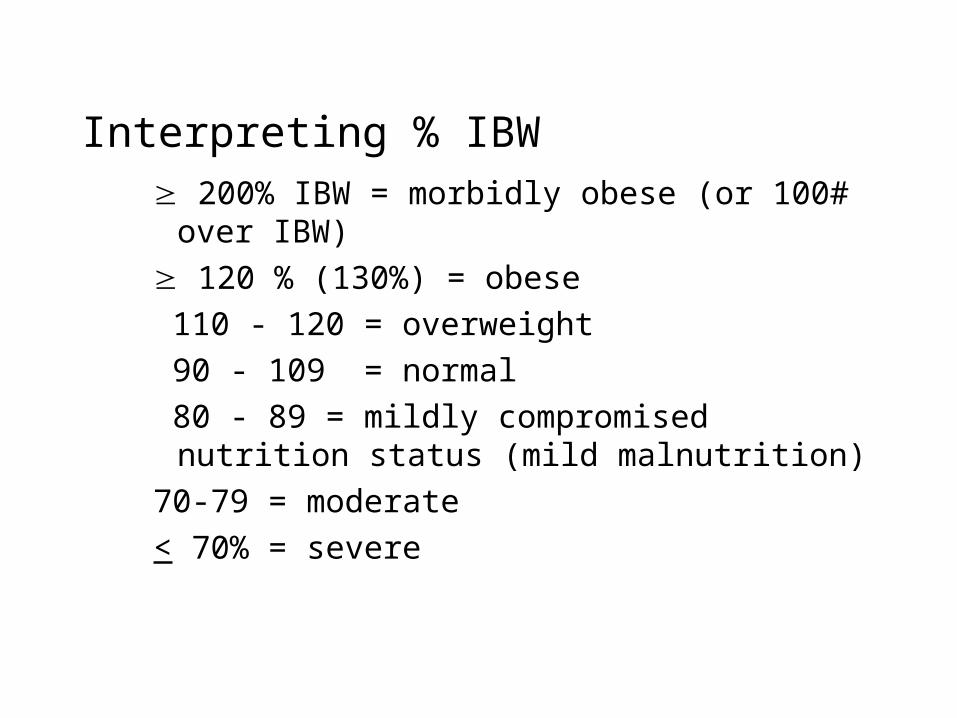
Interpreting % IBW 200% IBW = morbidly obese (or 100# over IBW)
120 % (130%) = obese
110 - 120 = overweight
90 - 109 = normal
80 - 89 = mildly compromised nutrition status (mild malnutrition)
70-79 = moderate
< 70% = severe
Anthropometric Data Measures Using Height and Weight
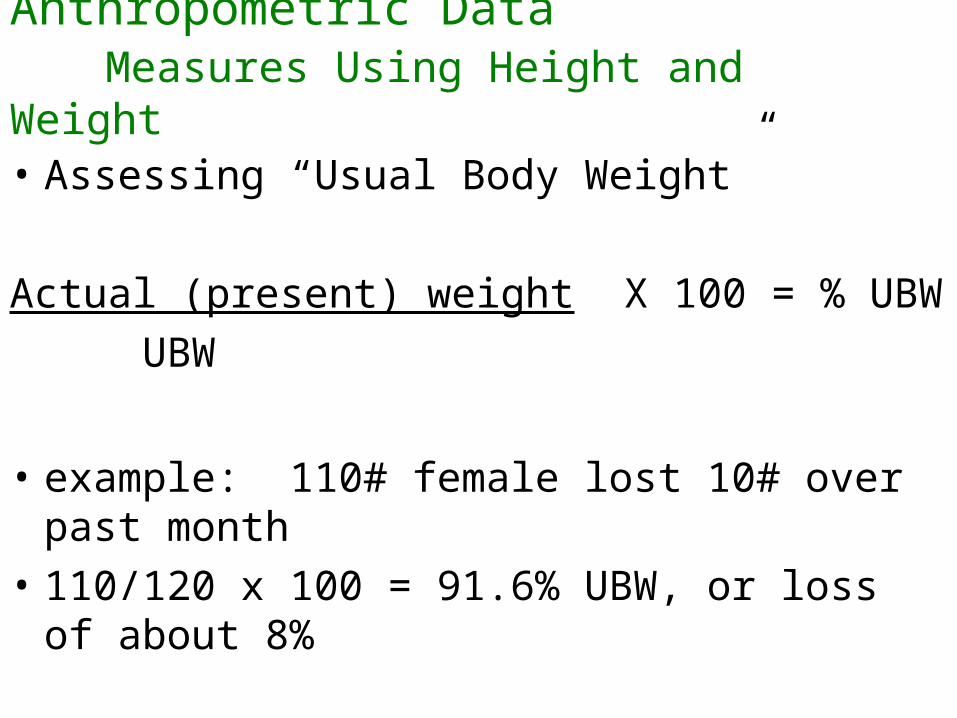
• Assessing “Usual Body Weight”
Actual (present) weight X 100 = % UBW
UBW
• example: 110# female lost 10# over past month
• 110/120 x 100 = 91.6% UBW, or loss of about 8%
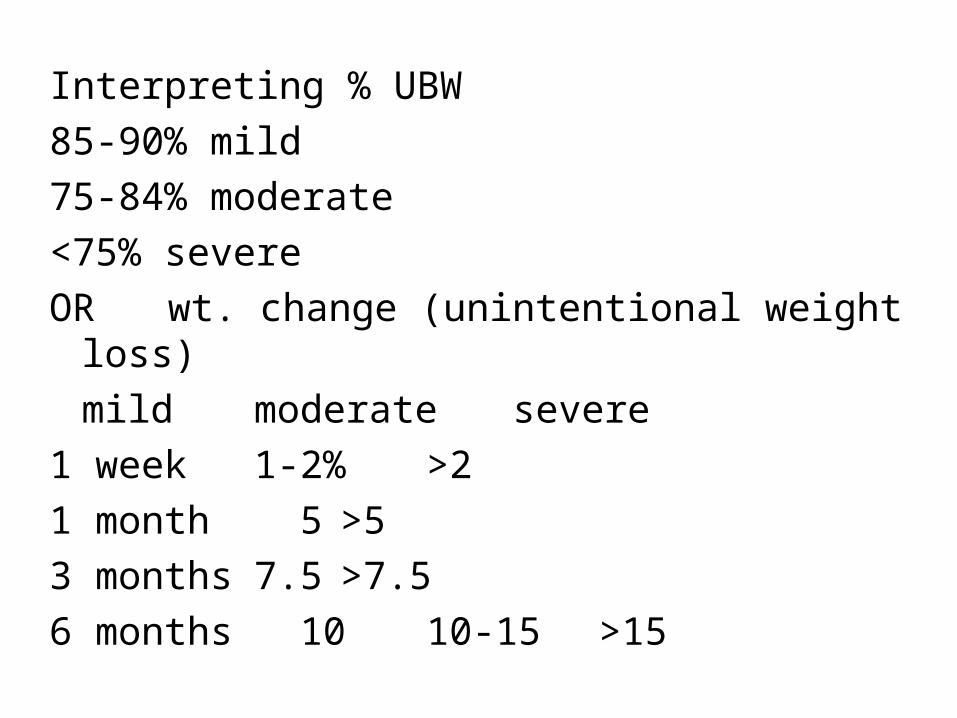
Interpreting % UBW
85-90% mild
75-84% moderate
<75% severe
OR wt. change (unintentional weight loss)
mild moderate severe
1 week 1-2% >2
1 month 5 >5
3 months 7.5 >7.5
6 months 10 10-15 >15
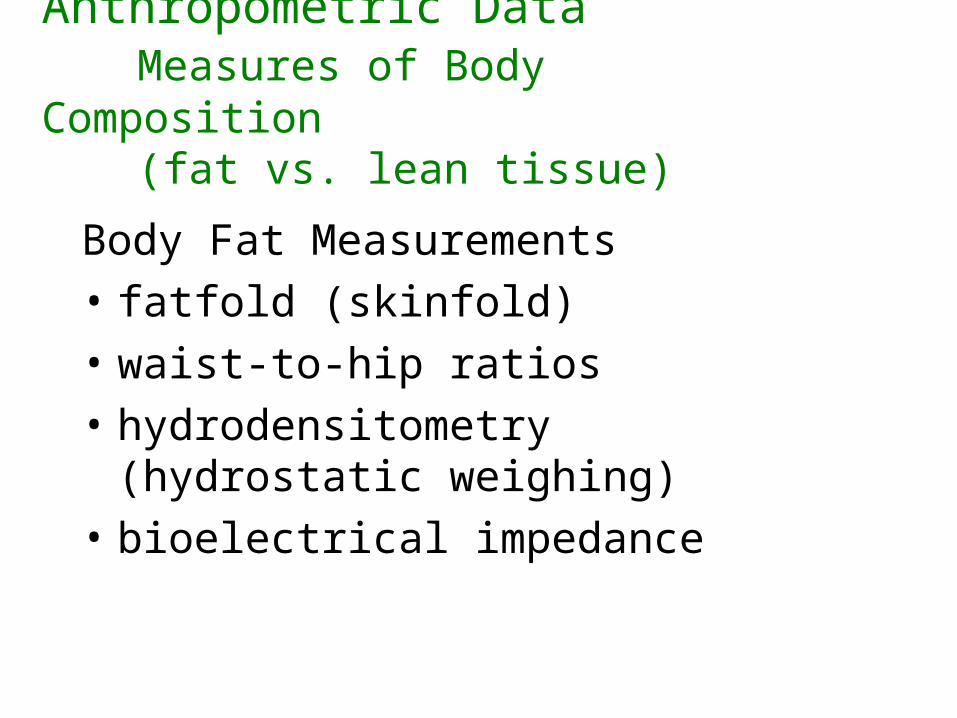
Anthropometric Data Measures of Body Composition(fat vs. lean tissue)
Body Fat Measurements
• fatfold (skinfold)
• waist-to-hip ratios
• hydrodensitometry (hydrostatic weighing)
• bioelectrical impedance
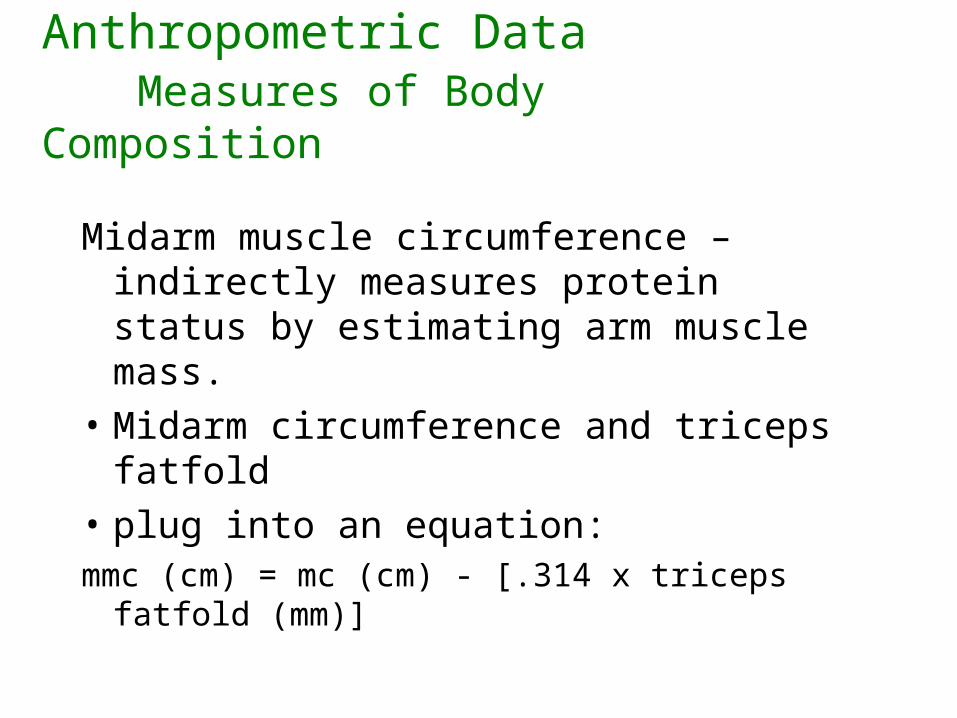
Anthropometric Data Measures of Body Composition
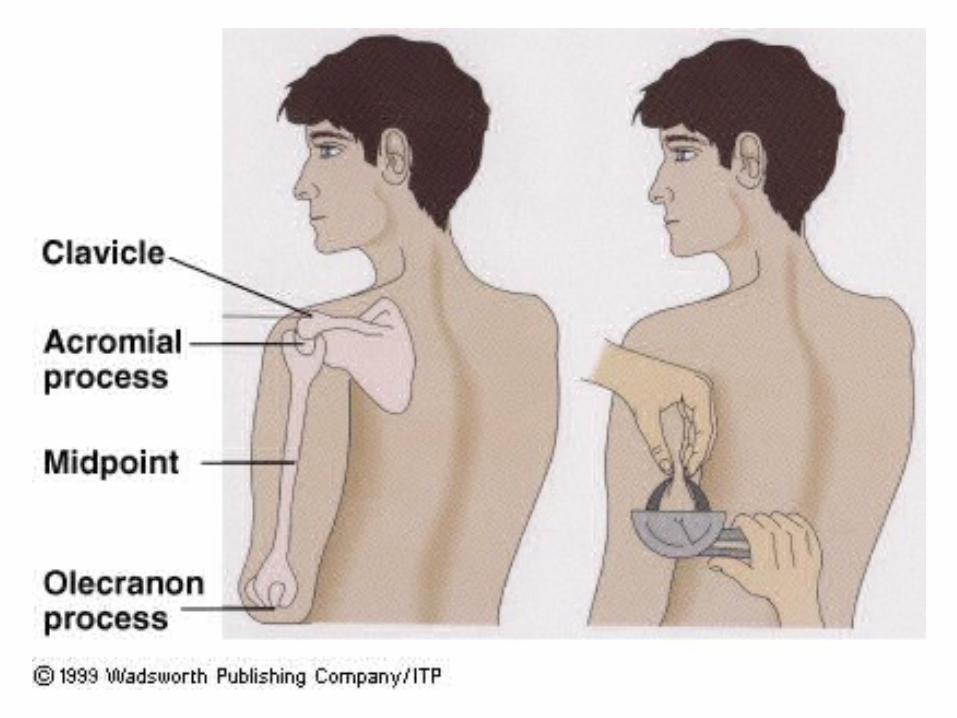
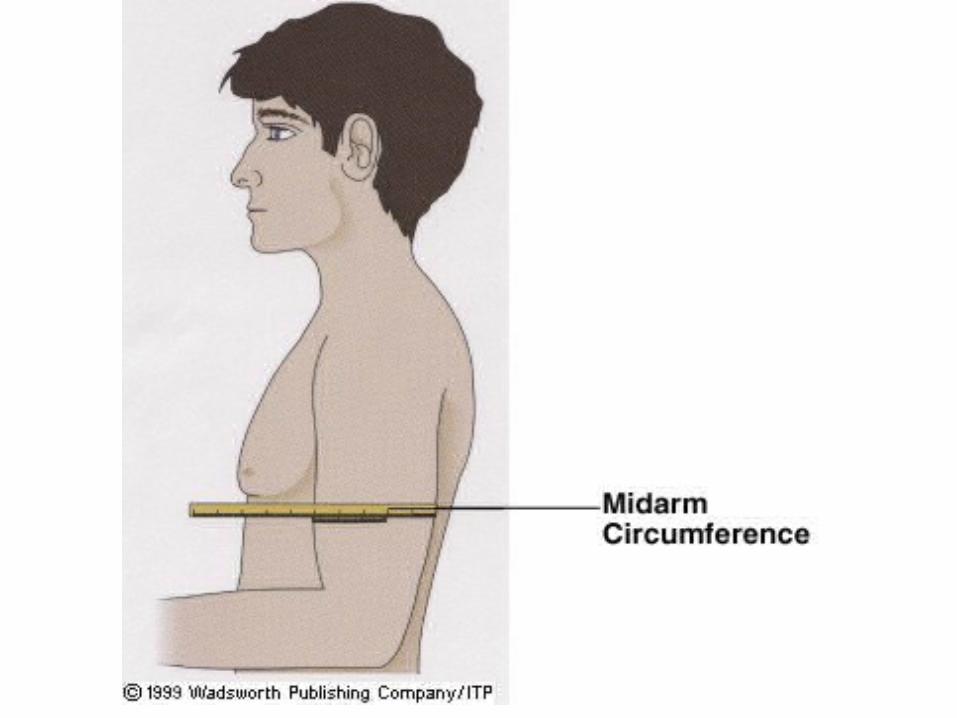
Midarm muscle circumference – indirectly measures protein status by estimating arm muscle mass.
• Midarm circumference and triceps fatfold
• plug into an equation:mmc (cm) = mc (cm) - [.314 x triceps fatfold (mm)]
Anthropometric Data Functional Measures of Nutrition Status
Hand Grip Strength
• Dynamometer
• Not appropriate w/arthritis/muscular disorders
Interpreting Measurements
• Requires caution
• Interpreting Measurements – Sometimes difficult to measure 2’ mobility
problems, injury, loose, hanging skin– Hydration/dehydration affects weight, fatfolds,
and MAMC– Standards used are controversial
Summing Up
• Anthropometric measures provide valuable information regarding body wt. and composition
• Do not reflect nutrition status alone
• Accuracy requires on the skill of the assessor
• Caution interpreting results
Assessing Nutritional Status
• Historical Information
• Physical Examination
• Anthropometric Data
• Laboratory Analyses
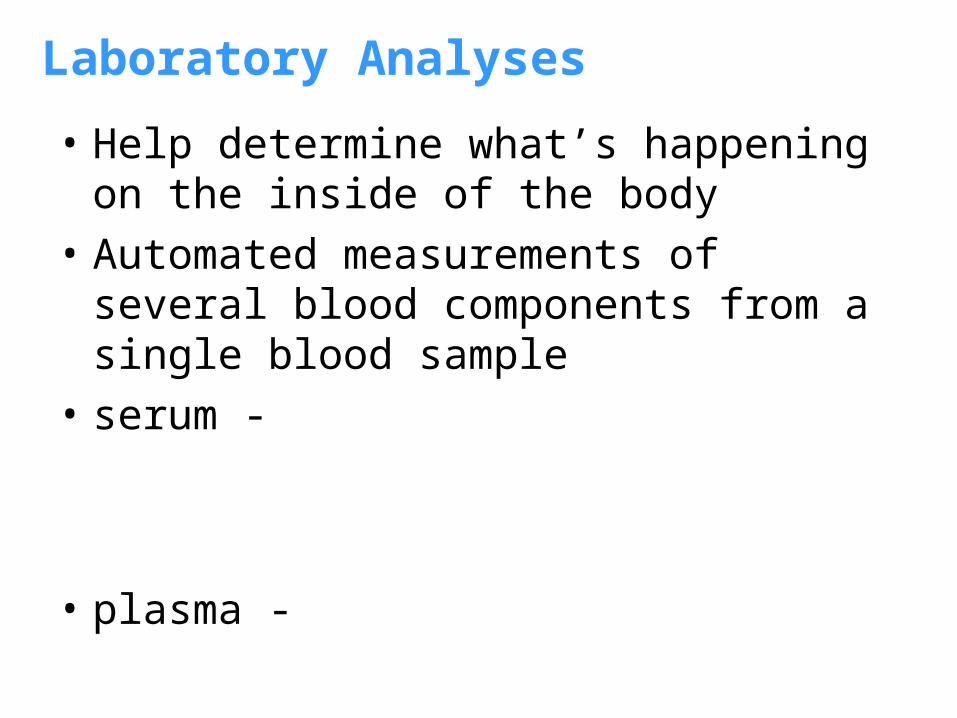
Laboratory Analyses
• Help determine what’s happening on the inside of the body
• Automated measurements of several blood components from a single blood sample
• serum -
• plasma -

Laboratory Analyses
Interpreting Biochemical Tests
• Many can be skewed with fluid retention or dehydration.
• Over-hydration can cause _____ numbers
• Dehydration can cause ______ numbers
• These are clues that anthropometrics are probably skewed as well.
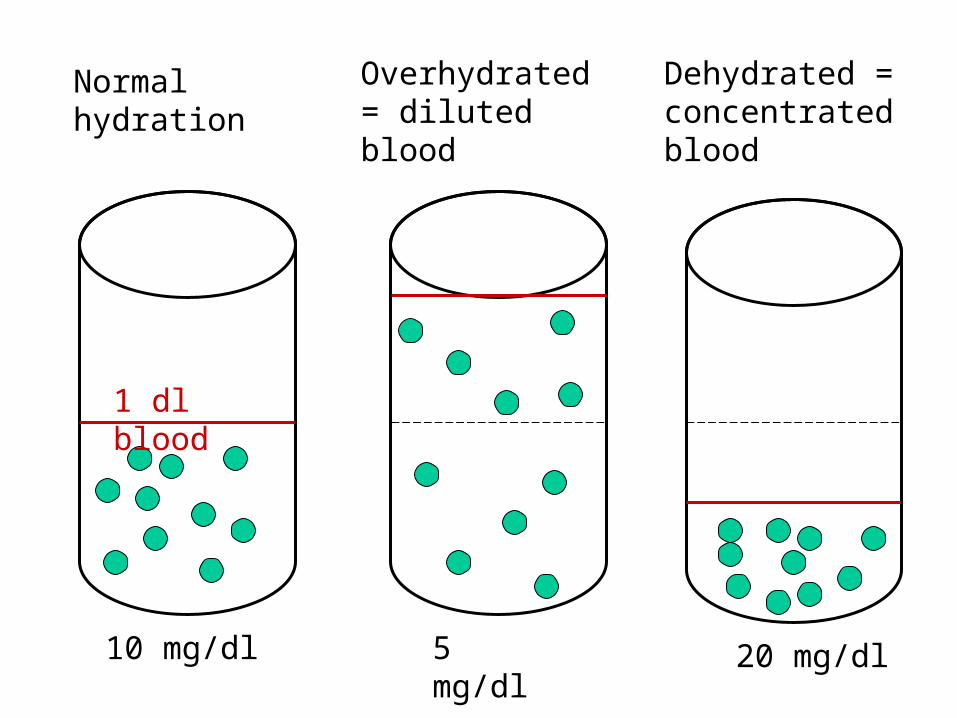
Normal hydration
Overhydrated = diluted blood
Dehydrated = concentrated blood
1 dl blood
10 mg/dl 5 mg/dl 20 mg/dl
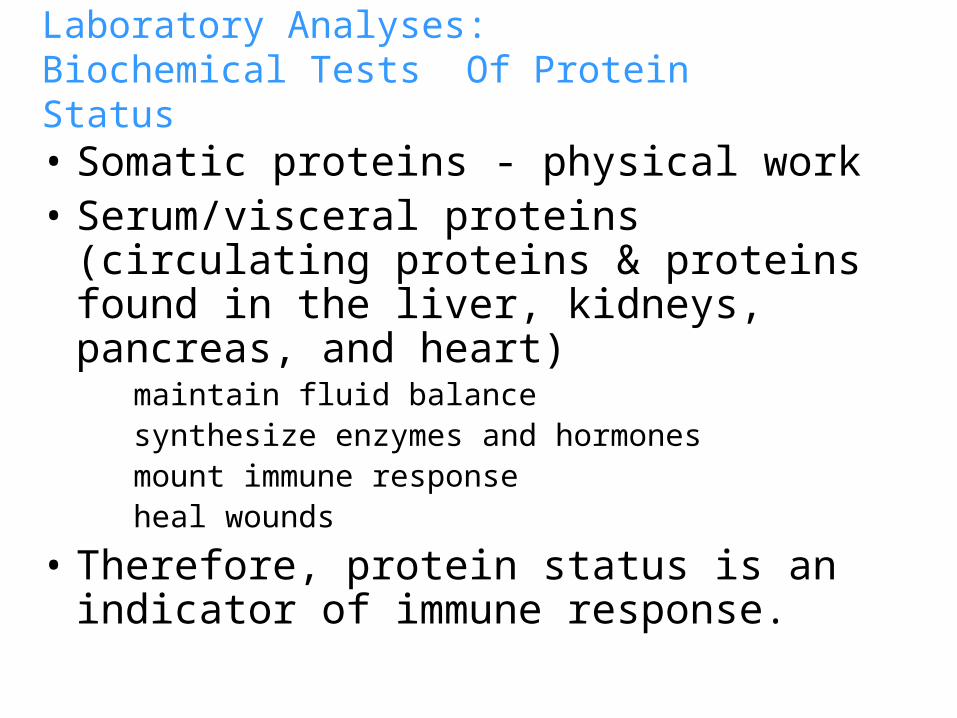
Laboratory Analyses:Biochemical Tests Of Protein Status
• Somatic proteins - physical work• Serum/visceral proteins (circulating proteins &
proteins found in the liver, kidneys, pancreas, and heart)
maintain fluid balancesynthesize enzymes and hormonesmount immune responseheal wounds
• Therefore, protein status is an indicator of immune response.

Laboratory Analyses:Biochemical Tests Of Protein Status
• Synthesized in the liver – May reflect liver function– Measurements skewed if liver diseased
• Remember, when kcals are inadequate, protein is used to make glucose.
Laboratory Analyses:Biochemical Tests Of Protein Status
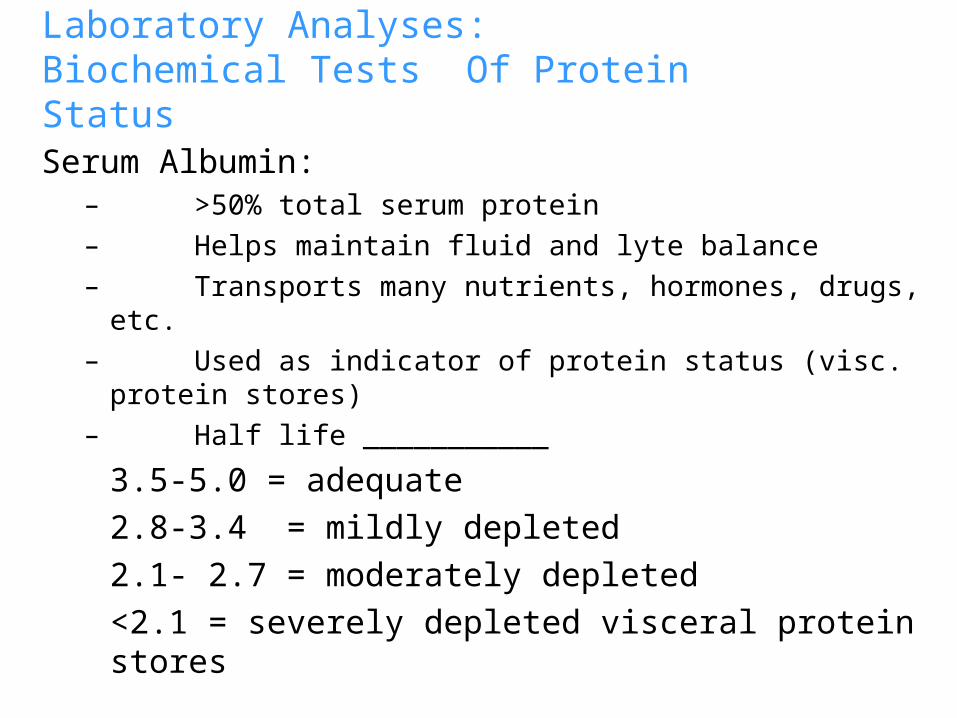
Serum Albumin:– >50% total serum protein
– Helps maintain fluid and lyte balance
– Transports many nutrients, hormones, drugs, etc.
– Used as indicator of protein status (visc. protein stores)
– Half life ___________
3.5-5.0 = adequate
2.8-3.4 = mildly depleted
2.1- 2.7 = moderately depleted
<2.1 = severely depleted visceral protein stores
Laboratory Analyses:Biochemical Tests Of Protein Status
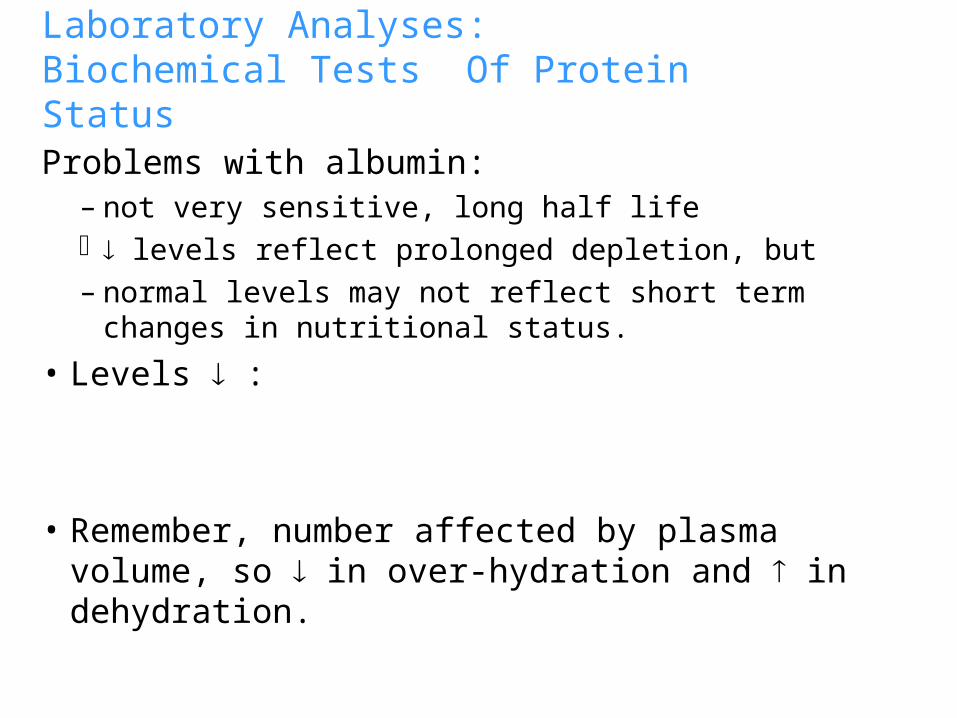
Problems with albumin:– not very sensitive, long half life levels reflect prolonged depletion, but
– normal levels may not reflect short term changes in nutritional status.
• Levels :
• Remember, number affected by plasma volume, so in over-hydration and in dehydration.
Laboratory Analyses:Biochemical Tests Of Protein Status
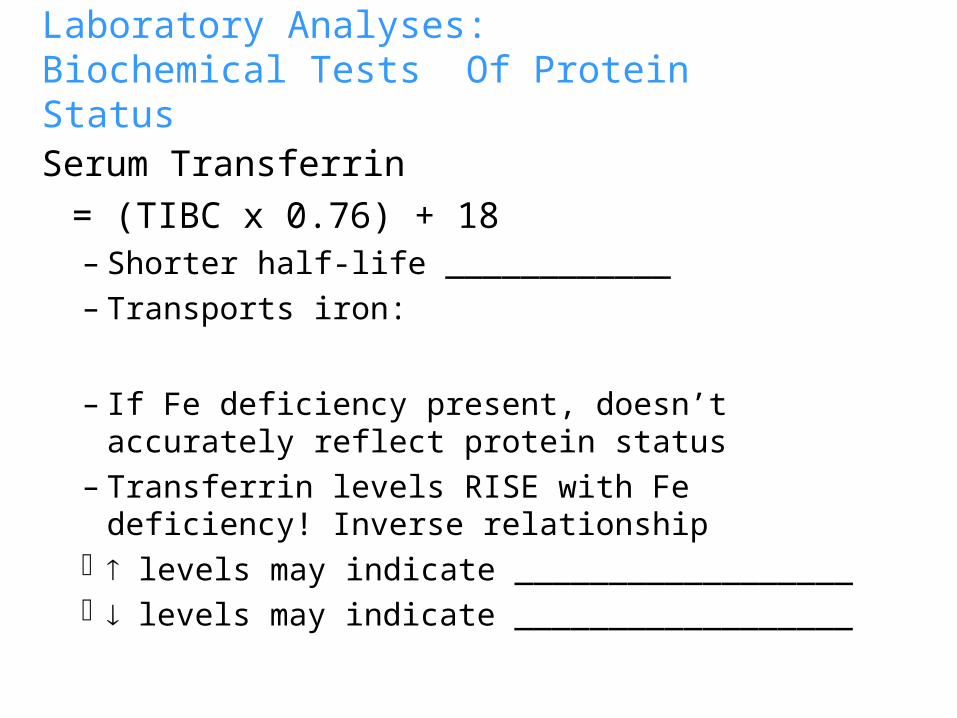
Serum Transferrin
= (TIBC x 0.76) + 18– Shorter half-life ____________– Transports iron:
– If Fe deficiency present, doesn’t accurately reflect protein status
– Transferrin levels RISE with Fe deficiency! Inverse relationship
levels may indicate __________________ levels may indicate __________________

Laboratory Analyses:Biochemical Tests Of Protein Status
– Levels :– Levels :
Normal: >200 mg/dl
Mild 150-200 mg/dl
Moderate 100-149 mg/dl
Severe <100 mg/dl
Laboratory Analyses:Biochemical Tests Of Protein Status
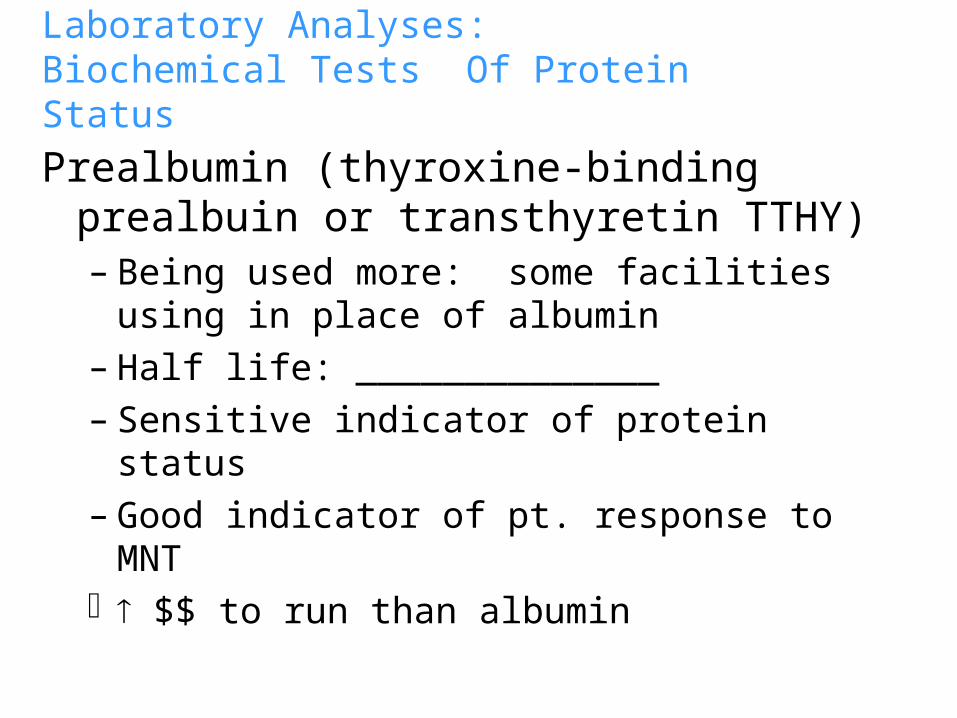
Prealbumin (thyroxine-binding prealbuin or transthyretin TTHY) – Being used more: some facilities using in place of
albumin– Half life: ______________– Sensitive indicator of protein status– Good indicator of pt. response to MNT $$ to run than albumin

Laboratory Analyses:Biochemical Tests Of Protein Status
Prealbumin– Levels :– Levels :
Normal: 15-40 mg/dl
Mild: 10-15 mg/dl
Moderate: 5-10 mg/dl
Severe: <5 mg/dl
Laboratory Analyses:Biochemical Tests Of Protein Status
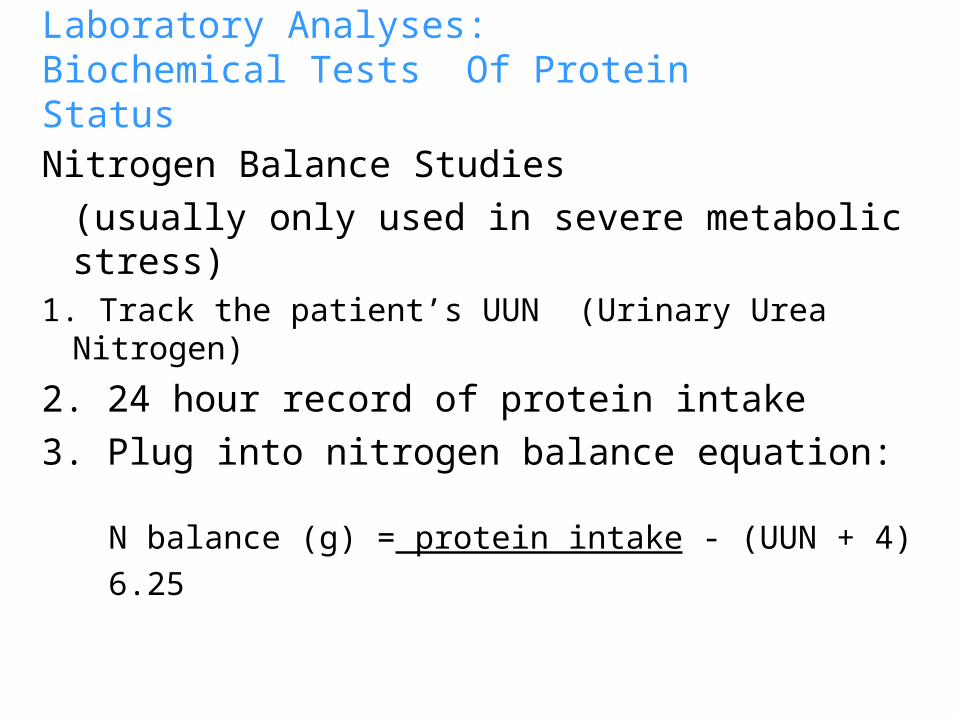
Nitrogen Balance Studies
(usually only used in severe metabolic stress)1. Track the patient’s UUN (Urinary Urea Nitrogen)
2. 24 hour record of protein intake
3. Plug into nitrogen balance equation:
N balance (g) = protein intake - (UUN + 4)
6.25
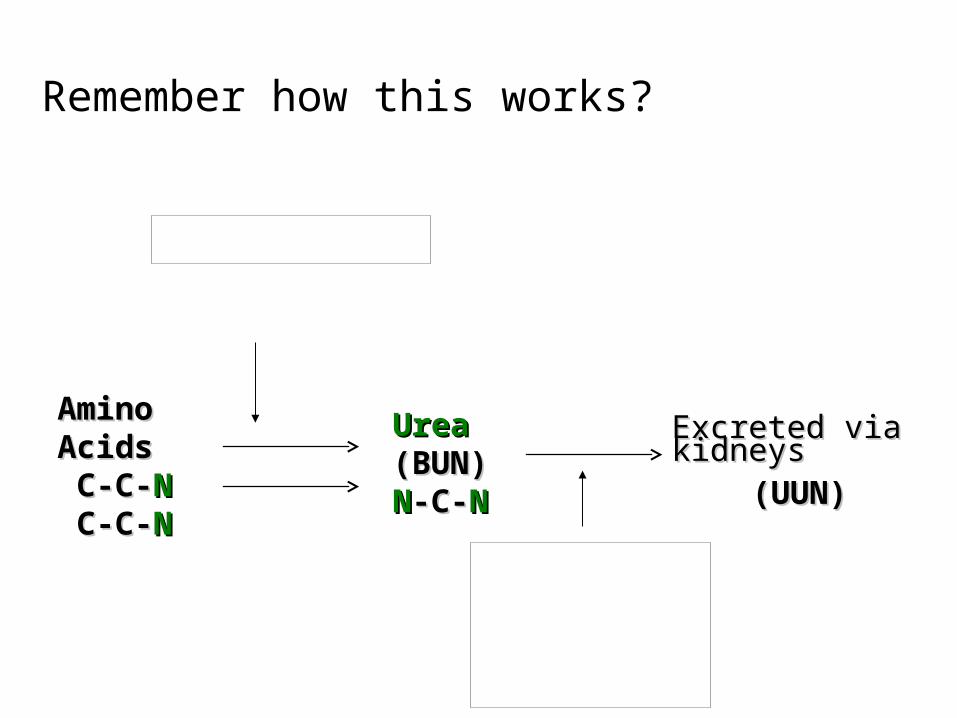
Amino Amino Acids Acids C-C-C-C-NN C-C-C-C-NN
Urea Urea (BUN)(BUN)NN-C--C-NN
Excreted via Excreted via kidneyskidneys
(UUN)(UUN)
Remember how this works?
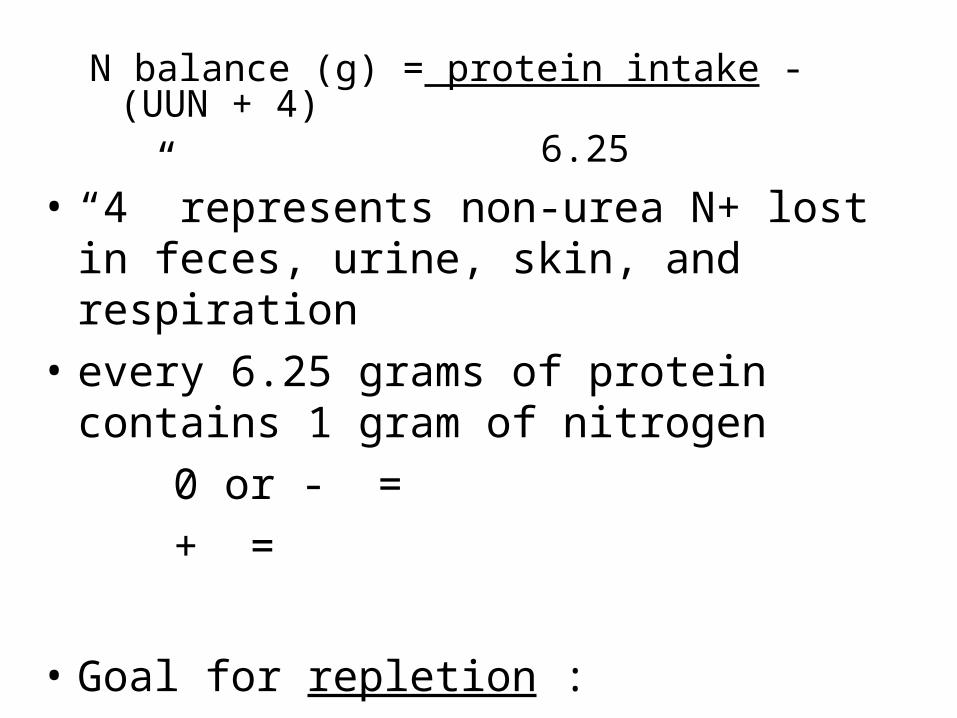
N balance (g) = protein intake - (UUN + 4) 6.25
• “4” represents non-urea N+ lost in feces, urine, skin, and respiration
• every 6.25 grams of protein contains 1 gram of nitrogen
0 or - =
+ =
• Goal for repletion :
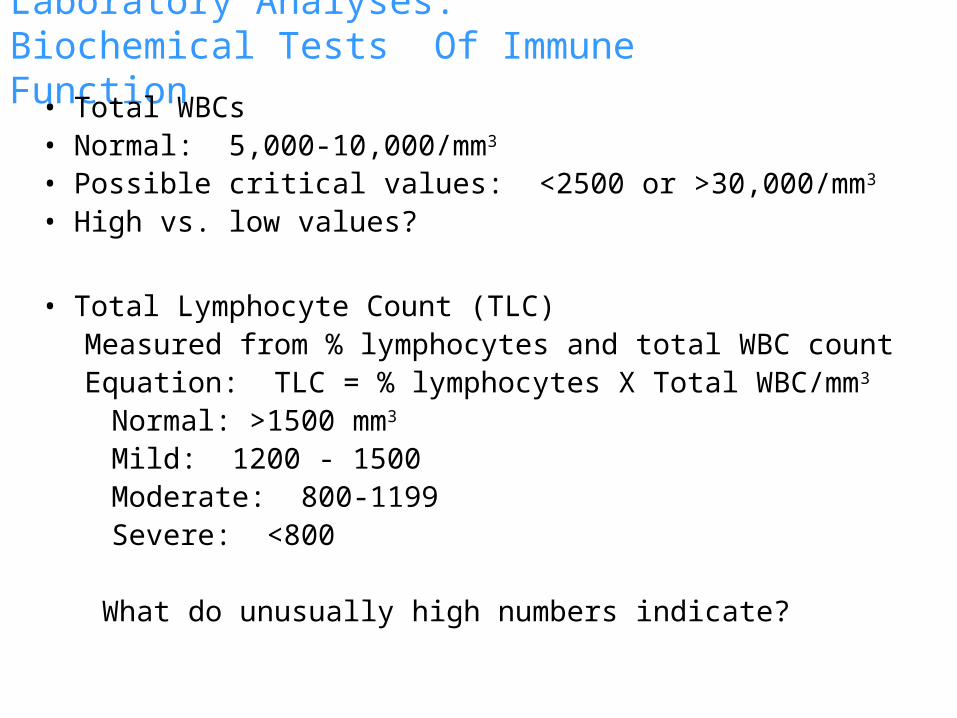
Laboratory Analyses:Biochemical Tests Of Immune Function
• Total WBCs• Normal: 5,000-10,000/mm3
• Possible critical values: <2500 or >30,000/mm3 • High vs. low values?
• Total Lymphocyte Count (TLC)Measured from % lymphocytes and total WBC countEquation: TLC = % lymphocytes X Total WBC/mm3
Normal: >1500 mm3
Mild: 1200 - 1500Moderate: 800-1199Severe: <800
What do unusually high numbers indicate?
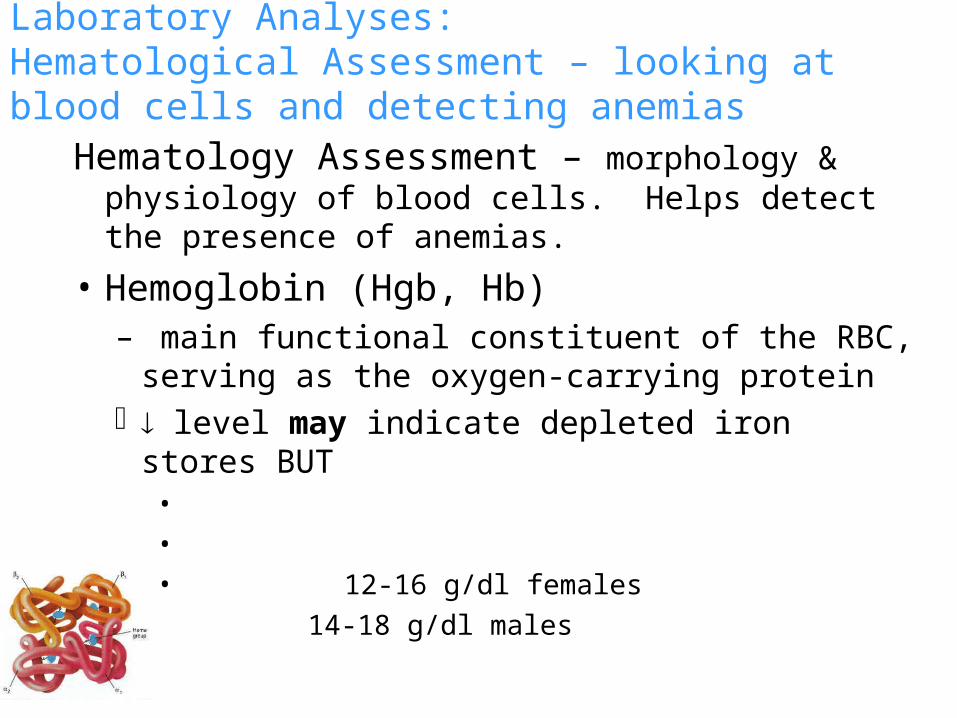
Laboratory Analyses:Hematological Assessment – looking at blood cells and detecting anemias
Hematology Assessment – morphology & physiology of blood cells. Helps detect the presence of anemias.
• Hemoglobin (Hgb, Hb) – main functional constituent of the RBC, serving as
the oxygen-carrying protein level may indicate depleted iron stores BUT
•
•
• 12-16 g/dl females
14-18 g/dl males
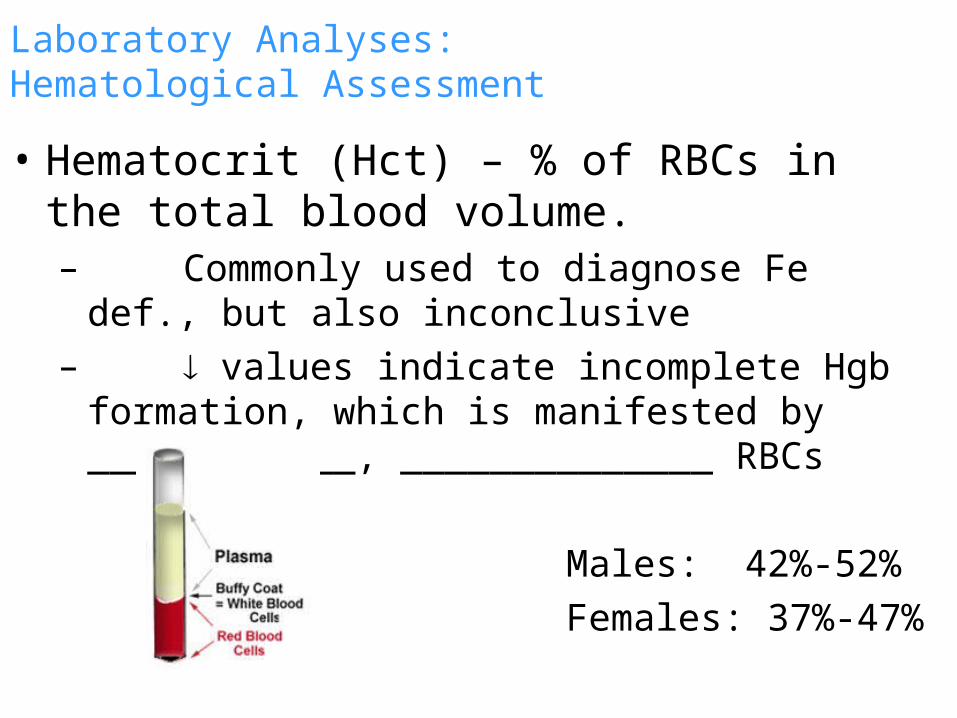
Laboratory Analyses:Hematological Assessment
• Hematocrit (Hct) – % of RBCs in the total blood volume. – Commonly used to diagnose Fe def., but also
inconclusive– values indicate incomplete Hgb formation,
which is manifested by ____________, ______________ RBCs
Males: 42%-52%
Females: 37%-47%
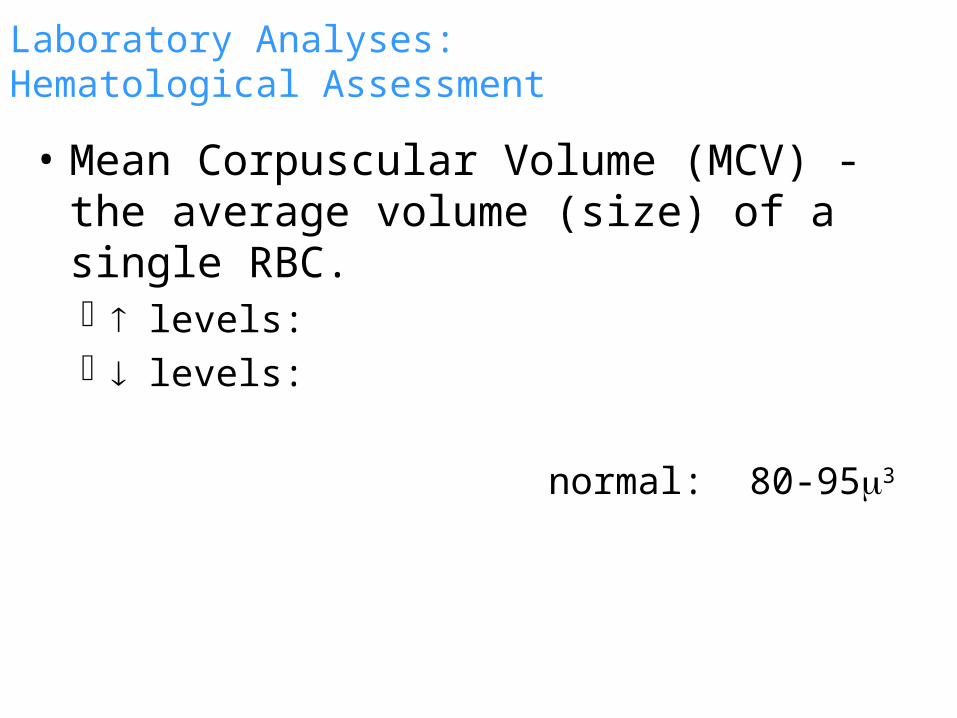
Laboratory Analyses:Hematological Assessment
• Mean Corpuscular Volume (MCV) - the average volume (size) of a single RBC. levels: levels:
normal: 80-953
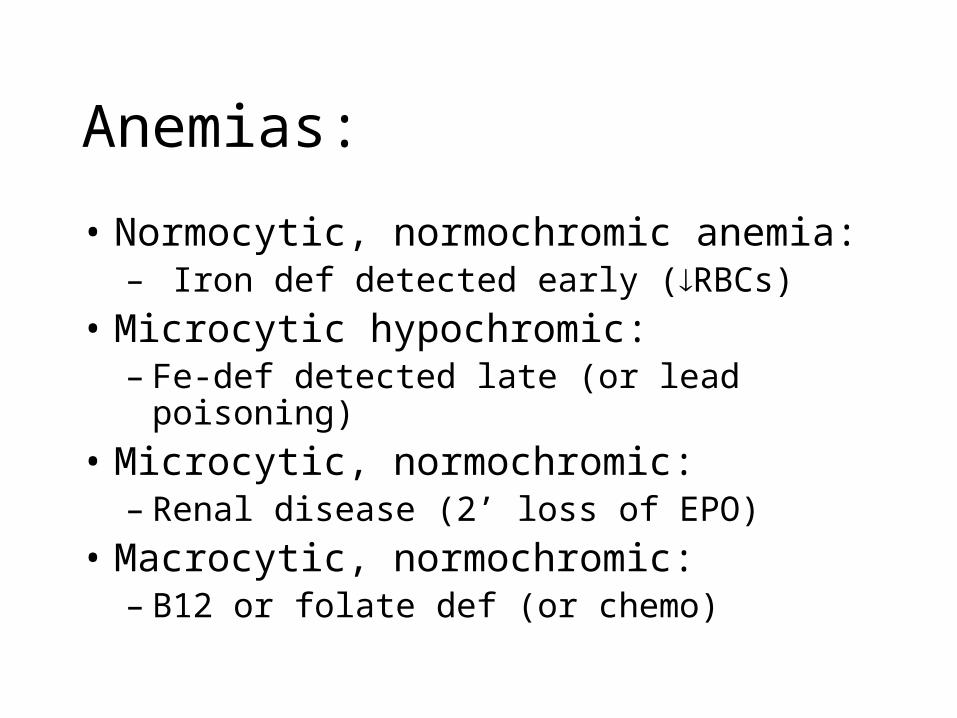
Anemias:
• Normocytic, normochromic anemia: – Iron def detected early (RBCs)
• Microcytic hypochromic: – Fe-def detected late (or lead poisoning)
• Microcytic, normochromic: – Renal disease (2’ loss of EPO)
• Macrocytic, normochromic: – B12 or folate def (or chemo)
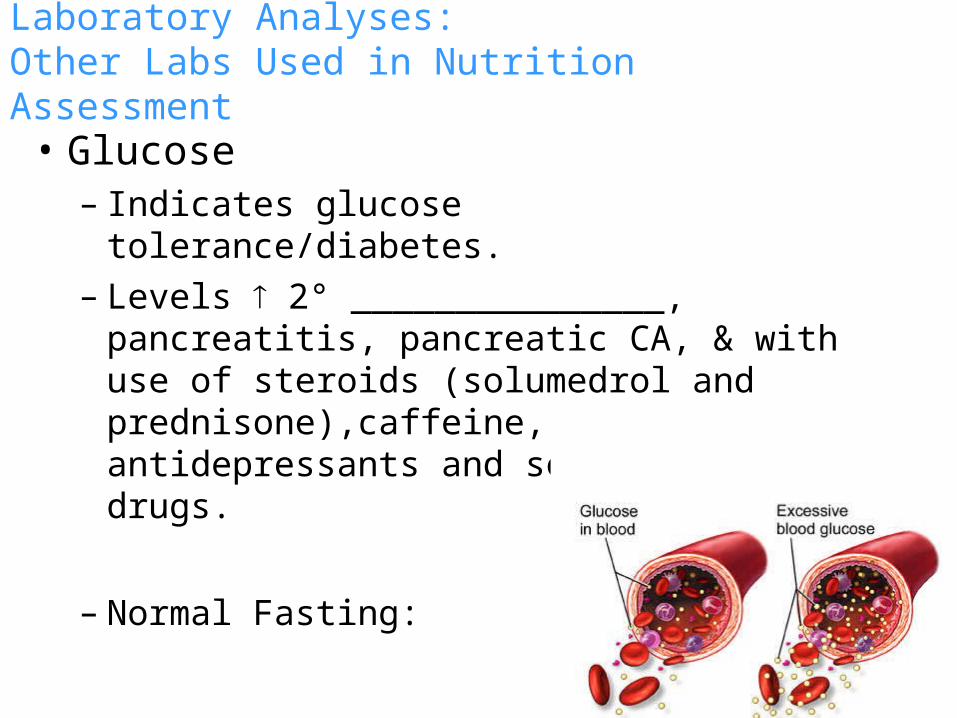
Laboratory Analyses:Other Labs Used in Nutrition Assessment
• Glucose – Indicates glucose tolerance/diabetes.– Levels 2° _______________, pancreatitis,
pancreatic CA, & with use of steroids (solumedrol and prednisone),caffeine, antidepressants and several other drugs.
– Normal Fasting:
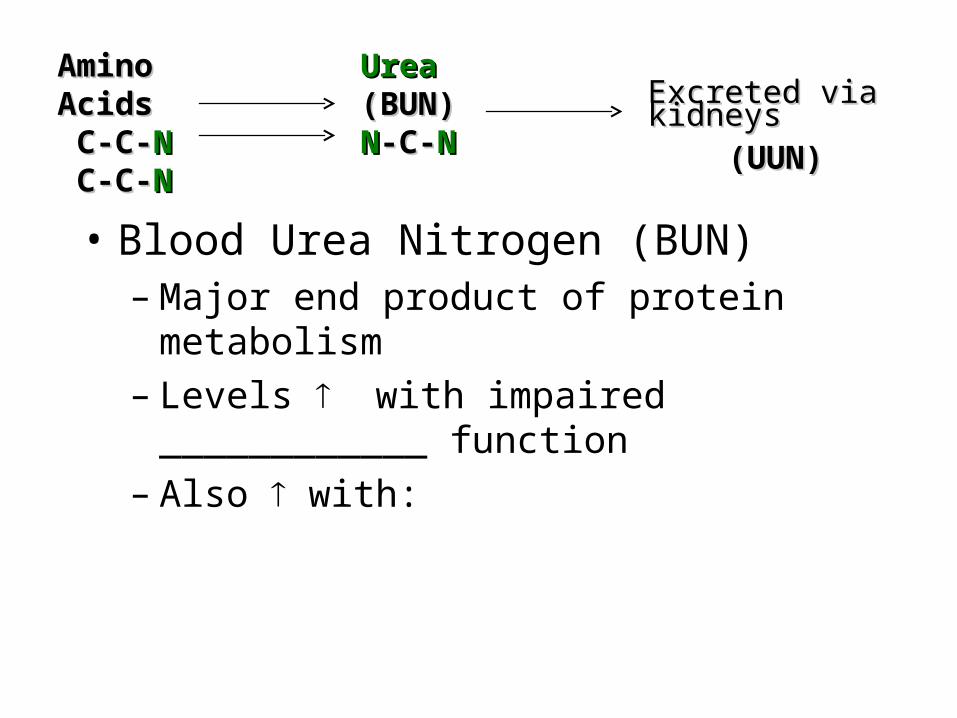
• Blood Urea Nitrogen (BUN) – Major end product of protein metabolism– Levels with impaired ____________ function – Also with:
Amino Amino Acids Acids C-C-C-C-NN C-C-C-C-NN
Urea Urea (BUN)(BUN)NN-C--C-NN
Excreted via Excreted via kidneyskidneys
(UUN)(UUN)
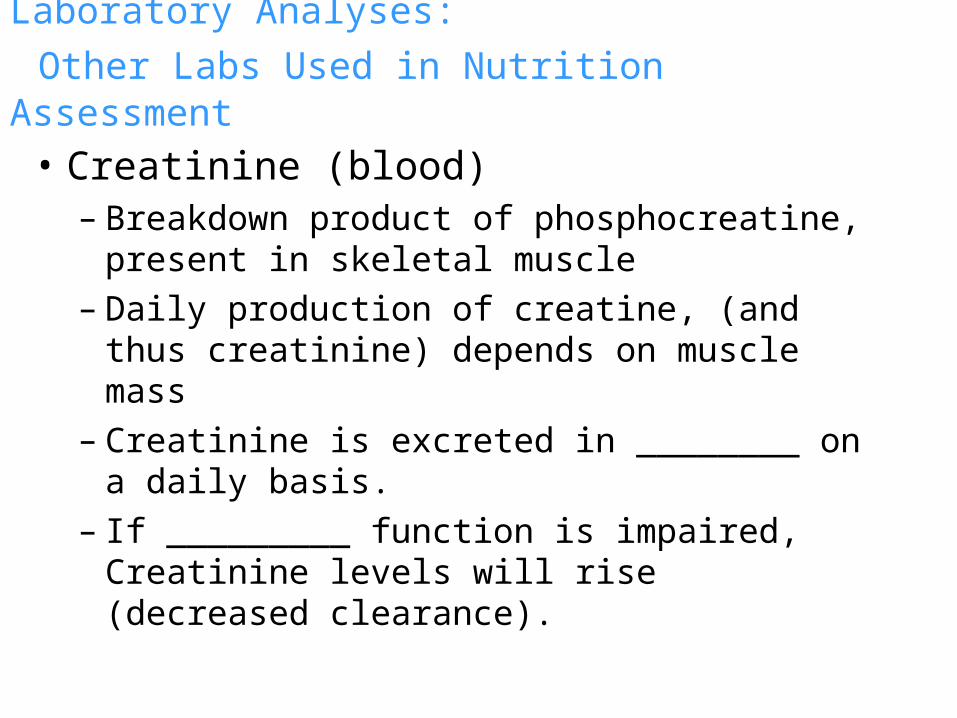
Laboratory Analyses:
Other Labs Used in Nutrition Assessment
• Creatinine (blood)– Breakdown product of phosphocreatine, present in
skeletal muscle– Daily production of creatine, (and thus creatinine)
depends on muscle mass– Creatinine is excreted in ________ on a daily
basis. – If _________ function is impaired, Creatinine
levels will rise (decreased clearance).
Laboratory Analyses:
Other Labs Used in Nutrition Assessment
• Sodium (Na+) – Indicator of hydration level. Look at Na+ level to
evaluate other labs. – Overhydration -– Dehydration -
• eg. albumin