introduction to data science day 1 data matters summer workshop series in data science sponsored by...
TRANSCRIPT
Introduction to Data ScienceDay 1
Data Matters Summer workshop series in data scienceSponsored by the Odum Institute, RENCI, and NCDS
Thomas M. [email protected]
2
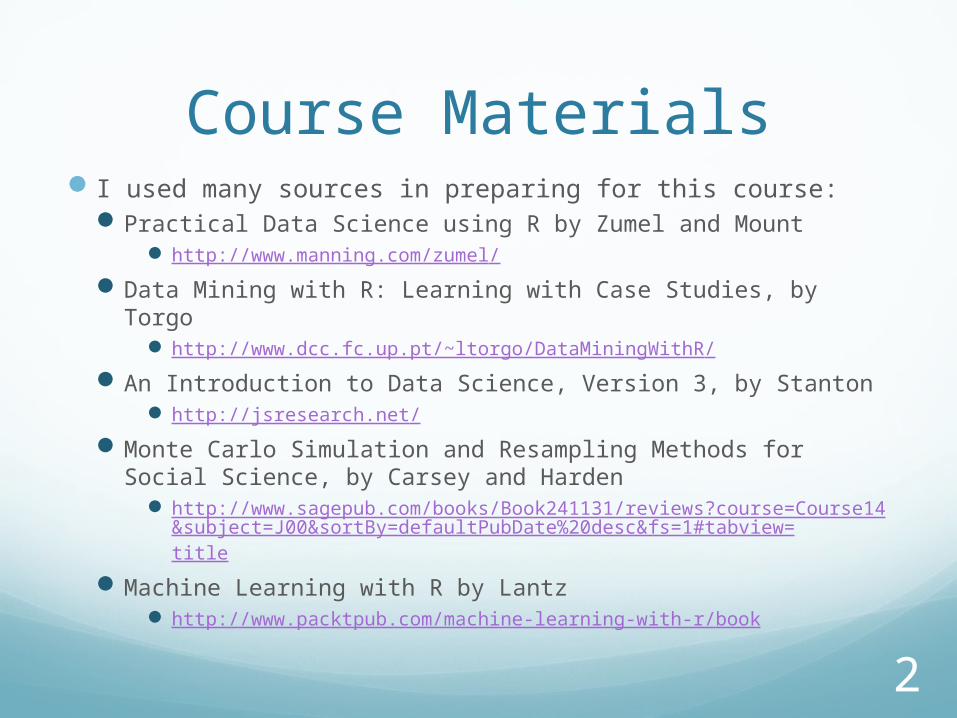
Course Materials I used many sources in preparing for this course:
Practical Data Science using R by Zumel and Mount http://www.manning.com/zumel/
Data Mining with R: Learning with Case Studies, by Torgo http://www.dcc.fc.up.pt/~ltorgo/DataMiningWithR/
An Introduction to Data Science, Version 3, by Stanton http://jsresearch.net/
Monte Carlo Simulation and Resampling Methods for Social Science, by Carsey and Harden
http://www.sagepub.com/books/Book241131/reviews?course=Course14&subject=J00&sortBy=defaultPubDate%20desc&fs=1#tabview=title
Machine Learning with R by Lantz http://www.packtpub.com/machine-learning-with-r/book
3
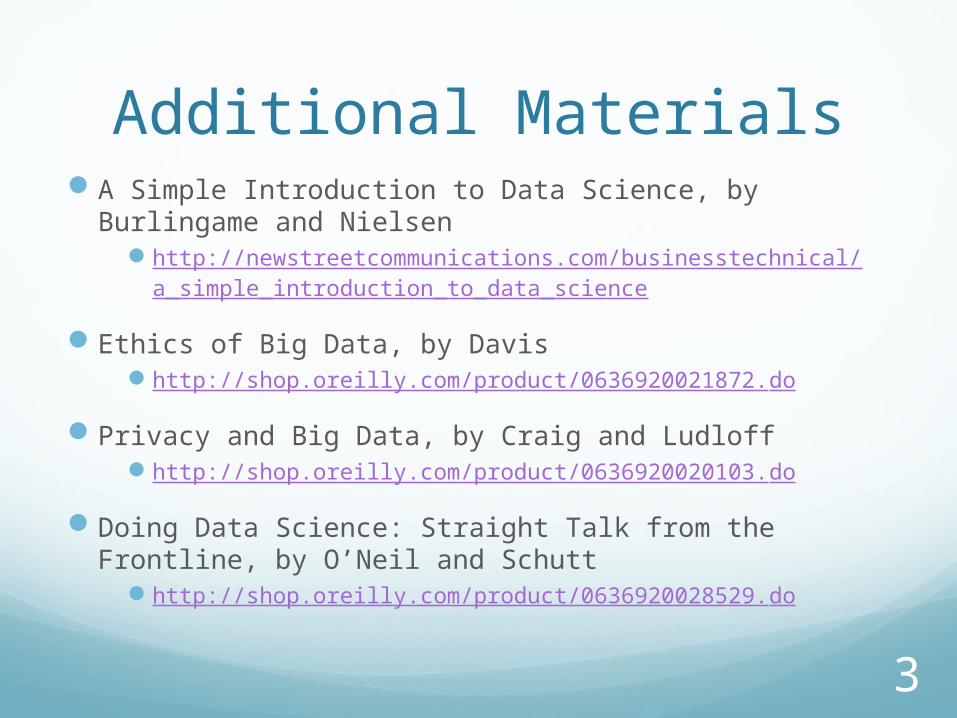
Additional MaterialsA Simple Introduction to Data Science, by
Burlingame and Nielsenhttp://newstreetcommunications.com/businesstechnical/
a_simple_introduction_to_data_science
Ethics of Big Data, by Davishttp://shop.oreilly.com/product/0636920021872.do
Privacy and Big Data, by Craig and Ludloffhttp://shop.oreilly.com/product/0636920020103.do
Doing Data Science: Straight Talk from the Frontline, by O’Neil and Schutt
http://shop.oreilly.com/product/0636920028529.do
4
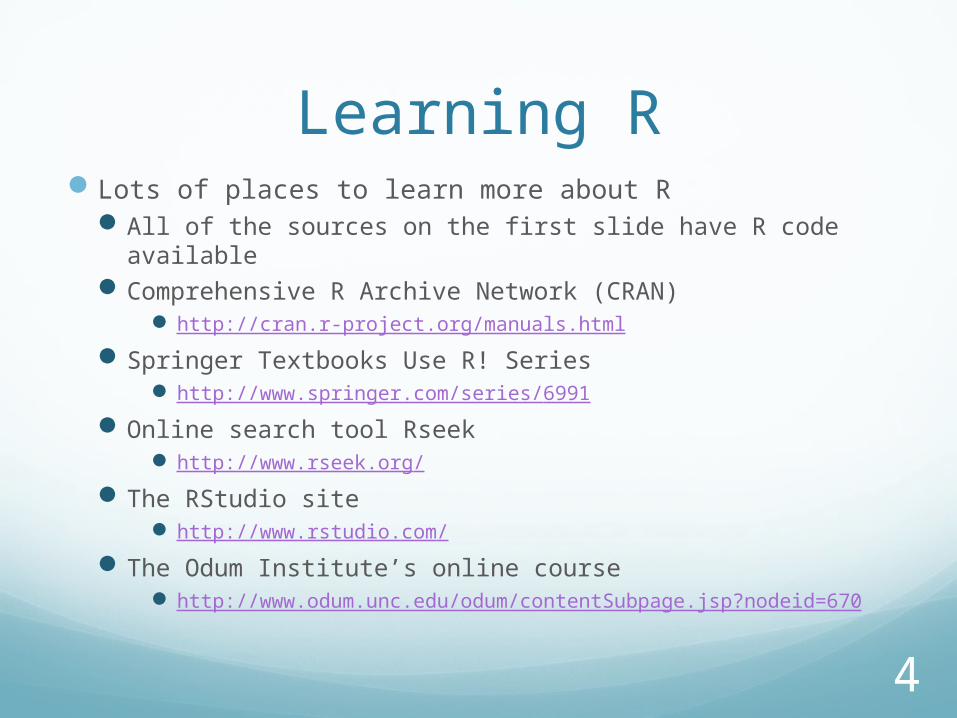
Learning RLots of places to learn more about R
All of the sources on the first slide have R code available Comprehensive R Archive Network (CRAN)
http://cran.r-project.org/manuals.html
Springer Textbooks Use R! Series http://www.springer.com/series/6991
Online search tool Rseek http://www.rseek.org/
The RStudio site http://www.rstudio.com/
The Odum Institute’s online course http://www.odum.unc.edu/odum/contentSubpage.jsp?nodeid=
670
5
What is Data Science?What words come to mind when you think of
Data Science?
What experience do you have with Data Science?
Why are you taking an Introduction to Data Science Class?
6
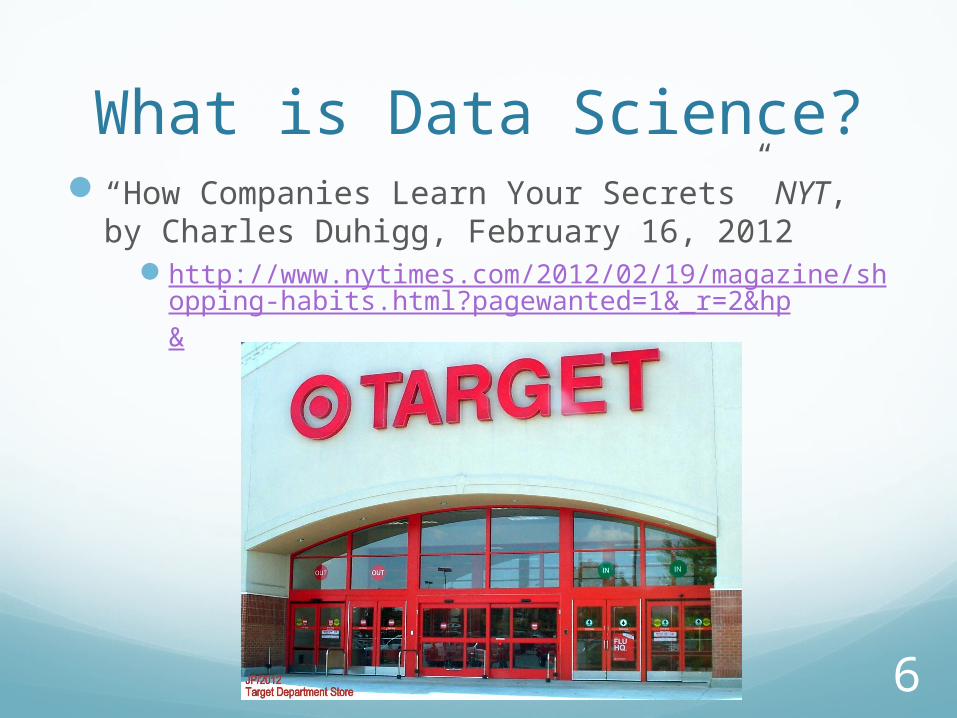
What is Data Science?“How Companies Learn Your Secrets” NYT, by
Charles Duhigg, February 16, 2012http://www.nytimes.com/2012/02/19/magazine/shopp
ing-habits.html?pagewanted=1&_r=2&hp&

7
What did Target Do?Mining of data on shopping patterns
Specific products purchasedCombination of products purchasedCombined with demographic and other data
Psychology and neuroscienceHabits:
Cue-routine-rewardWhen are habits open to change?
8
Lessons from TargetYes, Data Science is about mining data
There are deeper theoretical issues involved in understanding what you find
Left out of that long article are most of the critical steps that precede the analysis
In short, Data Science > data mining
9
Definition of Data ScienceThere are many, but most say data science is:
Broad – broader than any one existing discipline Interdisciplinary: Computer Science, Statistics,
Information Science, databases, mathematicsApplied focus on extracting knowledge from data
to inform decision making.Focuses on the skills needed to collect, manage,
store, distribute, analyze, visualize, and reuse data.
There are many visual representations of Data Science
10
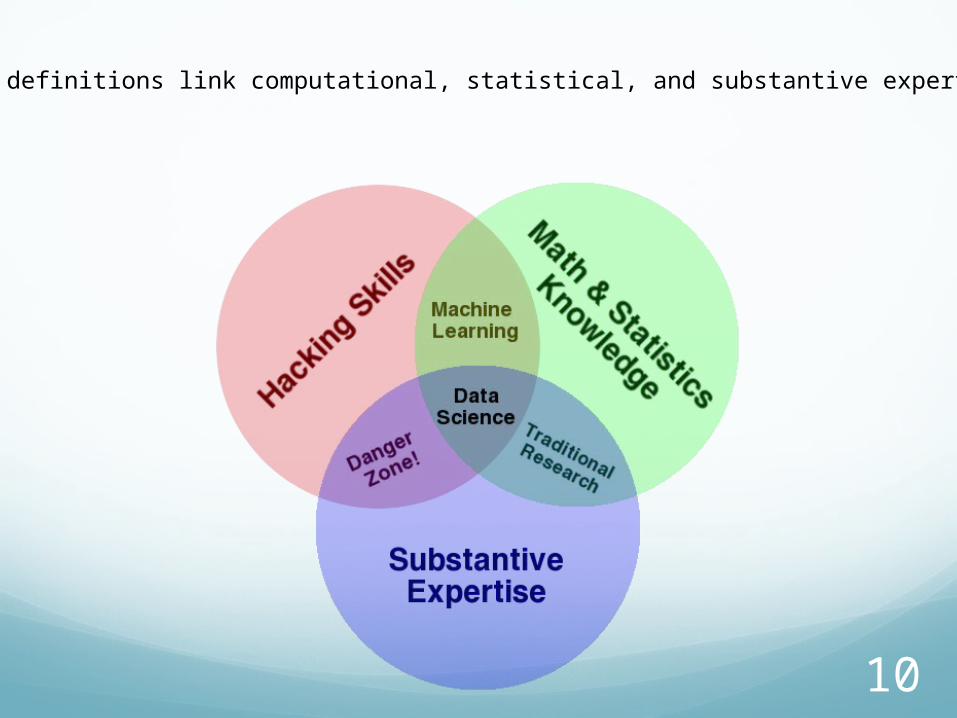
Some definitions link computational, statistical, and substantive expertise.
11
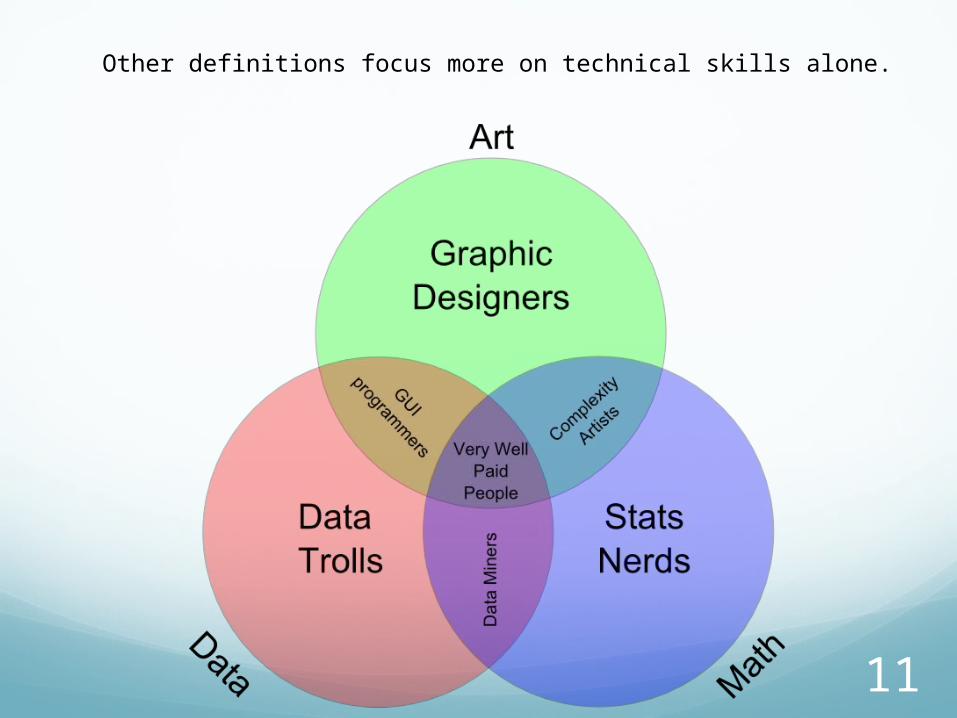
Other definitions focus more on technical skills alone.
12
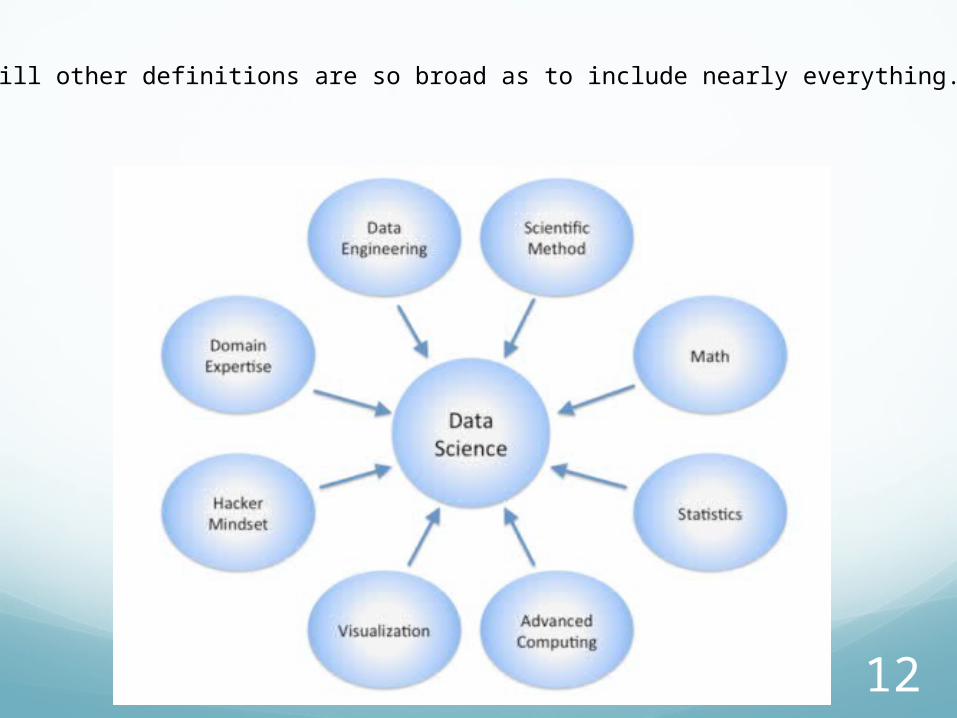
Still other definitions are so broad as to include nearly everything.

13
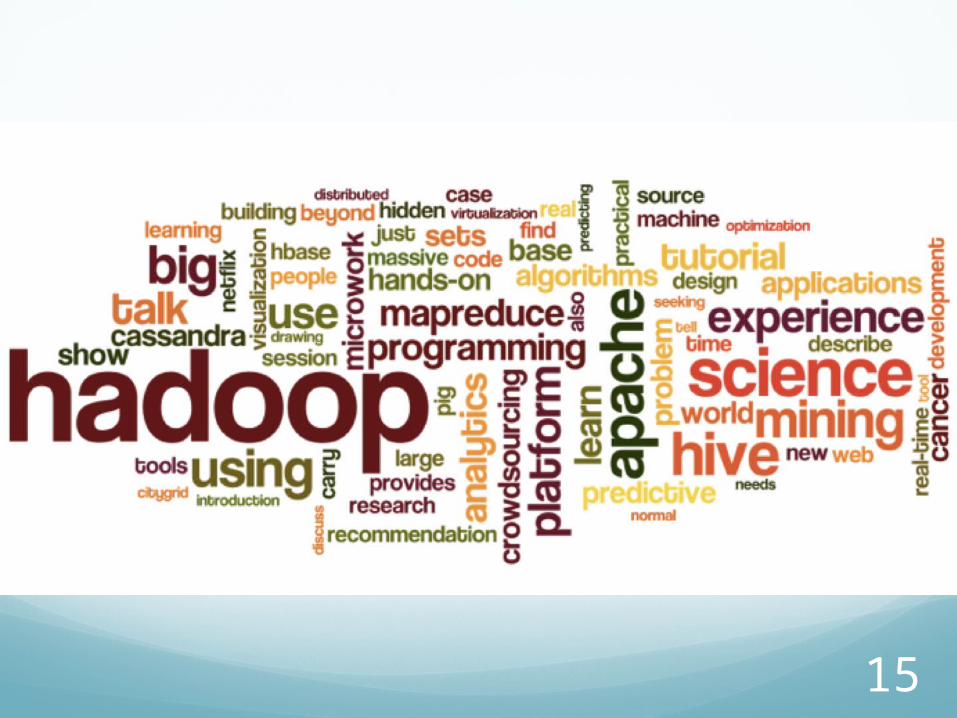
There are many “Word Cloud” representations of Data Science as well.

14
15

16
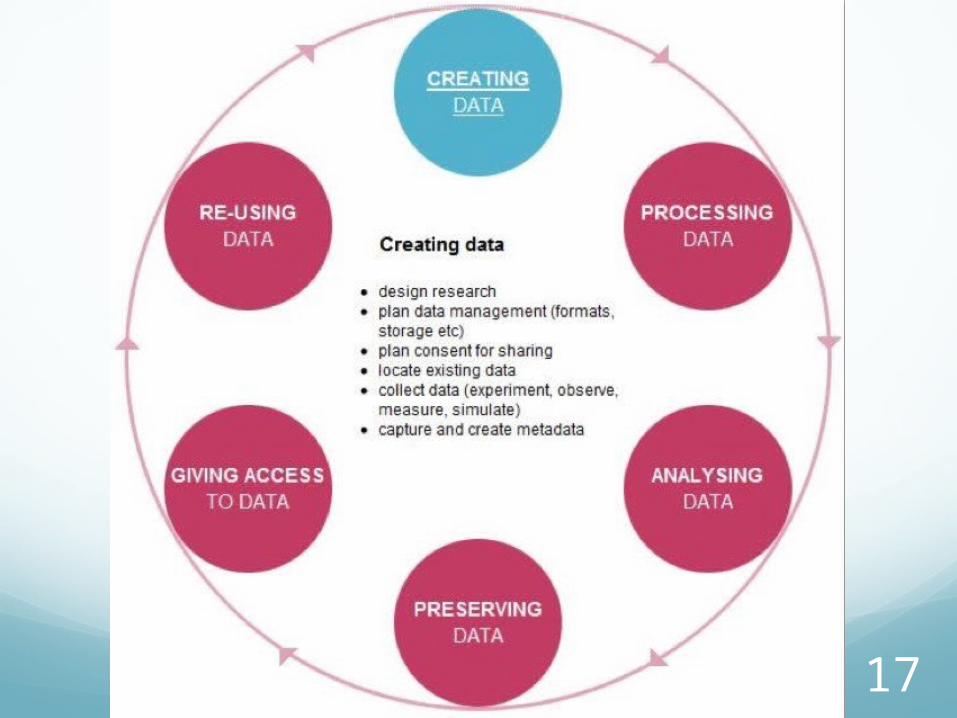
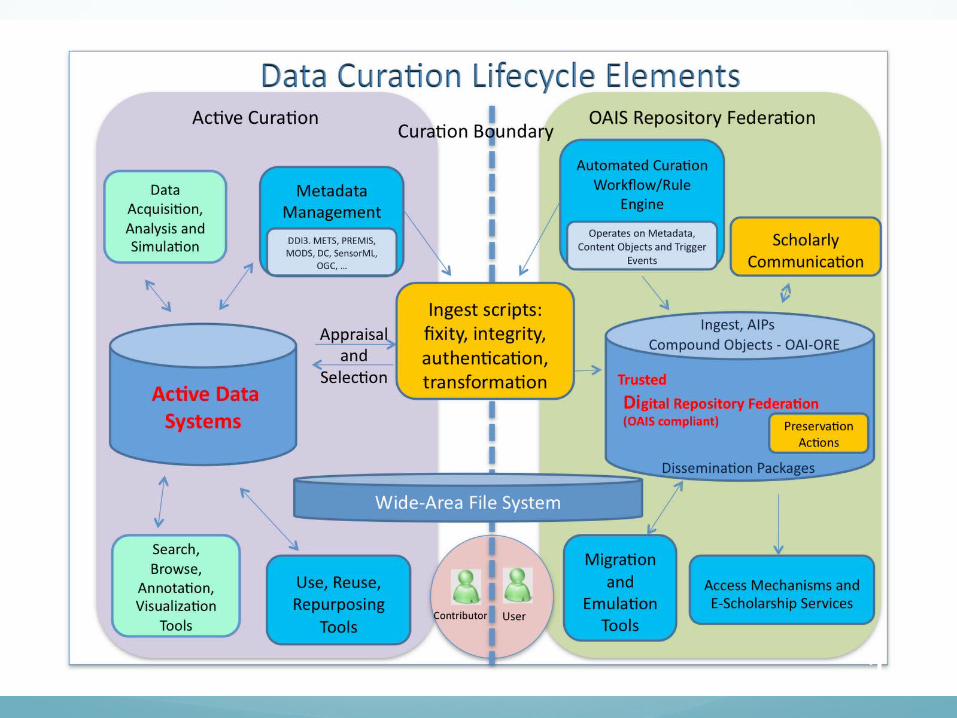
The Data LifecycleData science considers data at every stage of what is
called the data lifecycle.
This lifecycle generally refers to everything from collecting data to analyzing it to sharing it so others can re-analyze it.
New visions of this process in particular focus on integrating every action that creates, analyzes, or otherwise touches data.
These same new visions treat the process as dynamic – archives are not just digital shoe boxes under the bed.
There are many representations of the this lifecycle.
17

18
19

20
What is Missing?Most definitions of data science underplay or
leave out discussions of:Substantive theoryMetadataPrivacy and Ethics
21
What is the DGP?Good analysis starts with a question you want to answer.
Blind data mining can only get you so far, and really, there is no such thing as completely blind mining
Answering that question requires laying out expectations of what you will find and explanations for those expectations.
Those expectations and explanations rest on assumptions
If your data collection, data management, and data analysis are not compatible with those assumptions, you risk producing meaningless or misleading answers
22
The DGP (cont.)Think of the world you are interested in as governed by
dynamic processes.
Those processes produce observable bits of information about themselves – data
We can use data analysis to: Discover patterns in data and fit models to that data Make predictions outside of our data Inform explanations of both those patterns and those
predictions.
Real discovery is NOT about modeling patterns in observable data. It is about understanding the processes that produced that data.
23
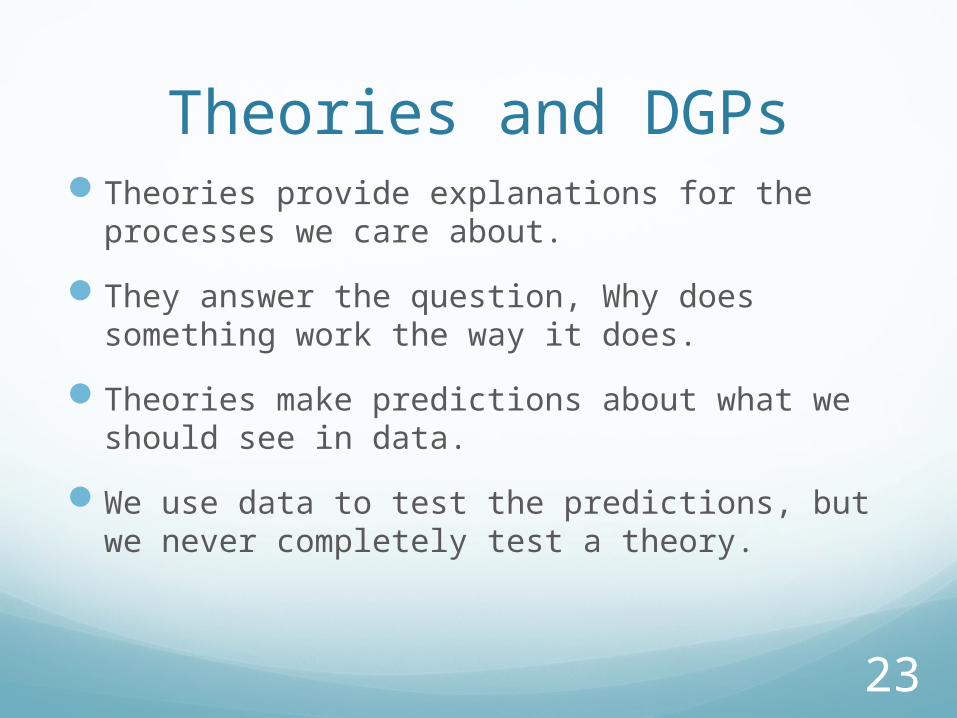
Theories and DGPsTheories provide explanations for the processes
we care about.
They answer the question, Why does something work the way it does.
Theories make predictions about what we should see in data.
We use data to test the predictions, but we never completely test a theory.
24
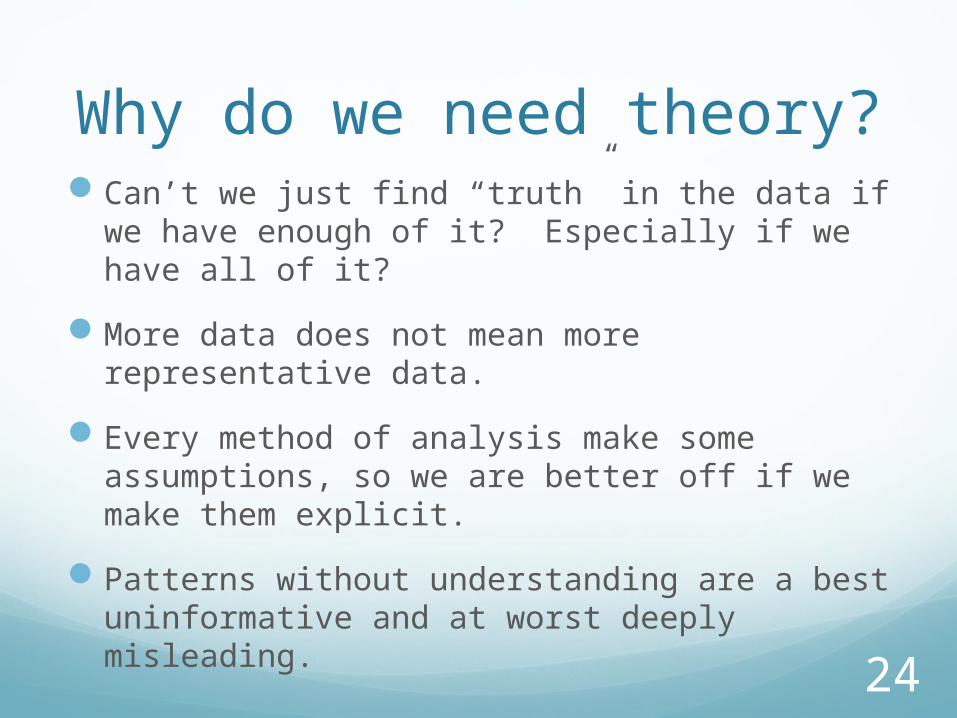
Why do we need theory?Can’t we just find “truth” in the data if we have
enough of it? Especially if we have all of it?
More data does not mean more representative data.
Every method of analysis make some assumptions, so we are better off if we make them explicit.
Patterns without understanding are a best uninformative and at worst deeply misleading.
25
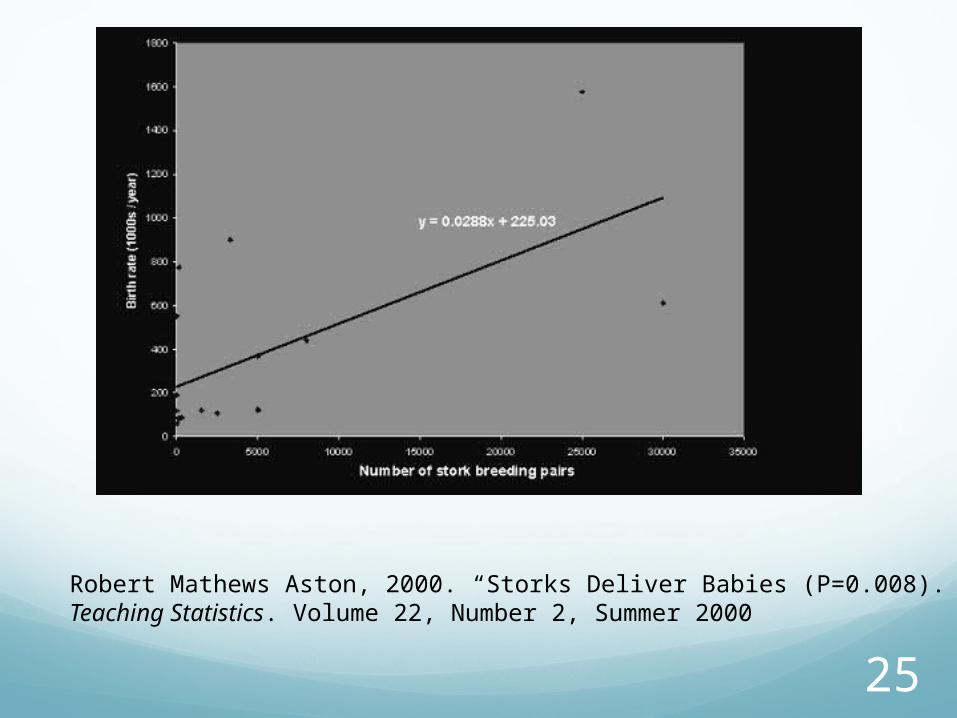
Robert Mathews Aston, 2000. “Storks Deliver Babies (P=0.008).”Teaching Statistics. Volume 22, Number 2, Summer 2000
26
New Behaviors Require New Theories
The Target example illustrated how existing theories about habit formation informed their data mining efforts.
However, who new behaviors exist that are creating a lot of the data that data scientists want to analyze: Online shopping Cell phone usage Crowd sourced recommendation systems Facebook, Google searching, etc. Online mobilization of social protests
We need new theories for these new behaviors.
27
MetadataMetadata is data about data. It is frequently
ignored or misunderstood.
Metadata is required to give data meaning.
It includes:Variable names and labels, value labels,
information on who collected the data, when, by what methods, in what locations, for what purpose, and by who.
Metadata is essential to use data effectively, to reuse data, to share data, and to integrate data.
28
Privacy and EthicsData, the elements of data science, and even
so-called “Big Data” are not new.
One thing that is new is the greater variety of data and, most importantly, the amount of data available about humans.
Discussion and good policy regarding privacy, security, and the ethical use of data about people lags behind the methods of collecting, sharing, archiving, and analyzing data.We will return to these issues later in the course.

29
The Free Market, Unfair Competition, Big Brother?
30
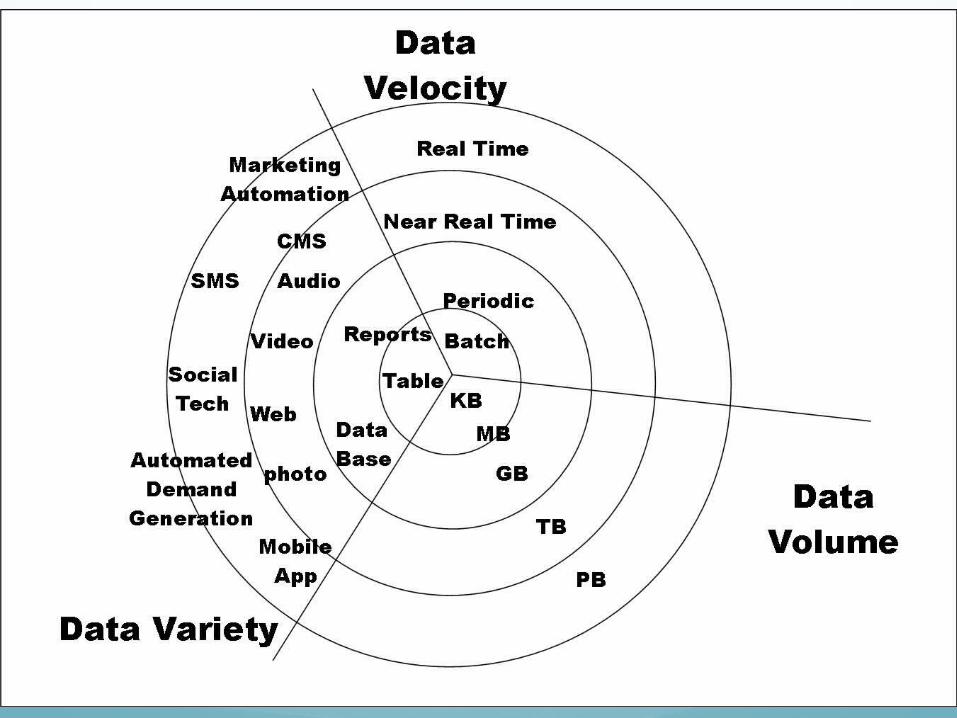
Big DataThe launch of the Data Science conversation has been
sparked primarily by the so-called “Big Data” revolution.
As mentioned, we have always had data that taxed our technical and computational capacities.
“Big Data” makes front-page news, however, because of the explosion of data about people.
Contemporary definitions of Big Data focus on: Volume (the amount of data) Velocity (the speed of data in and out) Variety (the diverse types of data)
31
32
Big DataDespite their linkage in many contemporary
discussions, Big Data ≠ Data Science.Data science principles apply to all data – big and
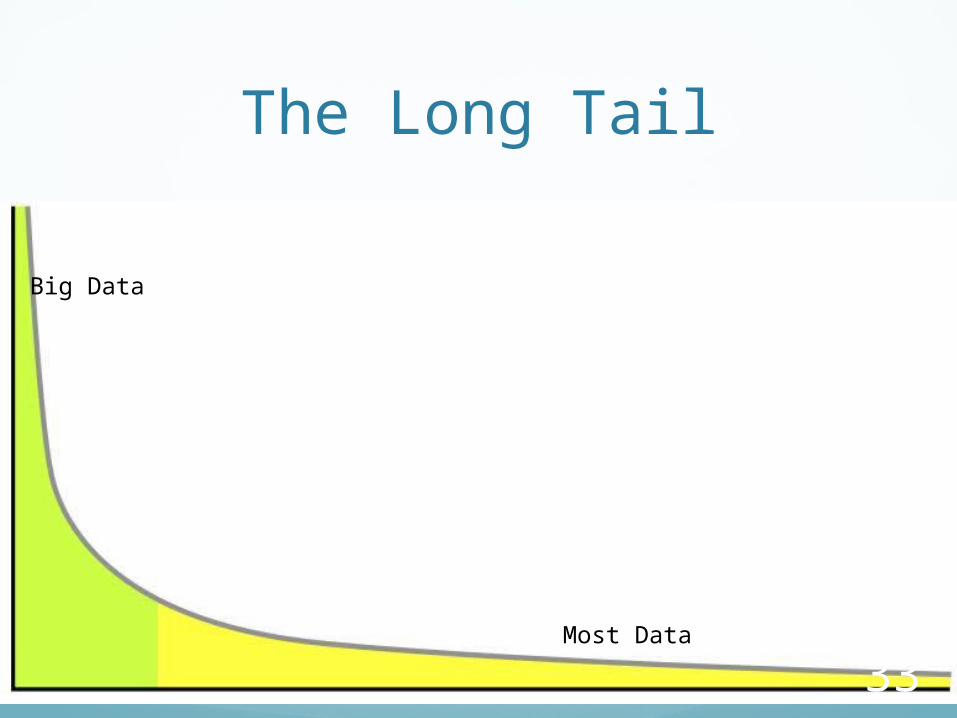
small.There is also the so-called “Long Tail” of data.
33
The Long Tail
Big Data
Most Data
34
Challenges of Big DataBig Data does present some unique challenges.
Searching for average patterns may be better served by sampling
Searching rare events might require big dataBig haystacks (may) contain more needles.
The Long Tail data presents a challenge for integration across data sets.The DataBridge Projecthttp://databridge.web.unc.edu/

35
Does Big = Good?Lost in most discussions of Big Data is whether it
is representative data or not.We can mine Twitter, but who tweets?We can mine health records, who whose records
do we have?We can track online purchasing, but what about
off-line market behavior?
Survey research has spent decades worrying about representativeness, weighting, etc., but I do not see it discussed nearly as much in data science.

36
Theory, Methods, and Big Data
The greatest need for theory and the greatest challenges for computationally intensive methods arise:When data is too small – there is not enough
information in the data by itself.When data is too big – the computational costs
become too highThere is a “just right” that allows for complex
models and computationally demanding methods to be used so that theoretical assumptions can be relaxed.
37
Data Science and Elections
The Obama campaigns in 2008 and 2012 are credited for their successful use of social media and data mining.
Micro-targeting in 2012 http://www.theatlantic.com/politics/archive/2012/04/the-creepines
s-factor-how-obama-and-romney-are-getting-to-know-you/255499/
http://www.mediabizbloggers.com/group-m/How-Data-and-Micro-Targeting-Won-the-2012-Election-for-Obama---Antony-Young-Mindshare-North-America.html
Micro-profiles built from multiple sources accessed by aps, real-time updating data based on door-to-door visits, focused media buys, e-mails and Facebook messages highly targeted.
1 million people installed the Obama Facebook app that gave access to info on “friends”.

38
http://www.theatlantic.com/politics/archive/2012/04/the-creepiness-factor-how-obama-and-romney-are-getting-to-know-you/255499/

39
Big Data and Politics: Something Old, Something New . . .
The massive data collection and micro-targeting regarding voters that defined 2012 is both:New – that amount and diversity of data mobilized
for near real time updating and analysis was unprecedented.
Old – it is a reversion to retail, door-to-door, personalized politics.
“All Politics is Local” – Tip O’Neill.
40
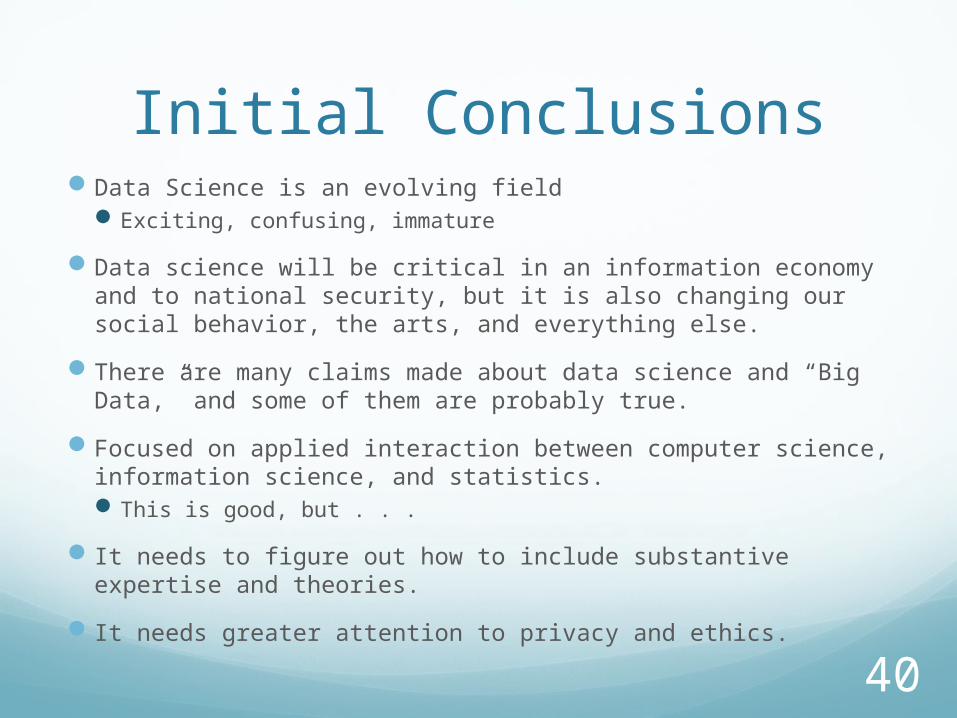
Initial Conclusions Data Science is an evolving field
Exciting, confusing, immature
Data science will be critical in an information economy and to national security, but it is also changing our social behavior, the arts, and everything else.
There are many claims made about data science and “Big Data,” and some of them are probably true.
Focused on applied interaction between computer science, information science, and statistics. This is good, but . . .
It needs to figure out how to include substantive expertise and theories.
It needs greater attention to privacy and ethics.
41
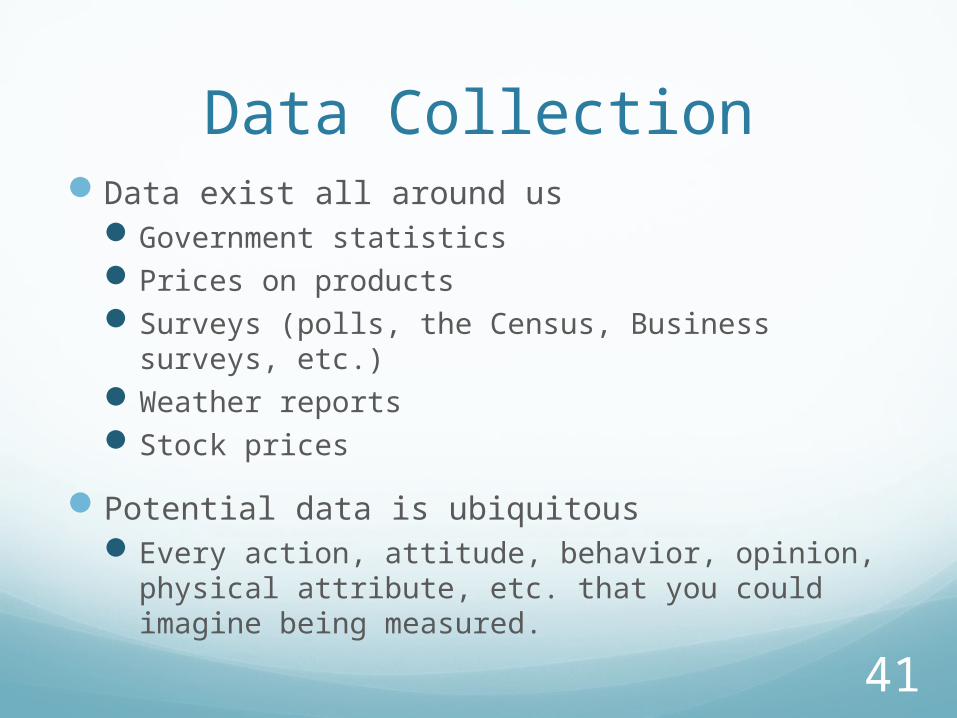
Data CollectionData exist all around us
Government statisticsPrices on productsSurveys (polls, the Census, Business surveys, etc.)Weather reportsStock prices
Potential data is ubiquitousEvery action, attitude, behavior, opinion, physical
attribute, etc. that you could imagine being measured.
42
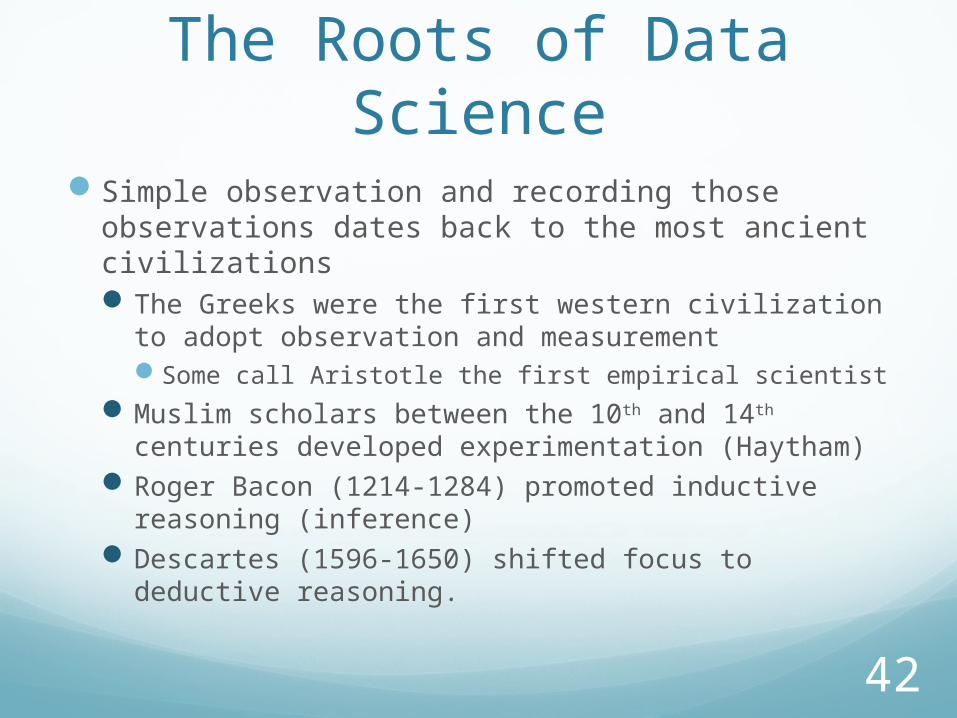
The Roots of Data ScienceSimple observation and recording those
observations dates back to the most ancient civilizationsThe Greeks were the first western civilization to
adopt observation and measurement Some call Aristotle the first empirical scientist
Muslim scholars between the 10th and 14th centuries developed experimentation (Haytham)
Roger Bacon (1214-1284) promoted inductive reasoning (inference)
Descartes (1596-1650) shifted focus to deductive reasoning.
43
Methods of Data Collection
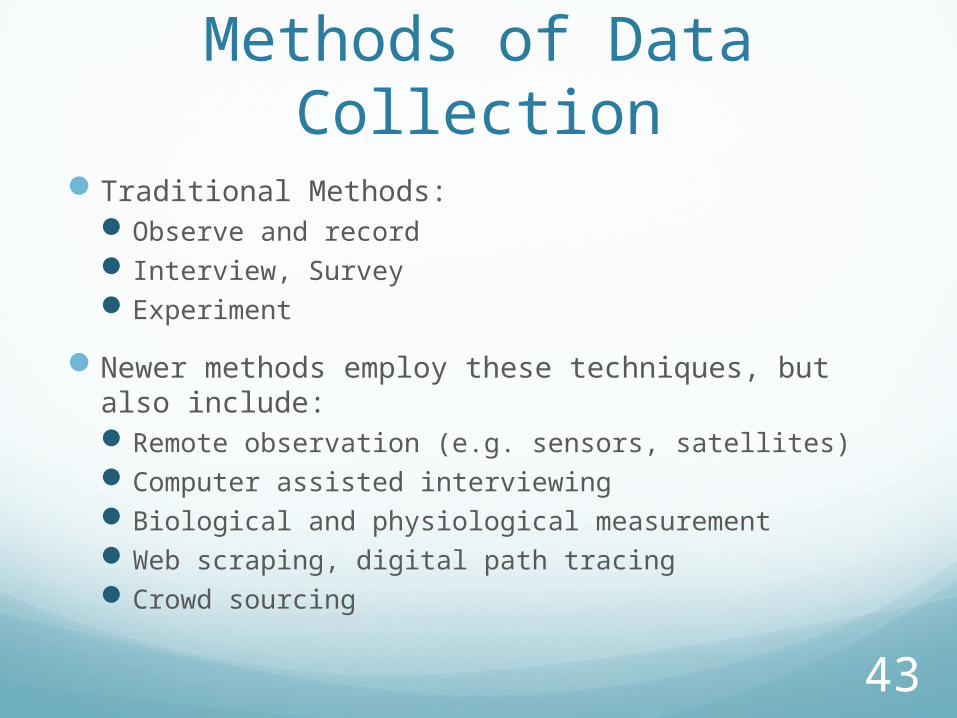
Traditional Methods: Observe and record Interview, Survey Experiment
Newer methods employ these techniques, but also include: Remote observation (e.g. sensors, satellites) Computer assisted interviewing Biological and physiological measurement Web scraping, digital path tracing Crowd sourcing
44
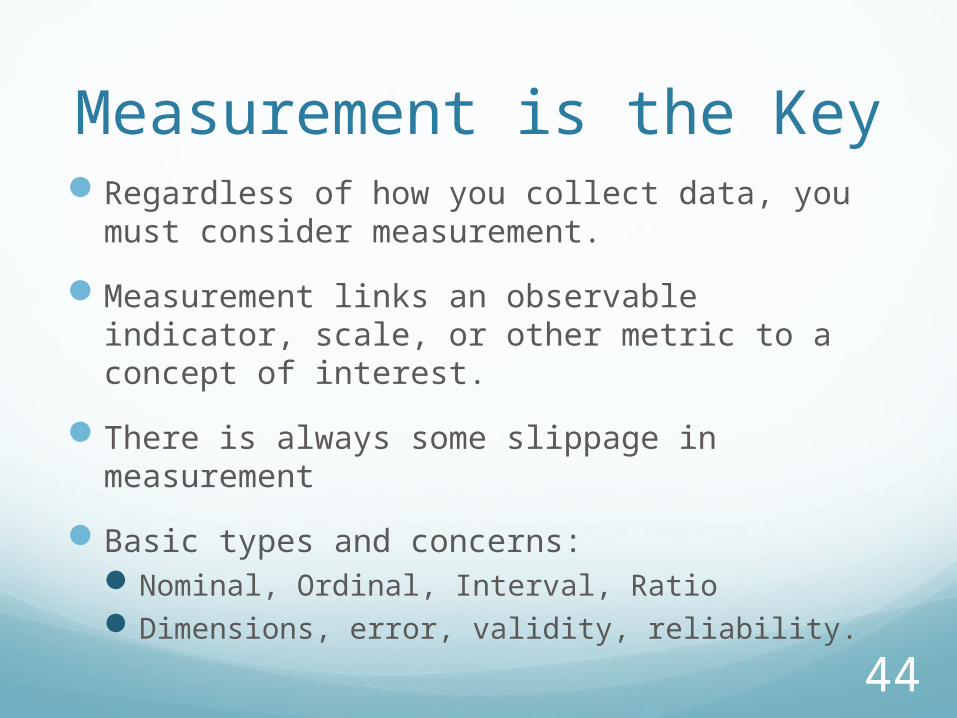
Measurement is the KeyRegardless of how you collect data, you must
consider measurement.
Measurement links an observable indicator, scale, or other metric to a concept of interest.
There is always some slippage in measurement
Basic types and concerns:Nominal, Ordinal, Interval, RatioDimensions, error, validity, reliability.
45
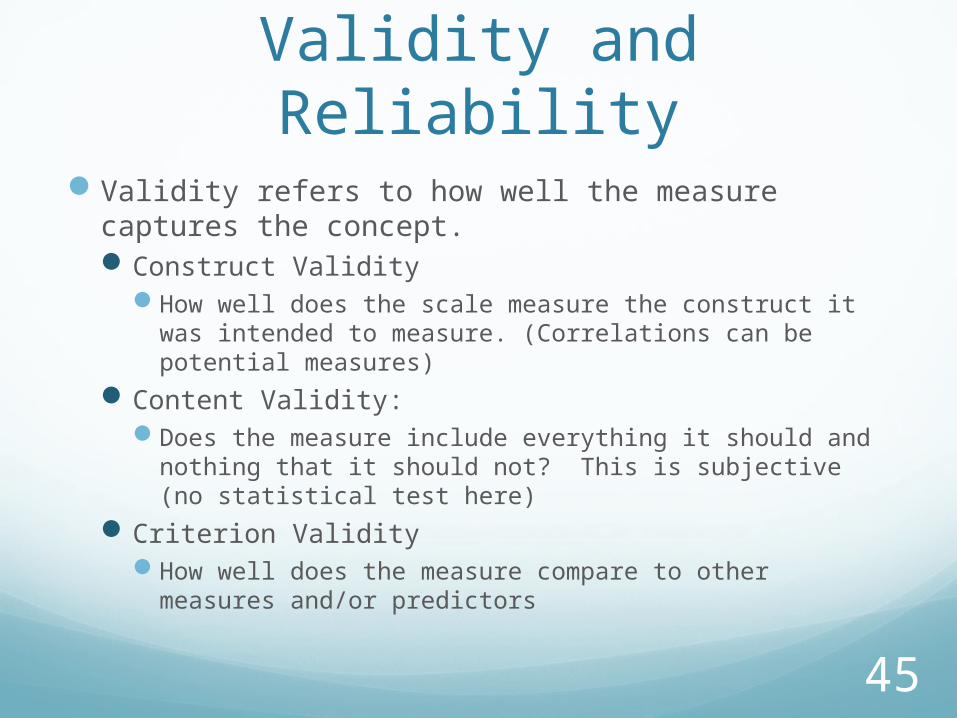
Validity and ReliabilityValidity refers to how well the measure captures the
concept.Construct Validity
How well does the scale measure the construct it was intended to measure. (Correlations can be potential measures)
Content Validity: Does the measure include everything it should and
nothing that it should not? This is subjective (no statistical test here)
Criterion ValidityHow well does the measure compare to other measures
and/or predictors

46
ReliabilityReliability revers to whether a measure is
consistent and stable.Can the measure be confirmed by further
measurement or observations? If you measure the same thing with the same
measurement tool, would you get the same score?
47
Why Measurement Matters
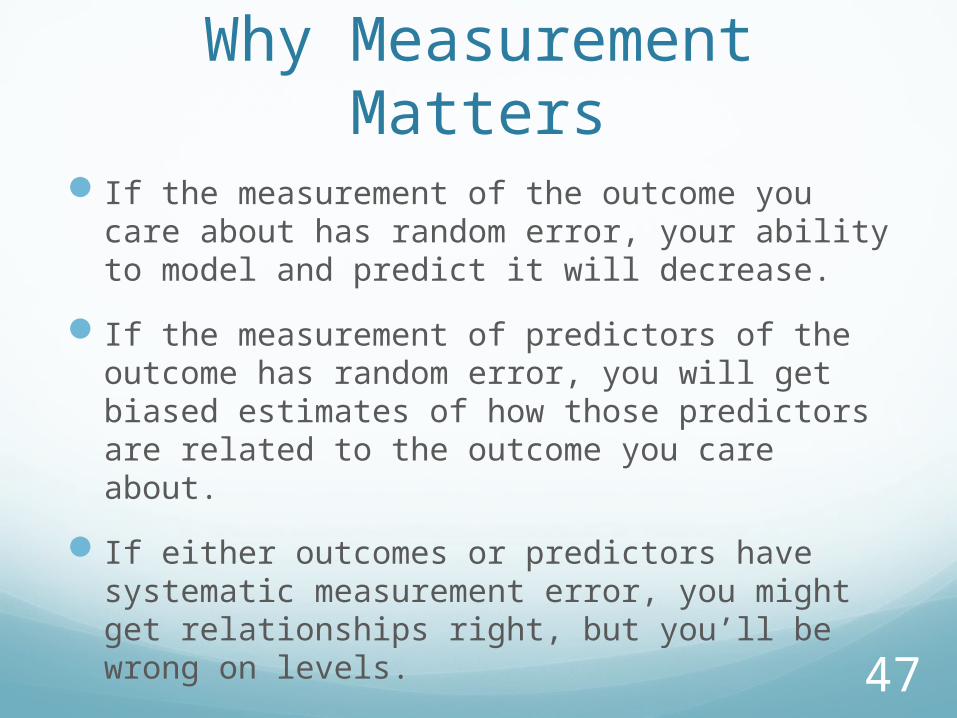
If the measurement of the outcome you care about has random error, your ability to model and predict it will decrease.
If the measurement of predictors of the outcome has random error, you will get biased estimates of how those predictors are related to the outcome you care about.
If either outcomes or predictors have systematic measurement error, you might get relationships right, but you’ll be wrong on levels.
48
Storing Collected DataOnce you collect data, you need to store it.
Flat “spreadsheet” like files
Relational data bases
Audio, Video, Text?
Numeric or non-Numeric?
Plan for adding more observations, more variables, or merging with other data sources
49
Data AnalysisWe analyze data to extract meaning from it.
Virtually all data analysis focuses on data reduction
Data reduction comes in the form of:Descriptive statisticsMeasures of associationGraphical visualizations
The objective is to abstract from all of the data some feature or set of features that captures evidence of the process you are studying

50
Why Data Reduction?Data reduction lets us see critical features or
patterns in the data.
Which features are important depends on the question we are askingRoad maps, topographical maps, precinct maps,
etc.
Much of data reduction in data science falls under the heading of statistics
51
Some DefinitionsData is what we observe and measure in the
world around us
Statistics are calculations we produce that provide a quantitative summary of some attribute of data.
Cases/Observations are the objects n the world for which we have data.
Variables are the attributes of cases (or other features related to the cases) for which we have data.
52
Quantitative vs. Qualitative
Much of the “tension” between these two approaches is misguided.
Both are Data
Both are or can be:EmpiricalScientificSystematicWrongLimited
53
Qual and Quant (cont.)It is not as simple as Quant=numbers
and Qual=words.Much of quantitative data is merely
categorization of underlying conceptsCountries are labeled “Democratic” or notKids are labeled “Gifted” or notCouples are labeled “Committed” or “In Love” or notBaseball players commit “Errors” or notDifferent types of chocolate are “Good” or not
Increasing quantitative analysis of text
54
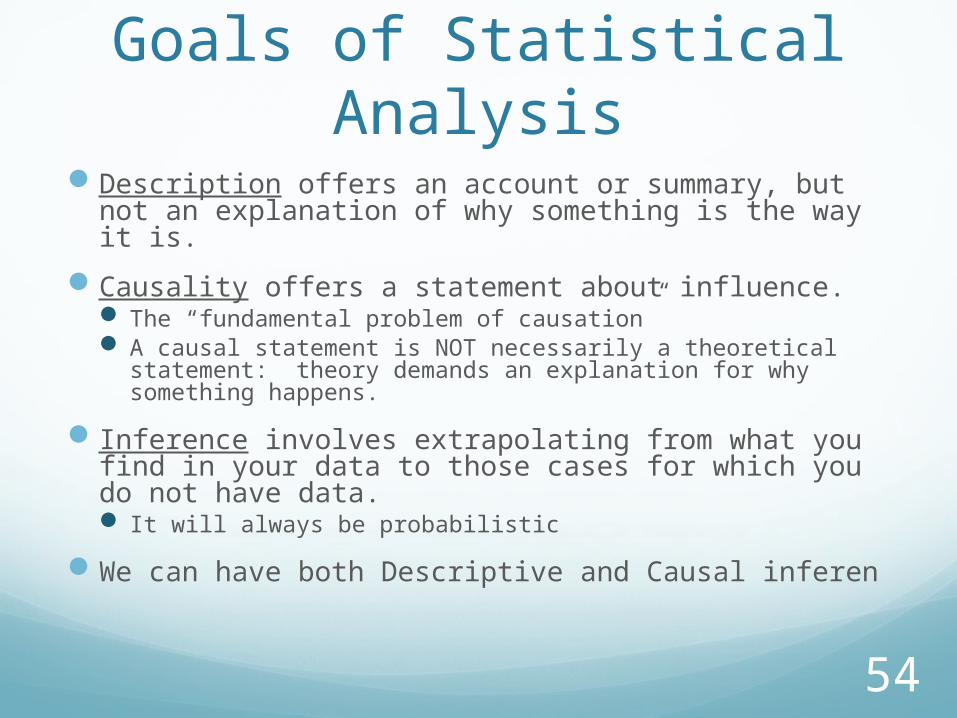
Goals of Statistical Analysis
Description offers an account or summary, but not an explanation of why something is the way it is.
Causality offers a statement about influence. The “fundamental problem of causation” A causal statement is NOT necessarily a theoretical
statement: theory demands an explanation for why something happens.
Inference involves extrapolating from what you find in your data to those cases for which you do not have data. It will always be probabilistic
We can have both Descriptive and Causal inferen
55
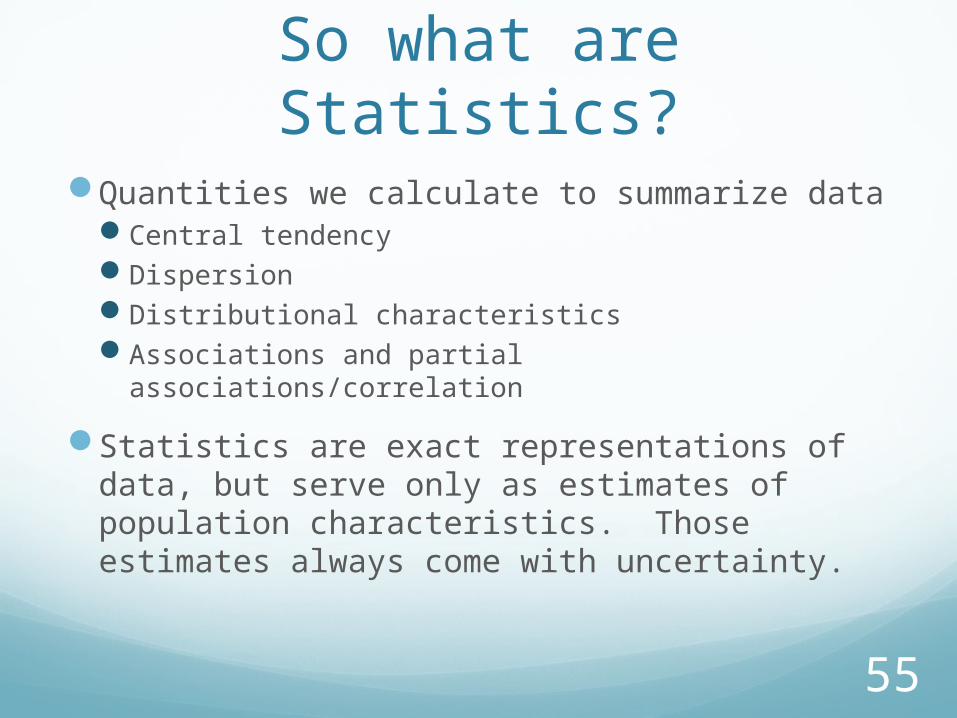
So what are Statistics?Quantities we calculate to summarize data
Central tendencyDispersionDistributional characteristicsAssociations and partial associations/correlation
Statistics are exact representations of data, but serve only as estimates of population characteristics. Those estimates always come with uncertainty.
56
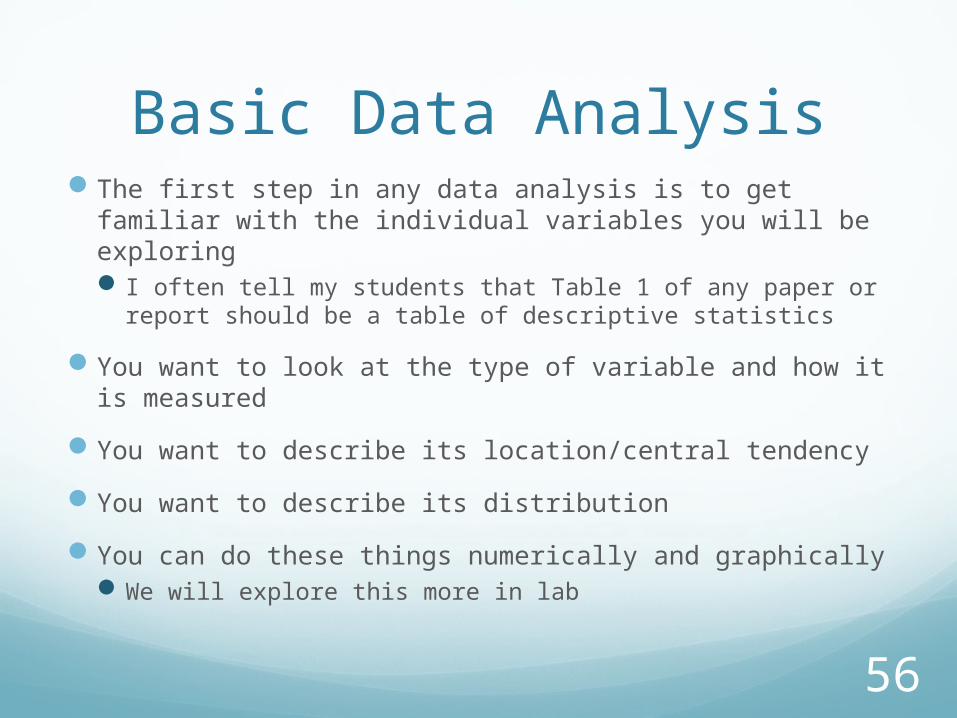
Basic Data AnalysisThe first step in any data analysis is to get familiar
with the individual variables you will be exploring I often tell my students that Table 1 of any paper or
report should be a table of descriptive statistics
You want to look at the type of variable and how it is measured
You want to describe its location/central tendency
You want to describe its distribution
You can do these things numerically and graphically We will explore this more in lab

57
Issues to ConsiderIs the variable uni-modal or not?
Is the distribution symmetric or skewed?Are there extreme values?
It the variable bound at one or both ends by construction?
Do observed values “make sense?”
How many observations are there?
Are any transformations appropriate?

58
Two More ProblemsDo you have missing data? Missing at random or
not? You can:
Ignore it Interpolate it Impute it (multiple imputation)
Is “treatment” randomly assigned You can:
Ignore itDesign an experiment“Control” it statistically“Control” it through matching (and the statistically).
59
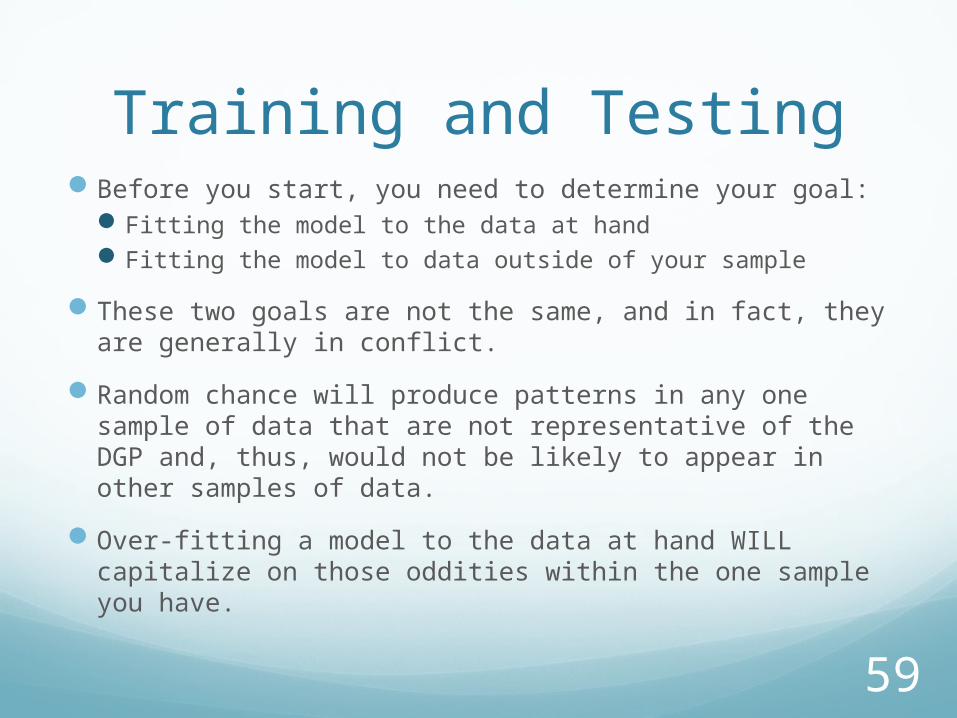
Training and TestingBefore you start, you need to determine your goal:
Fitting the model to the data at hand Fitting the model to data outside of your sample
These two goals are not the same, and in fact, they are generally in conflict.
Random chance will produce patterns in any one sample of data that are not representative of the DGP and, thus, would not be likely to appear in other samples of data.
Over-fitting a model to the data at hand WILL capitalize on those oddities within the one sample you have.
60
The Netflix ContestIn 2009, Netflix awarded a $1 million prize to
anyone who could come up with a better movie recommending model.Provided contestants (in 2006) with about:
100 million ratings from 480,000 customers of 18,000 movies.
Winners would be determined by which model best predicted 2.8 million ratings that they were NOT given (a bit more complex than this)
Why? To avoid over-fitting.
61
The Netflix Contest:The Sequel
There was to be a second contest, but it was stopped in part due to a lawsuit.
Though Netflix de-identified its data, researchers at Texas were able to match the data to other online moving ratings and were able to identify many individuals.

62
Training and Testing DataWe have two primary tools we can use to avoid
over-fitting:Having a theory to guide our researchSeparating our data into Training and Testing
subsetsThis can be done at the outset, as we will seeThis can also be done on a rolling basis through
processes like K-fold cross-validation and Leave-one-out cross-validation.

63
Modeling DataOnce you are familiar with your data, you need
to determine the question you want to ask.
The Question you want to ask will help determine the method you will use to answer it.
64
Types of Modeling Problems
Supervised Learning: You have some data where the outcome of interest is already known. Methods focus on recovering that outcome and prediction to new outcomes Classification Problems Scoring Problems (regression-based models)
Unsupervised learning: No outcome (yet) to model Clustering (of cases – types of customers) Association Rules (clusters of actions by cases – groups of
products purchased together) Nearest Neighbor Methods (actions by cases based on
similar cases – you might buy what others who are similar to you bought)
65
Evaluating Model Performance
You need a standard for comparison. There are several: Null Model:
Mean/ModeRandom
Bayes Rate Model (or saturated model):Best possible model given data at hand
The Null and Saturated models set lower and upper bounds Single Variable Model
More parsimonious that models relying on multiple variables.
66
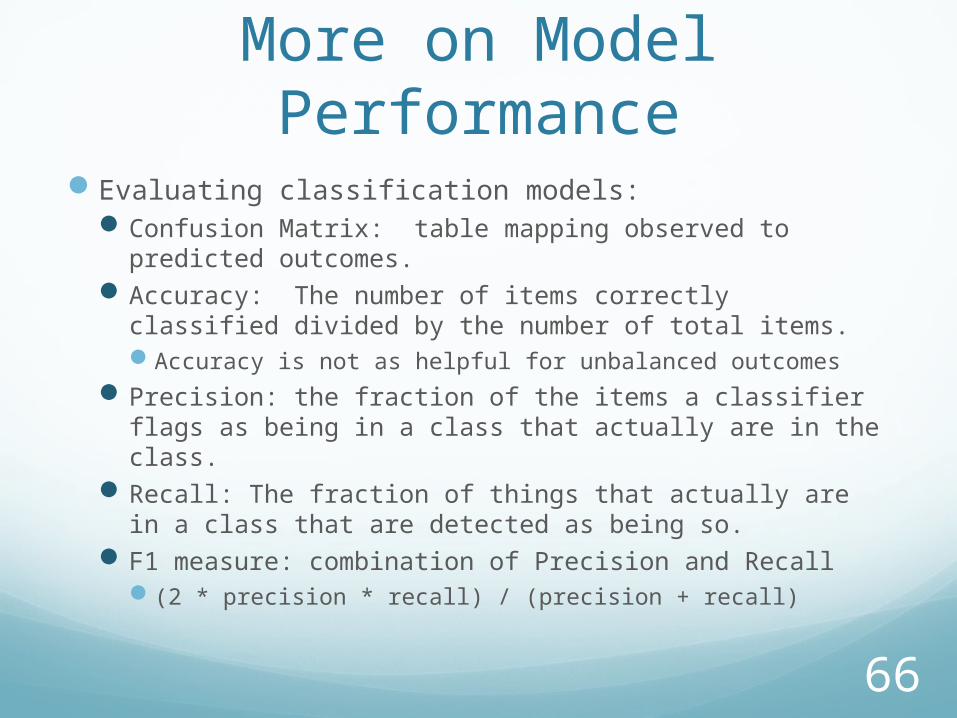
More on Model Performance
Evaluating classification models:Confusion Matrix: table mapping observed to
predicted outcomes.Accuracy: The number of items correctly classified
divided by the number of total items.Accuracy is not as helpful for unbalanced outcomes
Precision: the fraction of the items a classifier flags as being in a class that actually are in the class.
Recall: The fraction of things that actually are in a class that are detected as being so.
F1 measure: combination of Precision and Recall(2 * precision * recall) / (precision + recall)
67
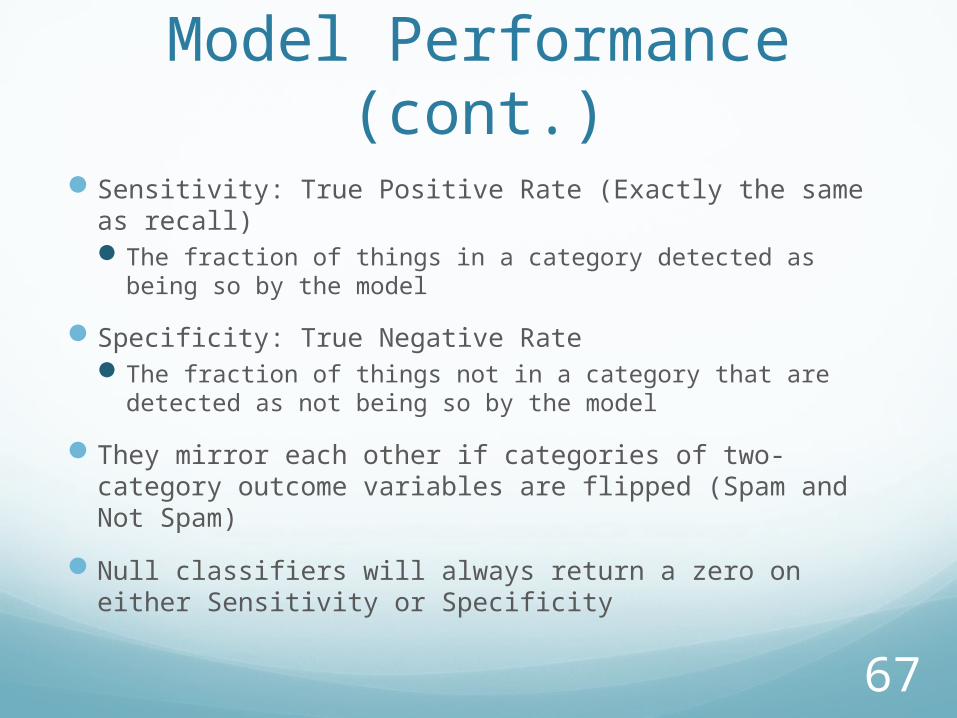
Model Performance (cont.)Sensitivity: True Positive Rate (Exactly the same as
recall) The fraction of things in a category detected as being so
by the model
Specificity: True Negative Rate The fraction of things not in a category that are
detected as not being so by the model
They mirror each other if categories of two-category outcome variables are flipped (Spam and Not Spam)
Null classifiers will always return a zero on either Sensitivity or Specificity
68
Evaluating Scoring Methods
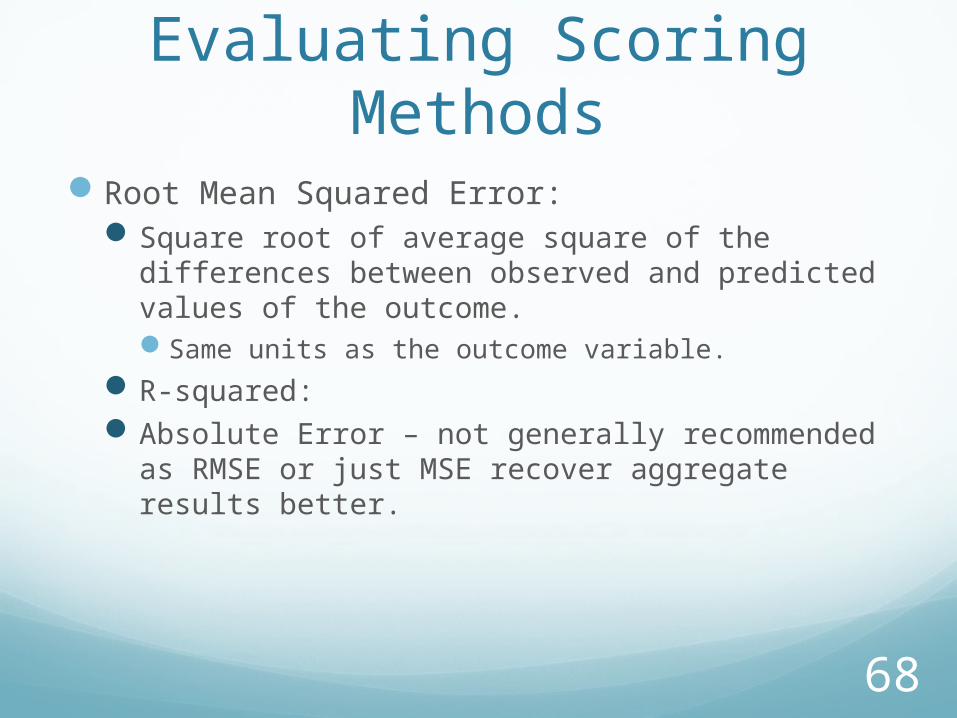
Root Mean Squared Error:Square root of average square of the differences
between observed and predicted values of the outcome.Same units as the outcome variable.
R-squared:Absolute Error – not generally recommended as
RMSE or just MSE recover aggregate results better.
69
Evaluating Probability Model Fit
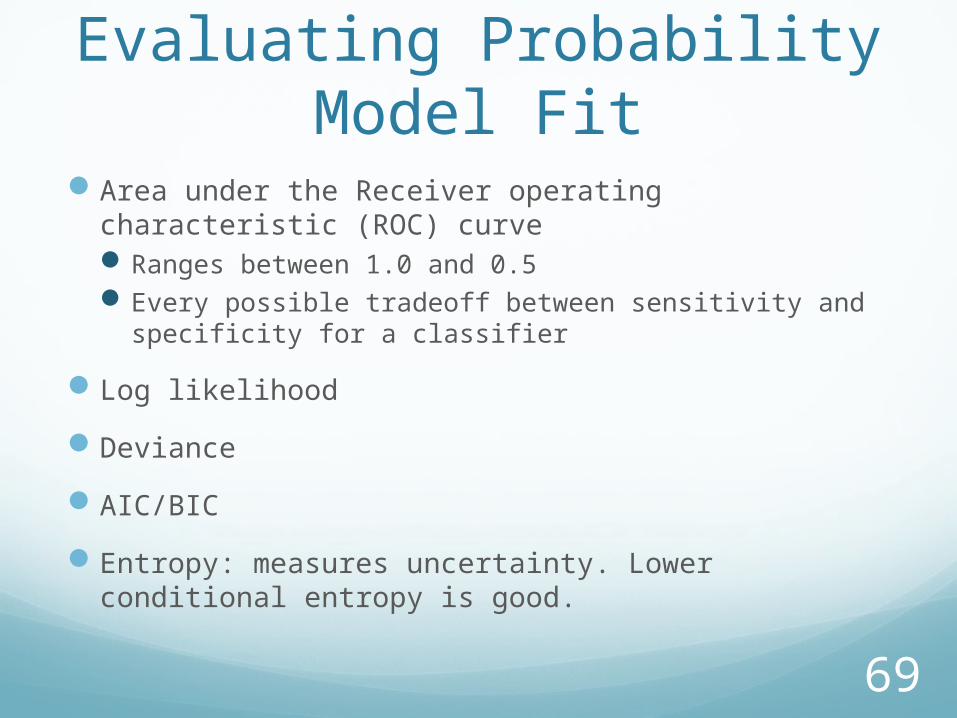
Area under the Receiver operating characteristic (ROC) curve Ranges between 1.0 and 0.5 Every possible tradeoff between sensitivity and
specificity for a classifier
Log likelihood
Deviance
AIC/BIC
Entropy: measures uncertainty. Lower conditional entropy is good.
70
Evaluating Cluster ModelsAvoiding:
“Hair” clusters – those with very few data points“Waste” clusters – those with a large proportion of
data points
Intra-cluster distance vs. cross-cluster distance.
Generate cluster labels and then use classifier methods to re-evaluate fitDon’t use the outcome variable of interest in the
clustering process (Spam vs. Not-spam)
71
Model Performance Final Thoughts
The worst possible outcome is NOT failing to find a a good model.
The worst possible outcome is thinking you have a good model when you really don’t.
Besides over-fitting and all of the other problems we’ve mentioned, another problem is endogeneity:A situation where the outcome variable is actually
a (partial) cause of one of your independent variables.
72
Memorization MethodsMethods that return the majority category or
average value for the outcome variable for a subset of the training data.
We’ll focus on classifier models.
73
Single Variable ModelsTables
Pivot tables or contingency tables: just a cross-tabulation between the outcome and a single (categorical) predictor.
The goal is to see how well the predictor does at predicting categories of the outcome
74
Multi-variable modelsMost of the time we still mean a single outcome
variable, but using two or more independent variables to predict it.
Often called multivariate models, but this is wrong.Multivariate really means more than one outcome
(or dependent) variable, which generally means more than one statistical equation.
A key question is how to pick the variables to include.
75
Picking Independent Variables
Pick based on theory – always the best starting point
Pick based on availability – “the art of what is possible”
Pick based on performanceEstablish some thresholdConsider basing this on “calibration” data set
Not training data – over-fittingNot testing data – you must leave that alone for
model evaluation, not model building.
76
Decision TreesDecision trees make predictions that are
piecewise constant.
The data is divided based on classes of the independent variables with the goal of predicting values of the outcome variable.
Multiple or all possible trees are considered
Partitioning ends – you hit leaves – when either all outcomes on the branch are identical or when further splitting does not improve prediction

77
A tree showing survival of passengers on the Titanic ("sibsp" is the number of spouses or siblings aboard). The figures under the leaves show the probability of survival and the percentage of observations in the leaf.
78
Nearest Neighbor MethodsFinds K training observations that are nearest to the
observation then uses the average of their outcomes as the prediction for the observation in question.
Nearest can be defined multiple ways, but many rest on Euclidean distance so it is best to use independent variables that are continuous, nonduplicative and orthogonal to each other.
When outcomes are unbalanced, use a larger value for K, such as large enough to have a good chance of observing 10 rare outcomes. K ≈ 10/prob(rare)
79
Naïve BayesConsiders how each variable is related to the
outcome and then makes predictions by multiplying together the effects of each variable.
Similar to constructing a series of single variable models.
Assumes that the independent variables are independent of each other.
Often outperformed by logit or Support Vector Machines.
80
Regression ModelsRegression models predict a feature of a dependent or
outcome variable as a function of one or more independent or predictor variables.
Independent variables are connected to the outcome by coefficients/parameters.
Regression models focus on estimating those parameters and associated measures of uncertainty about them.
Parameters combine with independent variables to generate predictions for the dependent variable.
Model performance is based in part on those predictions.

81
Flavors of RegressionThere are multiple flavors of regression, but
most fit under these headings:Linear ModelGeneralized Linear ModelsNonlinear Model
82
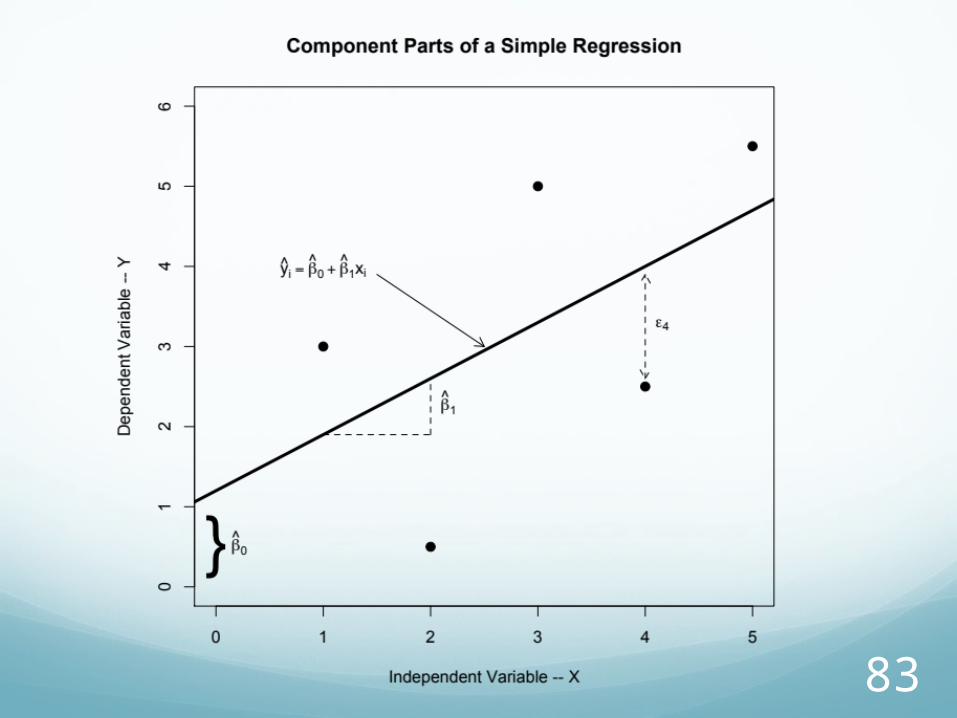
Linear RegressionThe most common model is the linear regression
model.
It is often what people mean when they just say “regression.”
It is by far most frequently estimated via Ordinary Least Squares, or OLS. Minimizes the sum of the squared errors.
Models the expected mean of Y given values of X and parameters that are estimated from the data.
Yi = β0 + β1(Xi) + εi
83
84
Assumptions of OLSModel Correctly Specified
No measurement error
Observations on Yi, conditional on the model, are Independently and Identically Distributed (iid)
For hypothesis testing – the error term is normally distributed.
We don’t have time to review all of this now, but if questions come up, please ask.
85
PredictionParameter estimates capture the average
expected change in Y for a one-unit change in X, controlling for the effects of other X’s in the model.
Once you have parameter estimates, you can combine them with the training data (the data used to estimate them) or any other data with the same independent variables, and generate predicted values for the outcome variable.
Model performance is often based on the closeness of those predictions.

86
Linear Regression Widely use, simple, and robust.
Not as good if you have a large number of independent variables or independent variables that consist of many unordered categories.
Good at prediction when independent variables are correlated, but attribution of unique effects is less certain.
Multiple assumptions to check. Linearity being the most central to correct model
specification.
Can be influenced by outliers Median Regression is an alternative.
87
Logistic RegressionLogistic regression, or logit, is at the heart of
many classifier algorithms
It is similar to linear regression in that the right hand side of the model is an additive function of independent variables multiplied by (estimated) parameters.
However, that linear predictor is then transformed to a probability bounded by 0 and 1 that is used to predict which of two categories (0 or 1) the dependent variable falls into.
88
Logistic RegressionThe logit model is one of a class of models that
fall under the heading of Generalized Linear Models (GLMs).
Parameters are nearly always estimated via Maximum Likelihood EstimationOLS is a special case of MLE
Parameters that minimize the sum of squared errors also maximize the likelihood function.
MLE is an approximation method and you can have problems with convergence.
89
Logit (cont.)Much of what makes OLS good or bad for modeling a
continuous outcome makes logit good or bad for modeling a dichotomous outcome.
You cannot directly interpret the coefficients from a logit model. The number e raised to the value of the parameter
gives the factor change in the odds More common to compute changes in predicted
probabilities.Note that these are nonlinear.
You can have non-convergence from separationPredictions that are too good/perfect