introduction to design olav m. kvalheim. content making your data work twice effect of correlation...
TRANSCRIPT

Introduction to design
Olav M. Kvalheim
Content• Making your data work twice• Effect of correlation on data interpretation• Effect of interaction on data interpretation
Chemometrics/Infometrics
Design of information-rich experiments and use of
multivariate methods for extraction of maximum relevant information
from data

Making your data work twice

What is Information?
A
B
C
•A - mean value, no standard deviation given
•B - mean value with standard deviation given, large value of stand. dev.
•C - mean value, low standard deviation

A B
Hotelling (1944) Ann. Math. Statistics 15, 297-306
Measurement strategy?
Unknowns Calibration Weights
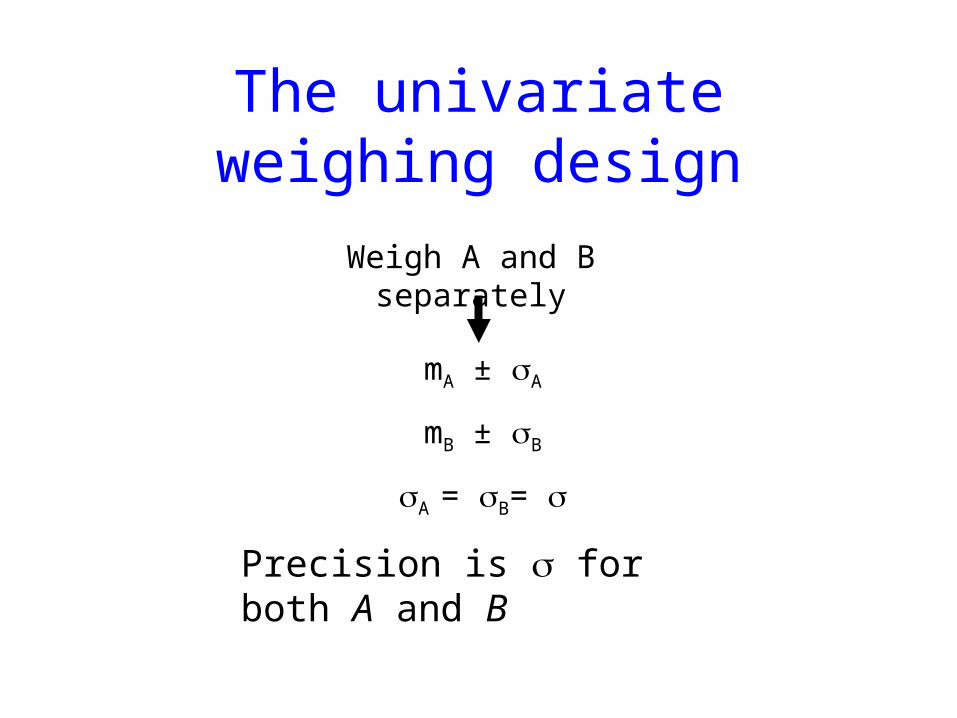
The univariate weighing design
Weigh A and B separately
mA ± A
mB ± B
A = B=
Precision is for both A and B

The multivariate design
Weigh A and B jointly to determine sum and difference:
mA+ mB =S
mA- mB =D
mA = ½S + ½D
mB = ½S - ½D
7.02
1
4
1
4
1 22 BA
Precision is 0.7 for both A and B
Precision for S
Precision for D

Precision in mAand mB
Univariate Design Bivariate Design 0.7
Precision is improved by 30% by using a multivariate design with the same number of measurementsas for the univariate!
Univariate vs Bivariate strategy

With N masses to weigh, a multivariate design provides an estimate of each mass with a precision
N
1
The larger the number of unknowns, the larger the gain in precision using a multivariate weighing design.
Univariate vs Multivariate weighing

Effect of correlation on data interpretation
X1 X2

Example
• Process output is function of temperature and amount of catalyst

Correlation between amount of catalyst and amount produced
• Strong positive correspondence
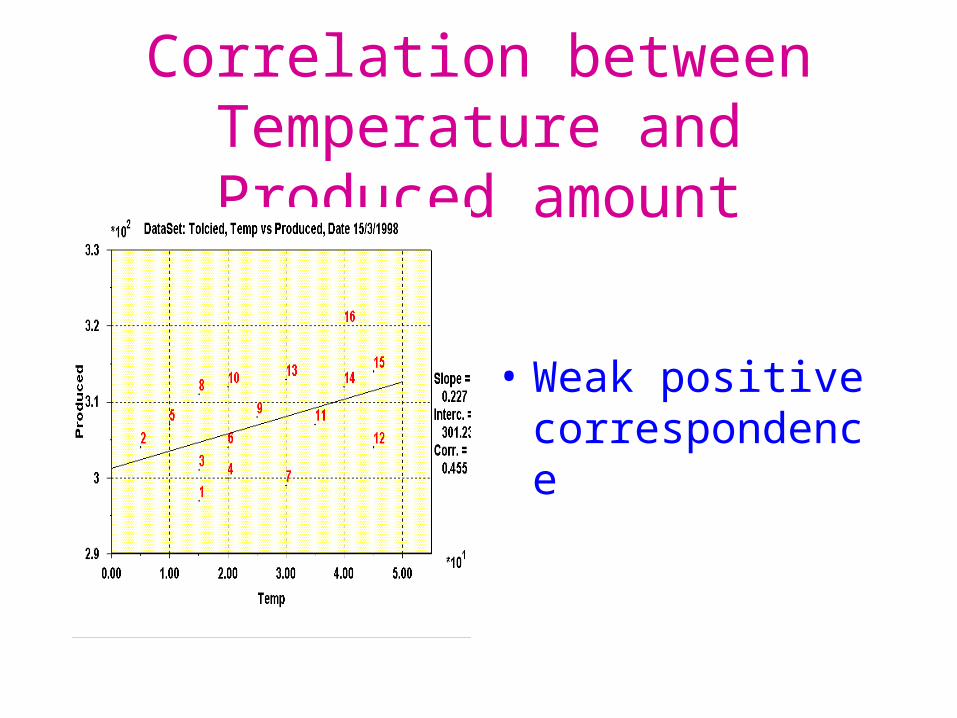
Correlation between Temperature and Produced amount
• Weak positive correspondence

Conclusion from correlation analysis
• Increase amount of catalyst and temperature to increase production

Result of test
• Produced amount was lowered!

Bivariate Regression Model
• Produced amount = 300
• + 2.0 * Catalyst
• - 0.5 * Temperature

Correlation between temperature and amount of catalyst
• Strong positive correspondence

Solution to correlation problem
• Multivariate Design - Change many process variables simultaneously according to experimental designs

Effect of interaction on data interpretation
X1X2
The yield of a chemical reaction is a function of temperature (t) and concentration (c).
y = f (t,c)
The task
Optimise the yield for the reaction!

Concentration, M
Temperature, ºC
0.1 0.2
140
160
150
170 756070 50 4045
Response surface in the presence of interaction

Univariatedesign(COST)
Multivariatedesign
Information
Number of experiments
Efficiency of information extraction

Multivariate Designvs.
Univariate Design
• Correct Models Possible (Interactions)
• Efficient Experimentation
• Improved Precision/Information quality