introduction to gamma-ray transmission...
TRANSCRIPT
Progress in Process Tomography and Instrumentation System: Series 2 115
9
INTRODUCTION TO GAMMA-RAY TRANSMISSION TOMOGRAPHY
Ruzairi Abdul Rahim
Yvette Shaan-Li Susiapan Rasif Mohd. Zain
9.1 INTRODUCTION
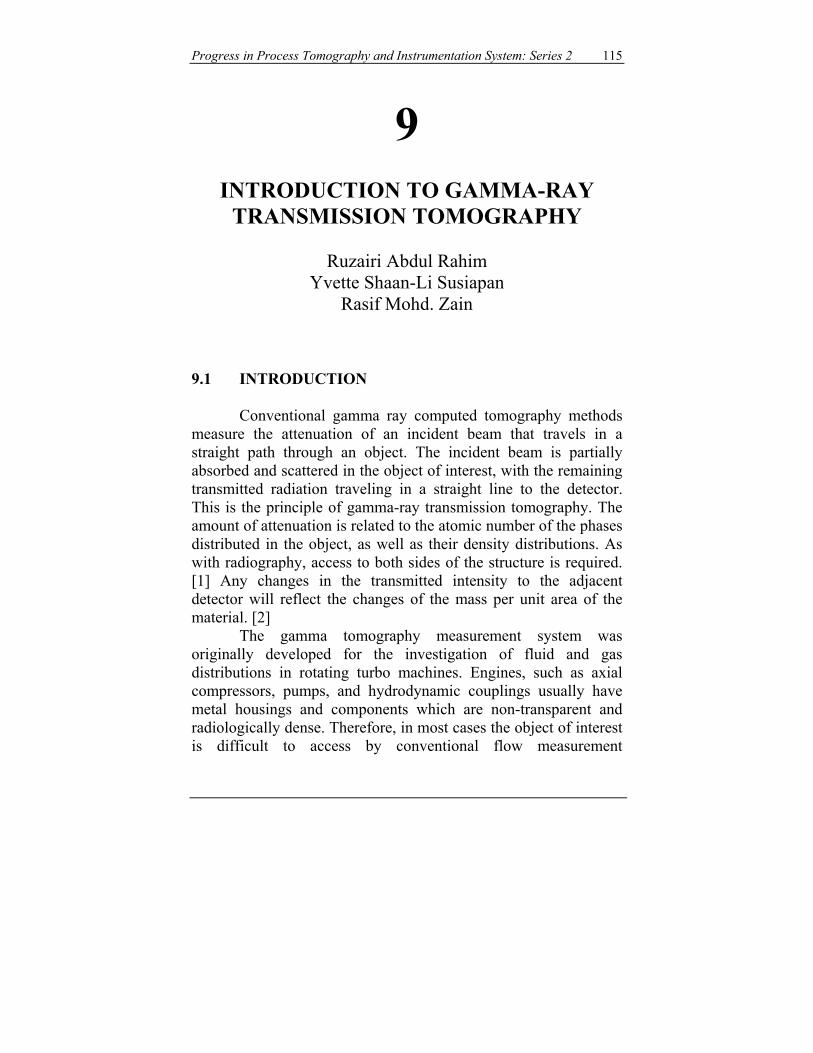
Conventional gamma ray computed tomography methods measure the attenuation of an incident beam that travels in a straight path through an object. The incident beam is partially absorbed and scattered in the object of interest, with the remaining transmitted radiation traveling in a straight line to the detector. This is the principle of gamma-ray transmission tomography. The amount of attenuation is related to the atomic number of the phases distributed in the object, as well as their density distributions. As with radiography, access to both sides of the structure is required. [1] Any changes in the transmitted intensity to the adjacent detector will reflect the changes of the mass per unit area of the material. [2]
The gamma tomography measurement system was originally developed for the investigation of fluid and gas distributions in rotating turbo machines. Engines, such as axial compressors, pumps, and hydrodynamic couplings usually have metal housings and components which are non-transparent and radiologically dense. Therefore, in most cases the object of interest is difficult to access by conventional flow measurement
116 Introduction to Gamma-Ray Transmission Tomography
techniques. Gamma densitometry, radiography, and tomography are suitable and often the only applicable measurement techniques for such constructions.
Figure 9.1 System topology 9.2 SPECIFIC APPLICATION OF GAMMA-RAY TOMOGRAPHY: INVESTIGATION OF CORROSION UNDER INSULATION 9.2.1 Corrosion under insulation (CUI)
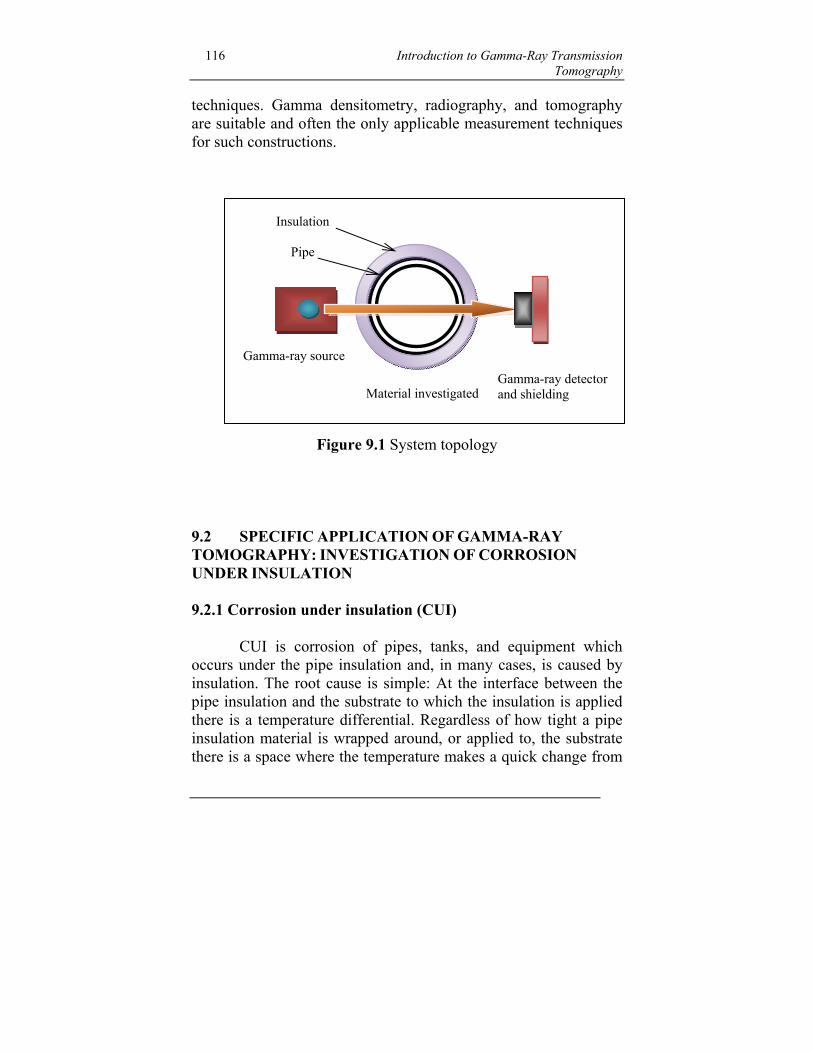
CUI is corrosion of pipes, tanks, and equipment which occurs under the pipe insulation and, in many cases, is caused by insulation. The root cause is simple: At the interface between the pipe insulation and the substrate to which the insulation is applied there is a temperature differential. Regardless of how tight a pipe insulation material is wrapped around, or applied to, the substrate there is a space where the temperature makes a quick change from
Gamma-ray source
Gamma-ray detector and shielding Material investigated
Insulation
Pipe
Progress in Process Tomography and Instrumentation System: Series 2 117
higher to lower and that causes a release of moisture, commonly referred to as condensation, and that causes rust and corrosion.
Within industries that use industrial insulation, there are many integrity and safety challenges and one of the more serious issues is CUI. Over time pipes may corrode while set inside the insulation, the pipes are shielded from the naked eye and so often go unnoticed. The pipes often carry high-pressure gas, oil, hydrocarbon and many other highly dangerous chemicals that are used in the processes of Petrochemicals manufacturing. Corrosion causes pipe deterioration, leading to damage resulting in leakages. These leakages often cause fires, massive explosions and fatalities.
There are several ways in which CUI is monitored in the industries nowadays. Of the numerous methods used, a method known as Visual Search is the most favored simply because it is the most reliable and the only guaranteed method to detect CUI. Using this method, pipelines are physically stripped of their insulation, inspected visually, replaced where necessary and the insulation refitted. This is a huge resource drain in terms of time, money and man-hours. 9.2.2 Gamma-ray Tomography System
An appropriate pipe corrosion monitoring system would reduce the number of pipes being stripped unnecessarily and number of pipe failures and plant shut-downs. This is turn will have very positive economic effects. A method which employs gamma-ray tomography has the potential to be used to perform inspection without the need of costly removal of insulation material during operation of the plant. Furthermore, it offers an additional advantage of being capable to perform measurement in high temperature environments. It is a non-destructive and contact-less procedure, therefore, can be used for pipes at, essentially, any temperature.

118 Introduction to Gamma-Ray Transmission Tomography
9.3 SYSTEM DESCRIPTION In order to construct a tomogram that is reliable enough to detect minute corrosion or erosion, enough data or projection sets must be taken. The Gamma-ray tomography system is divided into three main parts: 1) Mechanical structure 2) Communication for data transfer 3) Computer for data logging and image reconstruction
Figure .1 Gamma-ray Tomography System
Sets of projection data in the form of intensity counts is sent over a wireless network to the computer which logs it for further processing. After obtaining data sets for all projection angles needed, this computer will then produce a tomogram of the slice
Progress in Process Tomography and Instrumentation System: Series 2 119
using a suitable reconstruction algorithm. Tomogram construction is done in offline-mode.
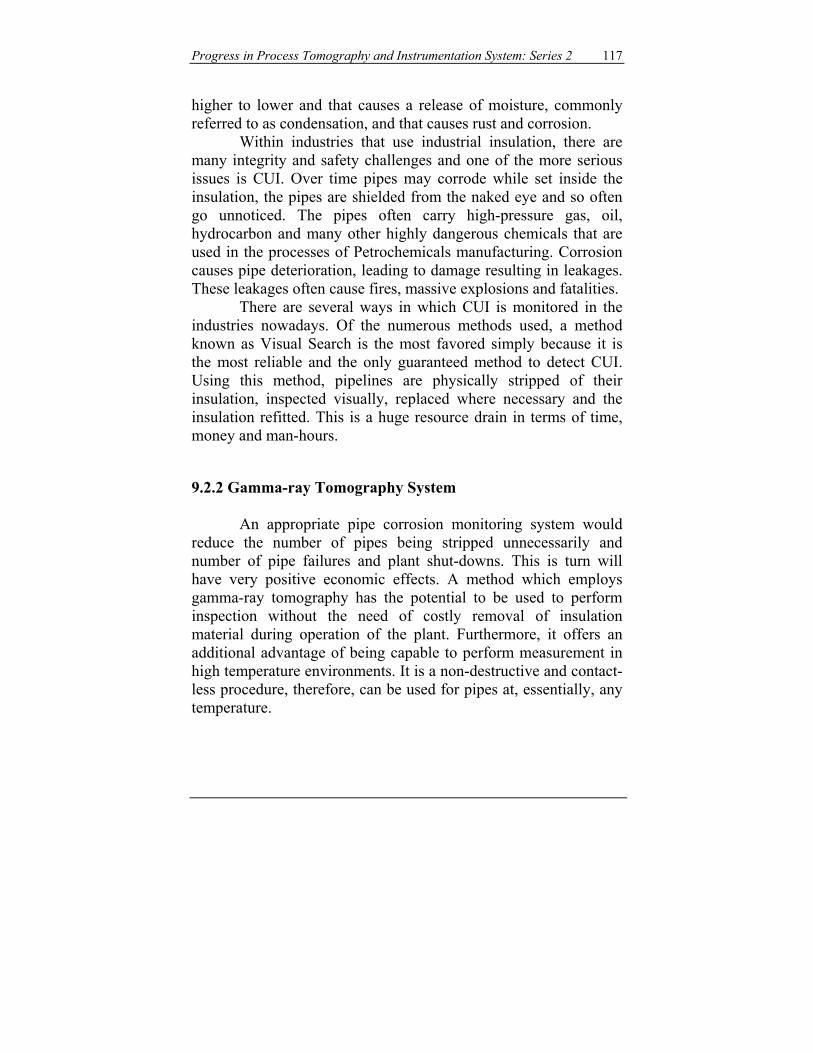
Referring to Figure 9.2, the source and detector are positioned at opposite ends of the pipe under test and then are moved simultaneously using stepper motors at precise distances as preset by the PLC. For this system, one reading is taken at every 3mm of movement along a particular axis to obtain one projection. The maximum range of movement for the detector and source is 0-500mm. As such, the maximum outer diameter of the pipe that can be tested by this system is 500mm e.g. for a pipe with outer diameter 210mm, 70 readings are taken.
Figure 9.2 Arrangement of system components for projection taken at 0˚
The ‘tracks’ on which the source and detector move on are
parallel to each other and can be set up to either move along the x-axis or y-axis as in Figure 9.3. Alternately it can also be placed on a circular rotating mechanism as shown in Figure 9.4. The purpose
Gamma-ray source Gamma-ray detector and shielding
Insulation
Pipe
Movement along axis with data taken at every 3mm

120 Introduction to Gamma-Ray Transmission Tomography
of this is for ease of rotation when data is taken at different angles as shown in Figure 9.5. Since this system is fully portable, it can be dismantled and reassembled easily with the use of basic tools. From intensities collected at each point, Figure 9.5 is plotted. The thickness of the pipe, insulation and obstacles can be predicted based on the increase and decrease of the intensity counts. The x-axis and the y-axis measurements do correspond correctly to the pipe’s physical measurement. The slight differneces between the actual pipe at the graphed data is due to the distance between each measurement.
(a)
(b)
Figure 9.3 System assembled for measurement along vertical and horizontal axes

P
Progress in Pro
Placement ofGamma-ray
source
Placement of Gamma-ray
detector
ocess Tomogra
Figure
f y
f
aphy and Instru
(a)
(b)
e 9.4 Rotatin
umentation Sys
ng mechanism
stem: Series 2
m
mdetec
121
Range of movement for
ctor and sourcee

122 Introduction to Gamma-Ray Transmission Tomography
(a) 0˚ projection (b) 20˚ projection (c) 45˚ projection (d) 90˚ projection Figure 9.5 Rotating mechanism at different projection angles
Figure 9.6 Relating measured intensities taken at 0˚ and 90˚ to the
pipe’s physical dimensions
N number of readings
θ=20˚
θ=45˚
Progress in Process Tomography and Instrumentation System: Series 2 123
9.4 TOMOGRAM CONSTRUCTION Number of data collected and the number of points at
which the data is taken depends on the size of the pipe. The start and end point for the movement controlled by the motor can be set by the user. The system is an offline system since a considerable amount of time is needed for each data set to be taken. For example, a pipe with outer diameter of 210mm would require readings to be taken at 70 data points (i.e. 210mm/3mm = 70 points). Each reading at each data point requires a minimum of 6 seconds. This is because the data is in the form of radiation intensity counts which fluctuates wildly. Hence time is needed for it to stabilize. This wait period can be increased or decreased by manipulating a knob on the ratemeter. Generally the longer the wait period, the better and more accurate the reading is but since time is of the essence when collecting data, the ratemeter is set to display the intensity after a period of 6 seconds.
By feeding the data collected into software designed to construct sinograms of each slice using the Radon transform. These projections are then backprojected to obtain the final tomogram. 9.5 CONCLUSION Relevant Industry Sectors: Oil and gas industries, process and chemicals industries. Technical and Economic Benefits: 1. The technical benefit is an NDT technique for difficult-to-
inspect areas. 2. It has the potential to be used to perform inspection without the
need of costly removal of insulation material during operation of the plant.
3. It is able to produce the image of the cross-sectional slices of the investigated pipe enabling image quality analysis and enhancement to be performed.

124 Introduction to Gamma-Ray Transmission Tomography
4. The system designed is believed to be able to give great improvement on the monitoring and investigation of corrosion under insulation of pipelines.
REFERENCES [1] Martz, H E, Schneberk, D J, Roberson, G P and Monteiro, P J, .Computerized tomography analysis of reinforced concrete., ACT Materials Journal, May/June 1993, pp 259-264 [2] Jaafar Abdullah, Rasif Mohd Zain and Roslan Yahya (2003). Pipe-CUI-Profiler: A Portable Nucleonic System for Detecting Corrosion Under Insulation (CUI) of Steel Pipes,In Proceeding of the 5th National Seminar on Non-Destructive Testing (NDT), pages 209-213, Shah Alam, October 2003. [3] Herman, G.T.: Image Reconstruction from Projections: The Fundamentals of Computerized Tomography. Academic Press, New York (1980)