introduction to genetic association studies in africagav/geia/durban_2015/... · introduction to...
TRANSCRIPT

Introduction to genetic association studies in Africa
Dr Kirk Rockett
Wellcome Trust Advanced Courses; Genomic Epidemiology in Africa, 21st – 26th June 2015 Africa Centre for Health and Population Studies, University of KwaZulu-Natal, Durban, South Africa

Introductions
Public databases
and resources
for genetics
whole genome sequencing and fine-mapping
meta-analysis and power of
genetic studies
GWAS results and
interpretation
GWAS QC
Basic principles of measuring
disease in populations
population genetics
Principal components
analyses GWAS
association analyses
Epidemiology Bioinformatics Genetics
Basic genotype data summaries
and analyses

A complex trait
Variation due to age, sex, environmental factors (e.g. diet), and genetic variation.
Proportion of individuals
• A small proportion of variation is caused by rare gene defects causing major disruption of normal physiological processes. These tend to be found at the extremes of the distribution.
• Most variation is probably due to multiple common variants that slightly alter normal physiological processes. It is challenging to pin down the variants responsible because, at an individual level, they do not have strong effects.
rare common rare

Why should we look for common variants with small effects? • These variants may not contribute much to overall risk. • But they may lead to new insights into etiology of disease
– e.g. mechanisms of immunity, disease, drug action, erythrocyte invasion and other critical host – parasite interactions.
• …and new drug targets. • We now have the scientific tools to do it.
Variation in resistance & susceptibility to disease

Genetic variation

5bp
DNA structure overview

Genetic variation in the human genome

There are many different variants including small variations in the DNA sequence, e.g. • a small ‘spelling mistake’ • deletion or insertion of a few characters large structural variations, e.g. • deletion of a large part of DNA sequence • multiple copies of a section of DNA sequence, with variable copy number
Common forms of variation in the human genome

ACTCTACGATTTACGGTACTTAGGAGCATATGCTACT ACTGTACGATTTACGGTACTTAG.AGCATATGCTACT
Common forms of variation in the human genome
SNP single nucleotide polymorphism
indel insertion / deletion
About 38 million SNPs found across the human genome worldwide – one every 84bp.
Maybe ~2 million small indels worldwide – about one every 1,600bp.
Most variants are single nucleotide polymorphisms (SNPs)

Gene A Gene B Gene C
Common forms of variation in the human genome
Hundreds of kilobases
Structural variants
Gene B Gene A Gene C
Inversions:
Complex rearrangements:
Gene B Gene A Gene C Gene B
Gene A Gene C Gene B Gene B Duplications:

Finding loci that influence disease
?

Association studies broadly fall into two categories: • Family-based studies • Case/control studies
Mixed designs are also possible.
Finding loci that influence disease

Variation in resistance & susceptibility to disease
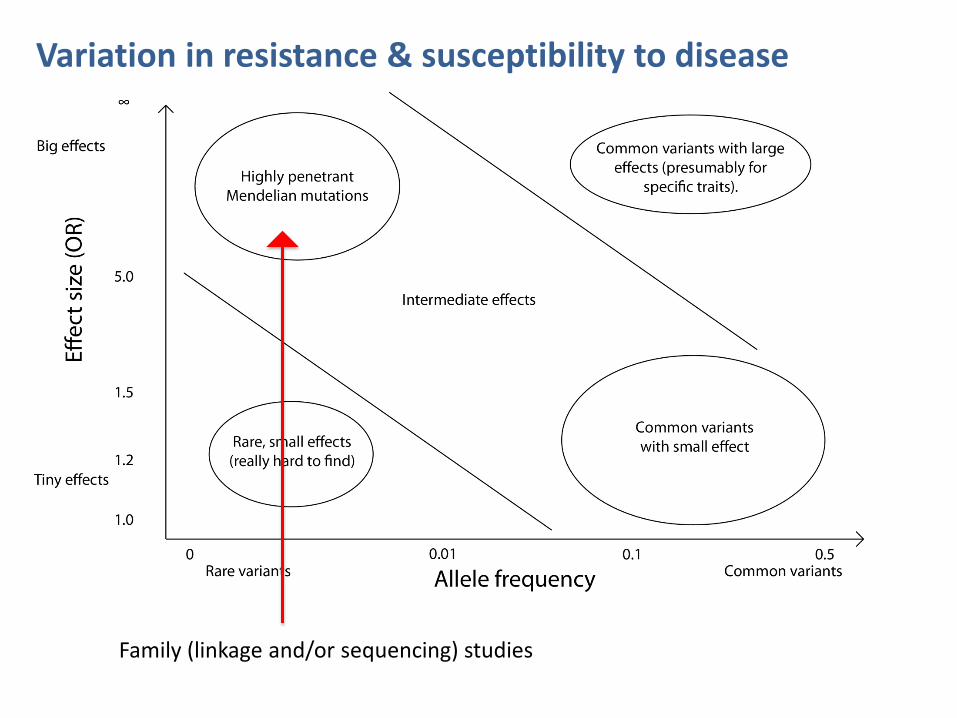
Variation in resistance & susceptibility to disease
Family (linkage and/or sequencing) studies

Family-based association analysis
Compare probands (e.g. cases) with other family members, such as parents. Pros: • Robust against potential confounding factors, such
as population structure or environmental effects. • Great when looking for variants with big effects. • Extended family designs can go where other
designs can’t(*). Cons: • Can be harder difficult to collect large samples. • For common variants / complex trait association
there is potentially reduced power (for equal sample size)
(*) e.g. Kong et al, “Parental origin of sequence variants associated with complex diseases”, Nature 462 (2009)

Variation in resistance & susceptibility to disease
GWAS studies

Compare disease-affected individuals (cases) with unaffected individuals (controls).
Case/control association analysis
Most of this course will focus on case/control designs.
The general population
cases
Pros: Large sample sizes can be realised => powered to detect small effects.
Cons: Potential confounding effects from differential selection of cases and controls – (e.g. cases and controls should be ethnically matched where possible).

What do we need to know to detect our effect?
Or what POWER do we have to detect an effect
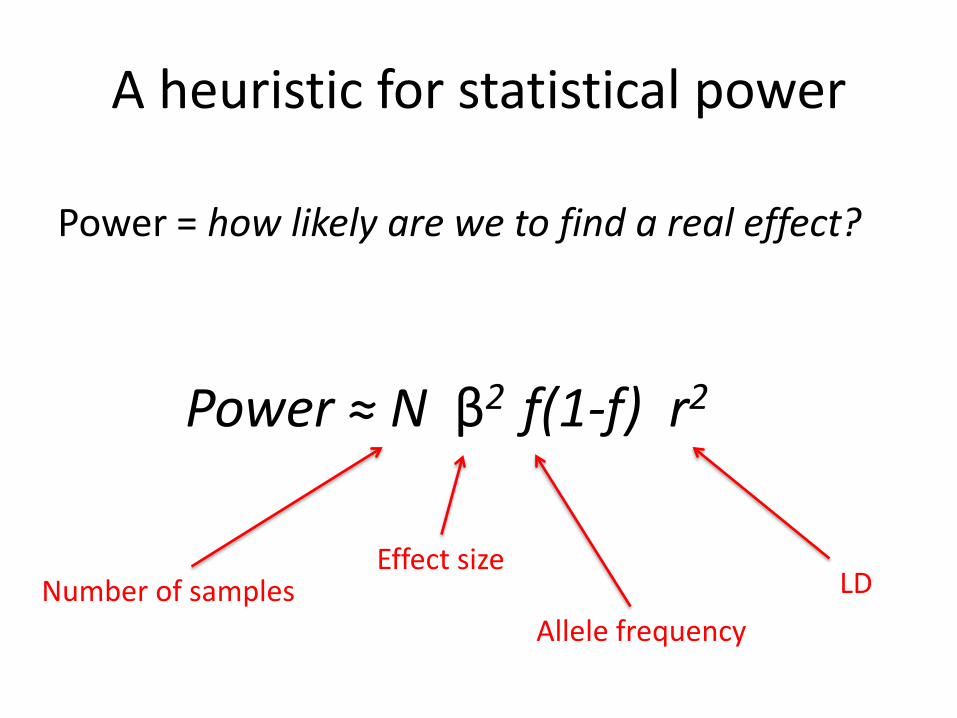
A heuristic for statistical power
Power = how likely are we to find a real effect?
Power ≈ N β2 f(1-f) r2
Number of samples Effect size
Allele frequency LD

Variation in resistance & susceptibility to disease
Power ≈ N β2 f(1-f) r2

• Consider a position in the genome that shows variation between individuals, for example … A T G A C T C G T A allele 1 A T G A C A C G T A allele 2 • Each of the different variant forms is called an allele • We are looking for alleles that are associated with high or low risk of disease
Finding loci that influence disease

Example: sickle and severe Malaria Gambian data (MalariaGEN consortium)
Genotype HbAA HbAS HbSS (normal) sickle trait sickle cell disease
N = 7047 f = 0.07 (7%)
TT AT AA
Severe malaria cases 2700 35 13
Population 3689 588 22

Example: sickle and severe Malaria Gambian data (MalariaGEN consortium)
TT AT AA
Severe malaria cases 2700 35 13
Population 3689 588 22
Odds ratio = 3689*35 / 2700 * 588 = 0.08
Individuals with AT (sickle) genotype have 10-fold lower risk of malaria than those with TT (wild-type) genotype.
P < 2x10-16 e.g. chisq.test in R

Aim: • Find common variants influencing disease by performing this
test at millions of variants across the human genome.
• Typical modern experiment: type 2.5M variants in thousands of cases and thousands of population controls. Use estimated genome-wide relationships to control for population structure.
• This design exploits linkage disequilibrium to assess variants that are not directly typed.
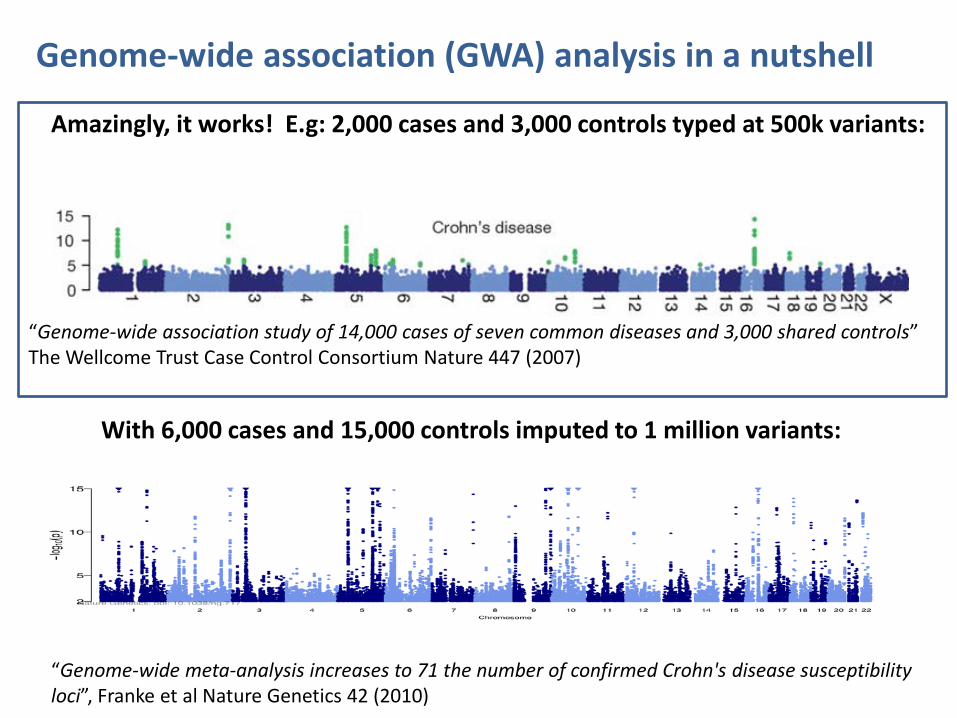
Genome-wide association analysis (GWAS) in a nutshell
Key concept: linkage disequilibrium

Amazingly, it works! E.g: 2,000 cases and 3,000 controls typed at 500k variants:
Genome-wide association (GWA) analysis in a nutshell
“Genome-wide association study of 14,000 cases of seven common diseases and 3,000 shared controls” The Wellcome Trust Case Control Consortium Nature 447 (2007)
Amazingly, it works! E.g: 2,000 cases and 3,000 controls typed at 500k variants:
Genome-wide association (GWA) analysis in a nutshell
“Genome-wide association study of 14,000 cases of seven common diseases and 3,000 shared controls” The Wellcome Trust Case Control Consortium Nature 447 (2007)
With 6,000 cases and 15,000 controls imputed to 1 million variants:
“Genome-wide meta-analysis increases to 71 the number of confirmed Crohn's disease susceptibility loci”, Franke et al Nature Genetics 42 (2010)

Amazingly, it works! E.g: 2,000 cases and 3,000 controls typed at 500k variants:
Genome-wide association (GWA) analysis in a nutshell
“Genome-wide association study of 14,000 cases of seven common diseases and 3,000 shared controls” The Wellcome Trust Case Control Consortium Nature 447 (2007)
Different diseases have different architectures:
“Genome-wide association study of 14,000 cases of seven common diseases and 3,000 shared controls” The Wellcome Trust Case Control Consortium Nature 447 (2007)

Best SNP marker was rs1333049 • OR ~ 1.47: one copy of the risk allele (present in half the population) increases “risk” of coronary artery disease by ~50% • two copies of risk allele (present in quarter of population) almost doubles “risk” of coronary artery disease (OR 1.47 * 1.47)
Wellcome Trust Case Control Consortium
Discovery of a common genetic variant that affects risk of coronary artery disease
P = 1.8x10⁻¹⁴
Chromosome 9
CDKN2A CDKN2B
rs1333049

• Most SNPs are correlated with surrounding SNPs. This is known as linkage disequilibrium • Linkage disequilibrium reflects the common combinations of variants (haplotypes) that exist in the population
Each population has a distinct pattern of genome variation
SNPs

GWAS in Africa A number of factors make GWAS particularly challenging in Africa. • Genome diversity much higher in African than other
populations – more SNPs, more structure, more haplotypes.
• Low levels of LD…
• …and differences in LD between populations means power to detect untyped causal loci is reduced.
• A unique burden of infectious disease - the full story might involve two or more genomes at once!

• Investigators in 16 malaria endemic countries: Burkina Faso, Cambodia, Cameroon, Gambia, Ghana, Ghana, Kenya, Malawi, Mali, Nigeria, Papua New Guinea, Senegal, Sudan, Tanzania, Thailand, Vietnam. • …and 6 non-endemic countries: France, Germany, Italy, Sweden, UK, USA • Building a resource of DNA and clinical data from ~100,000 subjects
Malaria Genomic Epidemiology Network
www.malariagen.net


Recruitment of 13,000 cases of severe malaria
Question: In communities where every child is repeatedly infected with malaria, why do some children die and not others?
• Burkina Faso • Cameroon • Gambia • Ghana (Navrongo) • Ghana (Kumasi) • Kenya • Malawi • Mali • Nigeria • Papua New Guinea • Tanzania • Vietnam
Cases and controls from:

0.01 0.1 1 10 ODDS RATIO
Country Cases (n/N) Cntls (n/N)
Gambia 32/2542 460/3332
Mali 4/453 28/344
Burkina Faso 21/865 73/729
Ghana (Navrongo) 19/6820 50/484
Ghana (Kumasi) 32/1495 271/2042
Nigeria 9/77 9/40
Cameroon 32/621 99/576
Kenya 57/2261 594/3941
Tanzania 5/428 75/452
Malawi 2/1388 132/2696
All severe malaria 213/10685 1791/14641
Consistent effects despite phenotypic heterogeneity
Sickle cell trait Protective effect of rs334 against severe malaria P=10-227
Rockett et al. (2014) Nature Genetics 46: 1197
HbAS effect in severe malaria

0.1 1 10 ODDS RATIO
O blood group Protective effect of rs8176719 against severe malaria P=10-32
Country Cases (O/total) Cntls (O/total)
Gambia 1000/2345 1664/3624 Mali 130/445 143/336
Burkina Faso 321/854 326/729 Ghana (Navrongo) 263/674 227/556
Ghana (Kumasi) 548/1480 992/1988
Nigeria 27/78 24/40
Cameroon 267/608 312/572
Kenya 1061/2254 2131/3899 Tanzania 189/423 221/455 Malawi 615/1414 1298/2607
Vietnam 272/788 1000/2517 Papua New Guinea 139/385 76/239 All severe malaria 4832/11948 8414/17652
Consistent effects despite phenotypic heterogeneity O blood group effect in severe malaria
Rockett et al. (2014) Nature Genetics 46: 1197

Attempt #1: GWAS of Severe Malaria in Gambia (2009)
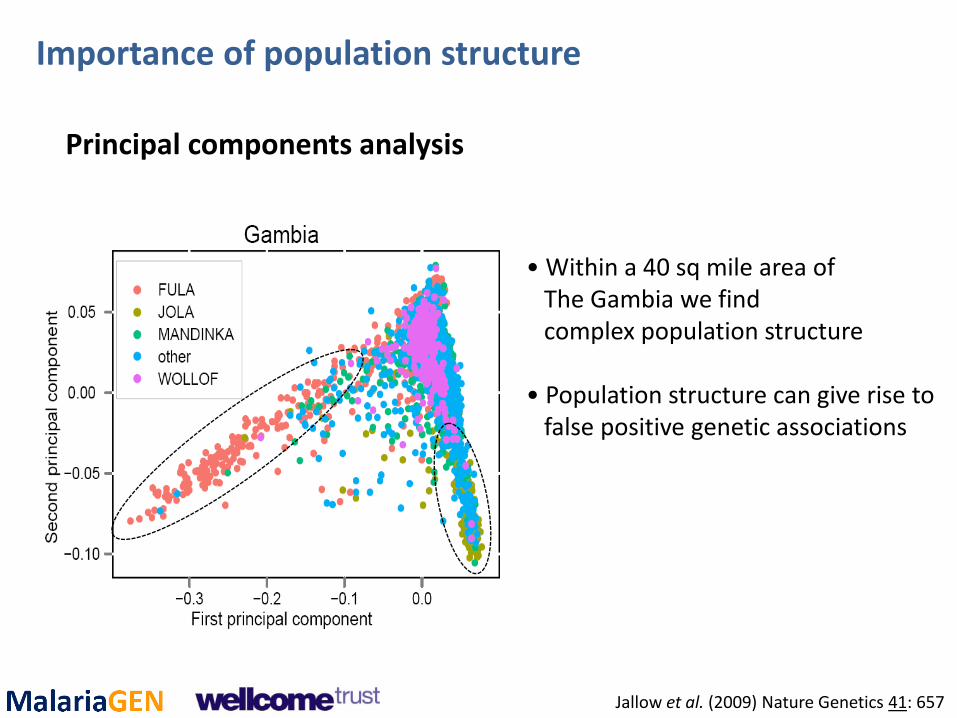
• Within a 40 sq mile area of The Gambia we find complex population structure • Population structure can give rise to false positive genetic associations
Principal components analysis
Importance of population structure
Jallow et al. (2009) Nature Genetics 41: 657

Importance of population structure
Subpopulation A Subpopulation B
Cases
Controls
Cases
Controls
Genotype aa Aa AA

Importance of population structure
Subpopulation A Subpopulation B
Cases
Controls
Cases
Controls
Genotype aa Aa AA
χ2 = 16.3 (p <0.001)
χ2 = 2.1 (p = 0.34)
χ2 = 1.57 (p = 0.46)

Importance of population structure
Quantile‐quantile plot of chi‐squared statistic comparing what we observed versus what we’d expect if no disease association
Uncorrected Corrected by principal components analysis
Inflation factor = 1.25
Inflation factor = 1.03
Jallow et al. (2009) Nature Genetics 41: 657

GWA studies of severe malaria Study of 500,000 SNPs in 2,500 Gambian children
Low LD acts to attenuate GWA signals of association • HbS signal is P=4x10⁻⁷ (causal variant P=10-28) • No signal at ABO
Jallow et al. (2009) Nature Genetics 41: 657
Sickle (P = 3.9 × 10⁻⁷)
ABO

Targetted resequencing

• 5,000 cases and 7,000 controls from Gambia, Kenya and Malawi.
• Imputed to ~1.3M variants from the publically available HapMap reference panel.
• Novel methods to allow for heterogeneity and differences in haplotype background: heterogeneity Bayes factors, and region-based tests that take into account all variants in each region.
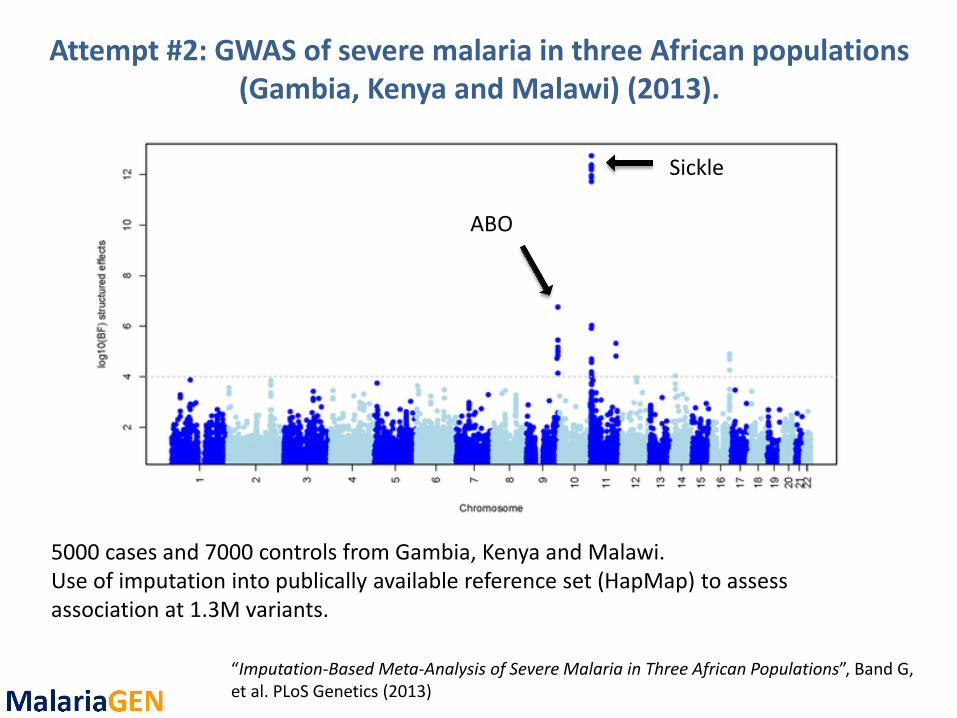
Attempt #2: GWAS of severe malaria in three African populations (Gambia, Kenya and Malawi) (2013).

Attempt #2: GWAS of severe malaria in three African populations (Gambia, Kenya and Malawi) (2013).
Control for the extensive structure using a mixed model that takes into account relatedness at all levels. (PCs also used for comparison with similar results.)
“Imputation-Based Meta-Analysis of Severe Malaria in Three African Populations”, Band G, et al. PLoS Genetics (2013)
“Imputation-Based Meta-Analysis of Severe Malaria in Three African Populations”, Band G, et al. PLoS Genetics (2013)
5000 cases and 7000 controls from Gambia, Kenya and Malawi. Use of imputation into publically available reference set (HapMap) to assess association at 1.3M variants.
Sickle
ABO
Attempt #2: GWAS of severe malaria in three African populations (Gambia, Kenya and Malawi) (2013).

Attempt #2: GWAS of severe malaria in three African populations (Gambia, Kenya and Malawi) (2013).

Attempt #2: GWAS of severe malaria in three African populations (Gambia, Kenya and Malawi) (2013).
Where sickle is Where we see the most signal

Region Chromosome Regional test Bayes factor
OR51F1 (HBB region) 11 > 1011
ABO 9 4920
BET1L 11 319
C10orf57 10 243
MYOT 5 112
SMARCA5 4 110
ATP2B4 1 103
Attempt #2: GWAS of severe malaria in three African populations (Gambia, Kenya and Malawi) (2013).
Sickle Signal O blood group signal
Red cell calcium channel

• Approx. 10,000 cases and 10,000 controls (across 11 countries).
• Typed at 2.5M variants and imputed up to 40M variants from the phase 3 1000 Genomes reference panel.
• Starting to find new loci. Some evidence that there are rarer, bigger effects around, differing between populations.
• Data is being made publically available – we have an ongoing effort to develop web-based tools for data sharing.
Attempt #3 (2015?): GWAS of severe malaria in eight populations in sub-Saharan Africa

GWAS Summary
• Power to detect association depends on sample size, effect size, frequency, and density of markers. Bigger is better!
• Careful QC and control for confounding factors is essential.
• High diversity and patterns of LD make GWAS in Africa particularly challenging.

GWAS : the hare and the tortoise?
Europe Africa Level of LD high low Variability of LD low high Finding signals of association by genome‐wide SNP typing easy difficult Localising causal variants by genome sequencing difficult ?easy

Next-generation sequencing will transform genome-wide association analysis
In the near term • The 1000 Genomes Project is including 2 MalariaGEN study
sites (Gambia, Vietnam) in addition to at least 6 other African populations.
• Other groups working to create Africa-specific reference panels (e.g. AGVP, H3Africa).
• By combining GWAS data with population-specific sequence data, we can boost signals of association and localise causal variants.
In the longer term • GWAS‐by‐sequencing will replace GWAS‐by‐SNP‐typing. • This will particularly benefit studies in Africa and multiethnic studies.

What’s next?
As a warm-up for a full GWAS analysis later in the week, the next practical shows you how to perform association analyses on individual SNPs using R. (Based on MalariaGEN data.)