introduction to geography - home - magoffin county schools 1... · introduction to geography lesson...
TRANSCRIPT

8/19/14
1
Introduction to Geography
Lesson 1
Introduction
| Geography skills provide the tools and methods for us to understand the _____________________ between people, places, and environments.
| We use geographic skills when we make daily personal decisions–where to buy a home; where to get a job; how to get to the shopping mall; where to go on vacation.
| Community decisions, such as where to locate a new school or how to solve problems of air and water pollution, also require the skillful use of geographic information.
Thinking Like a Geographer
| Geographers use a wide array of tools and technologies–from basic globes to high-tech global positioning systems–to understand the earth.
| These help them _____________________ and _____________________ a great deal of information. However, the study of geography is more than knowing a lot of facts about places. Rather, it has more do with asking questions about the earth, pursuing their answers, and solving problems.
| Thus, one of the most important geographic tools is inside your head: the ability to think geographically.
Latitude, Longitude & Location
| Geography is often said to begin with the question: Where?
| The answer can be described in many ways, including direction, distance, country, or region. However, the basic tool for answering the question is _____________________.
| Lines on globes and maps provide information that can help you locate places. These lines cross one another, forming a pattern called a __________________________________________. This system helps you find exact places on the earth’s surface.
Latitude, Longitude & Location
Lines of _____________________, or parallels, circle the earth parallel to the Equator and measure the distance north or south of the Equator in degrees. The _____________________ is measured at 0° latitude, while the Poles lie at latitudes 90° N (north) and 90° S (south). Parallels north of the Equator are called north latitude, and parallels south of the Equator are called south latitude.
Lines of longitude, or _____________________, circle the earth from Pole to Pole. These lines measure distances east or west of the starting line, which lies at 0° longitude and is called the _____________________. By international agreement, the Prime Meridian is the line of longitude that runs through the Royal Observatory in Greenwich, England. Places east of the Prime Meridian are known as east longitude, and places west of the Prime Meridian are known as west longitude.

8/19/14
2
The Global Grid Every place has a global address, also called its _____________________ location. You can identify the absolute location of a place by naming the longitude and latitude lines that cross exactly at that place. For more precise readings, each degree of latitude and longitude is subdivided into 60 units called _____________________.
From Globes to Maps
| A _____________________ is a scale model of the earth. Because the earth is round, a globe presents the most accurate depiction of geographic information such as area, distance, and direction. However, globes show little close-up detail.
| A printed _____________________ is a symbolic representation of all or part of the planet on a flat piece of paper. Unlike globes, maps can show small areas in great detail. Another advantage of printed maps is that they can be folded, stored, and easily carried from place to place.
From Globes to Maps
| Think about the surface of the earth as the peel of an orange. To flatten the peel, you might have to cut it like the globe shown on the following slide. To create maps that are not interrupted, mapmakers, or _____________________, use mathematical formulas to transfer information from the three-dimensional globe to a two-dimensional map.
| However, when the curves of a globe become straight lines on a map, distortion of size, shape, distance, or area occurs. The purpose of the map usually dictates which _____________________ is used
Map Projections | To create maps, cartographers project the round
earth onto a flat surface–making a _____________________.
| There are more than a hundred kinds of map projections, some with general names and some named for the cartographers who developed them. Three basic categories of map projections are shown here: planar, cylindrical, and conic.
Common Map Projections
| The curved surface of the earth cannot be shown accurately on a flat map. Every map projection _____________________ or breaks the curved surface of the planet in some way as it is flattened. Distance, direction, shape, or area may be _____________________.
| Cartographers have developed many map projections, each with some advantages and some degree of inaccuracy. Four of the most popular map projections, named for the cartographers who developed them, are shown on the following slides
Winkel Tripel Projection
| _____________________ general reference world maps use the Winkel Tripel projection. Adopted by the National Geographic Society in 1998 for use in most maps, the Winkel Tripel projection provides a good balance between the size and shape of land areas as they are shown on the map. Even the polar areas are depicted with little distortion of size and shape.

8/19/14
3
Robinson Projection | The Robinson projection has _____________________
distortions. The sizes and shapes near the eastern and western edges of the map are accurate, and the outlines of the continents appear much as they do on the globe. However, the shapes of the polar areas appear somewhat distorted.
Mercator Projection | The Mercator projection, once the most commonly
used projection, increasingly distorts size and distance as it moves away from the Equator. This makes areas such as Greenland and Antarctica look much larger than they would appear on a globe. However, Mercator projections do accurately show _____________________ and the _____________________ of landmasses, making these maps useful for ________________________________.
Geographic Information Systems (GIS)
| Modern technology has changed the way maps are made. Most cartographers use computers with software programs called __________________________________________ (GIS). A GIS is designed to accept data from many different sources, including maps, satellite images, and printed text and statistics. The GIS converts the data into a digital code, which arranges it in a database. Cartographers then program the GIS to process the data and produce the maps they need. With GIS, each kind of information on a map is saved as a separate electronic “layer” in the map’s computer files. Because of this modern technology, cartographers are able to make maps–and change them–quickly and easily.
Map Key
Cartographers use a variety of symbols to represent map information. Graphic symbols are easily understood by people around the world. To be sure that the symbols are clear, however, every map contains a _____________________–a list that explains what the symbols stand for. This key shows symbols commonly used on a political map.
Boundary Lines
Boundary Lines On political maps of large areas, boundary lines highlight the borders between different countries, states, or counties.
Compass Rose Compass Rose Most maps feature a compass rose, a marker that indicates directions. The four _____________________ directions–north, south, east, and west–are usually indicated with arrows or points of a star. The _____________________ directions northeast, northwest, southeast, southwest–may also be shown, usually with smaller arrows or star points.
Sometimes a compass rose may point in only one direction because the other directions can be determined in relation to the given direction. The compass rose on this map indicates north only.
8/19/14
4
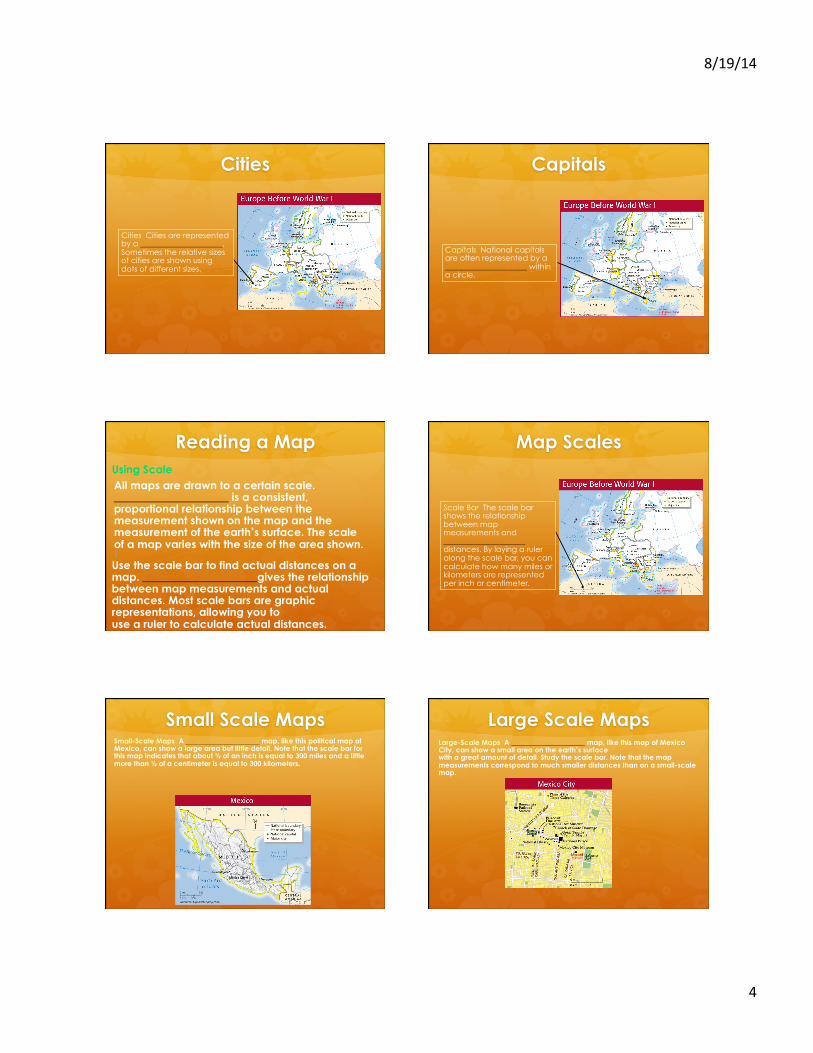
Cities
Cities Cities are represented by a _____________________. Sometimes the relative sizes of cities are shown using dots of different sizes.
Capitals
Capitals National capitals are often represented by a _____________________ within a circle.
Reading a Map
All maps are drawn to a certain scale. _____________________ is a consistent, proportional relationship between the measurement shown on the map and the measurement of the earth’s surface. The scale of a map varies with the size of the area shown. ⇓
Using Scale
Use the scale bar to find actual distances on a map. _____________________gives the relationship between map measurements and actual distances. Most scale bars are graphic representations, allowing you to use a ruler to calculate actual distances.
Map Scales
Scale Bar The scale bar shows the relationship between map measurements and _____________________ distances. By laying a ruler along the scale bar, you can calculate how many miles or kilometers are represented per inch or centimeter.
Small Scale Maps Small-Scale Maps A _____________________ map, like this political map of Mexico, can show a large area but little detail. Note that the scale bar for this map indicates that about ½ of an inch is equal to 300 miles and a little more than ½ of a centimeter is equal to 300 kilometers.
Large Scale Maps Large-Scale Maps A _____________________ map, like this map of Mexico City, can show a small area on the earth’s surface with a great amount of detail. Study the scale bar. Note that the map measurements correspond to much smaller distances than on a small-scale map.

8/19/14
5
Reading a Map
A place’s _____________________ location is found at the precise point where one line of latitude crosses a line of longitude. Another way that people indicate location is by relative location. You may be told, for example, to look for a street that is “two blocks north” of another street.
_____________________ location is the location of one place in relation to another place.
Absolute and Relative Location
Types of Maps
Maps are prepared for many uses. The use for which a map is intended determines the kinds of information it contains. Learning to recognize a map’s purpose will help you make the best use of its content.
General-Purpose Maps
Maps that show a wide range of information about an area are called _____________________maps. General-purpose maps are typically used for reference, education, and travel. Two common forms of general-purpose maps are physical maps and political maps.
Physical Maps Physical Maps A physical map shows the location and the _____________________, or shape, of the earth’s physical features. Physical maps use colors or patterns to indicate relief–the differences in elevation, or height, of landforms. Some physical maps have contour lines that connect all points of land of equal elevation. Physical maps may show mountains as barriers to transportation. Rivers and streams may be shown as routes into the interior of a country. These physical features often help to explain the historical development of a country.
Political Maps Political Maps A political map shows the _____________________ between countries. Smaller internal divisions, such as states or counties, may also be indicated by different symbols. Political maps often show human-made features such as capitals, cities, roads, highways, and railroads.
Types of Maps Special-Purpose Maps Maps that emphasize a single idea or a particular kind of information about an area are called __________________________________________ maps. There are many kinds of special-purpose maps, each designed to serve a different need. Some special-purpose maps–such as economic activity maps and natural resource maps–show the distribution of particular activities, resources, or products in a given area. Colors and symbols represent the location or distribution of activities and resources.
Economic Activity Map An Economic Activity Map The special-purpose map below shows the distribution of land use and natural resources in Southwest Asia. Geographers use maps like this one to study the distribution of natural resources. Governments and industry leaders use land use maps and natural resource maps to monitor the economic activities of countries and regions.

8/19/14
6
Graphs, Charts, & Diagrams
In addition to globes and maps, geographers use other visual representations to display and interpret data. Graphs, charts, and diagrams provide valuable information in forms that are well organized and easy to read.
A _____________________ is a visual presentation of information. There are many kinds of graphs, each suitable for certain purposes. Most graphs show two sets of data, one displayed along the vertical axis and the other displayed along the horizontal axis. Labels on these axes identify the data being displayed.
Graphs
Line Graphs A _____________________ graph shows changes in two _____________________, or changing sets of circumstances over periods of _____________________. To analyze data on a line graph, study the changes and trends as shown by the line. Then draw conclusions based on the information. This line graph shows U.S. population growth between 1900 and 2000. The vertical axis lists population, and the horizontal axis indicates the passage of time.
Bar Graphs A _____________________ graph shows comparisons. To analyze a bar graph, note the differences in quantities. Then make generalizations or draw conclusions based on the data.
This bar graph shows lumber production among the top five lumber-producing countries in the world. The vertical axis shows the amount of lumber produced.
Circle Graphs A _____________________ graph, or pie graph, shows the relationship of parts to a whole. Percentages are indicated by relative size and sometimes by color.
To analyze a circle graph, study the relationships of areas to one another and to the _____________________.
This circle graph shows the land areas of the world’s continents and other landmasses, such as islands, expressed as percentages of Earth’s total landmass.
Charts & Tables
Data are arranged in columns and rows in a _____________________ or table. Charts and tables display facts in an organized manner and make comparisons easy.
To find key information in a chart or table, look for the intersections of columns and rows.
Diagrams
A _____________________ is a drawing that shows what something is or how something is done. Many diagrams feature several drawings or sections that show the steps in a process.