introduction to human capital management system dashboards · introduction to human capital...
TRANSCRIPT

Introduction to Human Capital Management System Dashboards
White Paper
Anthony Milanowski, WestatHerbert Heneman III, University of Wisconsin-MadisonBradley Carl, University of Wisconsin-Madison
April 2017
This product was developed under a contract from the U.S. Department of Education for Teacher Incentive Fund (TIF) Technical Assistance, ED-ESE-15-A-0016/0001. The
views expressed herein do not necessarily represent the positions or policies of the
U.S. Department of Education. No official endorsement by the U.S. Department of
Education of any product, commodity, service, or enterprise mentioned in this
publication is intended or should be inferred. This product is public domain.
Authorization to reproduce it in whole or in part is granted. For more information
about the Teacher Incentive Fund’s work and its partners, see
www.tlpcommunity.org.

Table of Contents
Overview 1
The Unit ed St at es Educat ion Dashboard 2
Dashboard Project s of Teacher Incent ive Fund Grant ees 5 Austin Independent School District 5
Pittsburgh Public Schools 5
Denver Public Schools 6
Texas Region 18 Education Service Center 6
Building a Com prehensive HCM Dashboard 8
Exam ple Recruit m ent Met r ics for a Hum an Capit al Managem ent Program Adm inist rat or Dashboard 10
St eps in Developing an HCMS Dashboard 12
Conclusion 16

Overview
Many organizations use dashboards to monitor and analyze important performance measures. Data dashboards present the most important information (sometimes called key performance indicators, or KPIs) about processes and outcomes in a concise, easy-to-digest format. Dashboards get their name from the clusters of instruments and gauges drivers use to monitor the behavior of their cars. As educational organizations invest in more comprehensive human capital management systems (HCMSs), they must track the implementation and effectiveness of these systems in order to realize their full benefits . A human capital management (HCM) dashboard provides a visual representation of the implementation and effectiveness of HCM processes related to recruiting, hiring, developing, and retaining effective educators. Such a dashboard can be used to track and monitor progress toward achieving HCM goals. This brief, which provides an overview of the development of HCMS dashboards, first describes some of the work that the U.S. Department of Education and Teacher Incentive Fund (TIF) districts have done to develop dashboards. It then presents an example of a comprehensive strategic dashboard and an example of metrics for a dashboard that focuses specifically on teacher recruitment. It concludes with a summary of 12 steps to consider in developing dashboards and a list of resources for developing HCM performance indicators that could be presented on a dashboard.
Teacher & Leadership Programs 1
The United States Education Dashboard
The U.S. Department of Education has developed the United States Education Dashboard (http://dashboard.ed.gov/dashboard.aspx) to display information on a wide variety of education indicators, including some related to human capital. As shown in Figure 1, under the heading of “Teachers and Leaders” there is a count of how many states (as of 2010) have teacher and principal evaluation systems that involve student growth data, along with the percentage of teachers with a college major in their main assignment area (as of 2003–04 and 2007–08). This dashboard illustrates some of the key features of a dashboard, including simple, easy-to-read numeric summaries of important outcomes; historical trends, with arrows indicating improvement or decline; and drop-down options for “drilling down”1 to see more detailed information, such as trend graphs, breakdowns by demographic characteristics, and state-level data.
1 In the dashboard literature, to drill down means to move from a summary indicator (e.g., grantwide or distr ictwide average) to more detailed information (e.g., a breakout by teacher or student characteristics or by school). On a dashboard, a drilldown often involves clicking on a graph or a button to show the underlying data or choosing from a menu that takes the user to tables or graphs that provide a more detailed look at the indicator.
Teacher & Leadership Programs 2
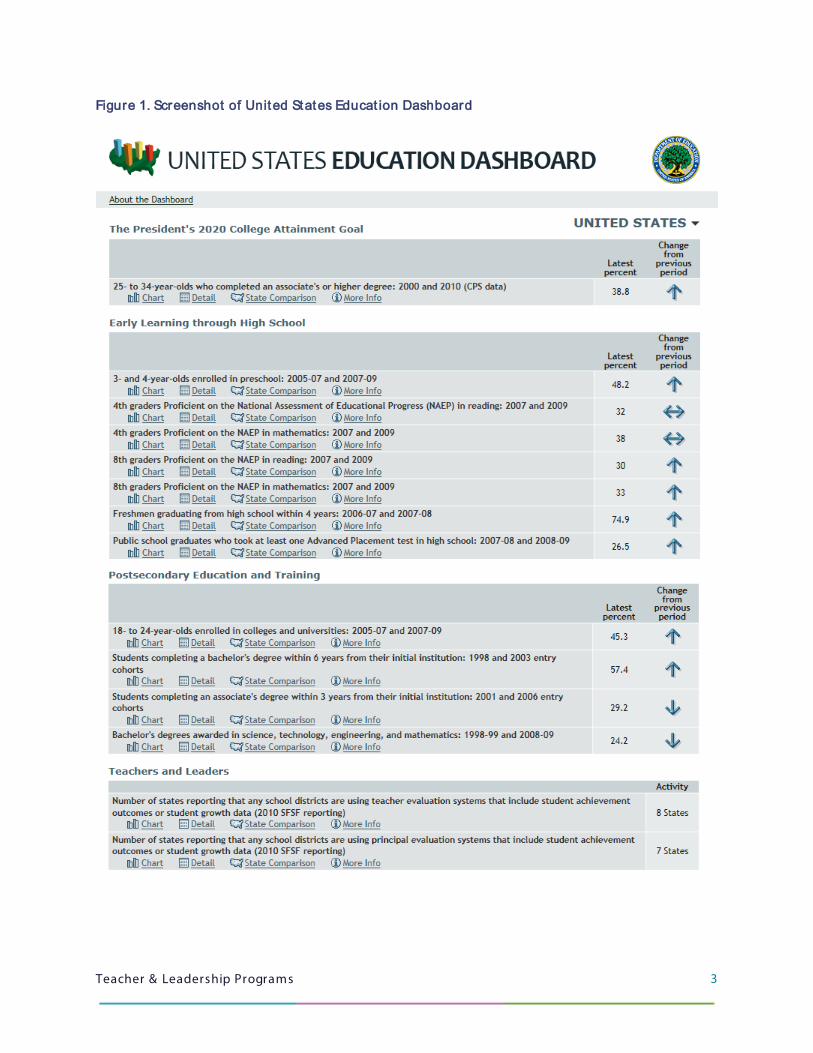
Figure 1. Screenshot of United States Educat ion Dashboard
Teacher & Leadership Programs 3

Figure 1. Screenshot of United States Educat ion Dashboard—Cont inued
Teacher & Leadership Programs 4

Dashboard Projects of Teacher Incentive Fund Grantees
Federal initiatives such as TIF have encouraged grantees to collect more valid and more extensive information about educators, the key resource in improving student achievement and equitable access to effective instruction. Grantees have developed educator evaluation systems that provide better information on educator practices and their effects on student learning and have begun to use that information in making a wider range of HCM decisions. TIF has also stimulated additional data collection and analys is about educator recruitment, selection, professional development, and retention, as well as student access to effective educators. As these data accumulate, it can be challenging to turn it into actionable information for leaders, program managers, and human resource (HR) staff. This section presents examples of TIF grantees that have begun to develop dashboards to help district leaders, program managers, and other stakeholders make sense of the data and track the effectiveness of their grant-supported HCM initiatives.
Austin Independent School District TIF 3 grantee Austin Independent School District has added a dashboard for pr incipals to its teacher HCM data system. The district customized an off-the-shelf performance evaluation tracking and reporting tool to provide a simple dashboard for pr incipals to use to track the progress of teacher evaluations being completed and to display and analyze patterns of results (such as which teachers are strong or weak on different performance dimensions, and which dimensions are strong or weak in the school). The dashboard provides heat map graphics to show schoolwide results by performance dimension. The district also provides a link to professional development options aligned to each performance dimension on the summary page for teacher observations, so that principals have a place to start in planning schoolwide or individual professional development. Austin’s experience illustrates two important principles of dashboard development: (1) keeping the dashboard simple to avoid overburdening users and to focus attention on actionable metrics, and (2) pilot-testing the dashboard with intended users. Austin has also found that dashboard use increases with principal experience. First-year principals have so much to learn that they make little use of even this relatively focused tool. However, by their third year, principals have become comfortable enough to use the tool’s full functionality.
Pittsburgh Public Schools TIF 2 and 3 grantee Pittsburgh Public Schools has a long-term commitment to developing and enhancing HCM dashboards, originating from the district’s participation in the Gates Foundation’s Empowering Effective Teachers initiative. Currently the district has dashboards for teacher effectiveness and has developed several staffing metrics that are dashboard-ready. The teacher effectiveness dashboard presents information such as the proportion of teachers at different levels of performance on each of its teacher effectiveness measures (practice, student achievement
Teacher & Leadership Programs 5

growth, and student survey results, how the proportion varies over time, and by whether teachers are newly hired and in high-needs schools. The dashboard also tracks the performance of teachers retained and whether low-performing teachers improved or exited the district. Another indicator included is the share of students who experienced instruction by high- and low-performing teachers in the last school year. The staffing metrics track the proportion of teachers that are new to a school in that year and the ratio of internal applicants to vacancies. These are used indicators of how attractive the school is to the existing teaching workforce during the district’s s ite-based selection process, and are used to determine whether a school should receive additional staffing support from the district central office. The district is considering adding an external applicant-to-vacancy ratio and the average time to fill vacancies. District staff emphasized the importance of selecting actionable data and indicators, telling a coherent story related to a specific issue or need rather than including all of the information available.
Denver Public Schools While not exactly a dashboard, the Strategic Data Project has developed a set of human capital diagnostics for Denver Public Schools. Their report, available at http://cepr.harvard.edu/files/cepr/files/sdp-diagnostic-hc-dps.pdf, includes charts and graphs describing a variety of human capital outcomes, including information on bonus payouts, the relationship between payouts and student growth, teacher retention by student growth, and characteristics of schools teachers transferred into and out of. M any of these graphs could be regularly updated and presented as a dashboard to allow program administrators and district leaders to track important outputs and outcomes related to the performance-based compensation system.
Texas Region 18 Education Service Center As part of their TIF 4-supported work, Region 18 has begun developing a comprehensive HCM data system that will include data dashboards for a variety of users, including the superintendents of participating distr icts, staff with HCM responsibilities, principals, and teachers. Region 18 began their journey toward this comprehensive system with the need to track the components of their multiple-measure evaluation processes for teachers and principals for earlier TIF grants. As they worked with the disparate data systems of districts participating in the grant, Region 18 staff saw the need to develop an integrated system and the potential to build data dashboards for different users. They engaged multiple stakeholders, including superintendents, principals, teachers, and HR staff, in the development of the request for proposals to build the integrated data system. Their envisioned system will be based on six modules: talent acquisition, training and professional development, educator evaluation, student growth, educator effectiveness, and performance-based compensation. The talent acquisition module would contain information on applicant qualifications, hiring, and retention. The training and professional development module is intended to allow educators to create PD plans, provide a catalog of PD offerings, record PD activities, and track PD participation. The educator evaluation module will help teachers and administrators manage the evaluation of practice, calculate evaluation ratings, and report results. The student growth module would capture information related to value-added, student learning objectives, and student portfolios, enabling teachers to create SLOs and monitor student progress, and provide teacher- and school-level summaries of results. The educator effectiveness module would calculate an overall
Teacher & Leadership Programs 6

effectiveness rating from multiple performance measures and provide reports, while the performance-based compensation module would calculate individuals’ performance-based compensation based on performance measures and provide reports. Each set of users will have a dashboard designed to present summary information, and district- and educator-level profiles will also be available.
Teacher & Leadership Programs 7
B uilding a Comprehensive HCM Dashboard
When considering building a comprehensive HCM dashboard, it is important to recognize that different users and audiences are often interested in different performance indicators. Typically, district leaders are concerned with broad outcomes that provide a picture of the overall state of human capital in the district, as well as progress toward key HCM goals, whereas HR staff may be more interested in measures of how well specific HR processes are working and their costs. The dashboard literature refers to dashboards that are designed to present an overall picture of top-level indicators as strategic dashboards, while those aimed at tracking specific processes are called operational dashboards.
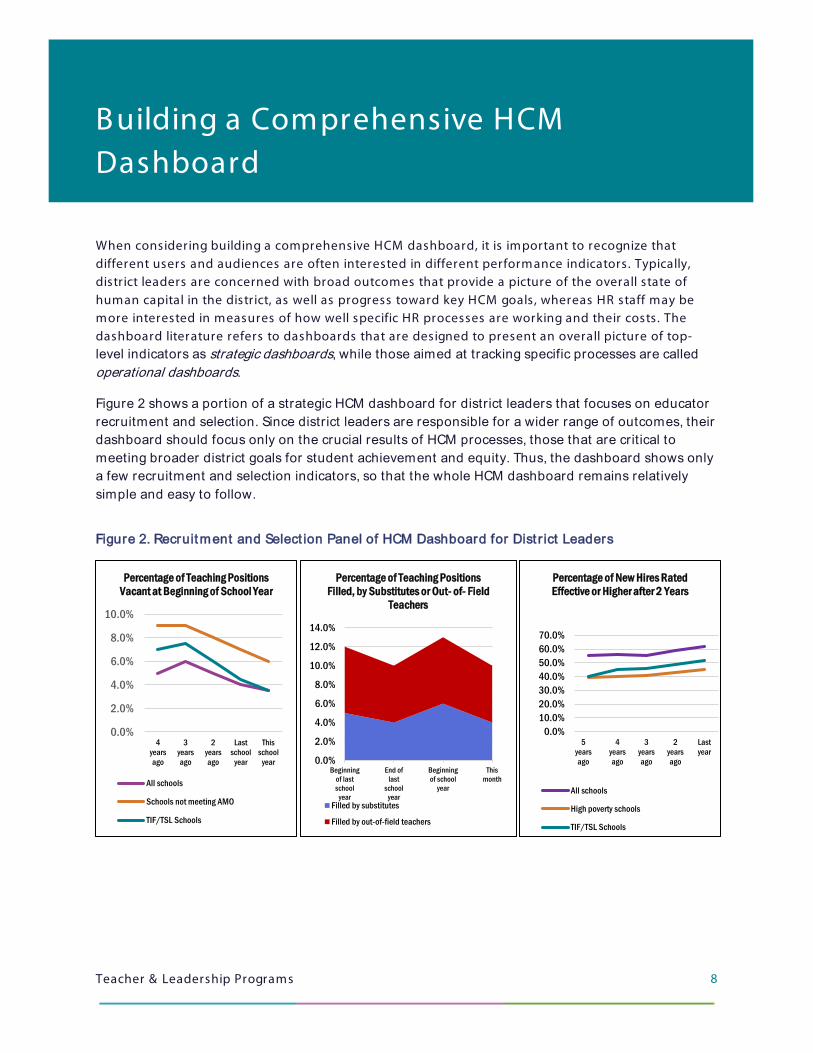
Figure 2 shows a portion of a strategic HCM dashboard for district leaders that focuses on educator recruitment and selection. Since district leaders are responsible for a wider range of outcomes, their dashboard should focus only on the crucial results of HCM processes, those that are critical to meeting broader district goals for student achievement and equity. Thus, the dashboard shows only a few recruitment and selection indicators, so that the whole HCM dashboard remains relatively simple and easy to follow.
Figure 2. Recruitment and Select ion Panel of HCM Dashboard for Dist r ict Leaders
0.0%
2.0%
4.0%
6.0%
8.0%
10.0%
4yearsago
3yearsago
2yearsago
Lastschool
year
Thisschool
year
Percentage of Teaching Positions Vacant at Beginning of School Year
All schools
Schools not meeting AMO
TIF/TSL Schools
0.0%
2.0%
4.0%
6.0%
8.0%
10.0%
12.0%
14.0%
Beginningof lastschool
year
End oflast
schoolyear
Beginningof school
year
Thismonth
Percentage of Teaching Positions Filled, by Substitutes or Out- of- Field
Teachers
Filled by substitutes
Filled by out-of-field teachers
0.0%10.0%20.0%30.0%40.0%50.0%60.0%70.0%
5yearsago
4yearsago
3yearsago
2yearsago
Lastyear
Percentage of New Hires Rated Effective or Higher after 2 Years
All schools
High poverty schools
TIF/TSL Schools
Teacher & Leadership Programs 8

As shown in Figure 2, the dashboard presents three key indicators of how well the district’s recruitment and selection processes are delivering a key resource—qualified and effective teachers—to the district and its schools. The first panel, showing the trend in the percentage of vacant teaching positions at the beginning of the school year, tracks the ability of the HCM process to fill positions on time. The second panel, showing the percentage of positions filled with substitutes or teachers teaching outside their field of certification, tracks how well the HCM system staffs schools with teachers prepared to teach their subjects. The third panel reflects the quality of the hires made, by tracking the proportion of those hired in each year who are later rated as effective or higher on their performance. Note that the choice of two years after the hire as the reference period for performance reflects the possibility that teachers may need time to develop their skills . Some districts may want to consider performance in the initial year or at the end of a probationary period. Though this dashboard includes only three indicators on the main panel, it could be designed to allow the viewer to drill down to the school level or other levels of interest in the district, such as by subject or grade, school performance level, or level of student poverty.
Other key metrics, beyond those for staffing, could focus on other HCM practice areas and important HCM outcomes such as teacher performance and turnover. Table 1 shows examples of possible metrics for the teaching workforce: new teacher induction (onboarding), mentoring, professional development, performance management (teacher evaluation), compensation, and turnover.
Table 1. Potent ial Met r ics for Dist r ict Leader HCM Dashboard
Human capital management function
Potential metric or key performance indicator
Induction Percent of new teachers attending orientation program Percent of new teachers assigned a peer coach for first year
Mentoring Percent of teachers with a mentor assigned Average teacher rating of the effectiveness of their mentor
Professional development
Percent of teachers participating in professional development activities linked to their evaluation results Percent of teachers participating in a professional learning community
Performance management Percent of teachers receiving annual evaluation on time Percent of teachers rated effective or highly effective Percent of teachers meeting student learning objectives
Compensation
Percent of new teachers receiving hiring bonus Average hiring bonus Percent of teachers receiving performance pay Salary as a percent of total operating budget B enefits as a percent of total operating budget
Turnover/retention Retention rate of effective and highly effective teachers Turnover rate of ineffective teachers
Teacher & Leadership Programs 9
Data on the metrics in Table 1 could be collected and reported over multiple time periods, just as for the staffing indicators shown in Figure 1. Also, the dashboard could provide drilldowns or breakouts of the data to allow more nuanced analysis and interpretation of the data. Examples of drilldowns include school/grade level, teacher type (e.g., science, technology, engineering, and mathematics; special education; teacher leader), teacher performance and experience levels, and school performance level.
Teacher & Leadership Programs 10

Example Recruitment Metrics for a Human Capital Management Program Administrator Dashboard
While HCM program administrators are interested in the district leader HCM metrics and their drilldowns, they may find many other specific metrics to be useful for assessing the functioning and cost of specific HR practice areas. Therefore, it would be beneficial for the district to establish HCM metrics and dashboards that would represent KPIs for various HCM practice areas. The system would display these dashboards within the HR department, though the dashboards could be shared out when necessary.
The teacher staffing practice area again can be used to illustrate creation of a specific staffing dashboard. In the example below, there are five KPIs: applicants/vacancy, time to fill a vacancy, rating of overall new hire quality, percentage of applicants from underrepresented groups, and cost per hire. There is also one critical drilldown: the recruitment source from which each applicant was recruited. Table 2 displays the information for this staffing dashboard, along with some hypothetical data, for a given year. These data would be collected and reported over multiple years as well.
Table 2. Met r ics/Key Performance Indicators for Staff ing Dashboard
Recruitment source
Metric/key performance indicator
Application-to-vacancy
ratio Time to fill
(Days)
Average quality of applicant
Percent of applicants
from under- represented
groups Cost per
hire Internal transfer 3.1 45 4.0 8% $1,100 Direct contact with applicant
1.0 35 4.9 15% $2,700
Job fair 4.2 50 3.3 25% $5,600 Print ads 2.1 54 2.6 22% $3,400 Internet ads 25.7 37 3.9 33% $3,100 Social networks 10.9 40 2.8 20% $2,600 Employee referrals 1.4 38 4.8 30% $1,500 Teacher preparation program placement offices
38.8 55 4.4 25% $5,800
Internships/student teaching
1.5 22 4.9 40% $1,500
Teacher & Leadership Programs 11
An inspection of the data in Table 2 shows that for any KPI, there are large differences among the various recruitment sources. So how might the HR leader use these data? A major use would be in the development of a staffing plan for the next hiring cycle. B ased on their performance, certain recruitment sources could possibly be dropped or modified to improve their performance. For example, due to job fairs ’ subpar performance as a recruitment source, HR leaders might decide to discontinue job fairs altogether, or hold fewer of them (thus reducing total cost), hold them in new locations where there is likely to be more applicant interest (thus increasing applicants/reducing vacancy), or be more selective at the job fair itself in determining which attendees to interview further.
Staff could construct similar practice-area specific dashboards for each of the other HCM areas, including induction and mentoring, professional development, performance management, and turnover/retention.
Teacher & Leadership Programs 12

Steps in Developing an HCMS Dashboard
Since dashboards are widely used in many sectors for performance management and reports , there are many books and internet resources available that provide guidance on various aspects of dashboard development. We reviewed a wide range of these resources and have distilled the process down to the 12 steps described in this section.
1. Define the audience for the dashboard and its purposes. As mentioned above, strategic dashboards, often designed for district leaders, would present different performance indicators or metrics than operational dashboards designed for HR staff or school leaders. Top leaders are responsible for successful implementation of strategy. Their dashboard should focus on a relatively small set of HCM measures that are most directly relevant to achieving the district’s strategic goals. HR staff need a broader and deeper view. They need to track the key systems that drive the HCM measures.
2. Involve potential users in the development process. Involving other users early helps to surface potential problems with usability as well as to ensure that metrics or indicators are credible, relevant, and actionable. It also provides a communications channel about the project and develops a base of potential supporters.
3. Select the metrics (also called key performance indicators, or KPIs). KPIs should represent factors that the users can influence or control (are “actionable”), are related to the purposes and interests of the intended audience, and are based on valid data that are obtainable at reasonable cost. Limit the number of metrics or KPIs to be included. Many resources recommend 5 to 10, and rarely more than 15 for a strategic dashboard. Information on additional metrics could be provided by linking some of the KPIs to more detailed operational dashboards that track the processes that produce the results. To keep the dashboard usable, do not include something as a KPI just because you have the data. Box 1 provides some suggestions for ways to begin developing KPIs and some resources for identifying KPIs.
4. Determine where data underlying the KPIs will come from, how they will be collected, and how often they will be updated. Much KPI data will come from existing data systems, but some important KPIs may require new data collection systems or changes to current data collection routines. For example, to track the effectiveness of recruitment efforts, you may want to assess the quality of applicants for vacant teaching positions. This could require developing and administering a survey of principals that asks them to assess the quality of those they interview.
Teacher & Leadership Programs 13

Box 1: Get t ing St ar t ed on Ident ifying Key Per form ance Indicat ors
Deciding on KPIs requires an in-dept h considerat ion of not only how t he inform at ion w il l be used, but also what indicat ors w il l be needed t o present an accurat e pict ure of how t he HCMS is work ing t o achieve t he organizat ion’s goals. One way t o begin is t o int erview key users t o f ind out what t hey w ould f ind useful, w hat t heir HCM goals are, and w hat processes and syst em s cont r ibut e t o m eet ing t hese goals. It m ay be useful t o review docum ent s such as t he dist r ict ’s st rat egic plan and t he logic m odel for your TIF/ Teacher and School Leader (TSL) project . It can also be useful t o use som e of t he t ools of cont inuous im provem ent t o ident ify t he causes and dr ivers of HCM out com es t hat could be t racked. (For exam ples, see t he TIF Whit e Paper A Primer for Cont inuous Improvement in Schools and Dist r ict s at ht t ps:/ /www.t ifcom m unit y.org/ resources/pr im er -cont inuous-im provem ent -schools-and-dist r ict s.)
You m ay also want t o consult t he fol low ing resources t o get ideas for HCM KPIs:
Books Fit z-Ens, J. (2002). How to measure human resource management (3rd ed.). NY: McGraw-Hil l .
Henem an, H., III., Judge, T., & Kam m eyer -Mueller , J. (2017). Staff ing organizat ions (9t h ed., Chapt ers 13-14). Bost on, MA: McGraw-Hil l .
Huselid, M. A., Becker , B. E., & Beat t y, R. W. (2005). The workforce scorecard. Bost on, MA: Harvard Business School Press.
TIF/TSL br iefs Finst er , M. (2015). Ident ifying, m onit or ing, and benchm ark ing t eacher ret ent ion and t urnover : Guidelines for TIF grant ees: ht t ps:/ /www.t ifcom m unit y.org/ resources/ ident ifying-m onit or ing-and-benchm ark ing-t eacher -ret ent ion-and-t urnover -guidelines-t i f
Websit es/ t ools Societ y for Hum an Resource Managem ent : ht t ps:/ /www.shrm .org/ resourcesandt ools/ t ools-and-sam ples/ t oolk it s/ pages/ benchm ark inghum ancapit alm et r ics.aspx
Am er ican Product ivit y and Qualit y Cent er : ht t ps:/ /www.apqc.org/ hum an-capit al-m anagem ent
CHS All iance ht t p:/ /www.chsall iance.org/ f i les/ f i les/Resources/Tools-and-guidance/CHS-All iance-HR-m et r ics-dashboard-t oolk it .pdf
Deloit t e ht t ps:/ /www2.deloit t e.com /cont ent / dam /Deloit t e/us/Docum ent s/hum an-capit al / us-hc-enabling-business-result s-w it h-hr -m easures-t hat -m at t er .pdf
Rem em ber t hat KPIs do not need t o be adopt ed all at once. It m ay be bet t er t o begin w it h a sm all set t hat users w ould f ind of high int erest and for which you can get valid dat a. You can t hen add indicat ors t o cover m ore aspect s of t he HCM syst em as dat a capacit y increases and users ident ify addit ional out com es or processes of in t erest or im por t ance.
Teacher & Leadership Programs 14
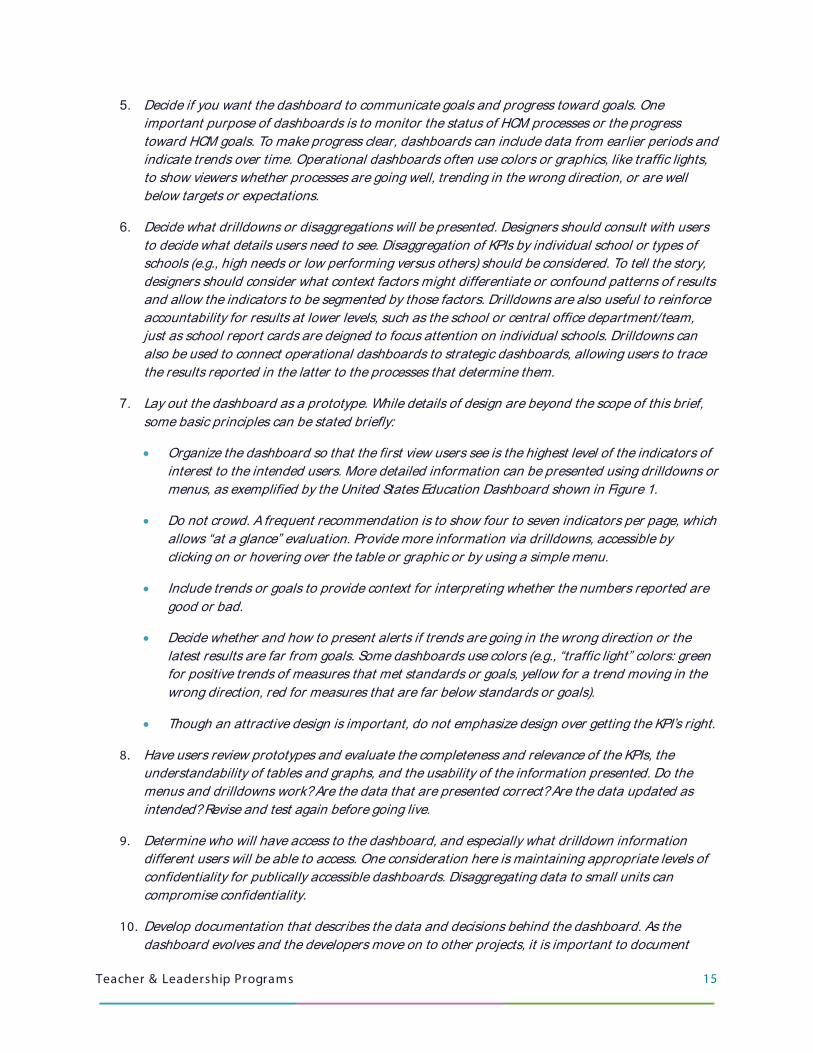
5. Decide if you want the dashboard to communicate goals and progress toward goals. One important purpose of dashboards is to monitor the status of HCM processes or the progress toward HCM goals. To make progress clear, dashboards can include data from earlier periods and indicate trends over time. Operational dashboards often use colors or graphics, like traffic lights, to show viewers whether processes are going well, trending in the wrong direction, or are well below targets or expectations.
6. Decide what drilldowns or disaggregations will be presented. Designers should consult with users to decide what details users need to see. Disaggregation of KPIs by individual school or types of schools (e.g., high needs or low performing versus others) should be considered. To tell the story, designers should consider what context factors might differentiate or confound patterns of results and allow the indicators to be segmented by those factors. Drilldowns are also useful to reinforce accountability for results at lower levels, such as the school or central office department/team, just as school report cards are deigned to focus attention on individual schools. Drilldowns can also be used to connect operational dashboards to strategic dashboards, allowing users to trace the results reported in the latter to the processes that determine them.
7. Lay out the dashboard as a prototype. While details of design are beyond the scope of this brief, some basic principles can be stated briefly:
• Organize the dashboard so that the first view users see is the highest level of the indicators of interest to the intended users. More detailed information can be presented using drilldowns or menus, as exemplified by the United States Education Dashboard shown in Figure 1.
• Do not crowd. A frequent recommendation is to show four to seven indicators per page, which allows “at a glance” evaluation. Provide more information via drilldowns, accessible by clicking on or hovering over the table or graphic or by using a simple menu.
• Include trends or goals to provide context for interpreting whether the numbers reported are good or bad.
• Decide whether and how to present alerts if trends are going in the wrong direction or the latest results are far from goals. Some dashboards use colors (e.g., “traffic light” colors: green for positive trends of measures that met standards or goals, yellow for a trend moving in the wrong direction, red for measures that are far below standards or goals).
• Though an attractive design is important, do not emphasize design over getting the KPI’s right.
8. Have users review prototypes and evaluate the completeness and relevance of the KPIs, the understandability of tables and graphs, and the usability of the information presented. Do the menus and drilldowns work? Are the data that are presented correct? Are the data updated as intended? Revise and test again before going live.
9. Determine who will have access to the dashboard, and especially what drilldown information different users will be able to access. One consideration here is maintaining appropriate levels of confidentiality for publically accessible dashboards. Disaggregating data to small units can compromise confidentiality.
10. Develop documentation that describes the data and decisions behind the dashboard. As the dashboard evolves and the developers move on to other projects, it is important to document
Teacher & Leadership Programs 15

what data go into the KPIs, where the data come from, how often they are updated, why the KPI was chosen for presentation, how the indicator was calculated, and any cautions on the validity or interpretation of the data.
11. Roll out, communicate purpose, train, and monitor usage. Inform potential users who have not been part of the development process about what the dashboard contains and train them on how to access, navigate, and interpret the information it provides, especially if trends are shown. It may also be necessary to produce a short video clip showing how the dashboard works and how to use it to monitor, analyze, and understand HCM processes and outcomes. After the dashboard goes live, monitor who accesses it and what menu options or drilldowns are used to get a better sense of whom the audience really is, and identify KPIs that are not of interest and could be replaced.
12. Be prepared to change after the dashboard goes live. Experts suggest that once dashboards are up and running and users begin to use the data for program management, they will come up with additional indicators and breakouts or find some indicators less useful. Plan for a review of the dashboard with a sample of users after the initial rollout. Review the dashboard annually thereafter. Some indicators may become less important, and new ones may emerge as the district and its HCMS evolve.
Teacher & Leadership Programs 16
Conclusion
This brief provided an overview of the purpose, scope, and key decisions that need to be made to begin to develop an HCM dashboard. The 12 steps presented also apply to just about any dashboard project. If developing a comprehensive HCM dashboard appears daunting, it is also possible to start small, concentrating at first on one or two HCM activities. Given the central importance of assessing educator performance, TIF and TSL grantees might consider beginning with strategic dashboards that report on performance distributions, equitable access to effective educators, and the relationship between performance and compensation. Another natural starting point may be operational dashboards that track process completeness (e.g., the number of educators observed the required number of times, the proportion receiving written feedback or a post-conference) and evaluation results use (e.g., the number engaging in professional development related to areas in need of improvement, percentage of teachers rated less than effective who improved their performance in the subsequent year).
Whether starting small or aiming to be comprehensive, dashboards have great potential to help program managers understand whether specific components of the HCMS are being implemented as intended, and whether the HCM initiatives are succeeding in attracting, developing, and retaining educators with the competencies to achieve broader goals for equity and student learning. A dashboard can also help communicate about the project to district leaders and key stakeholders. Additionally, constructing a dashboard can be another opportunity for TIF and TSL grantees to think through what specific HCM results they want their grant-supported activities to accomplish.
Teacher & Leadership Programs 17