introduction to insurance rating and reserving.pdf
TRANSCRIPT

Introduction to insurance rating and claims reserving
Presented to The Lloyd’s Marine U35 Group
by
Ana Mata, PhD, ACAS
Managing Director and Actuary
London, June 2014
Matβlas Underwriting and Actuarial Consulting, Training and Research

Introduction to insurance rating and claims reserving
Copyright © 2014 by MatBlas Limited. All rights reserved
No part of this publication may be reproduced, stored in a retrieval system or transmitted in any form or by any means,
electronic, mechanical, photocopying, recording, scanning or otherwise, without prior written permission by MatBlas
Limited.
Disclaimer: This presentation has been prepared for educational purpose only. It should only be used for reference
purposes for those attending or that have attended the presentation. The content of this note is theoretical in nature and
exclusively prepared for training purposes. No part of the content of this course material constitutes actuarial advice for
any company or organization. All worked examples shown in this note were derived from hypothetical assumptions only
and do not reflect any company’s rates, rating factors, benchmark factors, loss experience or reporting processes. Any
similarity between these examples and any insurance company is coincidental only.

Copyright © by Matβlas. All rights reserved 3
Agenda
What is insurance rating?
Technical pricing with UMS
Pricing considerations for some marine lines
Basics of claims reserving

WHY ME?
WHY THIS?
WHY NOW?
WHAT NOW?
Traditional underwriting
Look at the
policy, rate it and
agree to write it
or not.
Agreed price
only record.
Common workflow today
“Modelling” each risk
Technical pricing
Lloyd’s benchmark
Loss ratios by policy
Rate monitoring (PMD)
Business planning
Extremely competitive
market!
4
Challenges faced by underwriters
Copyright © by Matβlas. All rights reserved 5
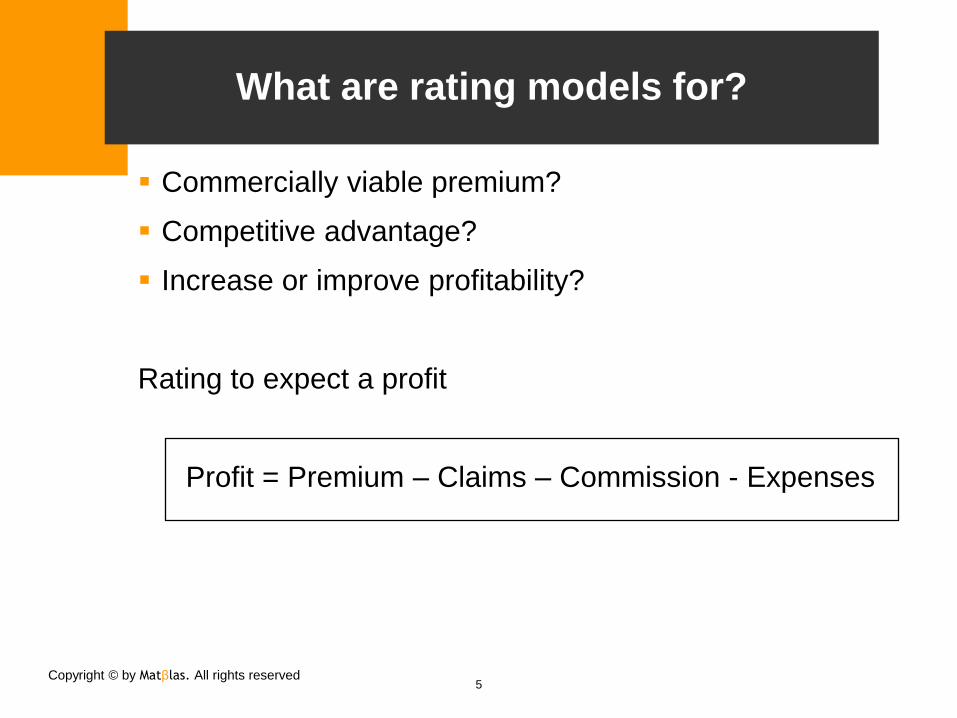
What are rating models for?
Commercially viable premium?
Competitive advantage?
Increase or improve profitability?
Rating to expect a profit
Profit = Premium – Claims – Commission - Expenses

Copyright © by Matβlas. All rights reserved 6
Rating is about forecasting claims costs
Product: promise to indemnify the policyholder if
An insured event happens
Policyholder incurs damages as a result
Production cost = cost of actual claims paid
Final cost per policy not known in advance
Years before known
Expected claim costs can be estimated

Copyright © by Matβlas. All rights reserved 7
What is the expected claim cost?
The expected claim cost of a policy is the
average claim cost across all possible future
claims and across policyholders
Expected claim cost = frequency x severity

Copyright © by Matβlas. All rights reserved 8
The expected claim cost: hypothetical example
Each vessel 1% chance of a loss
Each vessel worth £10M (Insured Value)
Assume each loss is total
Frequency = 1%
Severity = £10M
Expected claim cost = 1% x £10M = £100k

9
From claim cost to premium
1. Start by calculating the expected loss cost or risk
premium (frequency and severity)
This is the amount needed to cover average
claims costs
2. Other costs (usually a % of premium):
Contingency factor or risk load
Operating costs
Distribution costs
Underwriting profit or ROE
3. Derive the premium rate per unit of exposure

Copyright © by Matβlas. All rights reserved 10
Key relationship between premium and claim cost
Expected loss ratio (ELR) = loss ratio before
claims reported
Ultimate loss ratio (ULR) = loss ratio when
claims are settled and paid
Premium
Cost Claim ExpectedELR
Premium
Paid Claims ActualULR

Copyright © by Matβlas. All rights reserved 11
Technical pricing
Technical or Benchmark premium
Premium that is expected to generate a certain pre-selected
expected loss ratio (and thus profits)
Premium Technical
Cost Claim ExpectedELR
ELR
Cost Claim ExpectedPremium Technical
Copyright © by Matβlas. All rights reserved 12
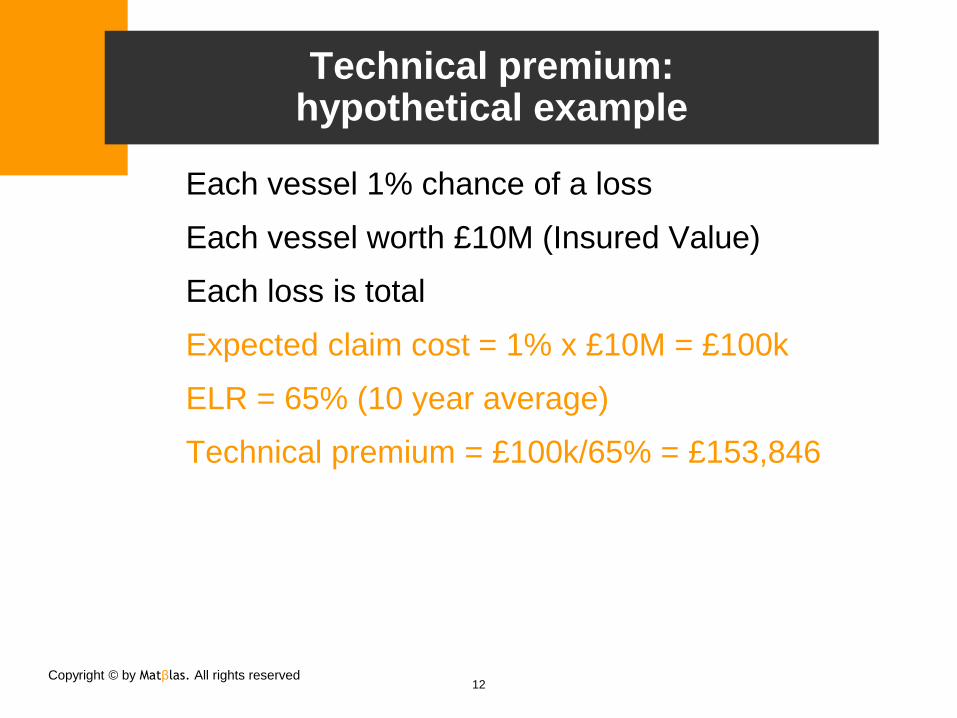
Technical premium: hypothetical example
Each vessel 1% chance of a loss
Each vessel worth £10M (Insured Value)
Each loss is total
Expected claim cost = 1% x £10M = £100k
ELR = 65% (10 year average)
Technical premium = £100k/65% = £153,846

Copyright © by Matβlas. All rights reserved 13
Common approach to comply with underwriting minimum standards (UMS)
Technical premium
Premium that is expected to support a selected long term ELR
Benchmark premium for Lloyd’s
Premium that is expected to support the business plan (short
term) ELR
“Walk-away” or break even premium
Premium that covers expected claim costs and expenses
without profits (100% combined ratio)
Charged premium
Premium actually charged for the policy and that appears on
the slip

Copyright © by Matβlas. All rights reserved 14
Premiums and loss ratios: hypothetical example
Expected claim cost = £100k; expenses = 10% of premium
Long term ELR = 65%
2014 BP ELR = 80%
“Break even” ELR = 90%
Agreed premium = £140k
TP = £100k/65% = £153.8k
Lloyd’s BP = £100k/80% = £125k
“Walk-away” prem. = £100/90%
= £111k
IELR = 100k/140k = 71.4%
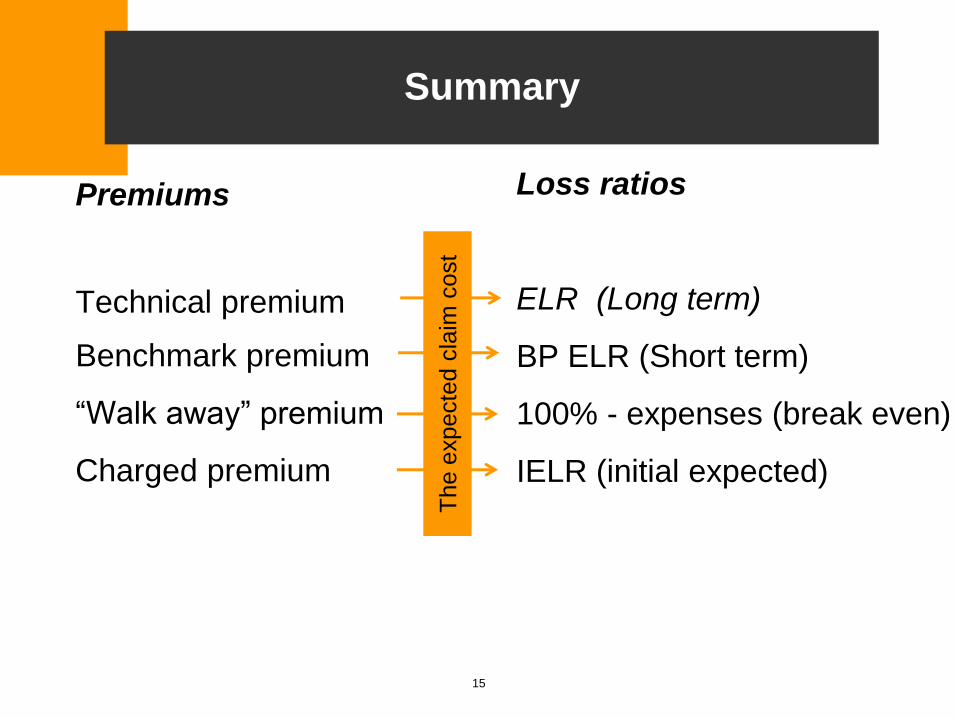
Summary
Premiums
Technical premium
Benchmark premium
“Walk away” premium
Charged premium
Loss ratios
ELR (Long term)
BP ELR (Short term)
100% - expenses (break even)
IELR (initial expected)
15
The e
xpecte
d c
laim
cost
Copyright © by Matβlas. All rights reserved
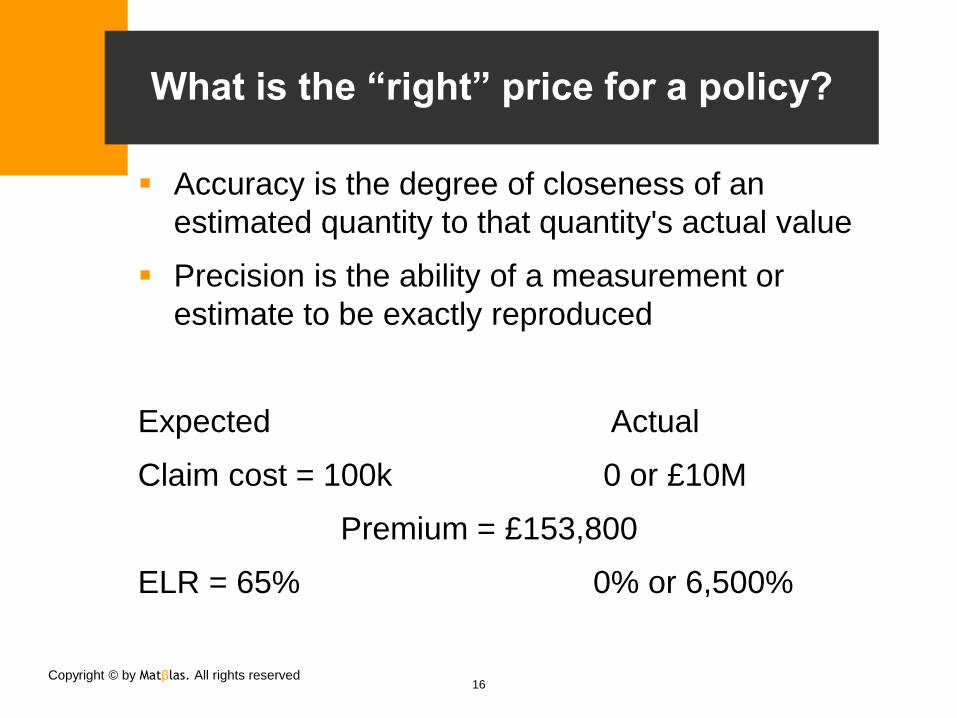
What is the “right” price for a policy?
Accuracy is the degree of closeness of an
estimated quantity to that quantity's actual value
Precision is the ability of a measurement or
estimate to be exactly reproduced
Expected Actual
Claim cost = 100k 0 or £10M
Premium = £153,800
ELR = 65% 0% or 6,500%
16

Copyright © by Matβlas. All rights reserved
What is the “right” price for each year?
100 policies same risk profile, same premium
collected
Expect 1 claim per year
17
Year
Tech. Premium
(£M) No. losses Losses (£M) ULR
1 15.38 1 10 65.00%
2 15.38 0 0 0.00%
3 15.38 0 0 0.00%
4 15.38 2 20 130.00%
5 15.38 0 0 0.00%
6 15.38 0 0 0.00%
7 15.38 4 40 260.00%
8 15.38 0 0 0.00%
9 15.38 1 10 65.00%
10 15.38 2 20 130.00%
65.00%10 year average loss ratio
The law of
large numbers
is about long
term averages
18
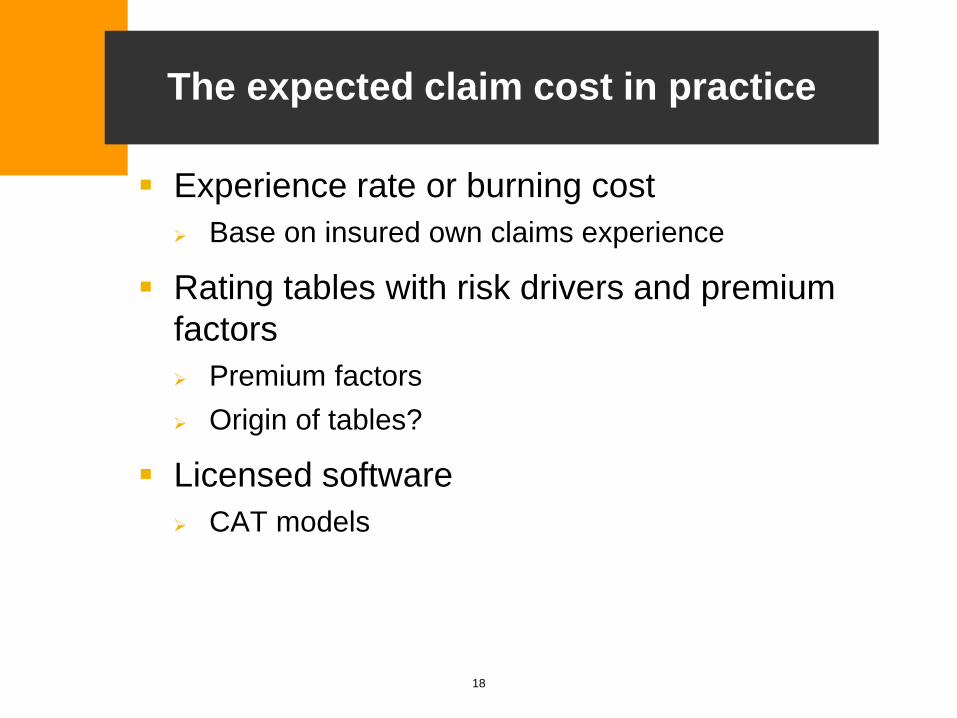
The expected claim cost in practice
Experience rate or burning cost
Base on insured own claims experience
Rating tables with risk drivers and premium
factors
Premium factors
Origin of tables?
Licensed software
CAT models
19
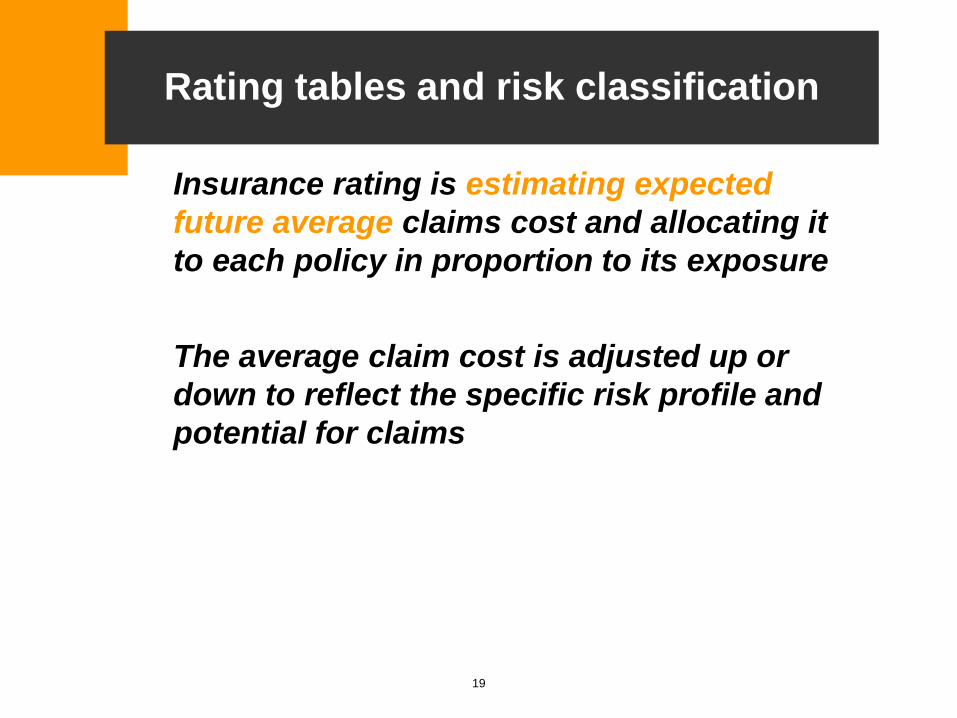
Rating tables and risk classification
Insurance rating is estimating expected
future average claims cost and allocating it
to each policy in proportion to its exposure
The average claim cost is adjusted up or
down to reflect the specific risk profile and
potential for claims

Copyright © by Matβlas. All rights reserved
In an ideal but no utopian world
Rating tables should be derived from claim
experience
Very few are!
Rating factors must reflect differences in
expected claim costs - risk
It can be and has been done
Market data can be bought for some lines, e.g.
Marine Hull
20
Copyright © by Matβlas. All rights reserved
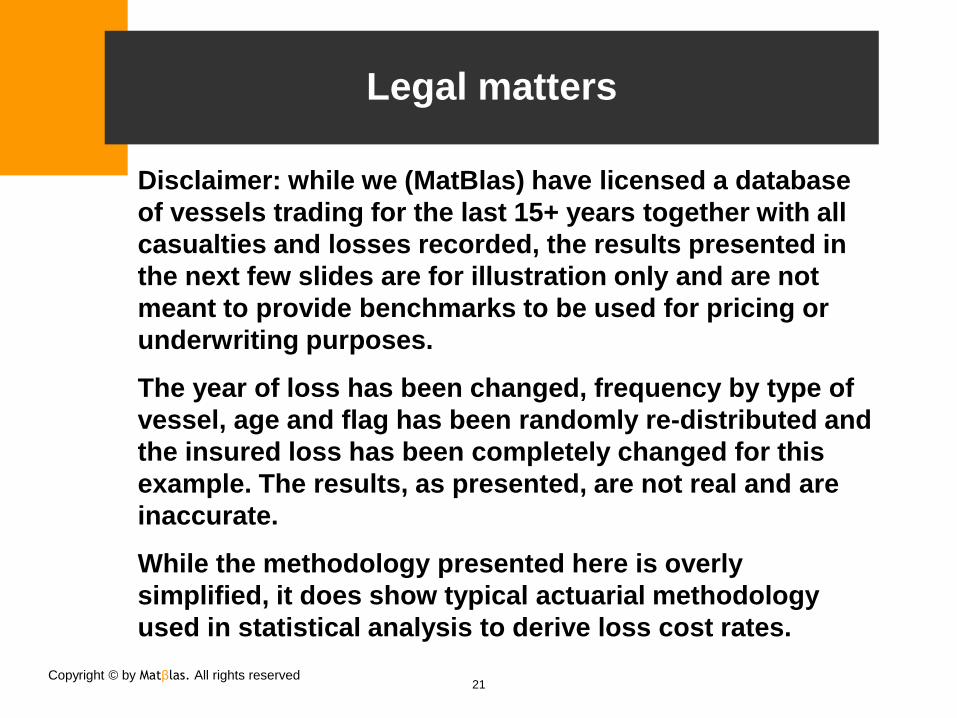
Legal matters
Disclaimer: while we (MatBlas) have licensed a database
of vessels trading for the last 15+ years together with all
casualties and losses recorded, the results presented in
the next few slides are for illustration only and are not
meant to provide benchmarks to be used for pricing or
underwriting purposes.
The year of loss has been changed, frequency by type of
vessel, age and flag has been randomly re-distributed and
the insured loss has been completely changed for this
example. The results, as presented, are not real and are
inaccurate.
While the methodology presented here is overly
simplified, it does show typical actuarial methodology
used in statistical analysis to derive loss cost rates.
21
Copyright © by Matβlas. All rights reserved
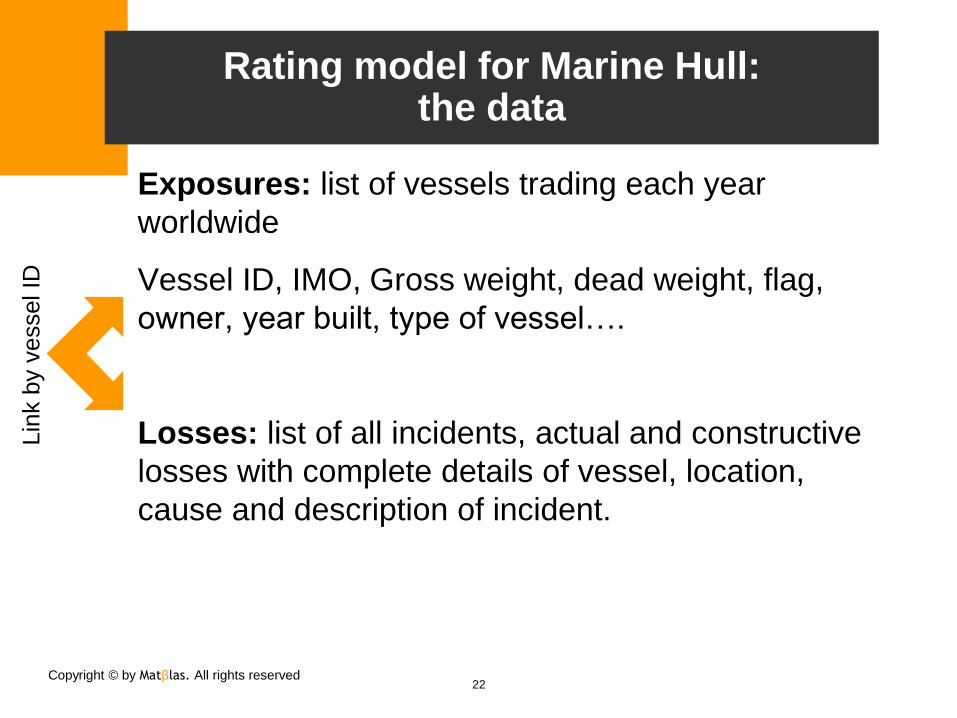
Rating model for Marine Hull: the data
Exposures: list of vessels trading each year
worldwide
Vessel ID, IMO, Gross weight, dead weight, flag,
owner, year built, type of vessel….
Losses: list of all incidents, actual and constructive
losses with complete details of vessel, location,
cause and description of incident.
22
Lin
k b
y v
essel ID
Copyright © by Matβlas. All rights reserved
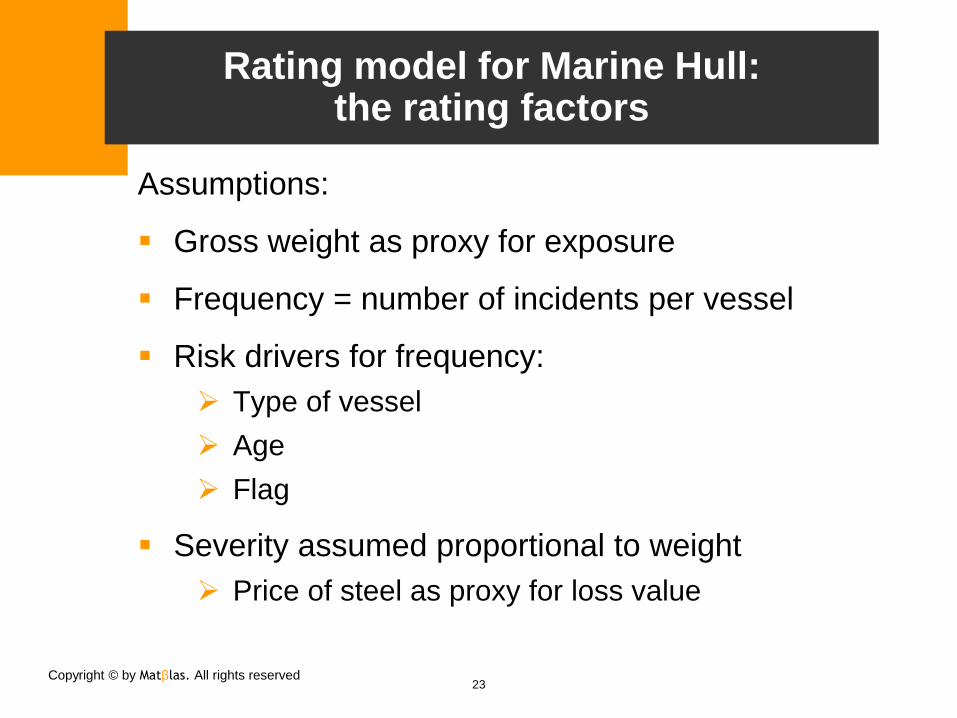
Rating model for Marine Hull: the rating factors
Assumptions:
Gross weight as proxy for exposure
Frequency = number of incidents per vessel
Risk drivers for frequency:
Type of vessel
Age
Flag
Severity assumed proportional to weight
Price of steel as proxy for loss value
23
Copyright © by Matβlas. All rights reserved
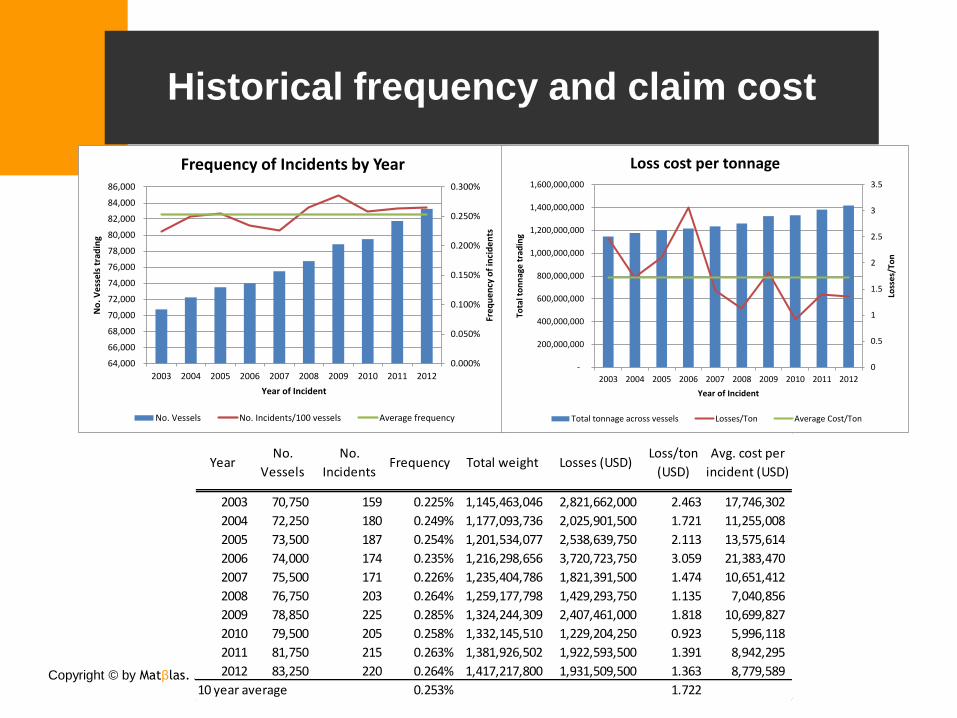
Historical frequency and claim cost
24
0.000%
0.050%
0.100%
0.150%
0.200%
0.250%
0.300%
64,000
66,000
68,000
70,000
72,000
74,000
76,000
78,000
80,000
82,000
84,000
86,000
2003 2004 2005 2006 2007 2008 2009 2010 2011 2012
Fre
qu
en
cy o
f in
cid
en
ts
No
. Ve
sse
ls t
rad
ing
Year of Incident
Frequency of Incidents by Year
No. Vessels No. Incidents/100 vessels Average frequency
0
0.5
1
1.5
2
2.5
3
3.5
-
200,000,000
400,000,000
600,000,000
800,000,000
1,000,000,000
1,200,000,000
1,400,000,000
1,600,000,000
2003 2004 2005 2006 2007 2008 2009 2010 2011 2012
Loss
es/
Ton
Tota
l to
nn
age
tra
din
g
Year of Incident
Loss cost per tonnage
Total tonnage across vessels Losses/Ton Average Cost/Ton
YearNo.
Vessels
No.
IncidentsFrequency Total weight Losses (USD)
Loss/ton
(USD)
Avg. cost per
incident (USD)
2003 70,750 159 0.225% 1,145,463,046 2,821,662,000 2.463 17,746,302
2004 72,250 180 0.249% 1,177,093,736 2,025,901,500 1.721 11,255,008
2005 73,500 187 0.254% 1,201,534,077 2,538,639,750 2.113 13,575,614
2006 74,000 174 0.235% 1,216,298,656 3,720,723,750 3.059 21,383,470
2007 75,500 171 0.226% 1,235,404,786 1,821,391,500 1.474 10,651,412
2008 76,750 203 0.264% 1,259,177,798 1,429,293,750 1.135 7,040,856
2009 78,850 225 0.285% 1,324,244,309 2,407,461,000 1.818 10,699,827
2010 79,500 205 0.258% 1,332,145,510 1,229,204,250 0.923 5,996,118
2011 81,750 215 0.263% 1,381,926,502 1,922,593,500 1.391 8,942,295
2012 83,250 220 0.264% 1,417,217,800 1,931,509,500 1.363 8,779,589
10 year average 0.253% 1.722

Copyright © by Matβlas. All rights reserved
Historical frequency by age of vessel
25
Age range No. Vessels No. Incidents Frequency
0-1 40,933 16 0.039%
2-3 39,803 21 0.053%
4-5 39,529 26 0.066%
6-7 41,000 37 0.090%
8-9 44,621 46 0.103%
10-14 127,744 178 0.139%
15-19 139,293 397 0.285%
20-24 115,594 460 0.398%
22-29 73,955 328 0.444%
30+ 103,628 430 0.415%
Total 766,100 1,939 0.253%0.000%
0.050%
0.100%
0.150%
0.200%
0.250%
0.300%
0.350%
0.400%
0.450%
0.500%
-
20,000
40,000
60,000
80,000
100,000
120,000
140,000
160,000
0-1 2-3 4-5 6-7 8-9 10-14 15-19 20-24 22-29 30+
Fre
qu
en
cy o
f in
cid
en
ts
No
. Ve
sse
ls t
rad
ing
Age of vessel
Frequency of Incidents by Age
No. Vessels Frequency by age Average frequency

Copyright © by Matβlas. All rights reserved
Historical frequency by type of vessel
26
0.000%
0.050%
0.100%
0.150%
0.200%
0.250%
0.300%
0.350%
0.400%
0
50,000
100,000
150,000
200,000
250,000
300,000
350,000
Fre
qu
en
cy o
f in
cid
en
ts
No
. Ve
sse
ls t
rad
ing
Type of vessel
Frequency of Incidents by Type
No. Vessels Frequency by type Average frequency
Type No. Vessels No. Incidents Frequency
Bulk 59,394 162 0.273%
Dredger 9,571 9 0.094%
Fishing 115,672 397 0.343%
Gas 11,344 20 0.176%
General Cargo 288,967 975 0.337%
Passenger 40,215 73 0.182%
Research 9,604 7 0.073%
Tanker 84,226 138 0.164%
Tug 103,676 92 0.089%
Vehicle 43,431 66 0.152%
Total 766,100 1,939 0.253%
Copyright © by Matβlas. All rights reserved
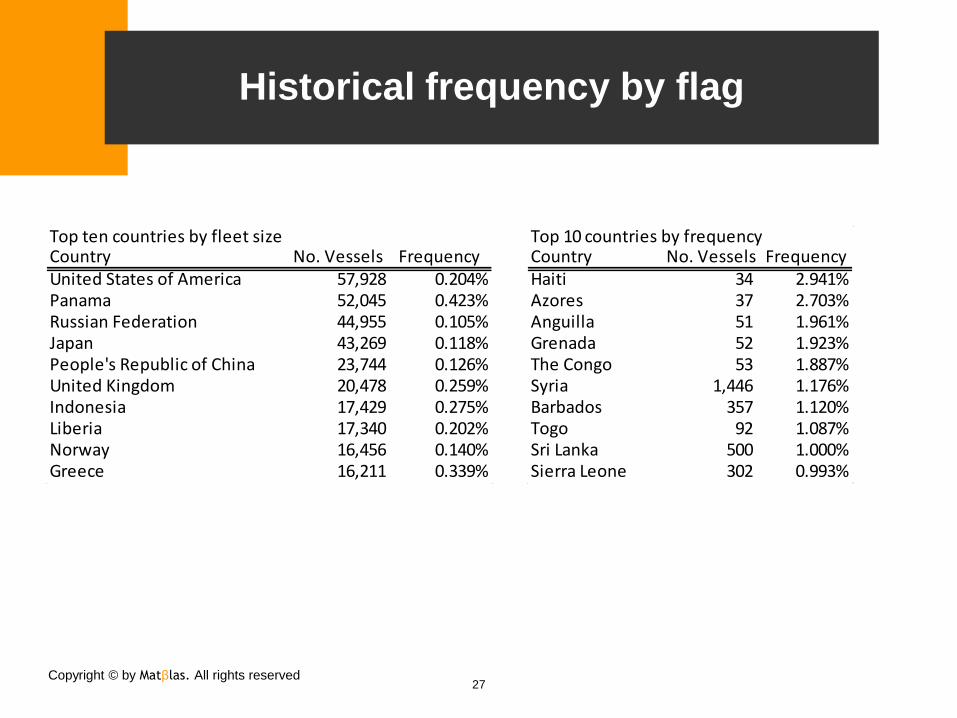
Historical frequency by flag
27
Top ten countries by fleet sizeCountry No. Vessels FrequencyUnited States of America 57,928 0.204%Panama 52,045 0.423%Russian Federation 44,955 0.105%Japan 43,269 0.118%People's Republic of China 23,744 0.126%United Kingdom 20,478 0.259%Indonesia 17,429 0.275%Liberia 17,340 0.202%Norway 16,456 0.140%Greece 16,211 0.339%
Top 10 countries by frequencyCountry No. Vessels FrequencyHaiti 34 2.941%Azores 37 2.703%Anguilla 51 1.961%Grenada 52 1.923%The Congo 53 1.887%Syria 1,446 1.176%Barbados 357 1.120%Togo 92 1.087%Sri Lanka 500 1.000%Sierra Leone 302 0.993%

Copyright © by Matβlas. All rights reserved
A simple marine hull model
Average cost/ton = $1.72, Long term ELR = 70%
Rate/ton = $2.45 (technical rate)
Rate for newly built passenger cruise in Greece
$0.364/ton 28
Type Load/Discount
Bulk 7.77%
Dredger -62.85%
Fishing 35.60%
Gas -30.34%
General Cargo 33.31%
Passenger -28.28%
Research -71.20%
Tanker -35.26%
Tug -64.94%
Vehicle -39.96%
Country Load/discountUnited States of America -19.52%Panama 67.01%Russian Federation -58.69%Japan -53.43%People's Republic of China -50.08%United Kingdom 2.26%Indonesia 8.81%Liberia -20.25%Norway -44.78%Greece 34.05%. .. .
. .
Age range Load/discount
0-1 -84.56%
2-3 -79.15%
4-5 -74.01%
6-7 -64.34%
8-9 -59.27%
10-14 -44.95%
15-19 12.61%
20-24 57.23%
22-29 75.23%
30+ 63.95%

Copyright © by Matβlas. All rights reserved
Why is not everyone doing this? Commonly heard excuses
I am happy with my model rates
Back tested?
Downloading from websites to cut and paste
too much work
Websites can transfer data to Excel
Data in pdf
Tools can convert to Excel
Large fleets too much work
Pre-rate and search by insured name (owner)
29
Copyright © by Matβlas. All rights reserved
Typical approach
1st choice would be NOT to model
Often an admin after binding
But UMS not optional
Models built from underwriters’ anecdotal
experience and class performance
Back into an expected loss cost from premium
and ELR
Expected claim cost = Model premium x ELR
30

Copyright © by Matβlas. All rights reserved
Is not that simple!
True!
Models are tools not decision makers
Some classes difficult or impossible to rate
War and terrorism
Consistent models can streamline inefficient
workflows
31

Basics of claims reserving

Copyright © by Matβlas. All rights reserved 33
Pricing and reserving
Start YOA with business plan ELR for class
For each unit of premium set aside ELR% as
reserve
Each individual policy priced with IELR
Aggregate IELR across policies
Allows to validate business plan
Copyright © by Matβlas. All rights reserved 34
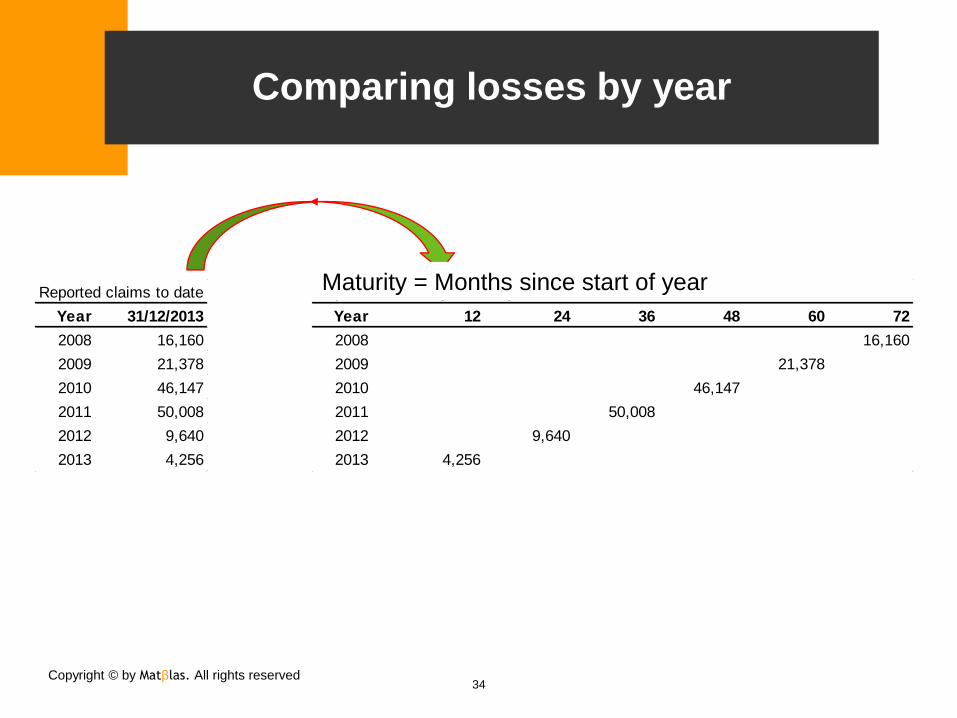
Comparing losses by year
Reported claims to date
Year 31/12/2013
2008 16,160
2009 21,378
2010 46,147
2011 50,008
2012 9,640
2013 4,256
Reported claims by "maturity"
Year 12 24 36 48 60 72
2008 16,160
2009 21,378
2010 46,147
2011 50,008
2012 9,640
2013 4,256
Maturity = Months since start of year

Copyright © by Matβlas. All rights reserved 35
Basic definitions
Paid = amount paid to or on behalf of policy holder
Outstanding or case reserve = amount allocated to
specific claim and held as reserve (not yet paid)
Incurred = paid + case reserve
IBNR = Incurred but not reported (held as reserve)
IBNER = incurred but not enough reported (held
as reserve)

Copyright © by Matβlas. All rights reserved 36
Actuarial estimates of future claims movements
Reported claims to date
Year 31/12/2013
2008 16,160
2009 21,378
2010 46,147
2011 50,008
2012 9,640
2013 4,256
Reported claims by "maturity"
Year 12 24 36 48 60 72
2008 1,688 6,340 13,472 13,203 15,117 16,160
2009 1,165 7,527 15,038 21,926 21,378
2010 2,549 8,814 27,816 46,147
2011 3,565 16,747 50,008
2012 3,760 9,640
2013 4,256
Copyright © by Matβlas. All rights reserved 37
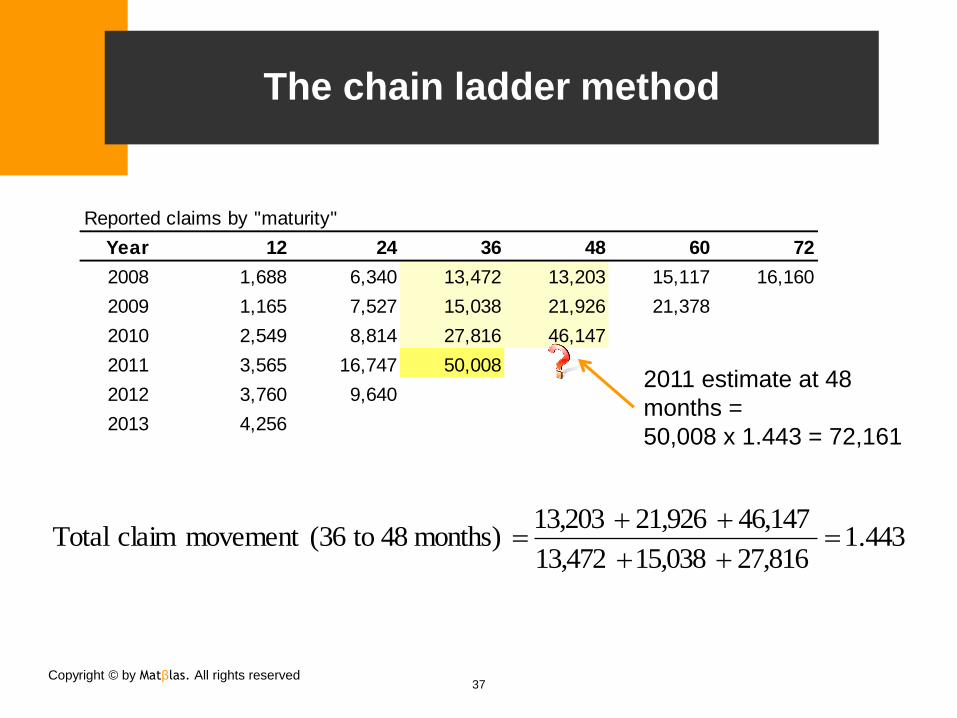
The chain ladder method
Reported claims by "maturity"
Year 12 24 36 48 60 72
2008 1,688 6,340 13,472 13,203 15,117 16,160
2009 1,165 7,527 15,038 21,926 21,378
2010 2,549 8,814 27,816 46,147
2011 3,565 16,747 50,008
2012 3,760 9,640
2013 4,256
443.127,81615,03813,472
46,14721,92613,203 months) 48 to(36movement claim Total
2011 estimate at 48
months =
50,008 x 1.443 = 72,161
Copyright © by Matβlas. All rights reserved 38
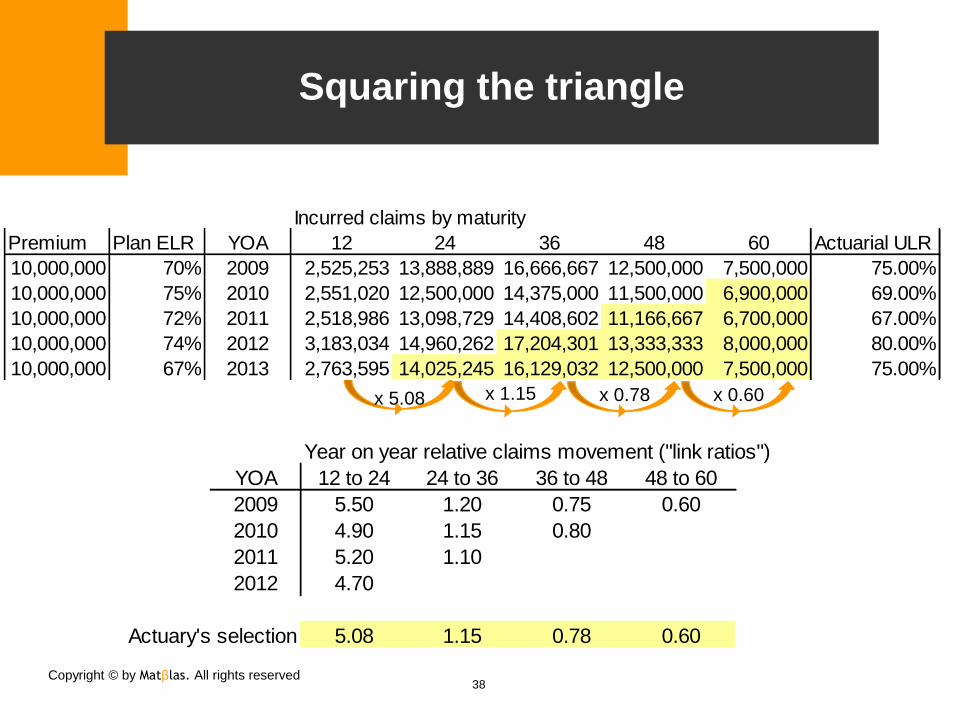
Squaring the triangle
Year on year relative claims movement ("link ratios")
YOA 12 to 24 24 to 36 36 to 48 48 to 60
2009 5.50 1.20 0.75 0.60
2010 4.90 1.15 0.80
2011 5.20 1.10
2012 4.70
Actuary's selection 5.08 1.15 0.78 0.60
Incurred claims by maturity
Premium Plan ELR YOA 12 24 36 48 60 Actuarial ULR
10,000,000 70% 2009 2,525,253 13,888,889 16,666,667 12,500,000 7,500,000 75.00%
10,000,000 75% 2010 2,551,020 12,500,000 14,375,000 11,500,000 6,900,000 69.00%
10,000,000 72% 2011 2,518,986 13,098,729 14,408,602 11,166,667 6,700,000 67.00%
10,000,000 74% 2012 3,183,034 14,960,262 17,204,301 13,333,333 8,000,000 80.00%
10,000,000 67% 2013 2,763,595 14,025,245 16,129,032 12,500,000 7,500,000 75.00%
x 5.08 x 1.15 x 0.78 x 0.60
Copyright © by Matβlas. All rights reserved 39
Practical issues with claims reserving
Historic claims emerging patterns
Consistent case reserve setting
Changes in patterns may cause distortion
Large or CAT losses separate treatment
Some classes ULR is “pegged”
Long tail lines: what happens after 60 months?
ULRs starting point of plan loss ratio
Reserving Pricing

Copyright © by Matβlas. All rights reserved 40
Wrap Up
Underwriting minimum standards does not mean
minimum effort
Consistent rating helps achieve efficiency
Rating models are tools and should not replace
Underwriting
Portfolio management
Risk selection
Diversification
Common sense!