introduction to irrigation management: evaluating your ... · 2 introduction to irrigation...
TRANSCRIPT

Introduction to Irrigation Management
Evaluating your
surface irrigation
system

Evaluating your surface irrigation system i i iWaterWise on the Farm
Evaluating your surface irrigation system
These materials are part of the WaterWise on the Farm education program Introduction to Irrigation Management. They were developed by staff from the water management subprogram of NSW Agriculture. ww0317
© NSW Agriculture 2002
2002—09—05
The information contained in this publication is based on knowledge and understanding at the time of writing (June 2002). However, because of advances in knowledge, users are reminded of the need to ensure that information upon which they rely is up to date and to check currency of the information with the appropriate officer of New South Wales Department of Agriculture or the user’s independent adviser.
Evaluating your surface irrigation system i i iWaterWise on the Farm
Contents
Introduction.................................................................................v
Learning outcomes.................................................................... vi
Introduction to surface irrigation ...............................................1
Basic components of a surface system .................................. 2
Activity 1. Principles of surface irrigation............................. 2
Farm supply ................................................................................ 3
Flow rate and volume into the farm supply system .............. 3
Calculation 1: Flow required per shift................................... 4
Calculation 2: What area can be irrigated?........................... 4
Activity 2. Available irrigation area ...................................... 4
Calculation 3: Flow rate from two Dethridge wheels ........... 6
Activity 3. Supply flow rate.................................................... 6
Head and head loss .................................................................7
Calculation 4. Head loss in the supply system ..................... 11
Command over the land .......................................................12
Calculation 5. Calculating comand ......................................13
Activity 4. Command............................................................13
Farm supply system design and maintenance .....................14
Flow rate and volume out of the farm supply system ..........18
Calculation 6. Directly measuring flow onto the field .........18
Calculation 7. Determining flow onto the field.....................21
Activity 5. Determining flow rate ........................................ 22
Distribution efficiency ......................................................... 23
Activity 6. Distribution efficiency ....................................... 23
Introduction to irrigation managementiv WaterWise on the Farm Evaluating your surface irrigation system vWaterWise on the Farm
The irrigated field ..................................................................... 25
Activity 7. Depth of irrigation.............................................. 25
Uniformity of water application .......................................... 26
Infiltration of water applied................................................. 27
Improving uniformity of border check & furrow irrigation30
Infiltration is too deep at the top of the field....................... 30
Infiltration is too deep at the bottom end of field ................31
Infiltration is too deep over the whole field......................... 32
Improving uniformity of contour irrigation ....................... 33
Infiltration is too deep over the whole bay.......................... 34
Field application efficiency .................................................. 35
Activity 8. Field application efficiency ................................ 35
Surface drainage and reuse systems.........................................37
Watertables .......................................................................... 38
Border check irrigation drainage .........................................41
Furrow irrigation drainage...................................................41
Contour irrigation drainage ................................................ 42
Tailwater drain design ......................................................... 42
On-farm storage .................................................................. 45
Conclusion ................................................................................ 46
Activity 9. Irrigation system checklist ................................ 46

Introduction to irrigation managementiv WaterWise on the Farm Evaluating your surface irrigation system vWaterWise on the Farm
Introduction
The aim of the workshop is to introduce you to skills and techniques for improved water use efficiency and irrigation system management.
The workshop highlights the importance of efficient surface irrigation and the methods available to manage or modify a surface system for efficient operation and improved production.
The skills you learn in this workshop will help you to perform tests on your own system, and identify whether you need to change equipment, or how you operate it, to improve your irrigation efficiency.

Introduction to irrigation managementvi WaterWise on the Farm Evaluating your surface irrigation system 1WaterWise on the Farm
Learning outcomes
On completion of this workshop, you will be able to:
• identify the importance of irrigation efficiency
• measure and record the performance features of an irrigation system
• discuss measures of irrigation system performance and their impact on total water use
Workshop activitiesTo help you achieve these learning outcomes, there are a number of workshop activities for you to complete, including:
• describing the various components of a surface irrigation system and outlining important design features
• completing measurements and calculations of head loss and flow rate to assess system performance
• calculating distribution efficiency and field application efficiency
AssessmentThis course is competency-based. By completing workshop activities during the course, you will demonstrate that you have met the learning outcomes. This method of training and education benefits both you and the trainer, as any topics that have not been clearly covered may be quickly reviewed.
ProgramThis workshop is made up of three topics:
1. farm supply
2. the irrigated field
3. surface drainage and reuse
The topics include workshop activities, notes, practical application of material, and assessment tasks.
In your workbook for evaluating your surface irrigation system, you will find a worked example for each of the activities.
Introduction to irrigation managementvi WaterWise on the Farm Evaluating your surface irrigation system 1WaterWise on the Farm
Introduction to surface irrigation
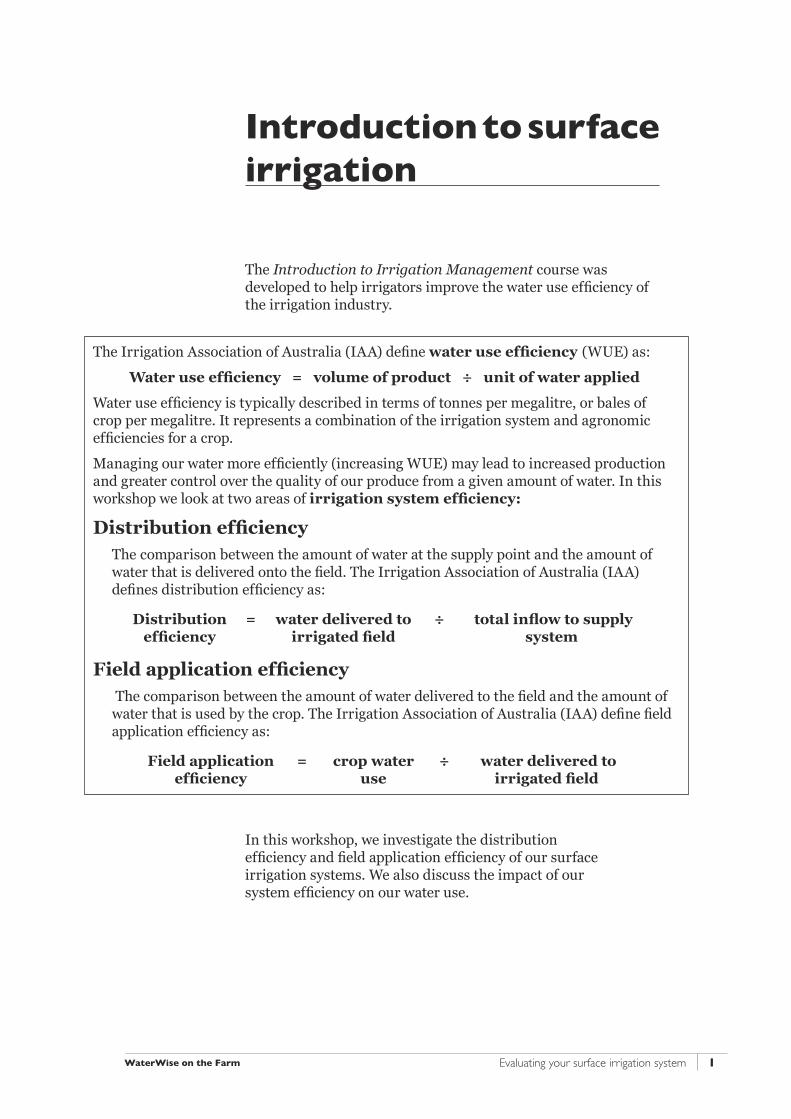
The Introduction to Irrigation Management course was developed to help irrigators improve the water use efficiency of the irrigation industry.
The Irrigation Association of Australia (IAA) define water use efficiency (WUE) as:
Water use efficiency = volume of product ÷ unit of water applied
Water use efficiency is typically described in terms of tonnes per megalitre, or bales of crop per megalitre. It represents a combination of the irrigation system and agronomic efficiencies for a crop.
Managing our water more efficiently (increasing WUE) may lead to increased production and greater control over the quality of our produce from a given amount of water. In this workshop we look at two areas of irrigation system efficiency:
Distribution efficiency The comparison between the amount of water at the supply point and the amount of water that is delivered onto the field. The Irrigation Association of Australia (IAA) defines distribution efficiency as:
Distribution efficiency
= water delivered to irrigated field
÷ total inflow to supply system
Field application efficiency The comparison between the amount of water delivered to the field and the amount of water that is used by the crop. The Irrigation Association of Australia (IAA) define field application efficiency as:
Field application efficiency
= crop water use
÷ water delivered to irrigated field
In this workshop, we investigate the distribution efficiency and field application efficiency of our surface irrigation systems. We also discuss the impact of our system efficiency on our water use.

Introduction to irrigation management2 WaterWise on the Farm Evaluating your surface irrigation system 3WaterWise on the Farm
Basic components of a surface systemA surface irrigation system applies water by flowing it across the irrigation field. This may be done by a variety of methods, which can be grouped in three main categories:
1. border check
2. furrow (and bed)
3. contour
In general, there are three major components of an irrigation system. Each component has its own management and efficiency issues. The three components are:
• the supply component, which delivers the water from the source to the irrigation field. Distribution efficiency is an indicator of the performance of this part of the system.
• the irrigated field, where the crop is grown. Field application efficiency is an indicator how well this part of the system has met the crop water requirements without excessive water loss.
• the drainage component, which removes surplus water from the field for reuse.
To determine the efficiency of an irrigation system we deal with each component of the irrigation system in turn.
If the irrigation systems used on a property are appropriate for the soil type and crop, and are installed and maintained correctly, the correct amount of water can be applied to the crop without excessive losses.
This is the goal of efficient irrigation : to ensure the greatest amount of water
that is delivered to the farm is used by the crop rather than being lost to
groundwater or of f the farm as drainage.
Activity 1. Principles of surface irrigation
border check
furrow (and bed)
contour
In your workbook, complete activity 1 on the important principles of surface irrigation.
Introduction to irrigation management2 WaterWise on the Farm Evaluating your surface irrigation system 3WaterWise on the Farm
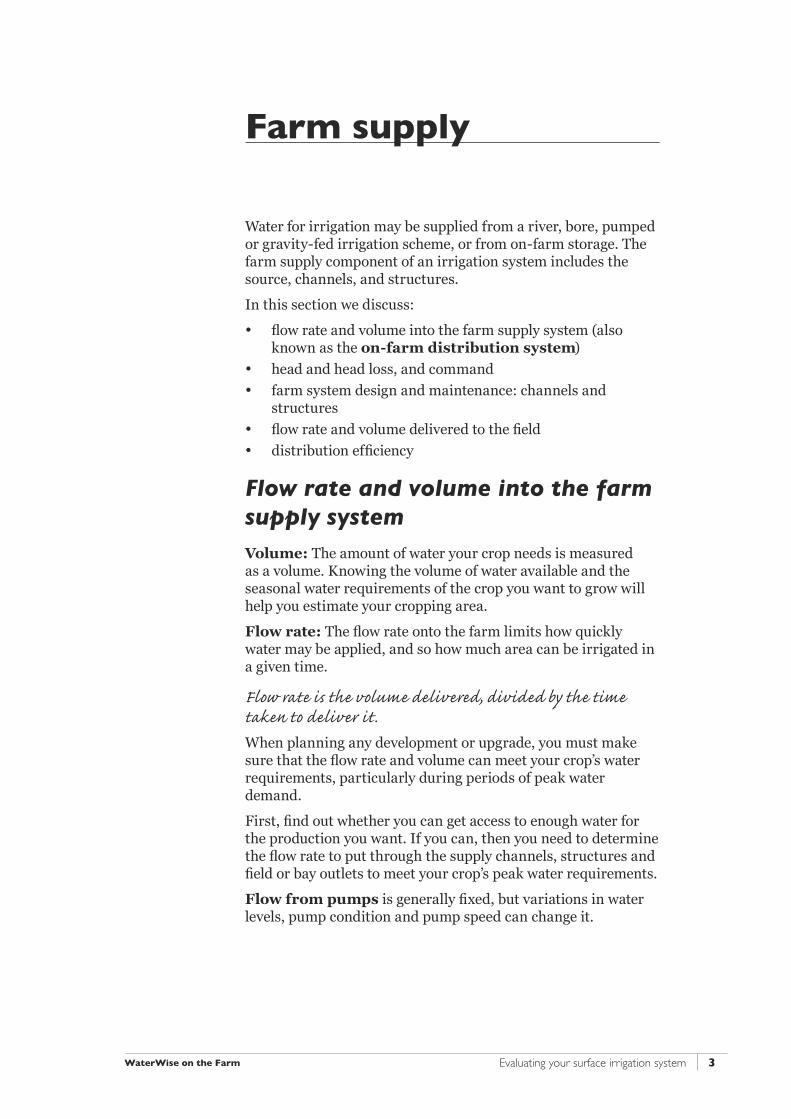
Farm supply
Water for irrigation may be supplied from a river, bore, pumped or gravity-fed irrigation scheme, or from on-farm storage. The farm supply component of an irrigation system includes the source, channels, and structures.
In this section we discuss:
• flow rate and volume into the farm supply system (also known as the on-farm distribution system)
• head and head loss, and command
• farm system design and maintenance: channels and structures
• flow rate and volume delivered to the field
• distribution efficiency
Flow rate and volume into the farm supply systemVolume: The amount of water your crop needs is measured as a volume. Knowing the volume of water available and the seasonal water requirements of the crop you want to grow will help you estimate your cropping area.
Flow rate: The flow rate onto the farm limits how quickly water may be applied, and so how much area can be irrigated in a given time.
Flow rate is the volume delivered, divided by the time taken to deliver it.
When planning any development or upgrade, you must make sure that the flow rate and volume can meet your crop’s water requirements, particularly during periods of peak water demand.
First, find out whether you can get access to enough water for the production you want. If you can, then you need to determine the flow rate to put through the supply channels, structures and field or bay outlets to meet your crop’s peak water requirements.
Flow from pumps is generally fixed, but variations in water levels, pump condition and pump speed can change it.
Introduction to irrigation management4 WaterWise on the Farm Evaluating your surface irrigation system 5WaterWise on the Farm
The available flow from a district supply system can vary with changes to supply levels, outlet sizes, and location on the system, so it is especially important to consider what flow is available during peak demand periods. Your system needs to be designed and managed to account for these limitations.
To calculate the required flow at peak times, or the area that can be irrigated with a known flow, you need to put your own figures into one of the two calculations shown below:
Calculation 1. Flow required per shiftTo determine how much water (volume) you need to irrigate your field you need to know your soil RAW, the area to be irrigated, and the efficiency of your supply component and field application component.
Flow required per irrigation (shift) = soil water volume × area ÷ efficiency
Calculation 2. What area can be irrigated?If we know what volume is available, we can determine the area that can be irrigated.
Area that may be irrigated per shift = flow × efficiency ÷ soil water volume
Activity 2. Available irrigation area
In your workbook, complete activity 2 on the available irrigation area. Look through the worked example for each calculation.

Introduction to irrigation management4 WaterWise on the Farm Evaluating your surface irrigation system 5WaterWise on the Farm
Measuring volume of water delivered into the farm supply systemTo manage your water efficiently you need to know how much water is being delivered to your farm. For this, you need some form of meter: three types commonly used are:
• propeller meter
• dethridge wheel
• ultrasonic (Doppler)
Propeller meters have a counter that records the volume of water in megalitres and in some cases provides a way of determining flow rate in megalitres per day (Figure 1). The propeller meter generally reads to one-thousandth of a megalitre.
Figure 1. Reading a propeller meter
Currently running with a flow rate of 31 megalitres per day.
Reading at end of irrigation: 3790.30 ML
Water delivered (by volume) = 26.00 ML.
Reading at start of irrigation: 3764.30 ML
(Your workbook sets out a worked example of finding the supply flow rate from a propeller meter.)
Introduction to irrigation management6 WaterWise on the Farm Evaluating your surface irrigation system 7WaterWise on the Farm
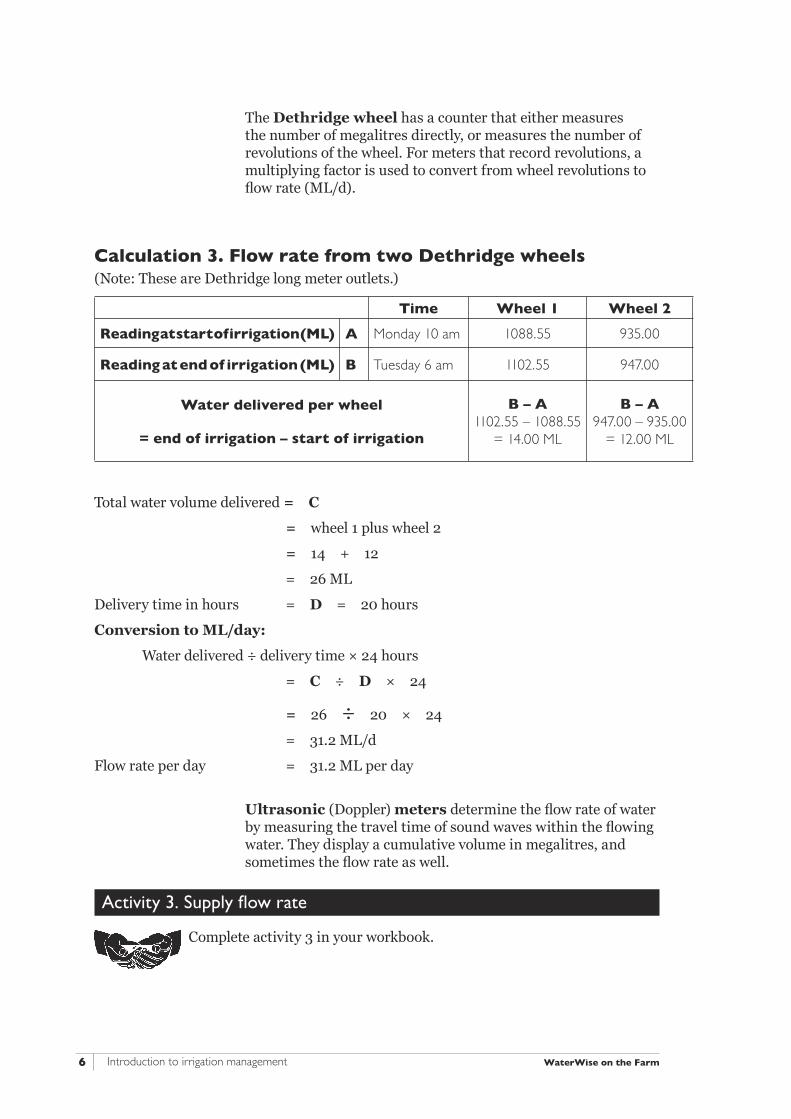
The Dethridge wheel has a counter that either measures the number of megalitres directly, or measures the number of revolutions of the wheel. For meters that record revolutions, a multiplying factor is used to convert from wheel revolutions to flow rate (ML/d).
Calculation 3. Flow rate from two Dethridge wheels(Note: These are Dethridge long meter outlets.)
Time Wheel 1 Wheel 2
Reading at start of irrigation (ML) A Monday 10 am 1088.55 935.00
Reading at end of irrigation (ML) B Tuesday 6 am 1102.55 947.00
Water delivered per wheel
= end of irrigation – start of irrigation
B – A 1102.55 – 1088.55
= 14.00 ML
B – A947.00 – 935.00
= 12.00 ML
Total water volume delivered = C
= wheel 1 plus wheel 2
= 14 + 12
= 26 ML
Delivery time in hours = D = 20 hours
Conversion to ML/day:
Water delivered ÷ delivery time × 24 hours
= C ÷ D × 24
= 26 ÷ 20 × 24
= 31.2 ML/d
Flow rate per day = 31.2 ML per day
Ultrasonic (Doppler) meters determine the flow rate of water by measuring the travel time of sound waves within the flowing water. They display a cumulative volume in megalitres, and sometimes the flow rate as well.
Activity 3. Supply flow rate
Complete activity 3 in your workbook.
Introduction to irrigation management6 WaterWise on the Farm Evaluating your surface irrigation system 7WaterWise on the Farm
Head and head lossHead is the energy that drives water through an irrigation system. Put simply, it is a measure of water pressure. Head is measured in millimetres, metres or kilopascals (1 m = 9.806 kPa = 1.42 psi).
In surface systems, we are mainly interested in the head associated with elevation and gravity. Maintaining head in surface irrigation is important, because the energy maintains flow rate and the movement of water through the system.
Head loss results from the drop in the level of the water (Figure 2) as it moves along a channel or through a structure as well as from the friction of water moving in channels and structures and through weeds and other obstructions.
Head loss does occur in systems that work well, but may be excessive in systems that are incorrectly designed or poorly maintained.
Minimising head loss in your irrigation system is important:
• to maintain head, allowing you to irrigate distant or higher elevation blocks. This is very important in gravity supply irrigation schemes and supplies.
• to reduce pumping costs
• to reduce pipe flow velocities, minimising erosion
• to keep within channel freeboards
• to make the most of the flow rate. Flow rates through outlets from channels to fields vary with the head available. If the head is high, the flow through the outlets is greater and fewer outlets may be needed. Where the water level in the supply channel is high, you may be able to use smaller siphons.
The total headloss in the supply component of a surface system is the difference between the level of the water at the supply end of the channel (A) and the level of water at the field or bay outlet of the irrigated paddock (B) (Figure 2).

Introduction to irrigation management8 WaterWise on the Farm Evaluating your surface irrigation system 9WaterWise on the Farm
full
supp
lyle
vel
acce
ss
Det
hrid
geou
tlet
head
loss
thro
ugh
Det
hrid
geou
tleton
-farm
full
supp
lyle
vel
wee
d
head
loss
thro
ugh
culv
ert
culv
ert
525
mm
pip
e
head
loss
thro
ugh
field
out
letde
pth
of
wat
er o
n ba
y
head
loss
thro
ugh
chan
nel
with
wee
d
bay
field
outle
t
A
B
Figu
re 2
. H
ead
lo
ss a
t th
e D
eth
rid
ge w
hee
l, c
ulv
ert,
an
d c
ha
nn
els

Introduction to irrigation management8 WaterWise on the Farm Evaluating your surface irrigation system 9WaterWise on the Farm
Head loss in channelsMost surface irrigation systems are designed with supply channels that have a slope of 1:10,000 or 1 cm of fall for every 100 metres. This slope is adequate for water to flow at a velocity that will not cause erosion. Standard channel dimensions, slopes, and capacities may be provided by agricultural departments or other agricultural advisers on request.
Structures or restrictions in a channel reduce the cross-sectional area of the channel and increase friction, reducing the flow rate in the channel.
Head loss varies with flow rate and channel size. For example, if the flow rate increases, the head loss increases; if the cross-sectional area of the channel is increased, the head loss will decrease.
Head loss occurs in systems that work well, but severe or excessive head loss can be caused by
• poorly maintained channels, such as those with weeds and silt build-up
• undersized channels
• any restrictions such as bends in the channel path

Introduction to irrigation management10 WaterWise on the Farm Evaluating your surface irrigation system 11WaterWise on the Farm
Head loss in structures As with channels, head loss through structures such as pipes, culverts, outlets, and siphons is caused by friction as water flows through. Head loss through an outlet increases if there are restrictions.
When designing, maintaining, or upgrading structures, remember:
• Correct design and installation is very important to maintain water capacities. For example, installing a culvert too high results in a major increase in head loss.
• A pipe runs most efficiently when full and both ends are submerged. Keeping the pipe full, particularly at the lower end, keeps water velocities to a minimum, reduces erosion, and maximises capacity.
• Changing the dimensions of structures affects head loss. If the structure size is increased, the head loss decreases. A small increase in pipe diameter causes a large decrease in head loss.
• Doubling the flow rate will multiply the head loss by four. As the flow increases through a structure, the head loss increases, due to increased friction.
• Increasing the pipe length causes only a small increase in head loss.
• Head walls may decrease head loss by up to 25%. A headwall or wingwall streamlines the flow, and when installed on culverts, acts like a funnel to greatly reduce head loss.
Introduction to irrigation management10 WaterWise on the Farm Evaluating your surface irrigation system 11WaterWise on the Farm
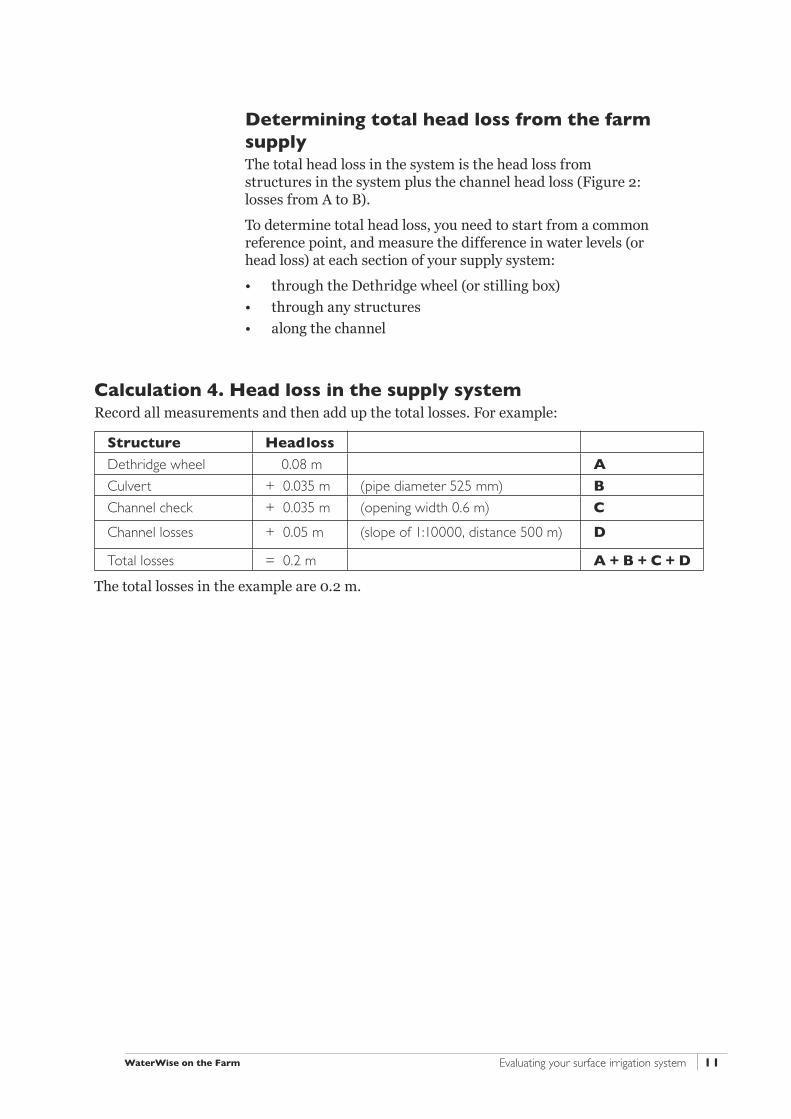
Determining total head loss from the farm supplyThe total head loss in the system is the head loss from structures in the system plus the channel head loss (Figure 2: losses from A to B).
To determine total head loss, you need to start from a common reference point, and measure the difference in water levels (or head loss) at each section of your supply system:
• through the Dethridge wheel (or stilling box)
• through any structures
• along the channel
Calculation 4. Head loss in the supply systemRecord all measurements and then add up the total losses. For example:
Structure Head loss
Dethridge wheel 0.08 m A
Culvert + 0.035 m (pipe diameter 525 mm) B
Channel check + 0.035 m (opening width 0.6 m) C
Channel losses + 0.05 m (slope of 1:10000, distance 500 m) D
Total losses = 0.2 m A + B + C + D
The total losses in the example are 0.2 m.

Introduction to irrigation management12 WaterWise on the Farm Evaluating your surface irrigation system 13WaterWise on the Farm
outlet
headloss through outlet depth
of flow
operatinglevel
paddockchannel
water level over field
command over bay
Command over the landCommand (Figure 3) is a term used to describe the difference between the water level in the supply channel and the ground level of the field or bay. This term is often confused with head. For water to flow, the command available must be greater than head.
Figure 3. Command over the bay or field
Commanded land is the land that can be irrigated by gravity. If land is to be irrigated by gravity-fed water, then the source of that water must be higher than the land to be irrigated. Supply system head losses can be very important for land situated away from the water source. The greater the system head losses, the less land can be commanded.
No command = No flow!
To provide command for irrigation and improve watering efficiencies in new developments, it is recommended that the highest design level of an irrigated bay or field should be at least 250 mm below the supply level in the delivery channel. In this situation, the command over the field is 250 mm.
There has to be enough head left, after the head loss through the outlets, to provide the required flow (150–250 mm) onto the field or bay.
Introduction to irrigation management12 WaterWise on the Farm Evaluating your surface irrigation system 13WaterWise on the Farm
Example: Subclover irrigationFor example, the height of an annual subclover pasture affects the head. The subclover paddock needs less head for the first few irrigations than it does when there is 50 mm of growth.
During the first irrigations when the paddock is bare or the pasture is short, head is adequate, and the field is irrigated quickly (high flow rates).
A month later, when the pasture has grown to a dense 50 mm high, the water level on the bay rises. This reduces the difference in water levels between the supply channel level and that on the bay.
Reduced head = reduced flow rate and irrigation is slower, but the command over the bay has remained the same.
Activity 4. Command
In your workbook, complete activity 4 on calculating the command over the field.
Calculation 5. Calculating commandTo determine the available command of the supply point (pump, or scheme supply level), we need to determine the total head losses within the supply system and the level of the irrigated bay or field.
Available command
= start of supply level
– field or bay level
– total head losses
Sample data: If our irrigation supply has the following features:
• start of the supply system (the supply point) is at a reduced level (RL) of 10.0 m (‘Reduced level’ is a surveying term. The starting value of 10.0 is an arbitrary figure.)
• field or bay is 0.5 m lower, at 9.5 m
• total head loss from supply system is 0.2 m
then:
Available command
= 10.0 m – 9.5 m – 0.2 m
= 10.0 – 0.2 – 9.5
= 0.3 m

Introduction to irrigation management14 WaterWise on the Farm Evaluating your surface irrigation system 15WaterWise on the Farm
Farm supply system design and maintenanceThe channels and structures of the supply system need to be designed and maintained for efficient supply. Inefficient irrigation water supply will cost you water and time.
ChannelsEfficient channel designs include the following points:
• Capacity can meet the crop’s peak water requirement.
• Command in the system can cope with head losses between the in-flow point and the field or bay.
• There is adequate freeboard (at least 0.15 m) above operating level.
• There are a minimum number of structures, with well-designed head walls, to minimise head loss.
• Channel is large enough to handle high pump flows, high rivers, tailwater flows, and any future expansion, with minimal head loss.
• Velocity of the water, which is related to the grade, is between 0.15 and 0.6 metres per second (m/s).
The efficient design of channels will reduce your head loss and improve the water use efficiency of your system, but there are other factors to consider when designing your channels. These considerations include reducing water losses from your supply and the system’s management.
Other factors to consider in channel design are listed below:
• Higher velocities caused by steeper grades may cause erosion, although velocities up to 1 m/s may be acceptable on heavier clay soils. (Drop check structures or secondary channels are used to lower head.)
• Very slow flows (0.1 m/s or less) can result in excessive silting in pipes and culverts.
• Channels crossing lighter soils, such as prior streams, are lined with clay to prevent seepage or relocated.
• Pads may be used to reduce seepage or carry channels across depressions.
• Channels need to be able to completely drain water to reduce weed problems, and have good access to fields and structures. Avoid locating channels across a drain.
Designing channels :
Supply channels
constructed using
earth are only a small
expense in the total
cost of an irrigation
scheme, but if they are
not designed correctly,
they may reduce the
efficiency of the system.

Introduction to irrigation management14 WaterWise on the Farm Evaluating your surface irrigation system 15WaterWise on the Farm
To maintain efficient operation the channels also need to be maintained. A good maintenance schedule will keep your channels operating at their designed efficiency.
To maintain satisfactory operation of your channels:
• Prevent weeds growing in a channel because they reduce capacity. This is more pronounced in channels less than 1 m wide or less than 200 mm deep.
• Drain channels when not in use, and de-silt them regularly to maintain capacity.
• Check pipes regularly for fractures or damage.
Flexible woven polyethylene pipe may be used as an alternative to earthen channels for transferring water from the pump to the field. These pipes have outlets that may be varied to control flow to suit the crop and soil type. They can substantially reduce water losses on permeable soil types.
Introduction to irrigation management16 WaterWise on the Farm Evaluating your surface irrigation system 17WaterWise on the Farm
StructuresAn irrigation system should have adequate access for water control, stock, and machinery, but each structure will cause some head loss. Your system should have the minimum number of structures feasible for your management purposes.
In general, there are three types of structures:
• culverts
• checks
• outlets
Culverts: Pipe culverts are installed to allow access across supply channels and tailwater drains. They should:
• have minimal head loss
• flow full without sucking air (vortexing)
• be large enough in capacity and length for future developments
• incorporate headwalls (these reduce head losses and erosion and make crossings more visible)
• be constructed to combine checks and drop checks to reduce the number of structures used
• be long enough to allow ease of access across for machinery and trucks.
Checks: Checks are used to reduce the earthworks needed in channel construction and to control height and thus manage flow. Overshot drop board checks are used to control upstream channel levels. Undershot checks (gated) control downstream levels and flow, particularly where supply rates fluctuate.
Checks should:
• have minimal head loss at full flow
• be large enough for any future development
• be easily accessible

Introduction to irrigation management16 WaterWise on the Farm Evaluating your surface irrigation system 17WaterWise on the Farm
Outlets: Outlets are used to transfer water from the supply channel to a field or bay. There are three main types employed in surface irrigation.
• Gates or doors
Gates or doors are mostly used in border check systems where large flows are needed. A slide gate or door usually comes in a pre-fabricated structure that is installed into the channel bank or head ditch. The gate or door is adjusted vertically to control water flow onto a bay. For efficient operation the difference in water level between the field and the channel should not be greater than 350 mm, since this leads to erosive velocities, and probably not less than 150 mm, since this limits how quickly water can get onto the field.
• Through-the-bank pipes
Through-the-bank pipes, commonly high-density polyethylene, are installed through or below the channel bank. The flow rate is affected by the head difference between the supply channel and the field or bay. The pipes should be installed with the top on the field or bay side level with the ground. Through-the-bank pipes are easily operated from the channel bank. The control valve can be positioned on the inlet or outlet end.
• Siphons
Siphons are pipes of various compositions, lengths and sizes that convey water over the channel bank by using the head difference to cause flow. The channel end must be fully submerged and, for maximum flow, the field or bay end should be too.

Introduction to irrigation management18 WaterWise on the Farm Evaluating your surface irrigation system 19WaterWise on the Farm
Flow rate and volume out of the farm supply systemIf you can measure flow rate and volume out of the supply system, then you can calculate distribution efficiency and field application efficiency.
The actual flow of water onto the field is directly related to the difference in water levels (head) between the supply channels and water level in the field or bay.
There are three ways to measure how much water is being applied through field outlets.
• direct measurement of flow
• head measurement method
• alternative methods
Calculation 6. Directly measuring flow onto the fieldThis method can only be used with siphons.
Place a container of known volume in a hole near the siphon outlet and make sure the top of the container is only just above the field water level. The flowing siphon is then directed into the container and the time taken to fill it recorded.
Flow rate (L/s) = volume (L) ÷ time (s)
For example, if we used a four-litre bucket and the siphon took 2 seconds to fill it, then to determine the flow rate using direct measurement our equation is:
Flow rate (L/s) =
= 4 ÷ 2
= 2 L/s
We usually think in terms of megalitres per day; to convert the litre-per-second figure into megalitres per day, do these calculations:
Convert L/s to L/min: multiply by 60 seconds.
2 × 60
= 120 L/min
Convert L/min to L/h: multiply by 60 minutes.
120 × 60
= 7200 L/h
Convert 7200 L/h to L/d: multiply by 24 hours.
7200 × 24
= 172 800 L/d
Convert 172,800 L/d into ML/d: divide by 1 000 000.
172 800 ÷ 1 000 000
= 0.17 ML/d
The siphon, then, has a flow rate of around 0.2 megalitres per day.

Introduction to irrigation management18 WaterWise on the Farm Evaluating your surface irrigation system 19WaterWise on the Farm
head
scale rulerclear plastic
tubing
pipe outlet
head
scale rulerclear plastic
tubing
syphonpipe
pipe outlet
head
scale rulerclear plastic
tubing
Measuring head and calculating flow onto the fieldThis method may be used for all systems. With this method, you measure the difference in water level between the supply channel or head ditch and water level on the field or bay. You can use an engineer’s level, or a clear plastic tube (Figure 4).
Figure 4. Measuring head over a field or bay
A piece of clear plastic tube (12-mm to 19-mm diameter), long enough to reach from the bed of the supply channel over the channel bank or head ditch to the field or bay, is filled with water to create a siphon. Once the water is flowing, it is lifted above the level of water in the supply channel.
The height difference (head) between the water in the clear plastic tubing and the water on the field or bay can then be used to determine the flow rate through the outlet using the information in Tables 1 to 3.
Introduction to irrigation management20 WaterWise on the Farm Evaluating your surface irrigation system 21WaterWise on the Farm
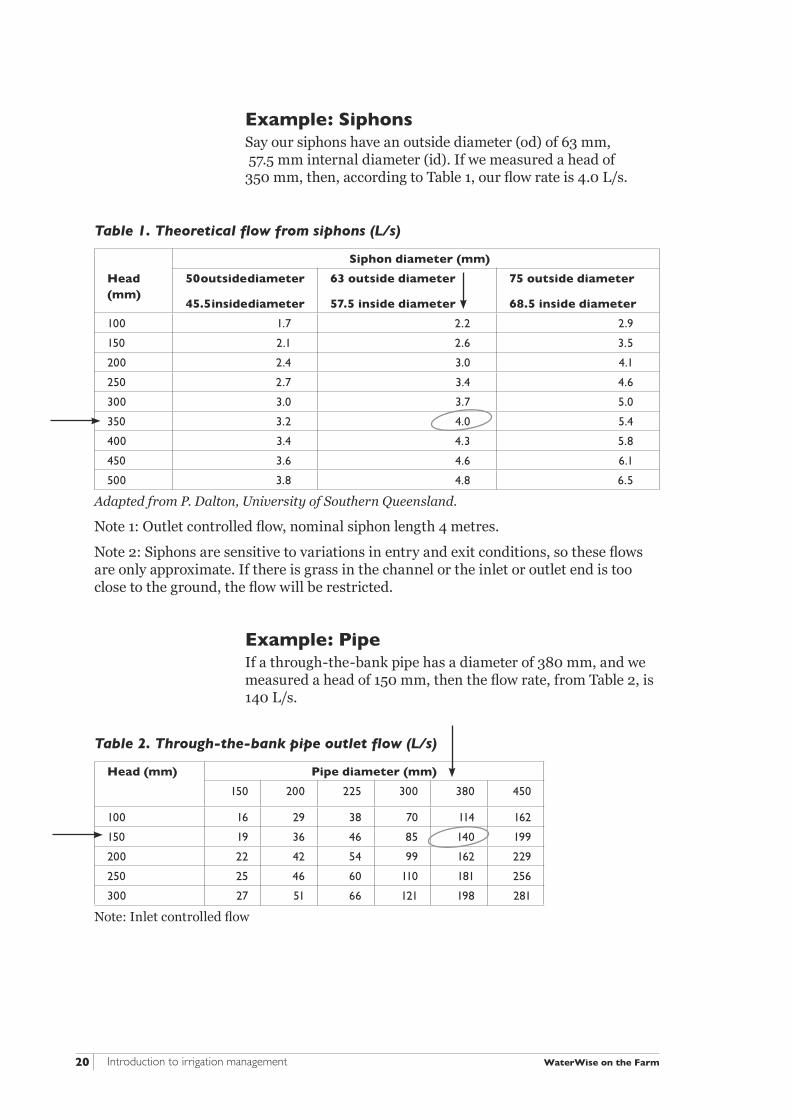
Example: SiphonsSay our siphons have an outside diameter (od) of 63 mm, 57.5 mm internal diameter (id). If we measured a head of 350 mm, then, according to Table 1, our flow rate is 4.0 L/s.
Table 1. Theoretical flow from siphons (L/s)
Siphon diameter (mm)
Head (mm)
50 outside diameter
45.5 inside diameter
63 outside diameter
57.5 inside diameter
75 outside diameter
68.5 inside diameter
100 1.7 2.2 2.9
150 2.1 2.6 3.5
200 2.4 3.0 4.1
250 2.7 3.4 4.6
300 3.0 3.7 5.0
350 3.2 4.0 5.4
400 3.4 4.3 5.8
450 3.6 4.6 6.1
500 3.8 4.8 6.5
Adapted from P. Dalton, University of Southern Queensland.
Note 1: Outlet controlled flow, nominal siphon length 4 metres.
Note 2: Siphons are sensitive to variations in entry and exit conditions, so these flows are only approximate. If there is grass in the channel or the inlet or outlet end is too close to the ground, the flow will be restricted.
Example: PipeIf a through-the-bank pipe has a diameter of 380 mm, and we measured a head of 150 mm, then the flow rate, from Table 2, is 140 L/s.
Table 2. Through-the-bank pipe outlet flow (L/s)
Head (mm) Pipe diameter (mm)
150 200 225 300 380 450
100 16 29 38 70 114 162
150 19 36 46 85 140 199
200 22 42 54 99 162 229
250 25 46 60 110 181 256
300 27 51 66 121 198 281
Note: Inlet controlled flow
Introduction to irrigation management20 WaterWise on the Farm Evaluating your surface irrigation system 21WaterWise on the Farm
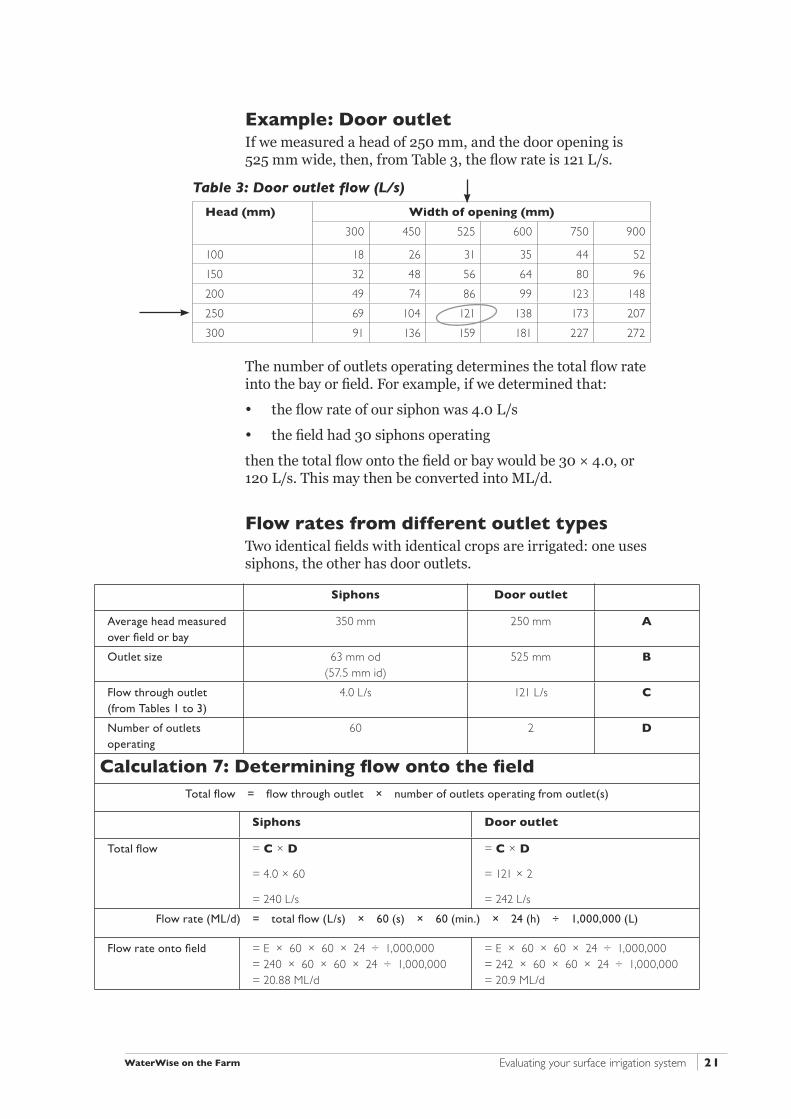
Example: Door outletIf we measured a head of 250 mm, and the door opening is 525 mm wide, then, from Table 3, the flow rate is 121 L/s.
Table 3: Door outlet flow (L/s)
Head (mm) Width of opening (mm)
300 450 525 600 750 900
100 18 26 31 35 44 52
150 32 48 56 64 80 96
200 49 74 86 99 123 148
250 69 104 121 138 173 207
300 91 136 159 181 227 272
The number of outlets operating determines the total flow rate into the bay or field. For example, if we determined that:
• the flow rate of our siphon was 4.0 L/s
• the field had 30 siphons operating
then the total flow onto the field or bay would be 30 × 4.0, or 120 L/s. This may then be converted into ML/d.
Flow rates from different outlet typesTwo identical fields with identical crops are irrigated: one uses siphons, the other has door outlets.
Siphons Door outlet
Average head measured over field or bay
350 mm 250 mm A
Outlet size 63 mm od(57.5 mm id)
525 mm B
Flow through outlet (from Tables 1 to 3)
4.0 L/s 121 L/s C
Number of outlets operating
60 2 D
Calculation 7: Determining flow onto the field Total flow = flow through outlet × number of outlets operating from outlet(s)
Siphons Door outlet
Total flow = C × D
= 4.0 × 60
= 240 L/s
= C × D
= 121 × 2
= 242 L/s
Flow rate (ML/d) = total flow (L/s) × 60 (s) × 60 (min.) × 24 (h) ÷ 1,000,000 (L)
Flow rate onto field = E × 60 × 60 × 24 ÷ 1,000,000 = 240 × 60 × 60 × 24 ÷ 1,000,000= 20.88 ML/d
= E × 60 × 60 × 24 ÷ 1,000,000 = 242 × 60 × 60 × 24 ÷ 1,000,000 = 20.9 ML/d

Introduction to irrigation management22 WaterWise on the Farm Evaluating your surface irrigation system 23WaterWise on the Farm
Alternate methodsFlow rates may also be measured with flumes in furrows or flow meters in siphons.
Figure 5. Measuring siphon flow using a flume
Activity 5. Determining flow rate
In your workbook, complete activity 5 on determining flow rate onto the field.
To find out the efficiency of distribution, you need to know the total flow delivered to the field, and the supply flow rate (see, for example, the daily supply through the propeller meter in Figure 1).
Introduction to irrigation management22 WaterWise on the Farm Evaluating your surface irrigation system 23WaterWise on the Farm
Activity 6. Distribution efficiency
Distribution efficiencyDistribution efficiency is the efficiency of delivering water within the farm supply system.
In your workbook, complete activity 6 on calculating volume delivered to the field, and distribution efficiency.
Distribution efficiency
= water delivered to irrigation field ÷ total in-flow into supply system × 100
If an irrigation system has poor distribution efficiency, there may be unacceptable losses from the channels. Losses may also be caused by overtopping, leakage, seepage or evaporation. Use the distribution efficiency figure with care, because the equipment used to measure it may be inaccurate.
The higher the
distribution
efficiency, the
greater the
volume of water
that is getting to
your field.

Introduction to irrigation management24 WaterWise on the Farm Evaluating your surface irrigation system 25WaterWise on the Farm

Introduction to irrigation management24 WaterWise on the Farm Evaluating your surface irrigation system 25WaterWise on the Farm
The irrigated field
In this section we discuss:
• depth of water applied
• uniformity of water application
• infiltration of water applied
• field application efficiency
• watertables
Surface irrigation systems may be divided into two broad categories according to the way fields and bays are irrigated.
The first category (furrow, beds and border check) fill from the highest point in the field and drain from the lowest point.
The second, which includes contour systems, fill and drain from the lowest point in the field.
Because these systems drain and fill differently, their evaluation and management is different.
Calculation 9. Depth of water appliedTo evaluate your system, you need to calculate whether the water applied to the surface of the field during each irrigation is enough to meet the crop water requirements (without excessive losses to run-off or deep drainage).
Calculations for depth of irrigation:
Run-off amount (ML) = water delivered × estimated run-off (%)
Water remaining (ML) = water delivered – run-off
Volume applied per hectare (ML/ha) = water remaining ÷ area irrigated
Depth of water applied (mm) = volume applied × 100
Activity 7. Depth of irrigation
In your workbook, complete activity 7 on calculating depth of irrigation water applied.
Introduction to irrigation management26 WaterWise on the Farm Evaluating your surface irrigation system 27WaterWise on the Farm
Uniformity of water applicationThe uniformity of water application is affected by
• the flow rate
• bay or field length and slope
• how long water is on each part of the field
• drainage volume.
For uniform application, an irrigator must operate the system within a narrow range of these factors. Often, a factor needs to be changed to maximise application uniformity.
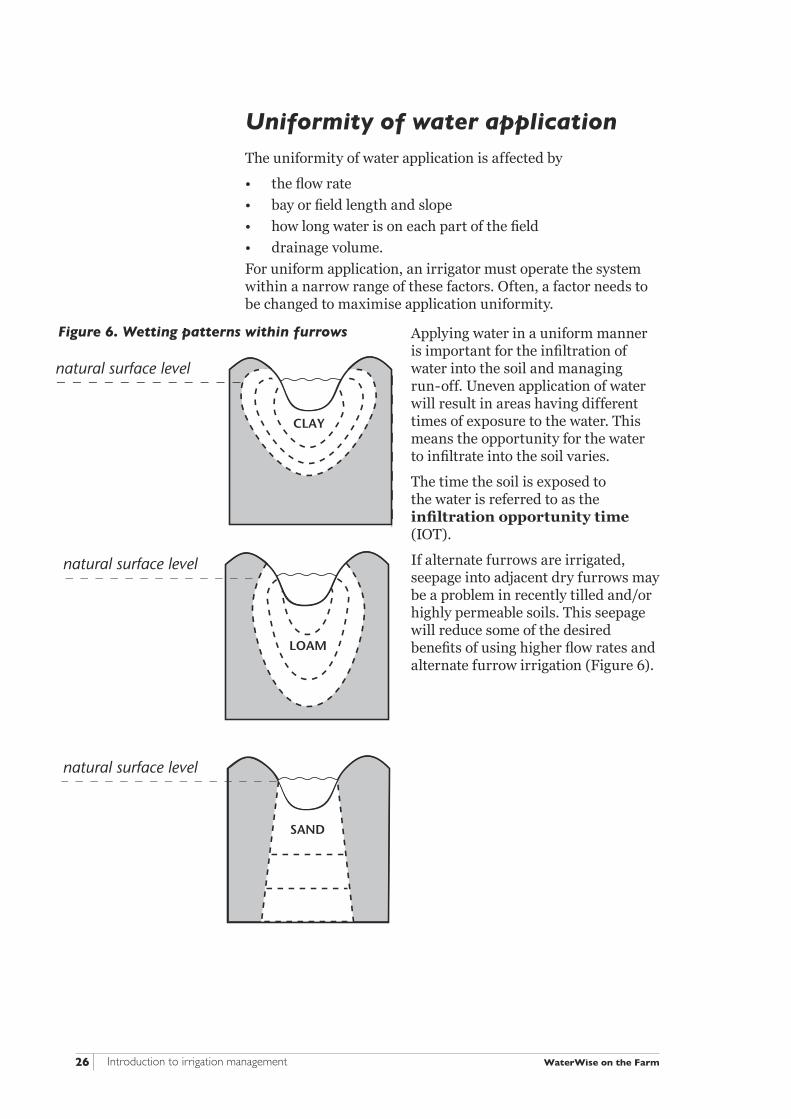
Applying water in a uniform manner is important for the infiltration of water into the soil and managing run-off. Uneven application of water will result in areas having different times of exposure to the water. This means the opportunity for the water to infiltrate into the soil varies.
The time the soil is exposed to the water is referred to as the infiltration opportunity time (IOT).
If alternate furrows are irrigated, seepage into adjacent dry furrows may be a problem in recently tilled and/or highly permeable soils. This seepage will reduce some of the desired benefits of using higher flow rates and alternate furrow irrigation (Figure 6).
Figure 6. Wetting patterns within furrows
SAND
CLAY
LOAM
natural surface level
natural surface level
natural surface level

Introduction to irrigation management26 WaterWise on the Farm Evaluating your surface irrigation system 27WaterWise on the Farm
Infiltration of water appliedInfiltration of water into the soil differs from soil to soil. It is influenced by changes in soil type, soil condition, farming practices, field slope, and existing soil water content. This variability must be considered when developing and managing an irrigation system. It is common, for instance, to reduce the effects of variability in infiltration by designing an irrigation bay to take in only one soil type, where possible.
We should aim to match the distance to which irrigation water penetrates and the plant’s effective root depth. Wetting beyond root depth will result in nutrient leaching, water wasted beyond the root zone and increased watertable accessions: infiltration that is too shallow means irrigation will need to be more frequent.
To check infiltration of an irrigation we need to measure how evenly water is infiltrating into the soil and how long it takes. If possible, the infiltration rate should be measured after several irrigations during a season. This is due to changes in soil conditions and crop development.
A simple method of judging the depth of infiltration after irrigation is to use a soil probe. By pushing the probe into the soil at points in the field, we may assess the soil’s resistance. Less resistance indicates wet soil (Figure 7).
Figure 7. Judging the infiltration depth using a soil moisture probe
After the field has drained to field capacity (say 24 hours), push the probe into the soil until resistance is felt. The probe can be made from a 1-m length of 3/8” steel rod, making a handle at one end and a sharpened tip at the other. The tip should be slightly larger in diameter than the rod so that the rod provides no resistance to being pushed into the soil.
Soil water monitoring devices can also indicate the depth of infiltration of an irrigation event.
Introduction to irrigation management28 WaterWise on the Farm Evaluating your surface irrigation system 29WaterWise on the Farm
Infiltration rateHow fast the soil can take in water is referred to as the infiltration rate. The infiltration of water into soil over time is measured in millimetres per hour. This rate can vary considerably with the soil’s texture, porosity, bulk density, and structure. Groundcover, slope, and dispersion may also influence rates.
Some soils that are open and porous will have very high infiltration rates. On the other hand, soils prone to slaking can have extremely low infiltration rates due to finer particles forming crusts on the surface, making irrigation difficult. These variations in infiltration rates can lead to variations in infiltration depth or wetting depth.
The salinity of the irrigation water may also influence the infiltration rate. Irrigation water with small concentrations of salts (EC less than 0.2 μS/cm) can result in soil infiltration problems because the water will dissolve soluble salts, causing finer particles to disperse. Irrigation water with high sodium concentration can also cause severe infiltration problems.
In addition to managing the depth of irrigation, we also need to ensure that the infiltration is uniform. To check infiltration uniformity you need to measure how evenly water is infiltrating into the soil over the paddock or bay.
Infiltration opportunity time (IOT), advance and recessionIn border check and furrow irrigation, there is usually more infiltration at the higher end of the field. This is because the high end of the field is being continually irrigated during the time it takes the water to reach the bottom of the field. The greater the time spent exposed to the irrigation water, the greater the infiltration.
The time allowed for water to infiltrate the soil at a particular point before it runs off is known as opportunity time.
To achieve uniform infiltration the opportunity time should be even across the whole field. This is especially so in sandy loams because relatively small differences in opportunity time can lead to large differences in the amount of water applied.
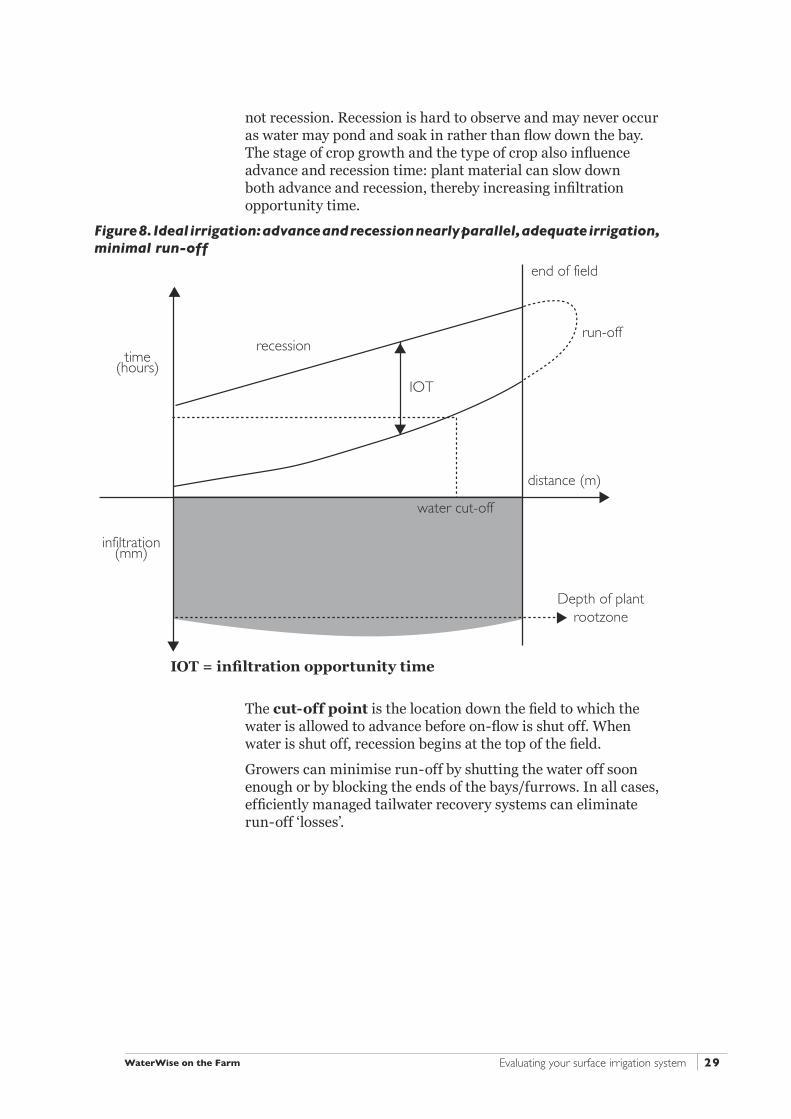
Movement of a wetting front down a furrow or bay is called advance. Drainage of the last free water from the surface is called recession. Even infiltration is achieved when the advance and recession rates are the same (Figure 8). This is achieved by adjusting the inflow rate, which affects advance but
Introduction to irrigation management28 WaterWise on the Farm Evaluating your surface irrigation system 29WaterWise on the Farm
not recession. Recession is hard to observe and may never occur as water may pond and soak in rather than flow down the bay. The stage of crop growth and the type of crop also influence advance and recession time: plant material can slow down both advance and recession, thereby increasing infiltration opportunity time.
Figure 8. Ideal irrigation: advance and recession nearly parallel, adequate irrigation, minimal run-off
The cut-off point is the location down the field to which the water is allowed to advance before on-flow is shut off. When water is shut off, recession begins at the top of the field.
Growers can minimise run-off by shutting the water off soon enough or by blocking the ends of the bays/furrows. In all cases, efficiently managed tailwater recovery systems can eliminate run-off ‘losses’.
time (hours)
infiltration(mm)
recessionrun-off
Depth of plant rootzone
end of field
distance (m)
water cut-off
IOT
IOT = infiltration opportunity time

Introduction to irrigation management30 WaterWise on the Farm Evaluating your surface irrigation system 31WaterWise on the Farm
Improving uniformity of border check and furrow irrigationOn the following pages are advance/recession curves that illustrate the most common problems that occur during surface irrigation. Common problems include too much or not enough IOT at the ends of the field, resulting in varying infiltration depths over the whole field.
Problem 1: Infiltration is too deep at the top of the field.
Figure 9. Advance and recession not parallel: too much IOT at top of field
Due to a steep advance curve, the advance and recession curves are not parallel. This results in more infiltration opportunity time at the top end of the field than at the bottom (Figure 9).
Solution: Increase the rate of flow onto the field to speed up the advance (this will flatten out the curve).
With higher on-flow rates, the water needs to be shut off sooner to minimise run-off and deep percolation. In border check systems, reducing the number of borders irrigated during each set or shift may increase on-flow rates.
If supply cannot be increased, or supplemented from on-farm storage, one design solution would be to have a shorter furrow or a smaller bay. If the field is too long for the amount that needs to be applied, then the lower part of the field could be under-irrigated, and there would be little or no run-off.
Before making any change to flow rate, consider the chance of increased soil erosion or overtopping of hills or check banks.
time (hours)
depth of plant
rootzone
recession
advance
run-off
end of field
distance (m)
water cut-off
IOT
top end of field
(supply)
infiltration (mm)

Introduction to irrigation management30 WaterWise on the Farm Evaluating your surface irrigation system 31WaterWise on the Farm
Problem 2: Infiltration is too deep at the bottom end of field.
Figure 10. Advance curve flat, too much run-off; depth of infiltration too deep at end of field
The advance curve in this situation (Figure 10) is very flat, indicating that the advance was too fast. This means that the on-flow rate was too high. The result is reduced opportunity time at the top of the field and excessive run-off and opportunity time at the bottom of the field.
To avoid this excessive run-off, the cut-off could be earlier, but this would result in the upper end of the field being under-irrigated.
Solution: Reducing the on-flow rate will steepen the advance curve. If the border/field length and application amounts are correct, reducing the on-flow rate will reduce run-off without under-irrigating the lower end.
This situation may also arise where the water is ‘backing up’ because of poor surface drainage off the field.
time (hours)
depth of plant
rootzone
recession
advance
run-off
end of field
distance (m)
water cut-off
IOT
top end of field
(supply)
Introduction to irrigation management32 WaterWise on the Farm Evaluating your surface irrigation system 33WaterWise on the Farm
time (hours)
depth of plant
rootzone
recession
advance
end of field
distance (m)
water cut-offIOT
top end of field
(supply)
infiltration (mm)
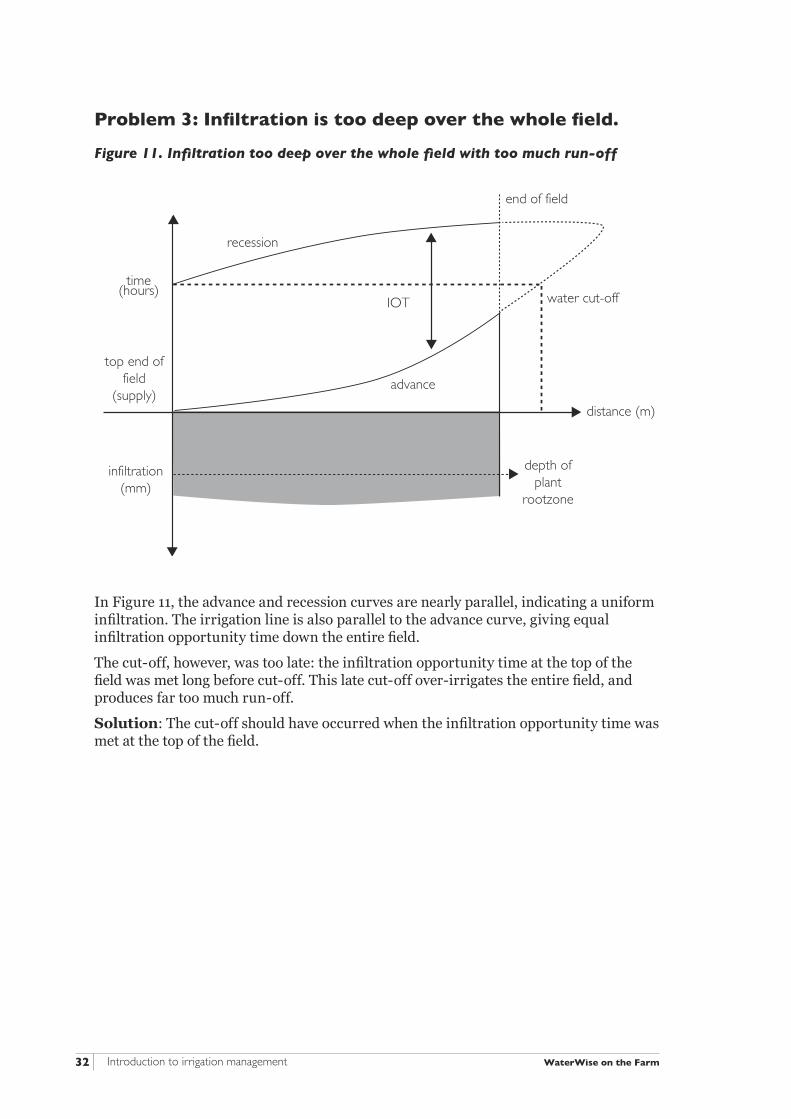
Problem 3: Infiltration is too deep over the whole field.
Figure 11. Infiltration too deep over the whole field with too much run-off
In Figure 11, the advance and recession curves are nearly parallel, indicating a uniform infiltration. The irrigation line is also parallel to the advance curve, giving equal infiltration opportunity time down the entire field.
The cut-off, however, was too late: the infiltration opportunity time at the top of the field was met long before cut-off. This late cut-off over-irrigates the entire field, and produces far too much run-off.
Solution: The cut-off should have occurred when the infiltration opportunity time was met at the top of the field.
Introduction to irrigation management32 WaterWise on the Farm Evaluating your surface irrigation system 33WaterWise on the Farm
time (hours)
depth of plant
rootzone
recession
advance
toe furrow
distance (m)
contour bay supply
top end of field
(supply)
infiltration (mm)
IOT
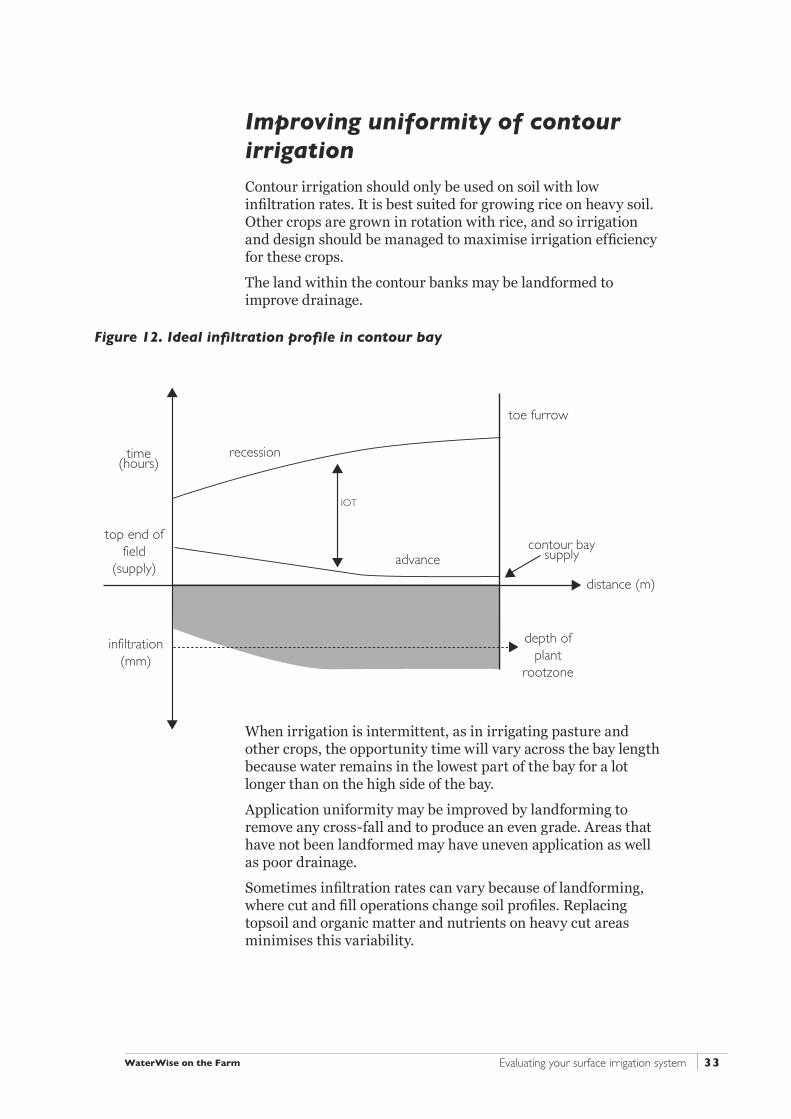
When irrigation is intermittent, as in irrigating pasture and other crops, the opportunity time will vary across the bay length because water remains in the lowest part of the bay for a lot longer than on the high side of the bay.
Application uniformity may be improved by landforming to remove any cross-fall and to produce an even grade. Areas that have not been landformed may have uneven application as well as poor drainage.
Sometimes infiltration rates can vary because of landforming, where cut and fill operations change soil profiles. Replacing topsoil and organic matter and nutrients on heavy cut areas minimises this variability.
Improving uniformity of contour irrigationContour irrigation should only be used on soil with low infiltration rates. It is best suited for growing rice on heavy soil. Other crops are grown in rotation with rice, and so irrigation and design should be managed to maximise irrigation efficiency for these crops.
The land within the contour banks may be landformed to improve drainage.
Figure 12. Ideal infiltration profile in contour bay
Introduction to irrigation management34 WaterWise on the Farm Evaluating your surface irrigation system 35WaterWise on the Farm
time (hours)
depth of plant
rootzone
recession
advance
toe furrow
distance (m)
contour bay supply
top end of field
(supply)
infiltration (mm)
IOT top of field
IOT bottom of field
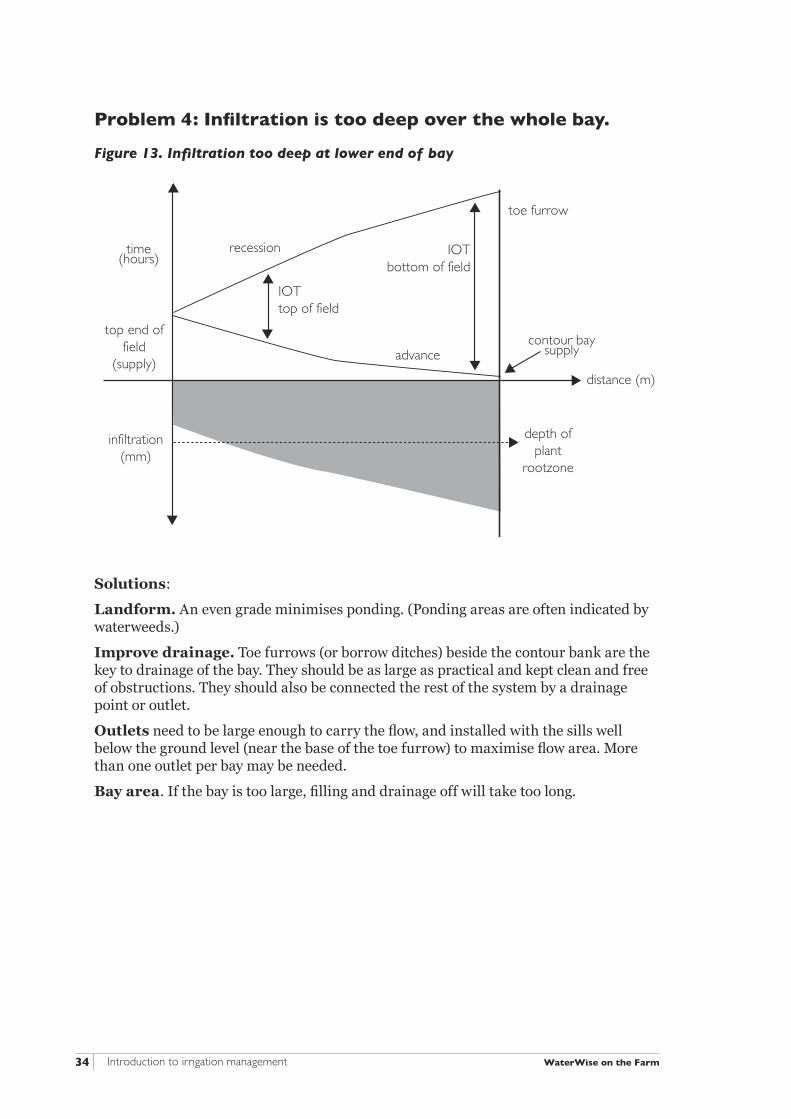
Problem 4: Infiltration is too deep over the whole bay.
Figure 13. Infiltration too deep at lower end of bay
Solutions:
Landform. An even grade minimises ponding. (Ponding areas are often indicated by waterweeds.)
Improve drainage. Toe furrows (or borrow ditches) beside the contour bank are the key to drainage of the bay. They should be as large as practical and kept clean and free of obstructions. They should also be connected the rest of the system by a drainage point or outlet.
Outlets need to be large enough to carry the flow, and installed with the sills well below the ground level (near the base of the toe furrow) to maximise flow area. More than one outlet per bay may be needed.
Bay area. If the bay is too large, filling and drainage off will take too long.

Introduction to irrigation management34 WaterWise on the Farm Evaluating your surface irrigation system 35WaterWise on the Farm
Field application efficiencyField application efficiency is the efficiency of the water application within the boundaries of the field. You can determine the field application efficiency for a single irrigation event, or for a whole season (note, however, that it may vary through the season).
By adopting the techniques discussed in this workshop, you will be able to measure the amount of water being delivered to a field. Once you have learned about crop water use, covered in the workshop on scheduling and benchmarking, you will be able to determine how much water your crop is using.
It is difficult to measure crop water use and flow onto the field accurately.
The estimated crop water use (CWU) and volume of irrigation water delivered to the field are used to calculate the field application efficiency:
Field application efficiency
= crop water use (ML)
÷ water delivered to irrigation field (ML)
(IAA definition)
To convert this into a percentage, multiply by 100.
Field application efficiency × 100 = field application efficiency %
Determining field application efficiencyTo calculate the field application efficiency we need to collect information on crop water use and the irrigated field. The information you need includes:
• estimated daily crop water use
• volume delivered to field
• area irrigated
• days between irrigations
Activity 8. Field application efficiency
Look through the worked example ‘A. Without recycling’ in activity 8.
Field application efficiency may be significantly improved by collecting run-off and recycling water.
In your workbook, complete activity 8 on calculating field application efficiency, worked example ‘B. With recycling’.

Introduction to irrigation management36 WaterWise on the Farm Evaluating your surface irrigation system 37WaterWise on the Farm

Introduction to irrigation management36 WaterWise on the Farm Evaluating your surface irrigation system 37WaterWise on the Farm
Surface drainage and reuse systems
In this section we discuss:
• waterlogging
• border check irrigation drainage
• furrow irrigation drainage
• contour irrigation drainage
• drainage capacity
• excess volume options
• drainage structures
• on-farm storage
The aim of a drainage/reuse system is to remove all surface water from the fields or bays within a short period and to move the drained water into storage or the supply system for reuse.
The two main reasons for surface drainage and reuse are:
• Drainage water is a resource which, if not reused, represents a cost to the irrigator.
• As a condition of any water licence, drainage water must be retained on-farm.
Drainage water may contain sediments, chemicals (nutrients, pesticides and salt), and bacteria, and the possible contaminants should be considered before reusing drainage water.
The drainage system must cater for the current layout and for any developments, and must be considered in the initial design. While it may be years before the full irrigation system is developed, some aspects of the drainage system must be incorporated from the start.

Introduction to irrigation management38 WaterWise on the Farm Evaluating your surface irrigation system 39WaterWise on the Farm
WatertablesWaterlogging within fields and subsequent rising watertables is a problem for both irrigators and the environment. A watertable is a zone of soil that is saturated by groundwater. Watertables may be shallow, deep, or perched (due to underlying restrictive layers).
Why are high watertables a problem?Trees are generally the first to suffer from high watertables as their deep roots become flooded and starved of oxygen. The water is usually saline, as it has dissolved the naturally occurring salts found in the soil. This, combined with the lack of oxygen and other associated waterlogging effects, can have a serious impact on production and the natural environment.
If the watertable continues to rise to within 1–2 metres of the soil surface, the groundwater of the watertable can move into the rootzone of other plants such as crops and pastures through a process known as capillary rise.
It then evaporates from the surface or is used by plants, leaving salt on or near the soil surface. Over time, the concentration becomes high enough to affect plant growth. In worst case scenarios, plant growth can be restricted to plants that are highly salt-tolerant. In these situations, the land is often unproductive for agricultural use.
Introduction to irrigation management38 WaterWise on the Farm Evaluating your surface irrigation system 39WaterWise on the Farm
What causes watertables to rise?Watertables rise when the amount of water entering the system is greater than the water draining from the system. Water can increase from irrigation infrastructure seepage – around 25% of accessions in NSW occur as seepage from channels, drains and dams – or from poor irrigation practices leading to percolation or deep drainage.
Drainage can be reduced when tree-covered plains are cleared and trees replaced with shallow-rooted crops and pastures, and when roads, channels, levees, and on-farm earthworks are constructed that block natural drainage flows.
Irrigation practices that may contribute to rising watertables and salinity can include:
• Over-irrigating – applying more water than the crop or pasture needs. If this surplus water does not drain away, it seeps through the soil to the watertable.
• Irrigating on incorrect soils – sandy soils have larger pore spaces that let water seep through more easily.
• Uneven ground/poor drainage – if a paddock does not drain freely after irrigation and water lies in depressions, the only way the water will leave the paddock is by evaporation or by seeping through the soil to the watertable.
• Inadequate grades – if grades are too flat for the soil type and bay length, irrigation may take too long, giving water more time to seep past the root zone.
• Infrequent irrigation – if the soil is allowed to dry out and then a large amount of water applied, much of it will flow straight through cracks in the soil to the watertable. Another effect of dry soil is the death of many plant roots that further reduce the ability of the plants to use the water when it is applied.
Introduction to irrigation management40 WaterWise on the Farm Evaluating your surface irrigation system 41WaterWise on the Farm
Effects of waterlogging on plantsMost plants do not respond well to periods of waterlogging. A waterlogged soil is deficient in oxygen, which is essential for plant roots to actively uptake nutrients. Waterlogging can cause temporary nitrogen and sulfur deficiencies and can cause some trace elements to become deficient or toxic, depending on the element. Waterlogging can also interrupt the process of organic matter breakdown.
Short-term symptoms:
• slow and poor germination
• yellowing of crop or pasture
• less vigorous plant growth with plants often appearing stunted and thin, resulting in varying crop yields
Long-term symptoms:
• tree death, especially in low-lying areas
• changes in pasture composition (for example, less subclover)
• extreme stunting of crop or crop death
• waterlogging-tolerant species dominate (for example, pin rush, dock, umbrella sedge)
• bare patches appearing where water lies

Introduction to irrigation management40 WaterWise on the Farm Evaluating your surface irrigation system 41WaterWise on the Farm
Border check irrigation drainageHow well a bay drains following an irrigation event depends upon several factors:
Bay length: In some soil and crop situations, bays longer than 350–400 metres on flat grades (>1:1250) do not drain well, especially in the winter when evaporation is slow. In long bays, the use of spinner cuts running down the bay effectively reduces the distance that water has to travel before entering a drain. The cuts need to connect with the formed drain at the bottom of the bay.
Bay grade: In general, the steeper the grade, the better the surface drainage. With flatter grades, reverse grades may occur, causing ponding. Even when grades are constant, tillage or sowing will cause ridges to form. A ridge of 1 cm high across a 1:1000 grade will hold water back for a distance of 10 metres.
Soil type: Coarse-textured soils, such as sands and loams, have better internal drainage than fine textured clay soils. Internal drainage of clays varies substantially, depending on the structure, sodicity, organic matter content, and mineralogy. Clays that are not self-mulching and transitional red-brown earth clay soils are usually poorly drained. These soils need good surface drainage system (for example, steep grades or beds) to compensate for their poor subsurface drainage.
Groundcover: Crop or pasture height and density affect surface drainage substantially. Thick swards slow water movement and therefore drainage. Pasture paddocks, particularly those that will be watered frequently, such as summer pasture, need to be designed with bay grades and lengths that are steeper and shorter than normal, and preferably restricted to soils with good drainage and infiltration rates.
Furrow irrigation drainageIn developing a furrow-irrigated farm, the natural drainage process from the field is altered so that up to 80–90% of rainfall becomes run-off, compared with 10–20% under natural conditions. This generally means run-off is speeded up during heavy rainfall, giving a quick surge of a large amount of water through the drainage system, and this may result in an overflow of water.
Introduction to irrigation management42 WaterWise on the Farm Evaluating your surface irrigation system 43WaterWise on the Farm
Toe furrow
Depth of outlet sill
Surface of bay
100 mm freeboard
250 mm
250 mm
water level600 mm
(minimum)
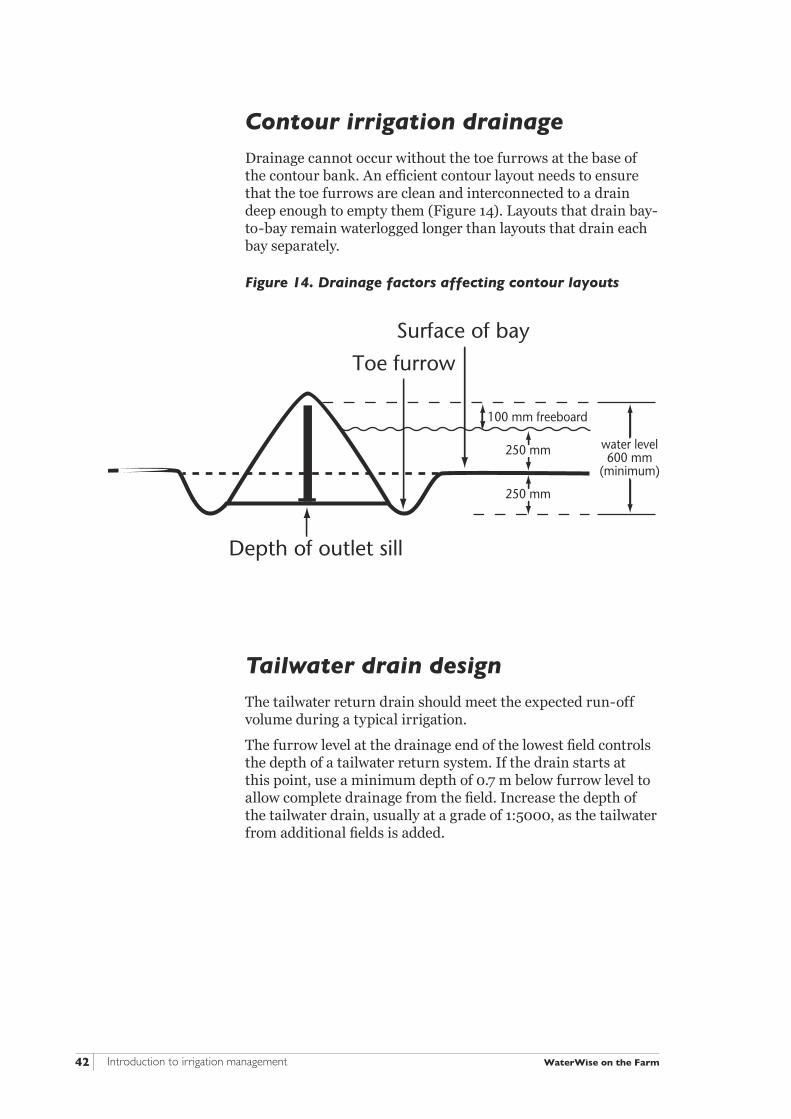
Contour irrigation drainageDrainage cannot occur without the toe furrows at the base of the contour bank. An efficient contour layout needs to ensure that the toe furrows are clean and interconnected to a drain deep enough to empty them (Figure 14). Layouts that drain bay-to-bay remain waterlogged longer than layouts that drain each bay separately.
Figure 14. Drainage factors affecting contour layouts
Tailwater drain designThe tailwater return drain should meet the expected run-off volume during a typical irrigation.
The furrow level at the drainage end of the lowest field controls the depth of a tailwater return system. If the drain starts at this point, use a minimum depth of 0.7 m below furrow level to allow complete drainage from the field. Increase the depth of the tailwater drain, usually at a grade of 1:5000, as the tailwater from additional fields is added.
Introduction to irrigation management42 WaterWise on the Farm Evaluating your surface irrigation system 43WaterWise on the Farm
Drainage capacityIn most areas, drain capacity is dictated by storm flows. The capacity of a drain depends on the time over which drainage must occur. Unlike supply channels, the flow rates in surface irrigation drainage systems fluctuate rapidly and often. Most crops need stormwater to drain within 24 to 48 hours. For high value crops that are sensitive to waterlogging, it is desirable to achieve a more rapid drainage.
Drainage systems are usually designed for a one-in-five-year storm. Because the cost of drains and culverts increases with size, it may not pay to provide a bigger capacity for a rare storm event.
For a drainage system to operate effectively there must be a well-defined drain at the end of the bay to remove run-off and prevent water from backing up the bay: this is the tail drain. The capacity of a tail drain depends on soil conditions, the area it is draining and management practices. For an area of up to 40 hectares laid out to border check, the drain should have a capacity of at least 6 ML/d.
For areas of 40–100 hectares, the capacity should be at least 10 ML/d.
For areas larger than 100 hectares, drains should be constructed to cope with 0.25 ML/d for every hectare drained.
Tail drains should have grades greater than 1:5,000 with little capacity at the beginning and increasing to maximum capacity at the bottom of the field. Drain batters should be very flat to allow access for machinery across the drain when it is dry and to provide a turning area at the bottom of the field during cultivations. Generally, a 10:1 batter is used on the field side and 5:1 batter on the roadside.
Taildrains must also be low enough to drain the field without causing erosion into the drain from the furrows or bays. Generally, the depth between the drain and the field level should not exceed 500 mm. If the drain is too shallow, water may back up into the field.
You need to know the carrying capacity of all the components of a furrow irrigation system to prevent or solve tailwater drainage, stormwater run-off, and potential contamination problems.

Introduction to irrigation management44 WaterWise on the Farm Evaluating your surface irrigation system 45WaterWise on the Farm
Excess volume optionsSurge areas are an extension of a tailwater return system. They are designed to extend the storage capacity to delay the flow of run-off back to a pump site, when it exceeds the capacity of the normal system.
They provide an area to allow the run-off water to slow down to a speed (< 0.2 m/s) where suspended material can drop from the water and be retained on-farm.
The principle behind the construction of a surge dam or surge area is to store excess water below crop levels with the option of allowing this water to flow back into the tailwater return system and then on to a relift pump. Surge systems are therefore usually located on the lowest part of the farm, or in a position where surplus tailwater flow can be directed under gravitational flow.
Drainage structuresStructures within drains that are too small or set too high make water back up onto the field, and incorrectly sized pipes and culverts with low velocities are likely to silt up. Table 4 shows the preferred culvert sizes for various flow rates.
Table 4. Approximate flow rate of 12-m long culverts based on head available
Head Culvert diameter (mm)
0.1 9 13 19 25 40 59 82 109
0.15 10.5 16 23 31 49 72 101 133
0.2 12 19 27 36 57 83 116 154
0.25 13.5 21 30 40 64 93 130 172
0.3 15 23 33 44 70 102 142 188
0.4 17 27 38 50 81 118 164 217
0.5 19 30 42 56 90 132 184 243
Barrett, Purcell & Associates Pty Ltd, Narrabri.
Introduction to irrigation management44 WaterWise on the Farm Evaluating your surface irrigation system 45WaterWise on the Farm
On-farm storageOn-farm storages range from excavated tanks holding only a few megalitres to large ring tanks holding more than 1000 megalitres.
Storages can allow you to make the most of all available water, including:
• ordered water that is not needed
• off-allocation water
• rainfall and irrigation run-off
• water from non-perennial streams
• underground water
Storage can have many advantages but can also be a major cost, so consider carefully whether developing one is justified.
On-farm storage can help you manage your system more efficiently:
• by allowing you to comply with regulations that require all irrigation drainage to be retained on-farm
• by ensuring a supply when district channels are shut down for maintenance
• where the supply is regulated or restricted
Information on storage siting, design, costing, construction and management can be found in
• NSW Agriculture’s Guidelines for siting, design, construction and management of on-farm storages
• Irrigation Association of Australia’s Guidelines for Ring Tank Storages
• Irrigation salinity fact sheet 5: On-farm Storages.

Introduction to irrigation management46 WaterWise on the Farm
Conclusion
This workshop has introduced ways to evaluate your surface system and has identified opportunities for improvements in irrigation performance.
By applying these principles, you can improve irrigation efficiency on your farm and achieve improved productivity.
Activity 9. Irrigation system checklist
Complete your evaluation by working through the irrigation system checklists in your workbook.