introduction to labview and computer-based measurements
TRANSCRIPT
Introduction to NI LabVIEW
and Computer-Based Measurements
Elias Nicolas Applications Engineer
National Instruments

2 ni.com
Today, We’ll Explore:
The Challenges of Making
Measurements
Characteristics of Mixed-Measurement Systems
The National Instruments Approach
Architecture of a Measurement System
Introduction to LabVIEW
History and Philosophy of LabVIEW
Gaining LabVIEW Proficiency
Fundamentals of Data
Acquisition
Essential Data Acquisition Concepts
The Basics of Signal Conditioning
The Value of National Instruments Hardware Platforms
Break Enjoy Coffee and Networking With Peers
Uniting Software and Hardware
Architecture of the NI-DAQmx Driver
Measurement Services and Utilities
Exploring and Using the NI-DAQmx API

ni.com
The Challenges of Making Measurements
Exploring the Traditional Approach to Measurements

4 ni.com
The Origin of Automated Measurements
• Traditional pen-and-paper approach
• Redundant circuitry between instruments (e.g., displays)
• Manual data recording and analysis
• Error-prone processes
• Difficult to reproduce or redo

5 ni.com
Mixed-Measurement Applications Are Diverse
Pressure Temperature Force Strain
Vibration Torque Displacement

Example Application: Air Quality Measurements
• Potential Sensors Needed:
• Context
• GPS
• Timestamp
• Position
• Attitude
• Altitude
• Range Finder
• Environmental
• Temperature
• Oxygen
• Carbon Dioxide
• Ozone
• Nitrogen

7 ni.com
Sensors, Interfaces, and Signal Conditioning Sensor Interface Conditioning?
GPS RS232 No
Attitude, Altitude RS232 No
LiDAR Ethernet No
Temperature Analog Voltage Required
O2, CO2, O3, NH3 Analog Voltage Required

8 ni.com
Software Provided With Sensors Sensor Software
GPS
Attitude, Altitude
LiDAR
Temperature
O2, CO2, O3, NH3 <No Software Provided>

9 ni.com
With a System Like This, How Do You Accommodate…
• …changes in requirements?
• …mixed measurements in a single system?
• …varying connectivity?
• …signal conditioning for sensors?
• …adding or replacing measurements or sensors?
• …incorporating timing, triggering, or synchronization?
• …leveraging emerging technology trends?
• …multiple disparate software environments and APIs?

10 ni.com
The Human Body
A Wonderful Sensing System

11 ni.com
The Human Body
A Wonderful Sensing System
Analysis and Decisions

12 ni.com
Industries and Applications
Hardware and I/O Devices
PXI and Modular
Instruments
Desktops and
PC-Based DAQ NI CompactRIO
Test Monitor Embedded Control Cyber Physical
Open Connectivity
With Third-Party I/O
National Instruments’ Strategy: Graphical System Design Your Investment in a Platform-Based Approach to Measurements Scales Across…

13 ni.com
Top Benefits of an Integrated Measurement Platform
Accelerated Productivity
Proven Performance and Accuracy
Scalability, Adaptability, and Flexibility
1.
2.
3.

14 ni.com
Architecture of an Integrated Measurement System
Today, we’ll learn about three key differentiating components
of a National Instruments data acquisition system:
Sensor
Signal
Conditioning
Analog-to-Digital
Converter
Measurement Device Software
Driver
Software
Application
Software

15 ni.com
Architecture of an Integrated Measurement System
LabVIEW is system design software that provides
engineers and scientists with the tools needed to
create and deploy measurement and control systems
through unprecedented hardware integration.
Sensor
Signal
Conditioning
Analog-to-Digital
Converter
Measurement Device Software
Driver
Software
Application
Software
16 ni.com
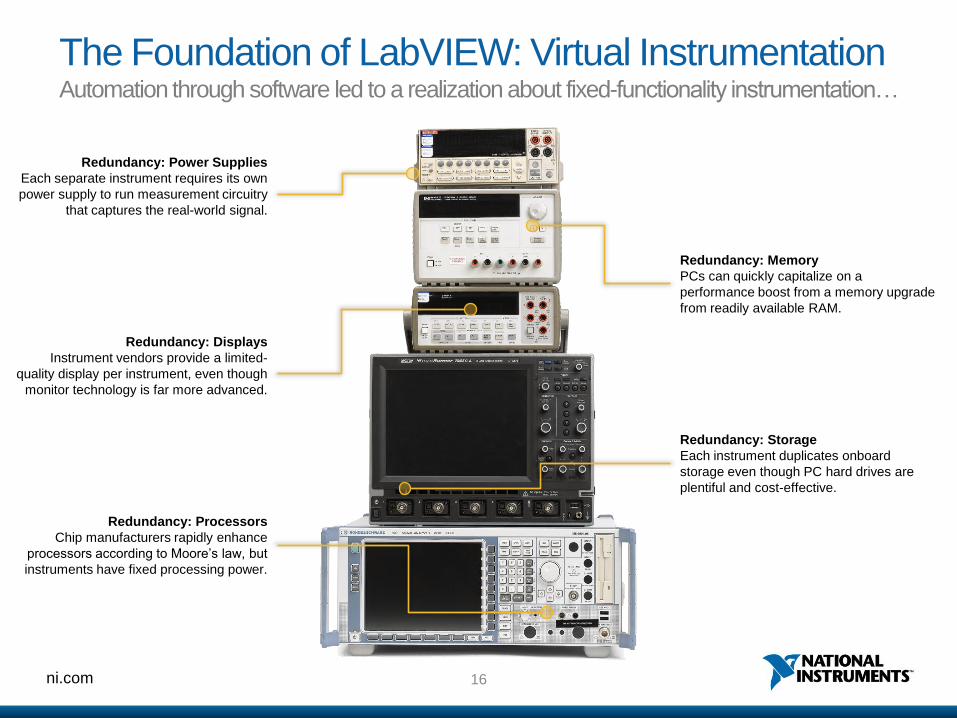
The Foundation of LabVIEW: Virtual Instrumentation Automation through software led to a realization about fixed-functionality instrumentation…
Redundancy: Displays
Instrument vendors provide a limited-
quality display per instrument, even though
monitor technology is far more advanced.
Redundancy: Processors
Chip manufacturers rapidly enhance
processors according to Moore’s law, but
instruments have fixed processing power.
Redundancy: Memory
PCs can quickly capitalize on a
performance boost from a memory upgrade
from readily available RAM.
Redundancy: Storage
Each instrument duplicates onboard
storage even though PC hard drives are
plentiful and cost-effective.
Redundancy: Power Supplies
Each separate instrument requires its own
power supply to run measurement circuitry
that captures the real-world signal.

17 ni.com
The Foundation of LabVIEW: Virtual Instrumentation By leveraging COTS PC components, the software becomes the instrument
LabVIEW unlocks the power of instrument and data acquisition hardware
by capitalizing on the PC industry and abstracting redundant circuitry.

ni.com
The Fundamentals of Data Acquisition (DAQ)
The Basics of Making PC-Based Measurements

19 ni.com
What Is Data Acquisition (DAQ)?
Data acquisition (DAQ) is the process of measuring an electrical
or physical phenomenon such as voltage, current, temperature,
pressure, or sound with a computer.
Compared to traditional measurement systems, PC-based DAQ
systems exploit the processing power, productivity, display, and
connectivity of industry-standard computers providing a more
powerful, flexible, and cost-effective measurement solution.

20 ni.com
All Measurements Are Technically Inexact Electronic components naturally drift over time and require calibration
Input value
Measured values
+ error - error
error
Manufacturer’s specification of
measurement uncertainty
24 Hrs 90 Days
Time
Me
asu
rem
ent E
rro
r
1 Year
?
?
Effect of Environmental Drift
Effect of Aging Drift

21 ni.com
Analog
Signals Come in Two Forms: Digital and Analog
Digital

22 ni.com
Digital Signals
• Digital signals have two states: high and low
• Digital lines on a DAQ device accept and generate
transistor-transistor logic (TTL) compatible signals
+0.8 V
0 V
+5.0 V
+2.2 V
High State
Low State
Indeterminate
State
Rate

23 ni.com
Digital Terminology
Bit The smallest unit of data. Each bit is either a 1 or a 0.
Byte A binary number
consisting of eight related bits of data.
Line One individual signal in a port. Bit refers to the data transferred. Line refers to the hardware.
Port A collection of digital lines (usually four or
eight).
0
1
0110100
1
1010110
0

24 ni.com
Analog
Signals Come in Two Forms: Digital and Analog
Digital

25 ni.com
Analog Signals
Analog signals are continuous signals that can be any
value with respect to time.

26 ni.com
Analog Terminology
Level • The instantaneous value of the signal at a given point in time.
Shape • The form that the analog signal takes, which often dictates further
analysis that can be performed on the signal.
Frequency • The number of occurrences of a repeating event over time.
4.71
V

27 ni.com
The Three R’s of Data Acquisition: Resolution
Resolution Range Rate
6-Bit
Resolution
3-Bit
Resolution
Original
Signal

28 ni.com
The Three R’s of Data Acquisition: Range
Resolution Range Rate
Original
Signal
3-Bit
Resolution
Range of
-10V to 10V
Range of
-2V to 2V

29 ni.com
The Three R’s of Data Acquisition: Rate
Resolution Range Rate
Original Waveform (10 Hz)
Sampling Rate = 11 Hz Sampling Rate = 25 Hz Sampling Rate = 100 Hz
30 ni.com
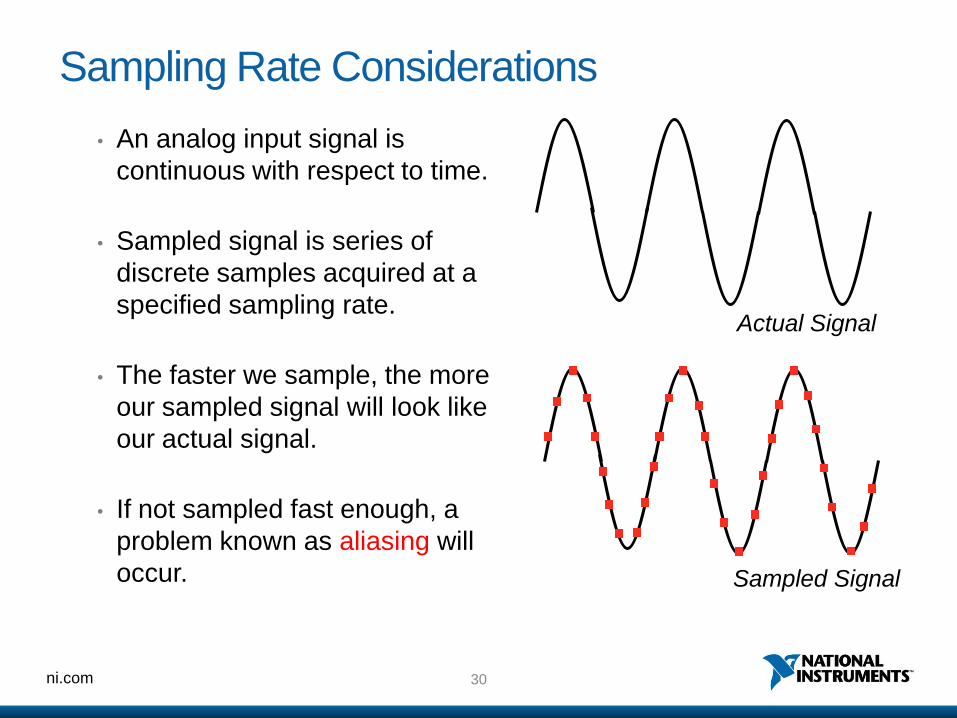
Sampling Rate Considerations
• An analog input signal is
continuous with respect to time.
• Sampled signal is series of
discrete samples acquired at a
specified sampling rate.
• The faster we sample, the more
our sampled signal will look like
our actual signal.
• If not sampled fast enough, a
problem known as aliasing will
occur.
Actual Signal
Sampled Signal

31 ni.com
• Sample rate: how often an A/D conversion takes place
• Alias: misrepresentation of a signal
Aliasing
Adequately Sampled
Aliased Due to Undersampling
Frequency
Am
plit
ude
6
Frequency
Am
plit
ude
2

32 ni.com
Following the Nyquist Theorem Prevents Aliasing
To accurately represent the frequency of your original signal… Frequency
• You must sample at greater than 2 times the maximum frequency component of your signal.
To accurately represent the shape of your original signal… Shape
• You must sample between 5–10 times greater than the maximum frequency component of your signal .

33 ni.com
The Nyquist Theorem in Action
Aliased Signal
Adequately Sampled
for Frequency Only
Adequately Sampled
for Both Frequency
and Shape
100 Hz Sine Wave
100 Hz Sine Wave
Sampled at 100 Hz
Sampled at 200 Hz
Sampled at 1 kHz 100 Hz Sine Wave

34 ni.com
Conditioning Signals for Quality Measurements
• Signal conditioning improves a signal that is difficult for your DAQ device to measure
• Signal conditioning is not always required
Noisy, Low-Level Signal Filtered, Amplified Signal
Signal Conditioning

35 ni.com
Transducer/Signals Signal Conditioning
Thermocouples Amplification, Linearization, Cold-Junction
Compensation
RTD (Resistance Temperature
Detector) Current Excitation, Linearization
Strain Gage Voltage Excitation, Bridge Configuration,
Linearization
Common Mode or High Voltage Isolation Amplifier
Loads Requiring AC Switching
or Large Current Flow
Electromechanical Relays or Solid-State
Relays
High-Frequency Noise Low-Pass Filters
Common Signal Conditioning Examples

36 ni.com
Examining Common Signal Conditioning for Voltage
Measurements
Amplification
Attenuation
Filtering
Isolation

37 ni.com
Amplification
• Used on low-level signals
• Maximizes use of analog-to-digital converter (ADC) range
and increases accuracy
• Increases signal-to-noise ratio (SNR)
Amplifier

38 ni.com
Example: Amplification and the Signal-to-Noise
(SNR) Ratio
10 mV Signal 1 mV Noise
» SNR = 10
1000x
Amplifier
1 mV Noise
ADC
ADC
1000x
Amplifier
10 mV Signal
» SNR = 10,000

39 ni.com
Attenuation
• Decreases the input signal amplitude to fit within the
range of the DAQ device
• Necessary when input signal voltages are beyond the
range of the DAQ device
Attenuator

40 ni.com
Filtering
Filters remove unwanted noise from a measured signal
and block unwanted frequencies
Time Domain Lowpass
Filter
Frequency Domain
Time Domain
Frequency Domain

41 ni.com
Filtering
• Passband • Frequencies the filter lets pass
• Ripple • Filter’s effect on the signal’s
amplitude
• Corner • Frequency where the filter
begins blocking the signal
• Rolloff • How sharply the filter cuts off
unwanted frequencies Example Bode Plot
Frequency
Gain
(dB
)
Ripple
Rolloff
Corner
fc
Passband
A filter’s attributes are typically described using Bode Plots

42 ni.com
Isolation
Isolation helps to pass a signal from its source to a
measurement device without a direct physical connection
• Blocks high common-mode signals
• Breaks ground loops
• Protects your instrumentation
Electromagnetic
Capacitive
Optical
Isolation

43 ni.com
Architecture of an Integrated Measurement System
NI CompactDAQ hardware combines a 1-, 4-, or 8-slot chassis
with over 50 measurement-specific NI C Series I/O modules and
can operate stand-alone with a built-in controller or connect to a
host computer over USB, Ethernet, or 802.11 Wi-Fi.
Sensor
Signal
Conditioning
Analog-to-Digital
Converter
Measurement Device Software
Driver
Software
Application
Software

44 ni.com
NI Data Acquisition Hardware Families
Portable DAQ
Easily connect to any laptop
or desktop with simple setup
NI CompactDAQ
Customize with a variety of
chassis and module types
PXI
Optimized for high channel
counts and tight synchronization
Desktop DAQ
Install in a desktop PC slot for
maximum data throughput
System
Single Device

45 ni.com
Sensors/Signals
Thermocouple
C Series Modules
NI CompactDAQ Is an Integrated, Modular Solution
Accelerometer
Strain Gage
Solar Cell
(etc)

46 ni.com
C Series I/O Modules
• Over 100 NI and Partner Modules • Analog Input
• Analog Output
• Digital I/O
• Relay Output
• Counter, Pulse Generation
• Communication o CAN
o LIN
o PROFIBUS
• Motion Control
• Wireless
• Engine Control
• Signal Conditioning
• Rugged Mechanicals
• Signal Conditioning/Filtering
• Isolation Barrier

47 ni.com
ni.com
Combining Software and Hardware Into an Integrated System
Automated Measurement Solutions With LabVIEW and NI DAQ
49 ni.com
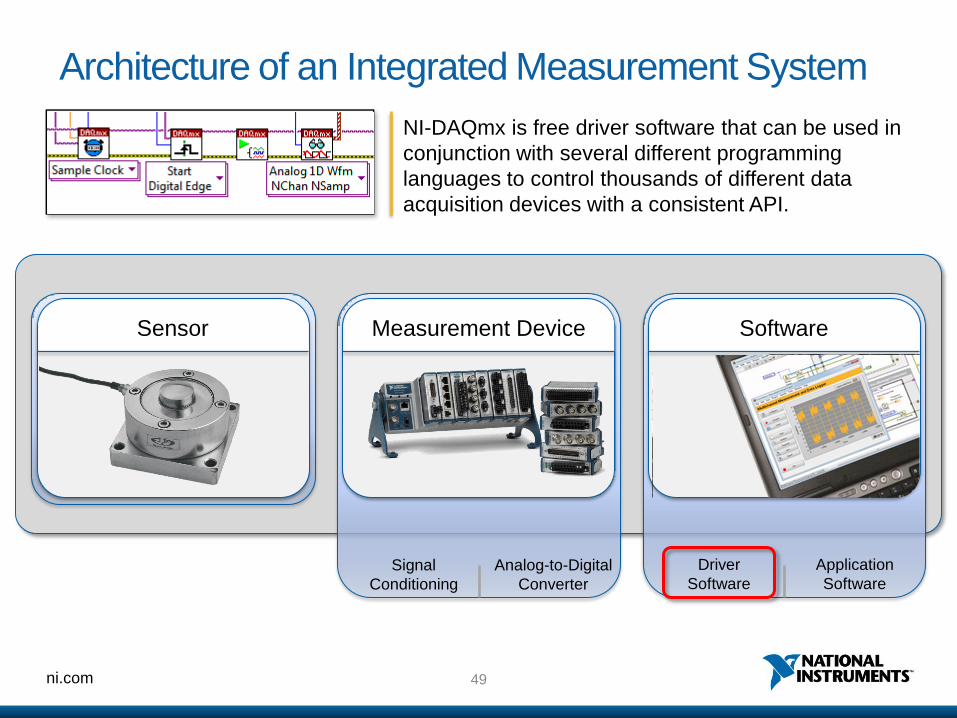
Architecture of an Integrated Measurement System
NI-DAQmx is free driver software that can be used in
conjunction with several different programming
languages to control thousands of different data
acquisition devices with a consistent API.
Sensor
Signal
Conditioning
Analog-to-Digital
Converter
Measurement Device Software
Driver
Software
Application
Software

50 ni.com
Bridging the Hardware and Software Gap with NI-DAQmx
NI-DAQmx is a single, free hardware driver that supports
various development languages and hundreds of NI data
acquisition hardware platforms.
The mark LabWindows is used under a license from Microsoft Corporation.
Windows is a registered trademark of Microsoft Corporation in the United States and other countries.

51 ni.com
Comparing Basic DAQ Drivers to NI-DAQmx
Application Software
DAQ Hardware
Driver Engine
Driver Engine
API
DAQ Assistant
Configuration
Manager
Basic DAQ Driver Architecture NI-DAQmx Driver Architecture

52 ni.com
Measurement & Automation Explorer (MAX) Free, unified configuration management utility for NI hardware
Task and
Channel Creation
Configuration
and Connection
Management Simulated
Devices
Built-In Signal
Connection
Diagrams
Test Panel
Windows

53 ni.com
Exercise 1: Using Measurement & Automation
Explorer
• Become familiar with the Devices and Interfaces section
of MAX and explore the test panel functionality.

54 ni.com
NI-DAQmx API: Configuration-Based DAQ Assistant
• Enables quick, configuration-based measurements
• Usable across multiple channels, multiple devices
• Maximum ease of use with some sacrificed flexibility
• Supported across multiple programming languages
• Automatically generates lower-level code

55 ni.com
Exercise 2: Generate Code by Using the DAQ
Assistant in LabVIEW
• Implementing a code on LabVIEW for temperature
measurement using the DAQ Assistant Express VI.

56 ni.com
• Maximizes flexibility and enables low-level control
• The basic flow:
Configure
Channel
Configure
Timing
Configure
Triggering
Start
Acquisition
Read
Data
Clear
Task
NI-DAQmx API: Low-Level LabVIEW VIs
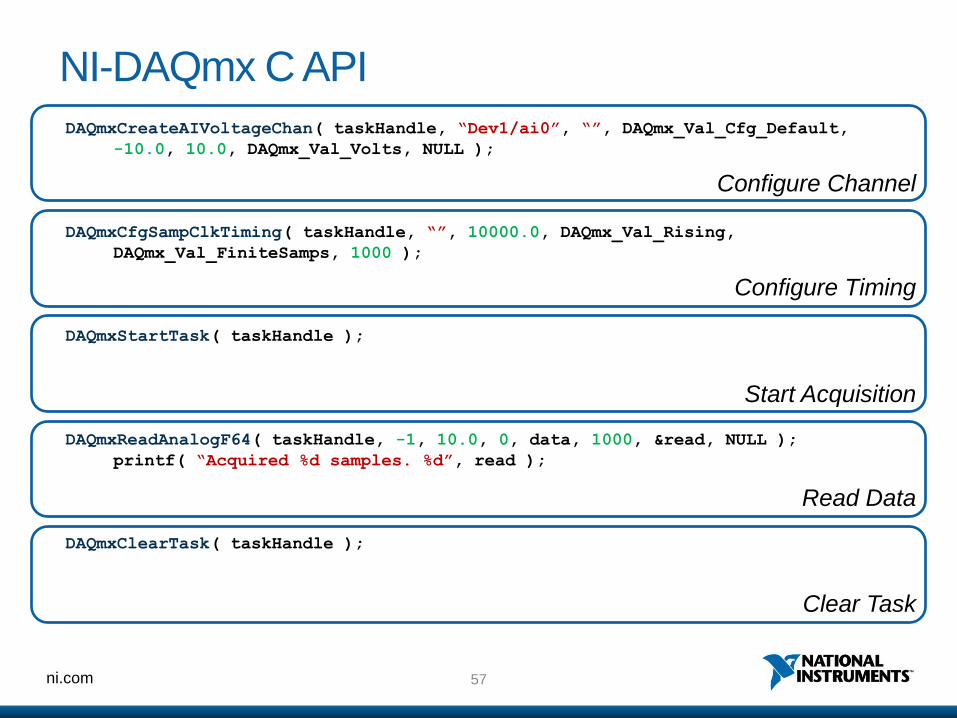
57 ni.com
DAQmxCreateAIVoltageChan( taskHandle, “Dev1/ai0”, “”, DAQmx_Val_Cfg_Default,
-10.0, 10.0, DAQmx_Val_Volts, NULL );
DAQmxCfgSampClkTiming( taskHandle, “”, 10000.0, DAQmx_Val_Rising,
DAQmx_Val_FiniteSamps, 1000 );
DAQmxStartTask( taskHandle );
DAQmxReadAnalogF64( taskHandle, -1, 10.0, 0, data, 1000, &read, NULL );
printf( “Acquired %d samples. %d”, read );
DAQmxClearTask( taskHandle );
Read Data
Clear Task
Start Acquisition
Configure Timing
Configure Channel
NI-DAQmx C API

58 ni.com
NI-DAQmx Channels
• NI-DAQmx channels encompass:
• Measurement type, sensor/signal type
• Terminal configuration
• Physical connection settings
• Name
• Min/Max Value
o Used to determine
amplification level
• Custom Scaling
o Ex: thermocouple generates a
mV signal; NI-DAQmx
upscales to °C

59 ni.com
Timing
• Allows you to configure acquisition timing
• Set sample clock, rate of acquisition, and number
of samples to acquire or generate
Timing Option Description
Finite Samples
Acquire or generate a configurable
number of samples at a configurable
rate.
Continuous Samples
Acquire or generate samples
continuously, until explicitly stopped by
the API.
Hardware-Timed Single Point
Acquire or generate samples
continuously on the edge of a hardware
clock.
60 ni.com
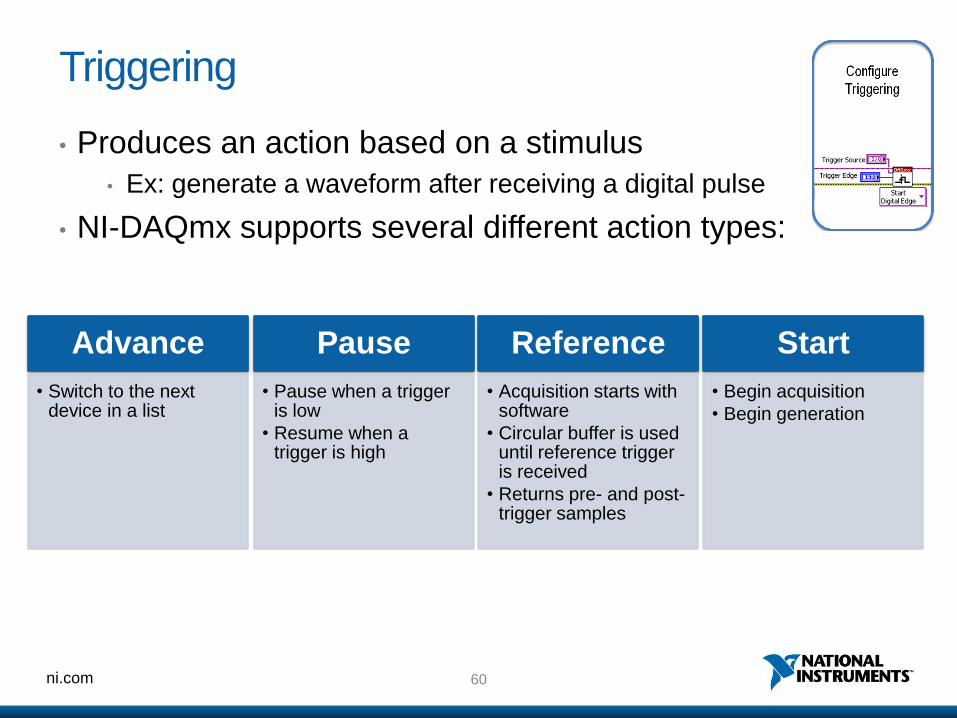
Triggering
• Produces an action based on a stimulus
• Ex: generate a waveform after receiving a digital pulse
• NI-DAQmx supports several different action types:
Advance
• Switch to the next device in a list
Pause
• Pause when a trigger is low
• Resume when a trigger is high
Reference
• Acquisition starts with software
• Circular buffer is used until reference trigger is received
• Returns pre- and post-trigger samples
Start
• Begin acquisition
• Begin generation

61 ni.com
Triggering
• Event-driven acquisition or generation
• Valid for finite or continuous operations
• Example: acquire 5 samples on a start trigger:
Start Trigger
Clock
Start of
Acquisition
1 2 3 4 5 …

62 ni.com
Trigger on Falling Edge
• Accepts TTL/CMOS-compatible signals
• 0 to 0.8 V = logic low
• 2.2 to 5 V = logic high
• Trigger on rising or falling edge of signal
Trigger Types—Digital Edge Triggering
Trigger on Rising Edge
Begin Acquisition Begin Acquisition

63 ni.com
Falling Slope with Level 2.7 Rising Slope with Level 2.7
Trigger Types—Analog Edge Triggering
• Trigger off signal level and slope
• Slope can be rising or falling
0
2.7
Level and slope
initiate data capture
Captured
data
0
2.7
Level and slope
initiate data capture
Captured
data

64 ni.com
Exercise 3: Generate Code Using the DAQ low-level VIs
• Implementing a code on LabVIEW for vibration
measurement using the DAQmx low-level VIs.

65 ni.com
Family Highlight: Stand-Alone NI CompactDAQ Embedded Measurements and Logging
• >50 I/O modules
• Up to 24-bit, Up to 1 MS/s
• Dual-core processor
• 32 GB nonvolatile storage
• 0 to 55 °C Operating Temp
• 5g shock, 30g vibration
• Windows or Real-Time OS
• LabVIEW and NI-DAQmx

66 ni.com
Utilizing Technology Trends With an Integrated Platform
Data Dashboard for LabVIEW
Control and visualize data from LabVIEW systems on an iPad

67 ni.com
NI LabVIEW Certifications
Certified
LabVIEW
Architect
Certified
LabVIEW
Developer
Certified LabVIEW
Associate Developer
Certified
LabVIEW
Architect
Certified
LabVIEW
Developer
Certified LabVIEW
Associate Developer
On May 16th, FREE
Certified LabVIEW
Associate Developer!!

68 ni.com
Thank You!!