introduction to marine radiochemistry - mit … · introduction to marine radiochemistry 1. ......
TRANSCRIPT

Introduction to Marine Radiochemistry
1. Isotopes and radioactive decay
2. Mathematical description of radioactive decay
3. Decay of a parent isotope to a stable daughter
Example: radiocarbon dating
4. Decay series
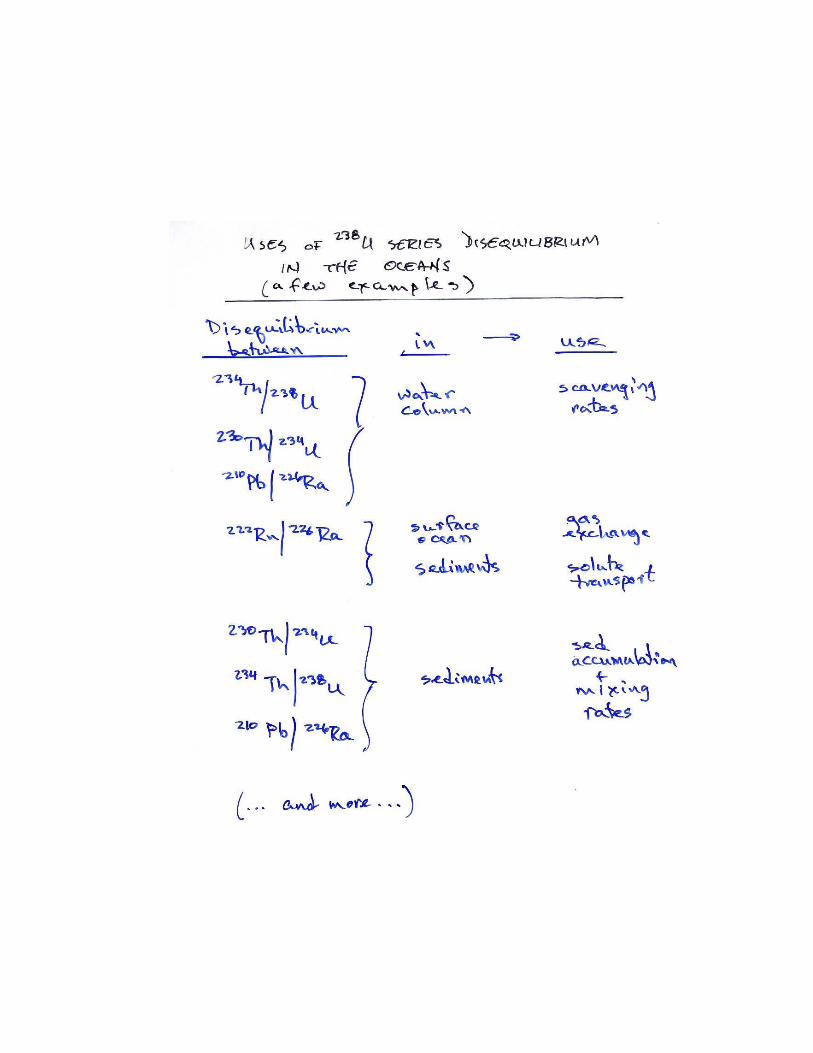
MathU, Th series in oceanographyExamples : Th isotopes

Atoms and Chemical Elements
Atom: a nucleus surrounded by electrons:
Atomic radius ~ 10-8 cm
Nuclear radius ~ 10-12 cm
Nuclear density ~ 1014 g/cm3 !
The nucleus consists primarily of
positively charged protons
electrically neutral neutrons
A chemical element is characterized by a specific number of protons in its nucleus; different isotopes of an element contain
different numbers of neutrons

Notation
Z = atomic number (= number of protons in nucleus)
N = neutron number
A = Z + N = mass number
A
Z
238U (the “92” is redundant with “U” and
92 is usually omitted)
Or, an element with several isotopes:
12C ,136 C ,14
6 C6

Holden, N. E., and F. W. Walker. Chart of the Nuclides. 11th ed. Schenectady, NY: General Electric Co., 1972. Image removed due to copyright restrictions.

Chart of the nuclides: expanded view
Holden, N. E., and F. W. Walker. Chart of the Nuclides. 11th ed. Schenectady, NY: General Electric Co., 1972. Image removed due to copyright restrictions.

The unstable nuclides -- “radionuclides”
If so many nuclides are unstable, why are they around?
1. Formed during initial nucleosynthesis, but decay very slowly: e.g., 238U, 235U, 232Th
2. Formed by decay of slowly-decaying parent isotope
3. Formed by a naturally occurring process, e.g., comsogenic isotopes: 14C
4. Anthropogenic: e.g. nuclear bomb testing and nuclear energy production, e.g., Pu isotopes, 3H, 137Cs,…

Example : E- Decay
Neutron ����o� proton � electron
For example,
40Ca � E �
Zdaughter Zparent�1 •We can measure
Adaughter Aparent
40K ����o�20 � Q� � Energy19
Ndaughter Nparent�1
E particles

Num
ber o
f β − P
artic
les
Energy of β − Particles in million
Emax= 1.350 +_ 0.05 MeV
1.51.00.50
Energy spectrum of beta particles emitted by 40 19 K. Note that most of the beta particles
are emitted with energies that are about one-third of the maximum or end point energy. During each beta decay, a neutrino is emitted with a kinetic energy equal to the difference between the maximum energy and the kinetic energy of the associated beta particle.
The energy emitted is always the same for a given transition; the energy of the β particle varies up to a maximum.When Eβ < Emax , a neutrino is emitted (υ )
Distribution of β energies:
Electron Volts (MeV)
Atomic Number (Z)
Ground state
Excited states
Ener
gy in
Mill
ion
Elec
tron
Volts
(MeV
)
0
1.0
2.0
3.0
12 13
γ, 0.8438 MeV γ, 1.0144 MeV
γ, 0.1707 MeV
27 13 AI
27 13 Al
27 12 Mg
20%β −, 1.60 ΜeV
80%β −, 1.77 Μ
eV
Figure by MIT OCW.
Figure by MIT OCW.

Example : D decay
Decay by emission of a 4He nucleus…
228Th����o�88 224Ra �D �Energy90
Energy 1 MD vD
2 ¨�¨�§� 1 �
MD ¸�·�
2 ©� ¸�M p ¹�
Kinetic energy of “recoil” energy D particle
Ndaughter Nparent�2Zdaughter Zparent�2Adaughter Aparent�4

En
erg
y i
n m
illi
on
ele
ctro
n v
olt
s (M
eV) 5.4
0.3
0.2
0.1
0.0 Ground State Daughter
Parent 5.519 MeV
228Th90
Excited States of 224Ra
α, 5.173
α,5.
338,
28%
α,5.4
21, 71%
α, 5.2
08, 0
.4%
0.2%
γ 0.217
γ 0.084
γ 0.133
γ 0
.16
9
224Ra88
88 90
Atomic Number (Z)
Atomic #
Decay scheme diagram for the alpha decay diagram
for the alpha decay of 228Th to 224Ra . In this case,90 88
four different alpha particles are emitted with four
complementary gamma rays.
Figure by MIT OCW.


(3) '14 C 1000 §̈�©�� e ��date �1950 � f m � 1 ·̧�¹
��
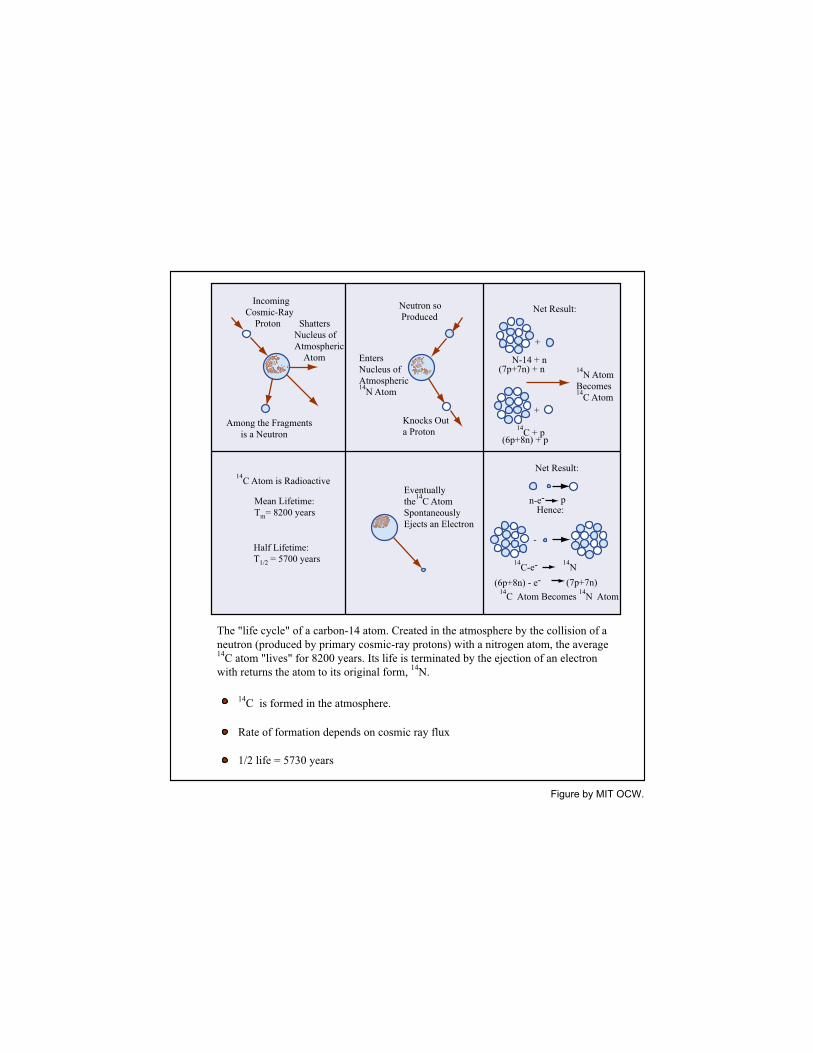
Incoming Cosmic-Ray
Proton Shatters Nucleus of Atmospheric
Atom
Among the Fragments is a Neutron
14C Atom is Radioactive
Mean Lifetime: Tm= 8200 years
Half Lifetime: T1/2 = 5700 years
Neutron so Produced
Enters Nucleus of Atmospheric14N Atom
Knocks Out a Proton
Eventually the14C Atom Spontaneously Ejects an Electron
Net Result:
+
N-14 + n (7p+7n) + n 14N Atom
Becomes 14C Atom
+
14C + p(6p+8n) + p
Net Result:
n-e pHence:
-
14 14C-e- N (6p+8n) - e (7p+7n)
14C Atom Becomes 14N Atom
The "life cycle" of a carbon-14 atom. Created in the atmosphere by the collision of a neutron (produced by primary cosmic-ray protons) with a nitrogen atom, the average14C atom "lives" for 8200 years. Its life is terminated by the ejection of an electron with returns the atom to its original form, 14N.
14C is formed in the atmosphere.
Rate of formation depends on cosmic ray flux
1/2 life = 5730 years
Figure by MIT OCW.


Radiocarbon in Atmosphere
cal BP
cal BC cal AD cal BP
600
500
400
Δ 14 C
% 300
200 ATMOSPHERE
100
0
-100 30000 25000 20000 15000 10000 5000 [0]
11000 10000 9000 8000 140
120
100
9000 8000 7000 6000
80
60
40
Δ 14 C
%
The atmosphere Δ14C record as derived from: dendrochronologically calibrated bidecadal tree-ring 14C measurements ( from 9440 BC to AD 1950), a cubic spline through the 234U/230Th-calibrated coral 14C averages corrected by 400 14C yr ( from 20,000 to 9440 BC), and a smooth transition from an assigned pre-25,000 BC steady-state value of 500% ( ). The coral measurements (Bard et al. 1993) are shown as circles with 2 σ error bars. For the detailed coral/tree-ring comparison in the inset, the coral ages (1 σ error bars) were converted to cal ages using the marine calibration curve (Fig. 17) with ΔR = 0.
Tree-ring Calibration Curve
8000
7000
Rad
ioca
rbon
yea
rs B
P R
adio
carb
on 'a
ge' B
P
6000
5000
4000
3000
2000
1000
0 7000 6000 5000 4000 3000 2000 1000 0 1000 2000
BC AD Calender date
600
500
400
1400 1500 1600 1700 19001800 2000 cal AD
Detail of Calib Curve
300
200
100
0
Figure by MIT OCW.
Figure by MIT OCW.
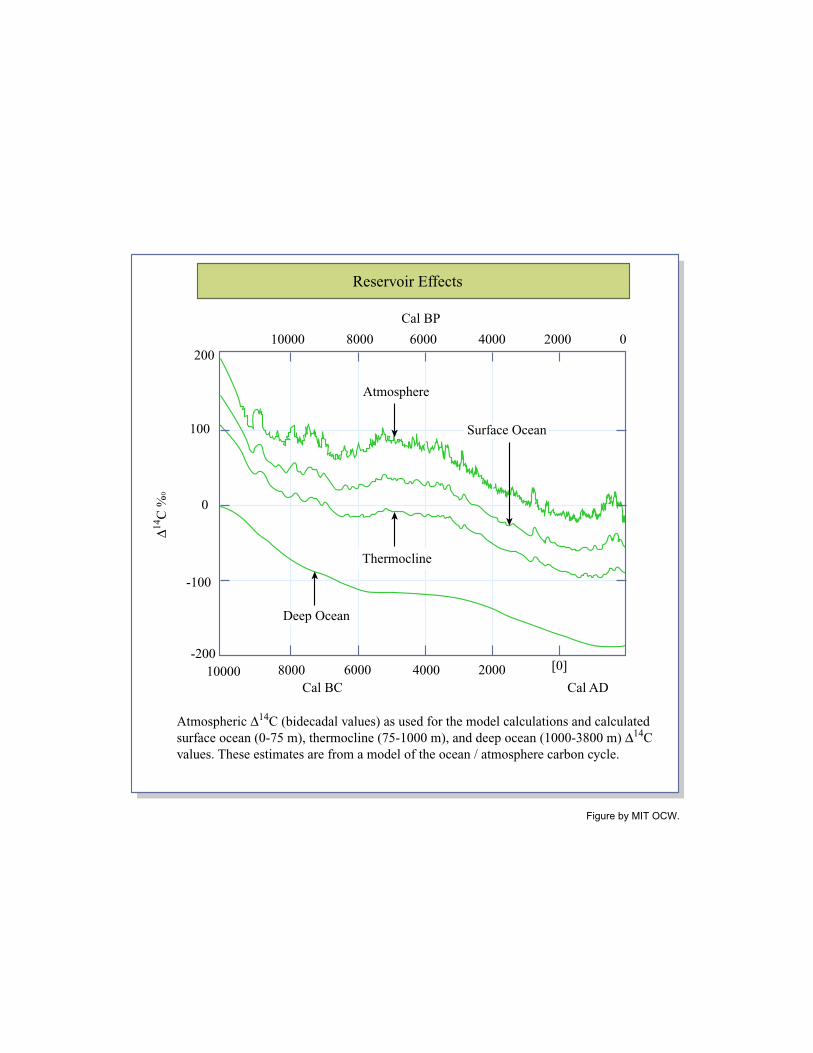
200
-200
100
-100
0
8000 4000 [0]10000 6000 2000
10000 8000 6000 4000 2000 0
Atmosphere
Surface Ocean
Thermocline
Deep Ocean
Cal BP
Cal BC Cal AD
Δ 14 C
%0
Atmospheric Δ14C (bidecadal values) as used for the model calculations and calculated
surface ocean (0-75 m), thermocline (75-1000 m), and deep ocean (1000-3800 m) Δ14C
values. These estimates are from a model of the ocean / atmosphere carbon cycle.
Reservoir Effects
Figure by MIT OCW.

Figure by MIT OCW.
2. Bomb Testing
110011001000 900 800 700 600 500 400 300 200 100100
0 -100
1954 1956 1958 1960 1962 1964 1966 1968 1970 1972 1974 1976 1978 1980 1982 1984 1986 1988 1990 1992
Northern Hemisphere
Southern Hemisphere
Geo
secs
Atla
ntic
Geo
secs
Indi
an
Geo
secs
Pac
ific Radiocarbon in
Atmospheric CO2
Atmospheric Nuclear Weapon Tests 1954 1992 Observed time history for the 14C/C ratio in ground level air. Before 1970, a clear difference can be seen between the northern and southern
hemispheres, and also a clear seasonality appears in both records. These features are related to injections of bomb 14C from stratosphere to
troposhpere (mainly in the northern hemisphere). Times and magnitudes of the atmospheric weapons tests are shown. Although the test ban
treaty was implemented at the begining of 1963, several small Chinese and French atmospheric tests were conducted after this time.
� 14C
%0
Figure by MIT OCW.
Anthropogenic Perturbations of Atmospheric 14C content
1. The Suess Effect
? ?
Suess Effect
de Vries effect+20
-20
+10
-10
O
� 14 C
%0
1900 1800 1700 1600 1500 1400 1300 1200 1100 1000 Historical Date, A.D.
Deviation of the initial radiocarbon activity in per mil of wood samples of known age relative to 95 percent of the activity of the oxalic acid standard of the National Bureau of Standards. The observed activities were corrected for carbon isotope fractionation and recalculated using a value of 5730 years for the half-life of 14C. The decline in the radiocarbon content starting at about 1900 results from the introduction of fossil CO2 into the atmosphere by the combustion of fossil fuels (Suess effect). The anomalously high radiocarbon activity around 1710 and 1500 A.D. is known as the "de Vries effect." Its causes are not understood.

92
90
88
86
84
82
80
124 126 128 130 132 134 136 138 140 142 144 146
206
206
210
210
214
214
218 222
226
230
234
234
234
218
218
214210
210
206
Pb Pb Pb
Po Po Po
Bi Bi
Ti Ti
Hg
Rn Rn
Ra
β
β
β
β α
α
At
Th Th
U 238 U
Pa
Neutron Number
Ato
mic
Num
ber
The Decay of 238U to Stable 238Pb
Abundances, Half-Lives, and Decay Constants of the Principle Naturally Occurring Isotopes of Uranium and Thorium
Isotope ReferenceAbundance % Half-Life y
99.2739
Decay Constant y-1
238U
235U
234U
232Th
0.7204
0.0057
100
4.510 x 10⁹ 1.537 x 10⁻¹⁰
1.55125 x 10-104.468 x 10⁹
0.7129 x 10⁹
0.7038 x 10⁹
2.48 x 10⁹
13.890 x 10⁹
14.008 x 10⁹
9.722 x 10⁻¹⁰
9.8485 x 10⁻¹⁰
2.806 x 10⁻⁶
4.990 x 10⁻¹¹
4.948 x 10⁻¹¹
1
1. Kovarik and Adams (1955)
2 3 2 4 5 6
2. Jaffey et al. (1971) 3. Fleming et al. (1952)4. Strominger et al. (1958)5. Picciotto and Wilgain (1956)6. LeRoux and Glendenin (1963)
The 238U Decay Series
Figure by MIT OCW.

Parent, N1
Daughter, N2

200
100 80 60
40
20
10 8 6
4
2
1 0 2 4 6 8 10 12
Time in Hours
Equal Decay Rates Lo
g N
N1(T1/2 = 10 h)
N2(T1/2 = 1 h)
S = -λ1N1
S = -λ2N2
λ(N2) = 1 hr
Decay of a long-lived parent (N1) to a short-lived daughter (N2). The half-life of the parent is 10 hours, while that of the daughter is 1 hour. The number of daughter atoms increases as a function of time from an initial value of zero. Eventually in this system the ratio of parent to daughter assumes a constant value equal to λ2 - λ1/λ1, and a radiochemical equilibrium is thereby established. Note that the ordinate is in units of log N which is related to 1n N by 1n N = 2.303 log N.
Figure by MIT OCW.

Decay Series Chemical Properties and the Potential for Radioactive Disequilibrium in the Oceans
Np
Soluble U
Pa
Th
Ac
Ra
Fr
Rn
At
Po
Bi
Pb
Tl
U-238
4.51x10³y
Th-234
24.1d
Th-230
7.52x10⁶y
Po-234
1.18m
U-234
2.48x10⁵y
Ra-226
1622y
Rn-222
3825d
Po-218
3.05m
Po-214
1.6x10⁻⁴s
Pb-214
26.8m
Bi-214
19.7m
Pb-210
22.3y
Bi-210
5.0d
Pb-206
Po-210
138.4d
Th-232
1.39x10¹⁰y
Ra-228
5.75y
Ac-228
6.13h
Th.228
1.90y
Ra-224
3.64d
Rn-220
54.5s
Po-216
0.158s
Pb-212
10.6h
65%
35%
Po-212
3.0x10⁻⁷s
Bi-212
60.5m
Tl-208
3.1m
Pb-208
U-235
7.13x10⁸y
Th-231
25.6h
Po-231
3.2x10⁴y
Ac-227
22.0y
Th-227
18.6d
Ra-223
11.4d
Rn-219
3.92s
Po-215
1.83x10⁻³s
Pb-211
36.1m
Bi-211
2.16m
Tl-207
4.79m
Pb-207
α
α
β−
α
Soluble
Particle Reactive
Particle Reactive
Gas
U-238 SERIES U-235 SERIESTh-232 SERIES
Figure by MIT OCW.

The U238 Series in Seawater
U238
Th234
Green
U234
ca, 10-a total Th230
Ra226
Pb210
Secular equilibrium
0 1 2 3
Po210
Concentration in seawater/(d.p.m.1-1)
Concentrations of the longer-lived members of the U238 decay series in seawater arranged in descending order within the series. The values chosen are representative of deep ocean water. Somewhat different relationships are found in the surface waters. Shaded areas represent the suspended particulate fraction. Deficiencies of Th230 and Pb210 relative to their parent nuclides result from scavenging. A Th234 deficiency is not found because of the short half-life, but a significant uptake by the suspended particles is evident.
Figure by MIT OCW.

0 1 2 3
25
75
125
175
225
Dep
th (m
)
Total Activity (d.p.m. l-1)
234Th
238U
Typical profile of 234Th in the upper open ocean. Shaded area represents disequilibrium between total 234Th and 238U. Data taken from VERTEX 3 (ref. 11.)
Figure by MIT OCW.


1000
800
600
400
200
0 0.0 0.2 0.4 0.6 0.8 1.0
3
21
Fast
er
Slow
er
τ sca
v (da
ys)
A234 / A238
= 34.8 daysλ234
1
234Th / 238U Disequilibrium - Surface Ocean
Figure by MIT OCW.


NH Pacific
NH Atlantic
Slope SAR Sea
0
1000
2000
3000
4000
5000
6000
200
0.0 0.2 0.4 0.6 0.8 1.0 1.2 1.4 1.6 1.8 2.0 2.2 2.4
~ 1dpm / 1000 L
TH-230, DPM/1000 L
230Th in the Deep Ocean
Thorium-230 Profiles
Thorium-230 distributions measured in ocean-water profiles by alpha-counting.
DEP
TH, K
Figure by MIT OCW.


Figure by MIT OCW.

Excess Pb = 210 (dpm/g)
Dep
th (c
m)
-1 1 10 100 0 2 4 6 8 10 12 0 0
10
Dep
th (c
m) 20
30
100
PC-7 200
s = 0.28 cm/y40 BC-5
50 s = 0.34 cm/y
300
Depth profiles of excess 210Pb and 14C age (organic carbon fraction) for a box core and a piston core collected from the eastern Bransfield strait. The agreement in accumulation rates indicates that bioturbation has a negligible effect on the distribution of these naturally occurring radionuclides in the seabed.
Figure by MIT OCW.