introduction to mobile sensing with smartphones uichin lee kse 801 nov. 16, 2011
TRANSCRIPT
Introduction to Mobile Sensing with Smartphones
Uichin LeeKSE 801
Nov. 16, 2011
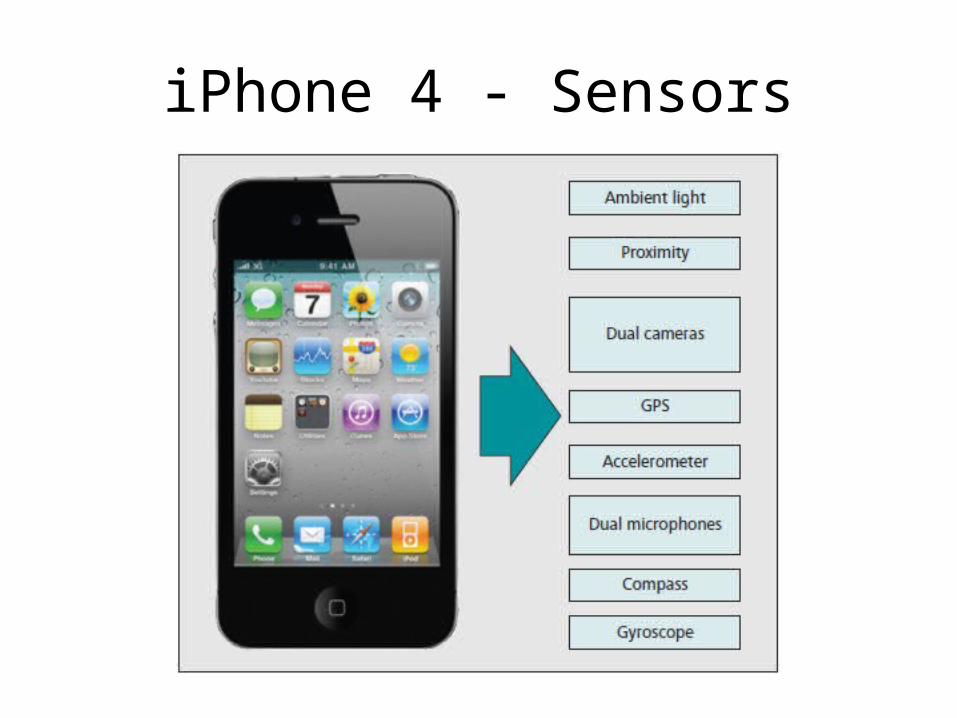
iPhone 4 - Sensors

Applications
• Transportation– Traffic conditions (MIT VTrack, Nokia/Berkeley
Mobile Millennium) • Social Networking
– Sensing presence (Dartmouth CenceMe) • Environmental Monitoring
– Measuring pollution (UCLA PIER)• Health and Well Being
– Promoting personal fitness (UbiFit Garden)
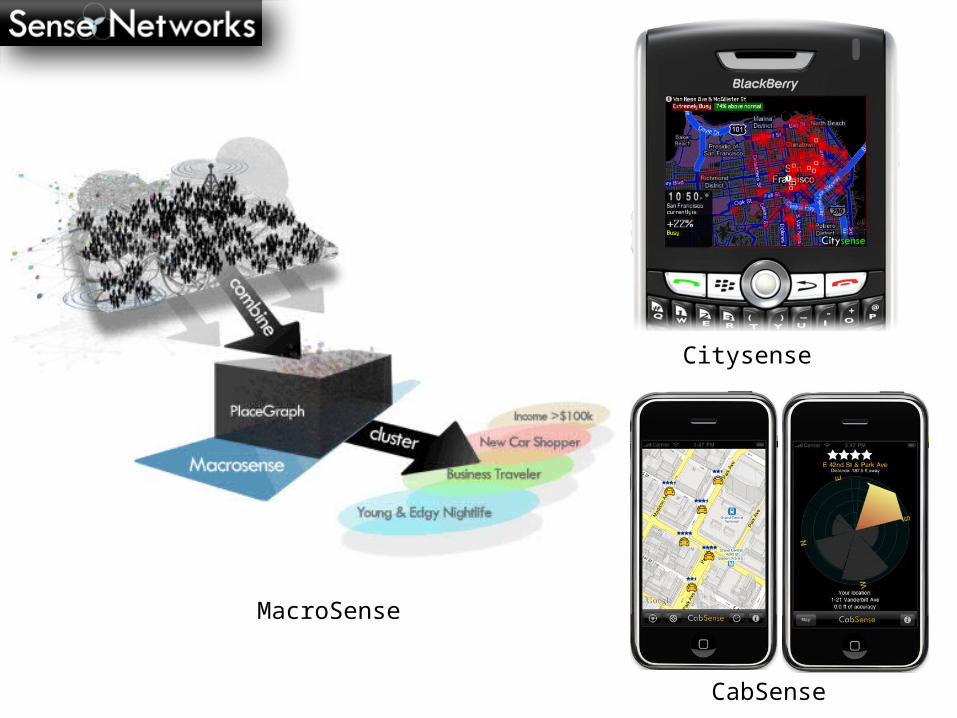
Citysense
MacroSense
CabSense
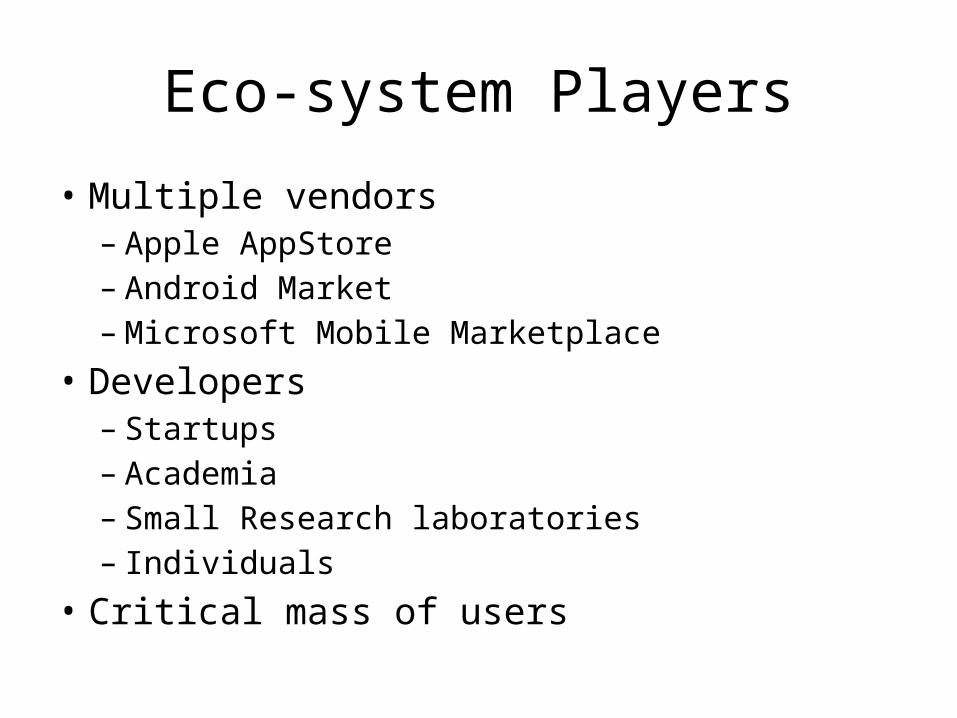
Eco-system Players
• Multiple vendors– Apple AppStore– Android Market– Microsoft Mobile Marketplace
• Developers– Startups– Academia– Small Research laboratories– Individuals
• Critical mass of users

Scale of Mobile Sensing
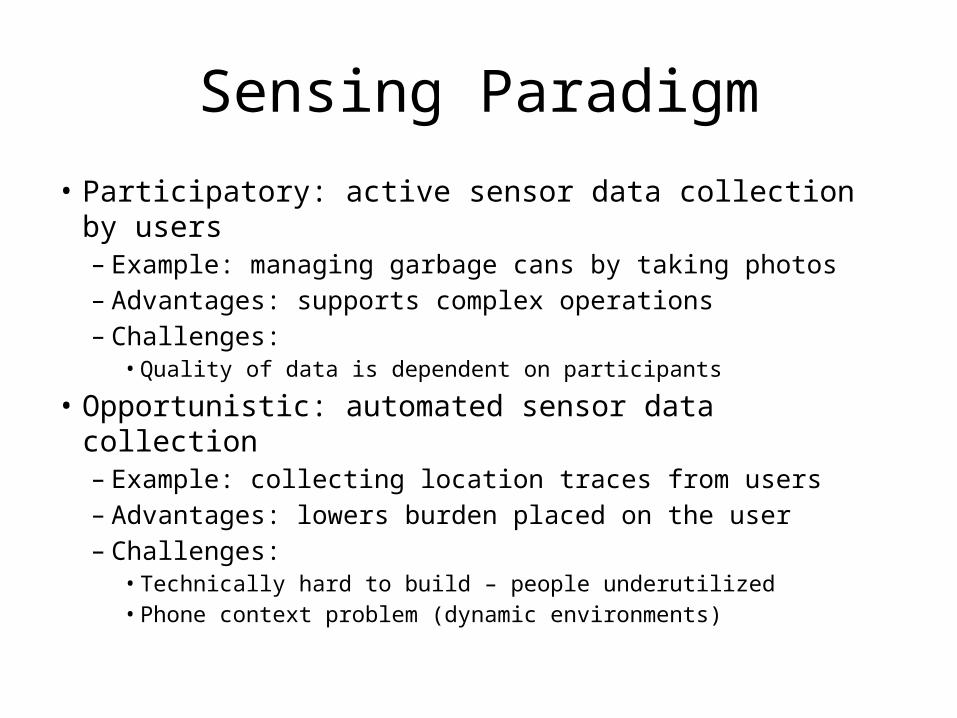
Sensing Paradigm
• Participatory: active sensor data collection by users– Example: managing garbage cans by taking photos – Advantages: supports complex operations– Challenges:
• Quality of data is dependent on participants
• Opportunistic: automated sensor data collection– Example: collecting location traces from users– Advantages: lowers burden placed on the user– Challenges:
• Technically hard to build – people underutilized• Phone context problem (dynamic environments)
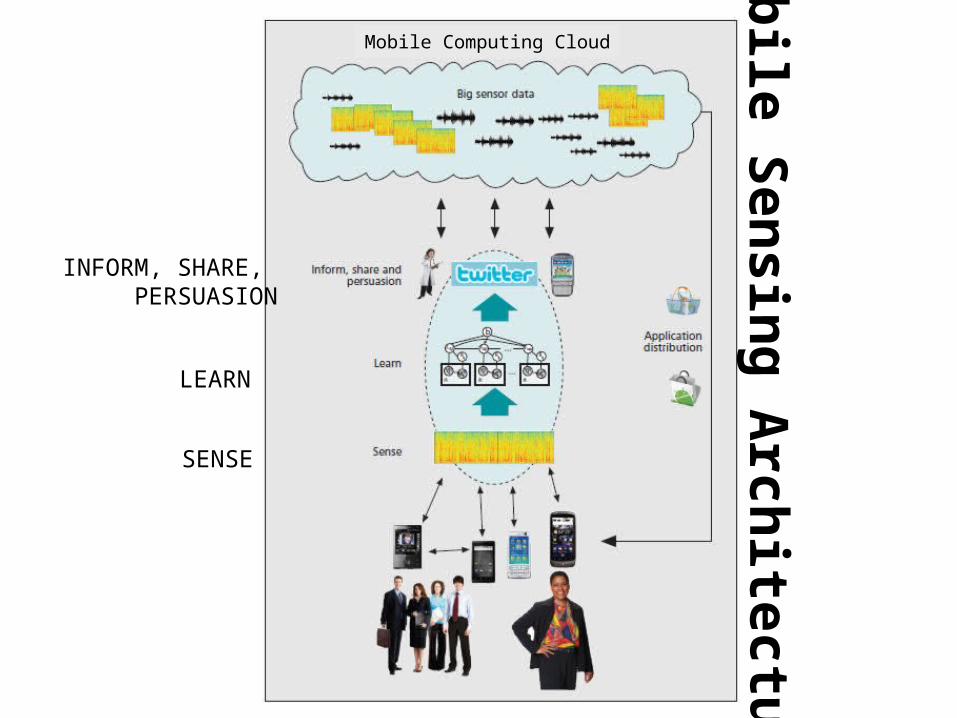
SENSE
LEARN
INFORM, SHARE, PERSUASION
Mobile Sensing Architecture
Mobile Computing Cloud
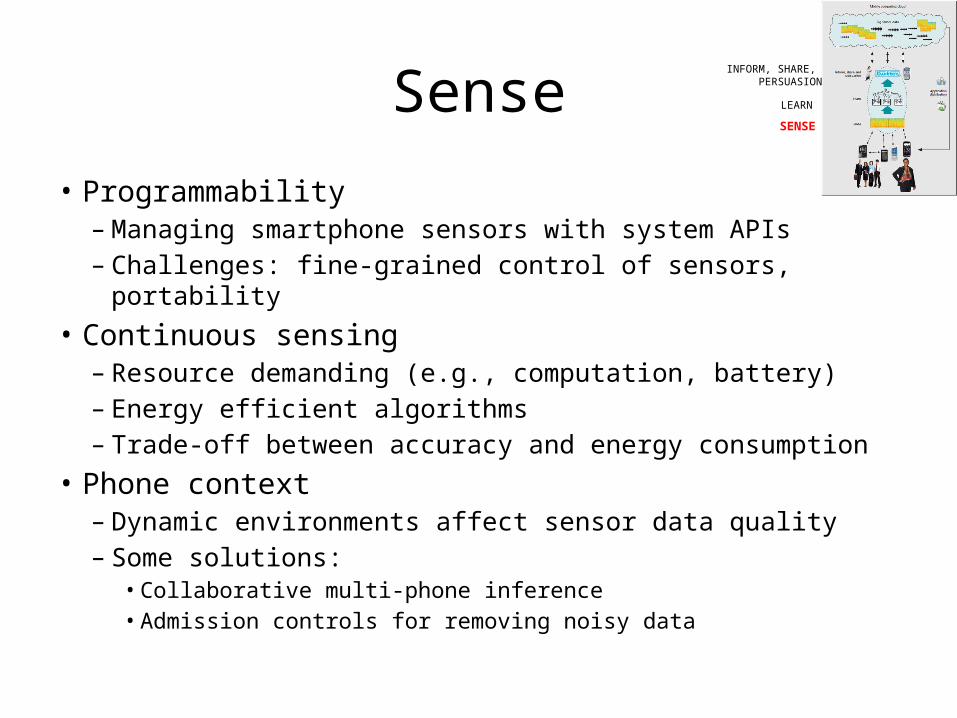
Sense
• Programmability– Managing smartphone sensors with system APIs– Challenges: fine-grained control of sensors, portability
• Continuous sensing– Resource demanding (e.g., computation, battery)– Energy efficient algorithms– Trade-off between accuracy and energy consumption
• Phone context– Dynamic environments affect sensor data quality– Some solutions:
• Collaborative multi-phone inference• Admission controls for removing noisy data
SENSE
LEARN
INFORM, SHARE, PERSUASION
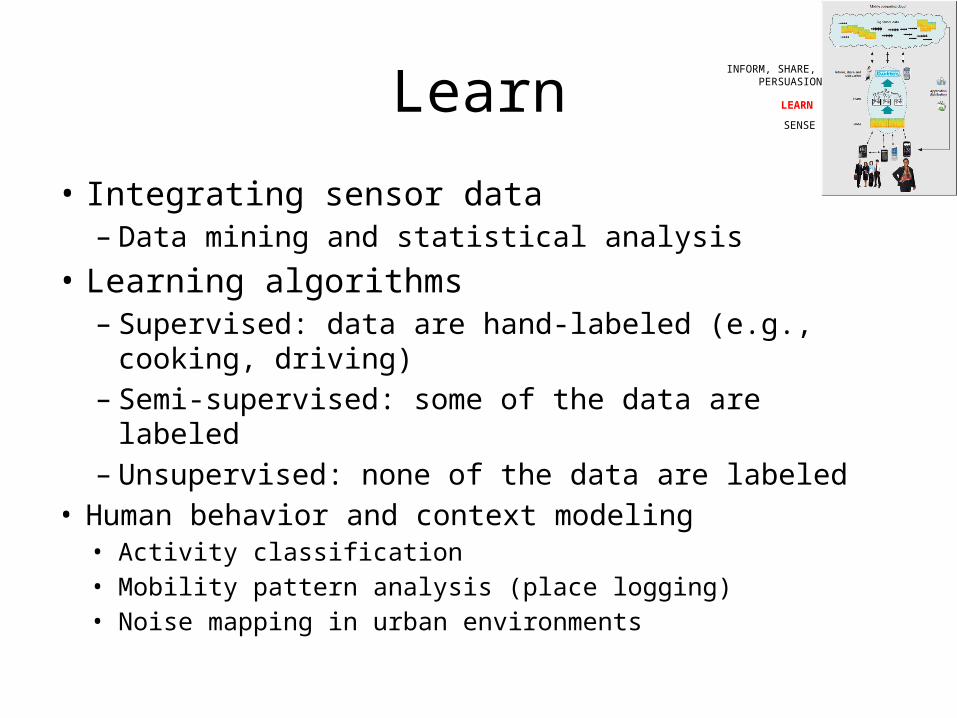
Learn
• Integrating sensor data– Data mining and statistical analysis
• Learning algorithms – Supervised: data are hand-labeled (e.g., cooking, driving)– Semi-supervised: some of the data are labeled– Unsupervised: none of the data are labeled
• Human behavior and context modeling• Activity classification• Mobility pattern analysis (place logging)• Noise mapping in urban environments
SENSE
LEARN
INFORM, SHARE, PERSUASION

Learn: Scaling Models
• Scaling model to everyday uses – Dynamic environments; personal differences – Large scale deployment (e.g., millions of people)
• Models must be adaptive and incorporate people into the process
• If possible, exploit social networks (community guided learning) to improve data classification and solutions
• Challenges:– Lack of common machine learning toolkits for smartphones– Lack of large-scale public data sets – Lack of public repository for sharing data sets, code, and tools
SENSE
LEARN
INFORM, SHARE, PERSUASION
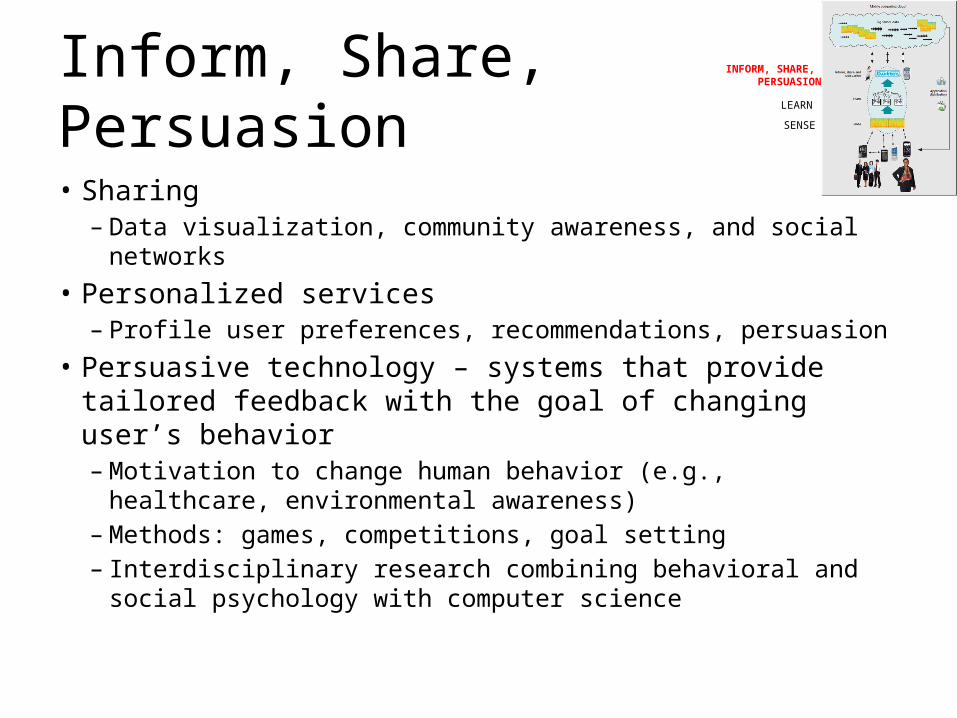
Inform, Share, Persuasion
• Sharing– Data visualization, community awareness, and social networks
• Personalized services– Profile user preferences, recommendations, persuasion
• Persuasive technology – systems that provide tailored feedback with the goal of changing user’s behavior– Motivation to change human behavior (e.g., healthcare,
environmental awareness)– Methods: games, competitions, goal setting– Interdisciplinary research combining behavioral and social
psychology with computer science
SENSE
LEARN
INFORM, SHARE, PERSUASION
Privacy Issues
• Respecting the privacy of the user is the most fundamental responsibility of a mobile sensing system
• Current solutions– Cryptography– Privacy-preserving data mining– Processing data locally versus cloud services– Group sensing applications is based on user
membership and/or trust relationships
Privacy Issues
• Reconstruction type attacks– Reverse engineering collected data to obtain invasive
information • Second-hand smoke problem
– How can the privacy of third parties be effectively protected when other people wearing sensors are nearby?
– How can mismatched privacy policies be managed when two different people are close enough to each other for their sensors to collect information?
• Stronger techniques for protecting people’s privacy are needed
Understanding Smartphone Sensors:accelerometer, compass, gyroscope,
location, etc
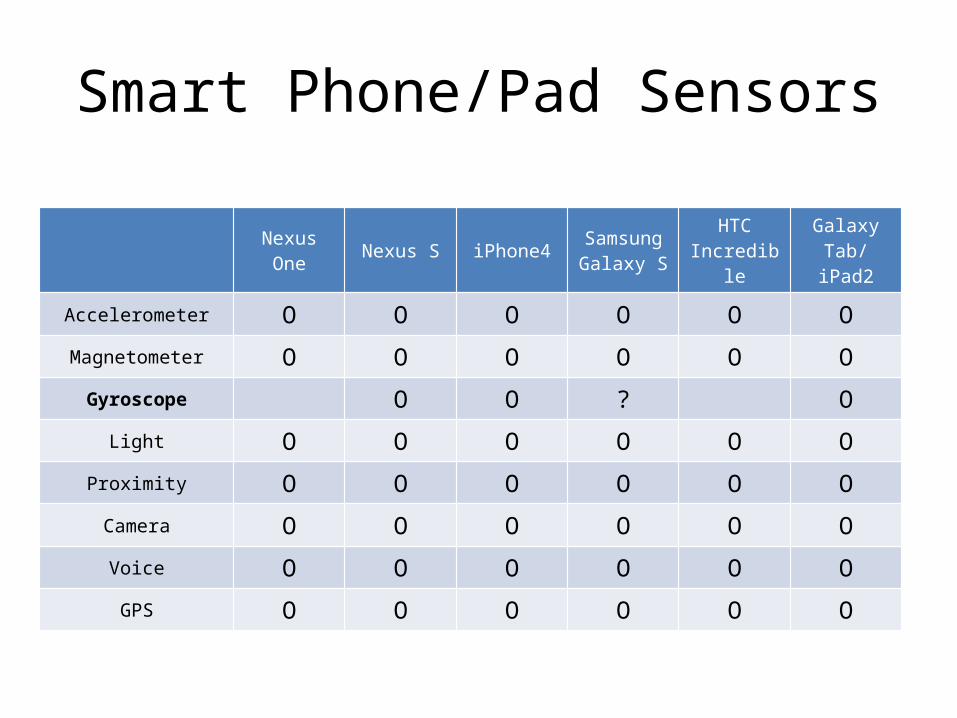
Smart Phone/Pad Sensors
Nexus One Nexus S iPhone4 SamsungGalaxy S
HTCIncredible
Galaxy Tab/ iPad2
Accelerometer O O O O O O
Magnetometer O O O O O O
Gyroscope O O ? O
Light O O O O O O
Proximity O O O O O O
Camera O O O O O O
Voice O O O O O O
GPS O O O O O O
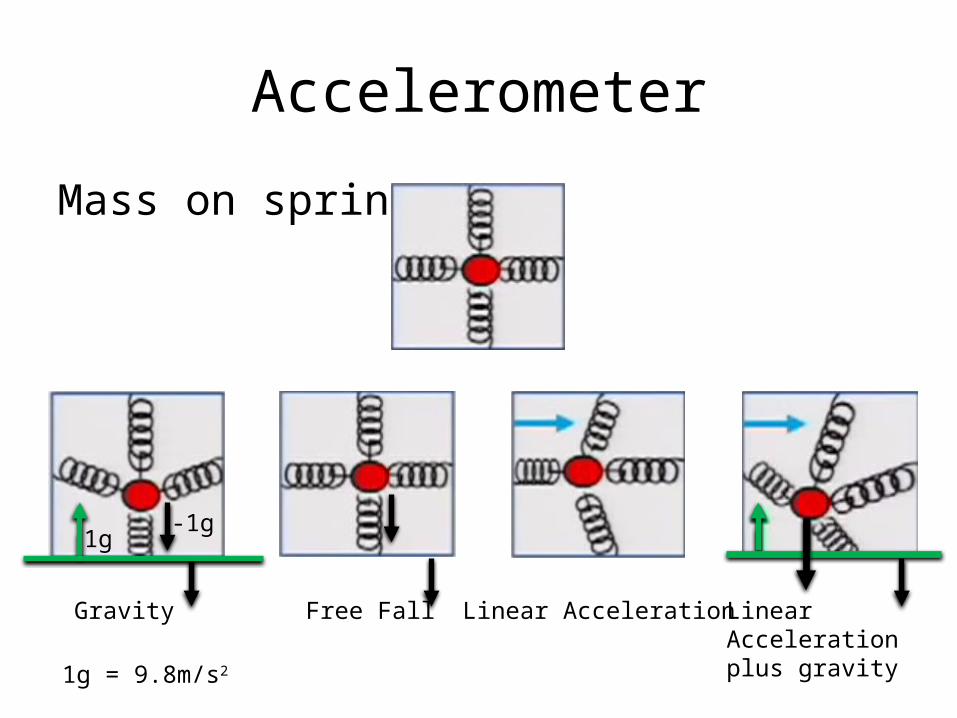
Accelerometer
Mass on spring
Gravity Free Fall Linear Acceleration Linear Accelerationplus gravity1g = 9.8m/s2
-1g1g
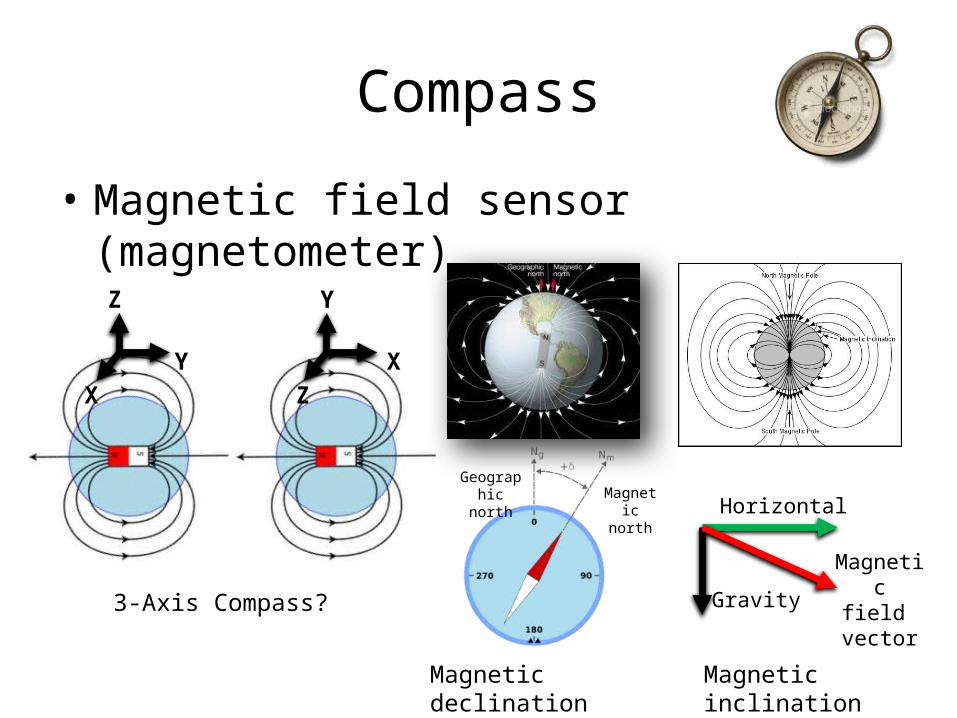
Compass
• Magnetic field sensor (magnetometer)
ZX
Y
XY
Z
3-Axis Compass?
Magnetic inclination
Horizontal
Gravity
Magneticfield
vector
Magnetic declination
Magneticnorth
Geographicnorth
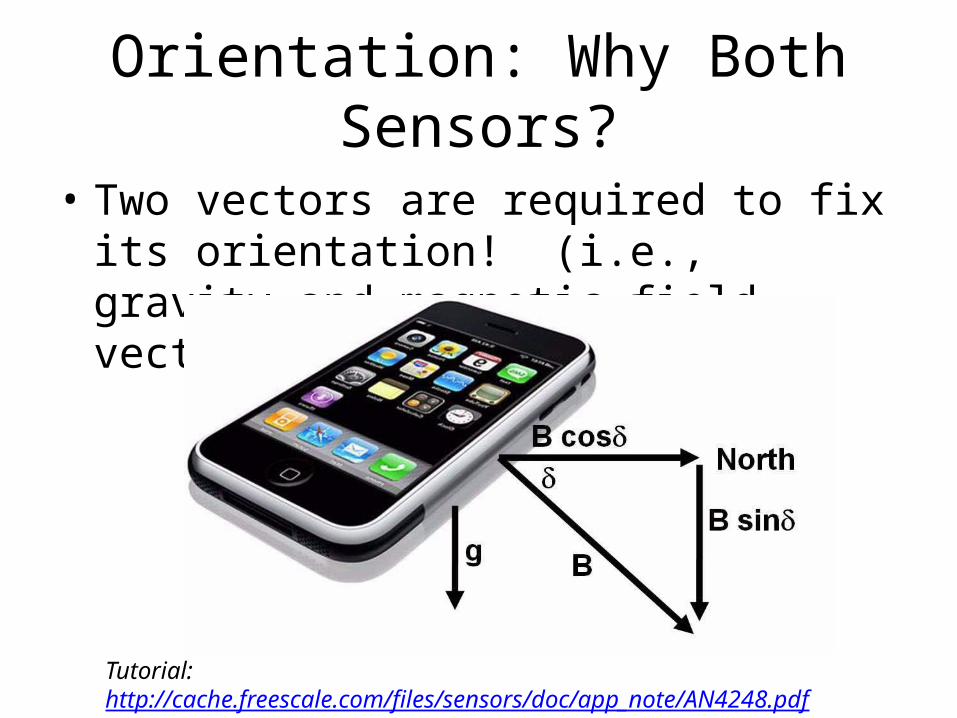
Orientation: Why Both Sensors?
• Two vectors are required to fix its orientation! (i.e., gravity and magnetic field vectors)
Tutorial: http://cache.freescale.com/files/sensors/doc/app_note/AN4248.pdf
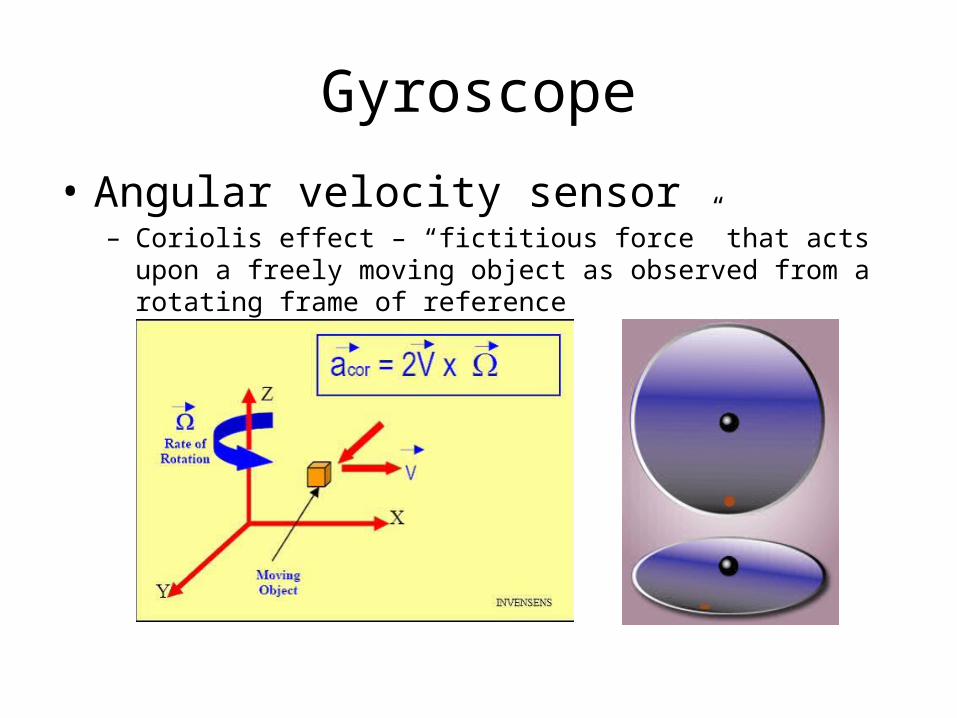
Gyroscope
• Angular velocity sensor– Coriolis effect – “fictitious force” that acts upon a freely moving object as
observed from a rotating frame of reference
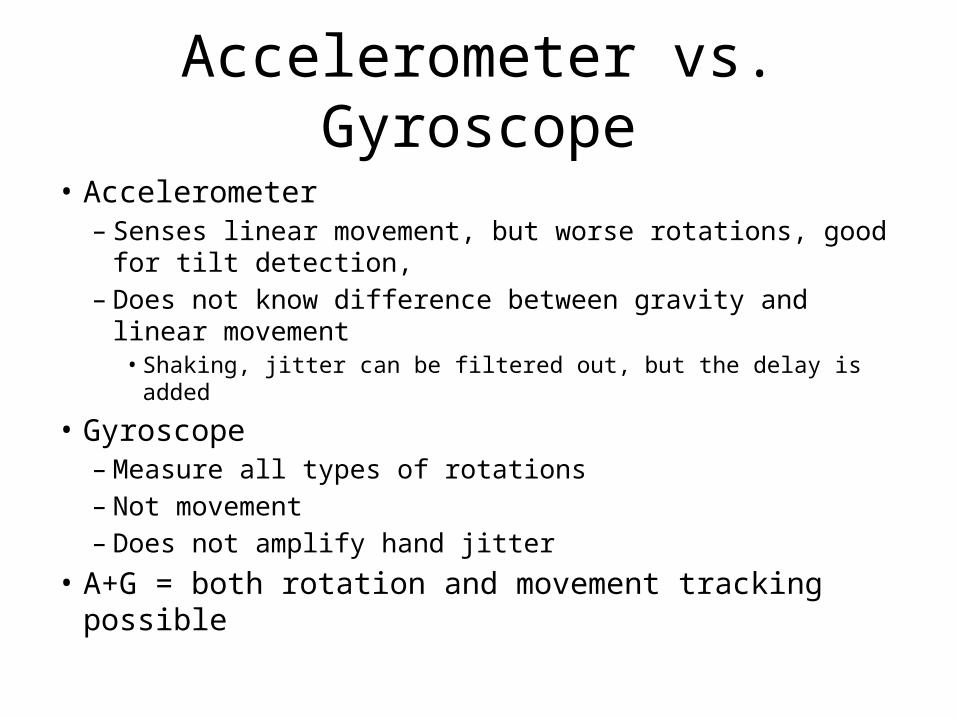
Accelerometer vs. Gyroscope
• Accelerometer– Senses linear movement, but worse rotations, good for tilt
detection, – Does not know difference between gravity and linear
movement• Shaking, jitter can be filtered out, but the delay is added
• Gyroscope– Measure all types of rotations– Not movement– Does not amplify hand jitter
• A+G = both rotation and movement tracking possible
Other Sensors
• Light: Ambient light level in SI lux units• Proximity: distance measured in centimeters
(sometimes binary near-far)• Temperature• Pressure • Barometer, etc…

Global Positioning System (GPS)
• 27 satellite constellation• Powered by solar energy• Originally developed for US military • Each carries a 4 rubidium atomic clocks
– locally averaged to maintain accuracy– updated daily by US Air Force
• Ground control– Satellites are precisely synchronized with each other
• The orbits are arranged so that at any time, anywhere on Earth, there are at least four satellites "visible" in the sky.
• A GPS receiver's job is to locate three or more of these satellites, figure out the distance to each, and use this information to deduce its own location. This operation is based on a mathematical principle called tri-lateration
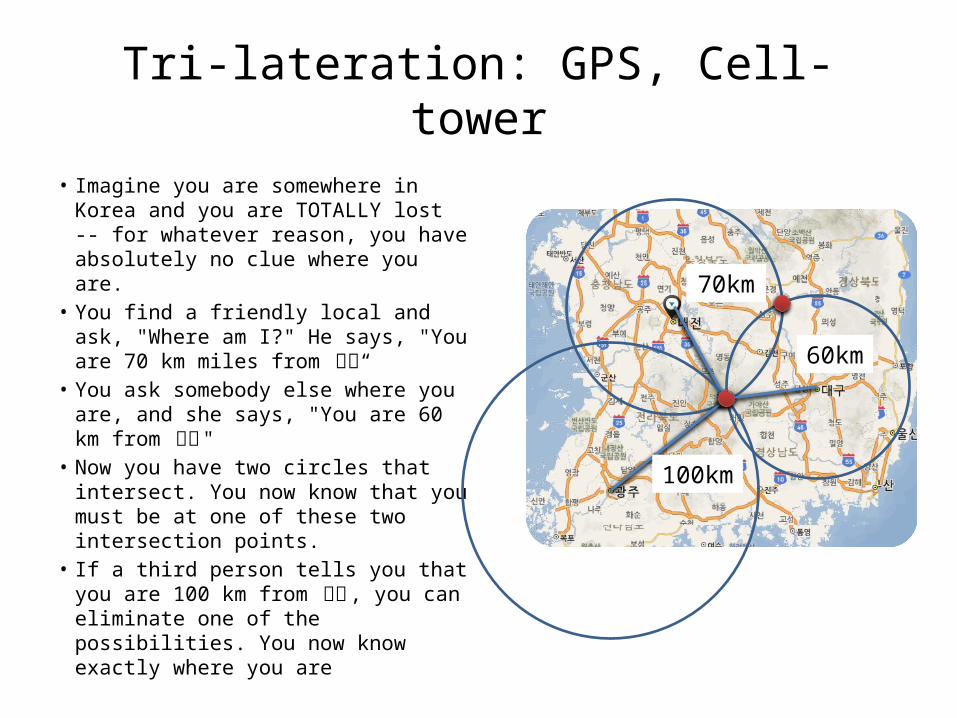
Tri-lateration: GPS, Cell-tower• Imagine you are somewhere in Korea
and you are TOTALLY lost -- for whatever reason, you have absolutely no clue where you are.
• You find a friendly local and ask, "Where am I?" He says, "You are 70 km miles from 대전“
• You ask somebody else where you are, and she says, "You are 60 km from 대구 "
• Now you have two circles that intersect. You now know that you must be at one of these two intersection points.
• If a third person tells you that you are 100 km from 광주 , you can eliminate one of the possibilities. You now know exactly where you are
70km
100km
60km
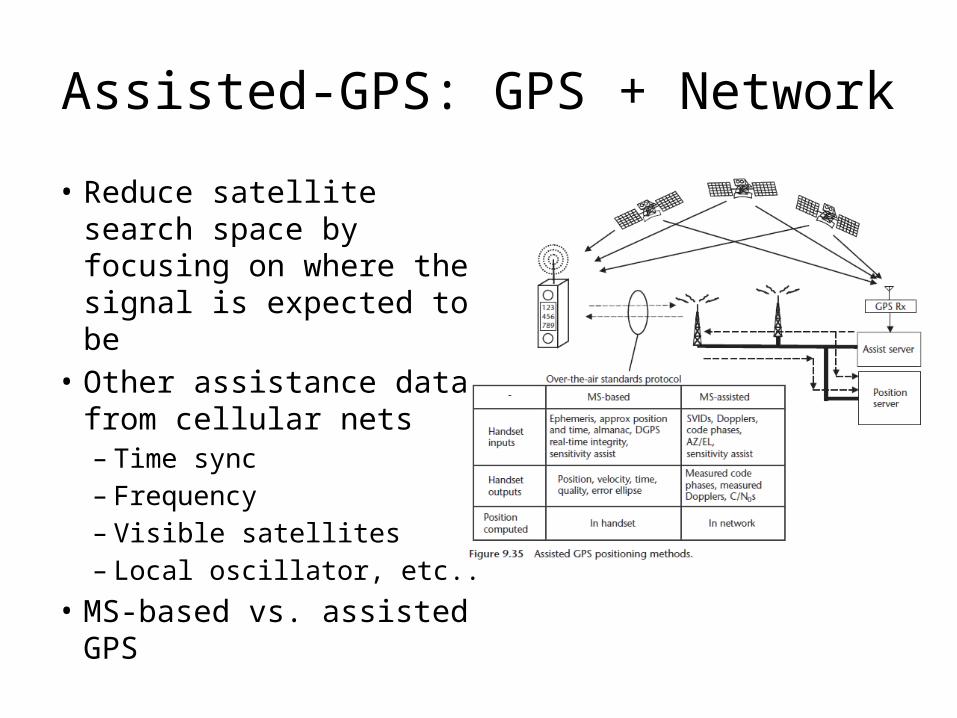
Assisted-GPS: GPS + Network
• Reduce satellite search space by focusing on where the signal is expected to be
• Other assistance data from cellular nets– Time sync– Frequency– Visible satellites– Local oscillator, etc..
• MS-based vs. assisted GPS
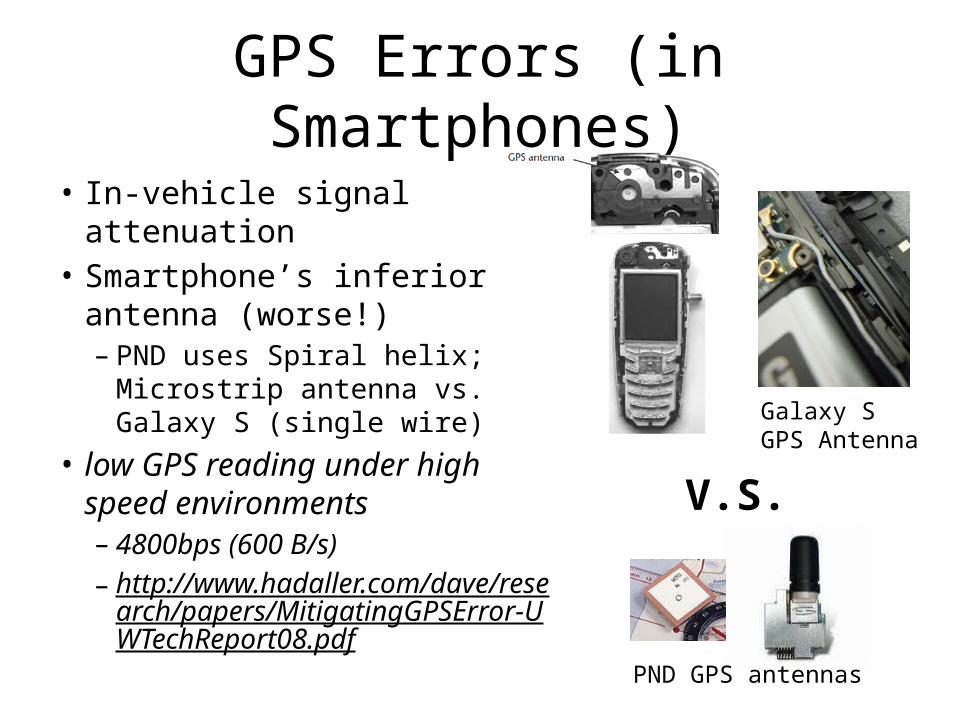
GPS Errors (in Smartphones)
• In-vehicle signal attenuation • Smartphone’s inferior antenna
(worse!)– PND uses Spiral helix; Microstrip
antenna vs. Galaxy S (single wire)
• low GPS reading under high speed environments– 4800bps (600 B/s)– http://www.hadaller.com/dave/r
esearch/papers/MitigatingGPSError-UWTechReport08.pdf
Galaxy SGPS Antenna
PND GPS antennas
V.S.
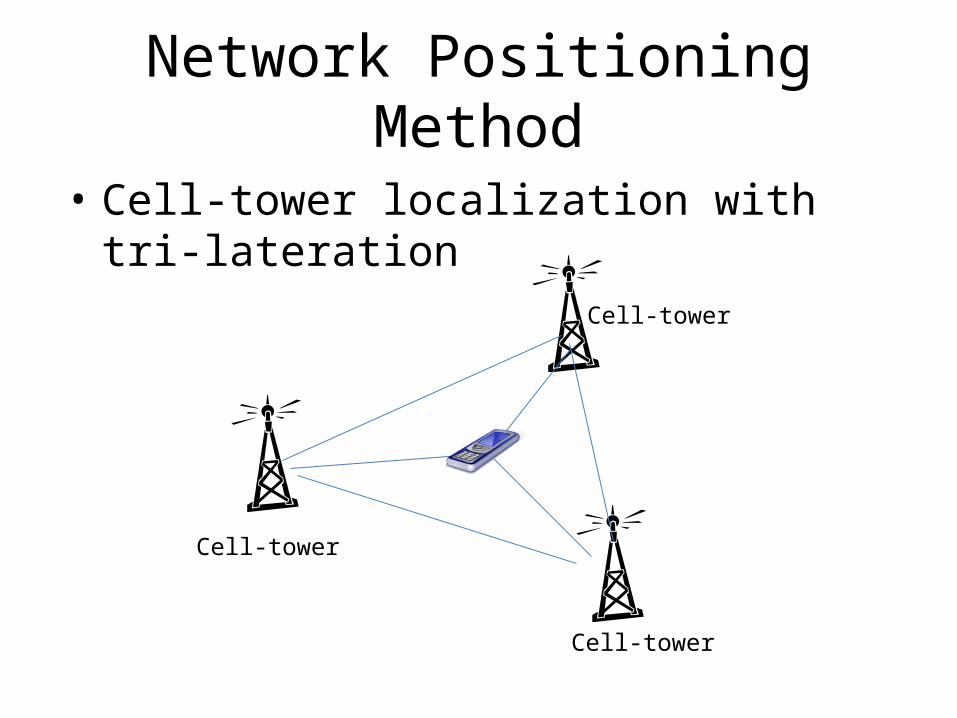
Network Positioning Method
• Cell-tower localization with tri-lateration
Cell-tower
Cell-tower
Cell-tower
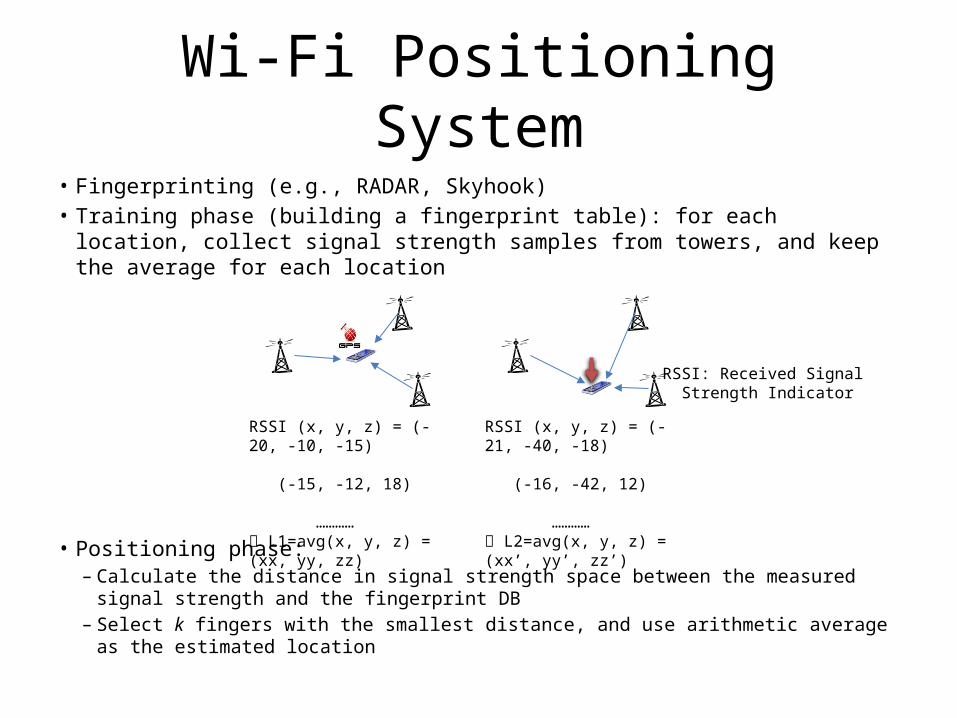
Wi-Fi Positioning System• Fingerprinting (e.g., RADAR, Skyhook)• Training phase (building a fingerprint table): for each location, collect signal
strength samples from towers, and keep the average for each location
• Positioning phase: – Calculate the distance in signal strength space between the measured signal
strength and the fingerprint DB– Select k fingers with the smallest distance, and use arithmetic average as the
estimated location
RSSI (x, y, z) = (-20, -10, -15) (-15, -12, 18) ………… L1=avg(x, y, z) = (xx, yy, zz)
RSSI (x, y, z) = (-21, -40, -18) (-16, -42, 12) ………… L2=avg(x, y, z) = (xx’, yy’, zz’)
RSSI: Received Signal Strength Indicator
Mobile Sensing Applications
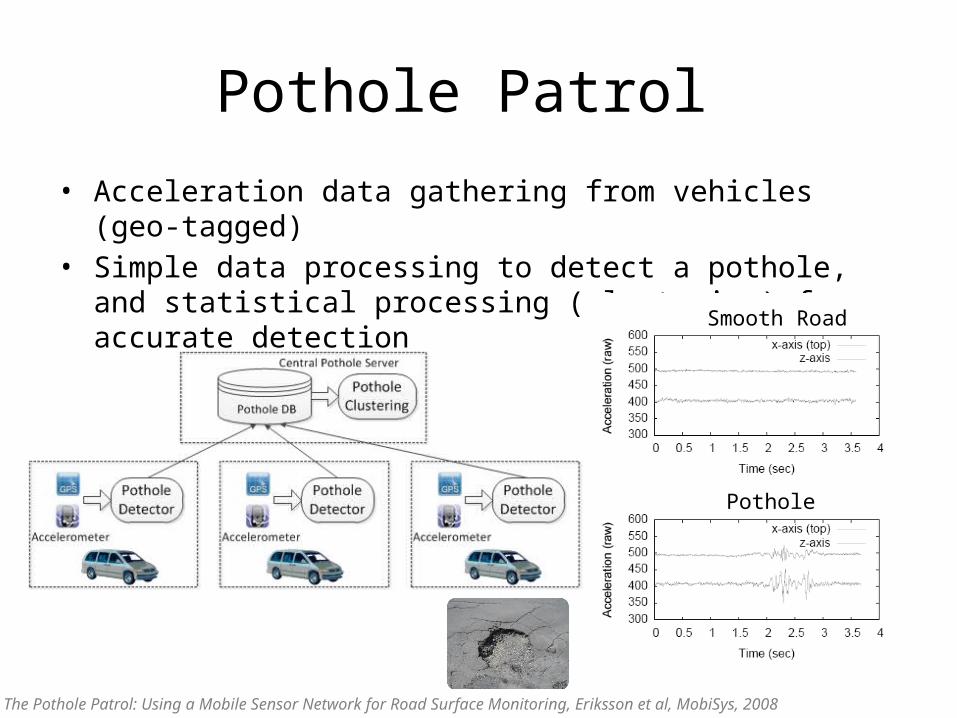
• Acceleration data gathering from vehicles (geo-tagged)• Simple data processing to detect a pothole, and statistical
processing (clustering) for accurate detection
Pothole Patrol
Smooth Road
Pothole
The Pothole Patrol: Using a Mobile Sensor Network for Road Surface Monitoring, Eriksson et al, MobiSys, 2008
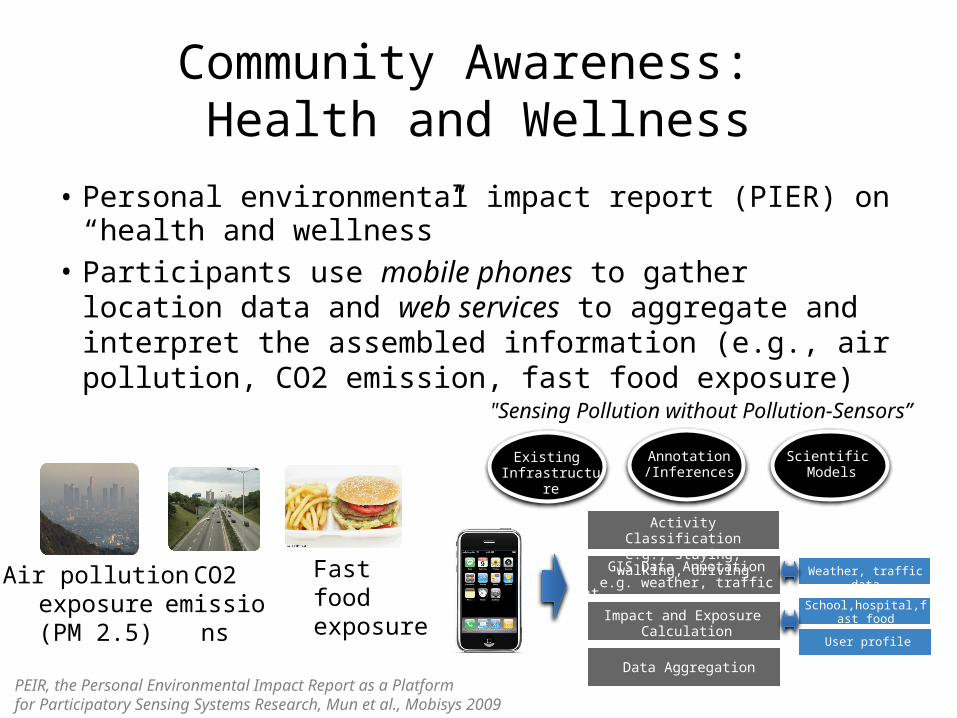
Community Awareness: Health and Wellness
• Personal environmental impact report (PIER) on “health and wellness”
• Participants use mobile phones to gather location data and web services to aggregate and interpret the assembled information (e.g., air pollution, CO2 emission, fast food exposure)
CO2 emissions
Fast food exposure
Air pollutionexposure(PM 2.5)
Existing Infrastructure
Annotation/Inferences
Scientific Models
Activity Classificatione.g., staying, walking, driving
GIS Data Annotatione.g. weather, traffic
Impact and Exposure Calculation
Data Aggregation
Tracklog formatSchool,hospital,fast
food restaurant locations
Weather, traffic data
User profile
"Sensing Pollution without Pollution-Sensors”
PEIR, the Personal Environmental Impact Report as a Platform for Participatory Sensing Systems Research, Mun et al., Mobisys 2009
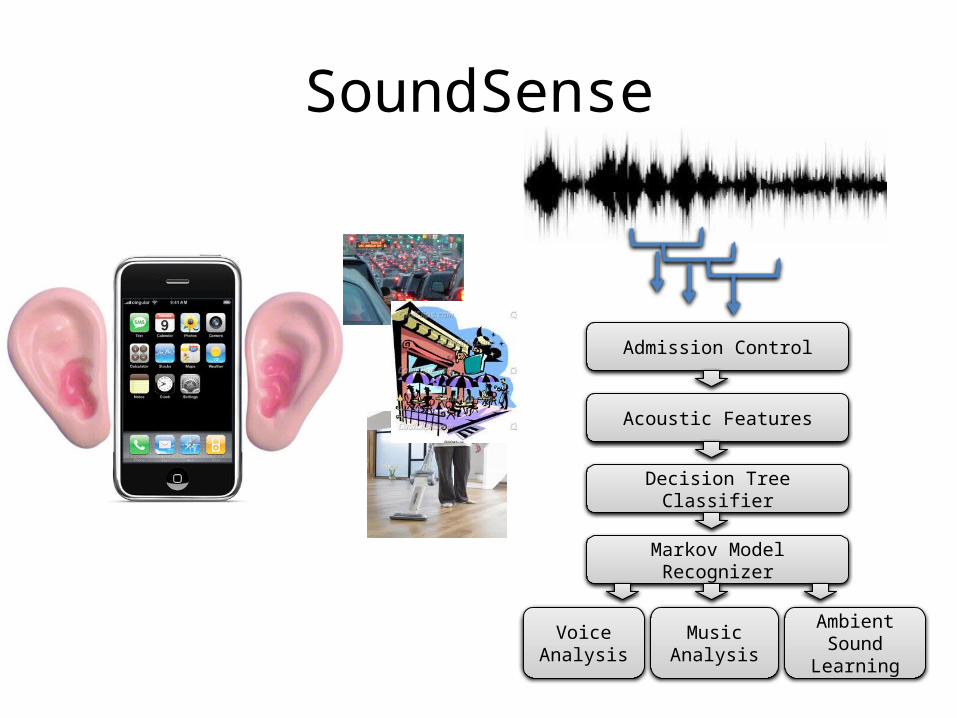
SoundSense
Admission Control
Acoustic Features
Decision Tree Classifier
Markov Model Recognizer
Ambient Sound
Learning
Voice Analysis
Music Analysis

Social Sensing with Twitter
some users posts“earthquake right now!!”
some earthquake sensors
responses positive value・・・ ・・・ ・・・
tweets
Probabilistic model
Classifier
observation by sensorsobservation by twitter users
target event target object
Probabilistic model
values
Event detection from twitter Object detection in ubiquitous environments
・・・・・・
search and classify them into
positive class
detect an earthquake
detect an earthquake
earthquake occurrence
Earthquake shakes Twitter users: real-time event detection by social sensors, Takeshi et al, WWW 2010
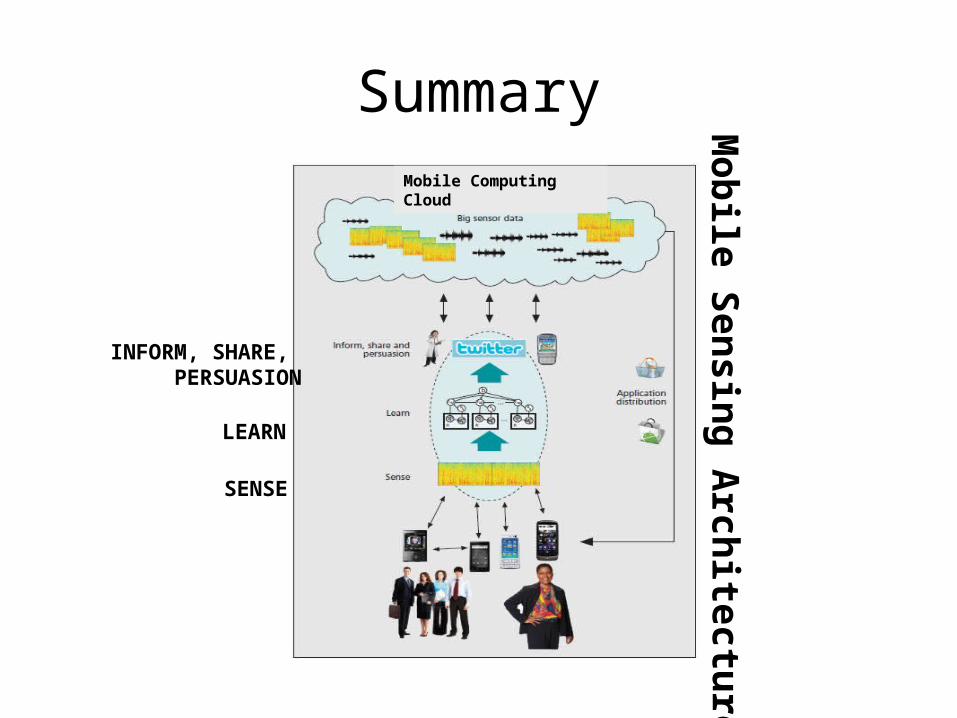
Summary
SENSE
LEARN
INFORM, SHARE, PERSUASION
Mobile Sensing Architecture
Mobile Computing Cloud