introduction to r and mathematical modeling
TRANSCRIPT

The 2016 Summer Institute in Statistics and Modeling of Infectious DiseasesModule 6: Infectious Diseases, Immunology and Within-Host Models
Author: Andreas Handel, Department of Epidemiology and Biostatistics, University of [email protected]
1

2

R, some additional R packages.
An editor for R scripts, such as RStudio.
All programs are cross-platform and freely available online.
Install R first, then Rstudio.
3

R is a “high level” programming language, relatively easy to learn (compared to Fortran, C, etc.)
R comes with many integrated functions
R has very good for statistical methods
R is pretty good for other things (ODEs, data fitting)
R is Open Source & FREE
Stable, lots of state-of-the-art packages, pretty good documentation
Slower than compiled languages (Fortran, C, etc.)
4

Start Rstudio (which also loads R).
Click on the “packages” tab in the lower right corner window. Click on “install packages” and enter the names of the packages you want to install.
For now, we need the package deSolve. Other packages we will use are: lhs, sensitivity, nloptr, boot, GillespieSSA, adaptivetau. You can install them sometime between now and just before we need them.
You can see which packages are already installed by typing library() at the R prompt (the window to the left).
5
I wrote the scripts for the hands-on examples we will be doing. You will only need to do minor modifications, so you will not need to know much R.
But by knowing/understanding some R, you will get more out of the course!
R has many help files included, but those usually assume some level of general R familiarity.
The R website has manuals/tutorials. You can also search the web, many good ones exist.
“A beginner’s guide to R” by Zuur et al (2009), Springer.
6

I compiled a short R tutorial (called YaRI) : http://handelgroup.uga.edu/resources.htm
If you know R at the level of what’s covered in YaRI, you should be able to understand the code in most scripts.
If you are less familiar with R, you will still be able to run the examples but you might not quite understand what’s going on in the code.
7

8

For this module, we will consider a specific class of mathematical/computational models:◦ We will look at the dynamics (= changes in time) of a system
◦ We will try to model mechanisms that lead to dynamical patterns
◦ We will take a system/population perspective
9
Days post infection10
uninfected cellsinfected cellsvirus
8642

10
Qualitative Models (e.g. “being exposed to HIV can lead to HIV infection”)
Quantitative Models (Math, Stats)(e.g. “a person exposed to N HIV
virions has an X% probability of getting infected)
Quantitative Mechanistic Models(e.g. “heterosexual intercourse with a person with N HIV virions/mL leads to an HIV infection with probability X%”)
Quantitative Mechanistic, Dynamical Models(e.g. “modeling HIV and CD4 T-cells during
infection”)
Those are the models we’ll be focusing on in this class
Everyone uses qualitative models,often without realizing
Science tries to be quantitative as much as possible
This only works for very specific (“simple”) problems.
The models we will focus on are dynamical mechanistic models.
Dynamical: Tracking how things change in time
Mechanistic: Having equations or computer rules that explicitly describe how things happen
11

You might be familiar with statistical models.
Most of those models are phenomenological/non-mechanistic (and static).
Those models are used extensively in epidemiology, social sciences, finance, –omics disciplines, etc.
The main goal of these models is to “understand data” (and make predictions)
12

You are probably familiar with models that are used to analyze data
Most of those models are phenomenological/non-mechanistic (and static).
Those models are used extensively in many areas of biomedical sciences and beyond
We use those models to understand patternsin the data and possibly predict.
Most statistical models are non-mechanistic.
1
2
2
0
0 1C b b S b S
C b b S
13

Finding correlations/patterns is (relatively) simple.
Sometimes we can go from correlation to causation.
We don’t need to understand the underlying mechanisms. We can determine that input is correlated with (causes) output (e.g. smoking causes cancer) without having to understand how.
1
2
2
0
0 1C b b S b S
C b b S
14

The jump from correlation to causation is always tricky since so many things can go wrong (bias/confounding/systematic errors).
Even if we can assume a causal relation, we do not gain any mechanistic insights (e.g. we don’t know how smoking causes cancer).
1
2
2
0
0 1C b b S b S
C b b S
15

Assume we are interested in the spread of some ID. In a non-mechanistic model, we say that new cases occur at a given rate, and maybe use our data to estimate that rate
some rate, we don’t know how/mechanism
Healthy/Susceptible Infected
16

In a mechanistic model, we describe and mathematically model the mechanism of getting infected
Healthy person comes in contact with infected person at some rate. If a contact (e.g. sneezing, intercourse) occurs, there is a chance/probability that the healthy/susceptible person gets infected.
Infected/Infectious
Healthy/Susceptible Infected
17
Non-mechanistic models are useful to see if we can find patterns in our data and possibly predict, without necessarily trying to understand the mechanisms.
Mechanistic models are useful if we want to study the mechanism(s) by which observed patterns arise.
18

Understanding◦ We can build and analyze models to gain insights into the
complex dynamics of infectious diseases
Prediction & What-if scenarios◦ We can make specific testable predictions
◦ We can perform virtual experiments that would be unfeasible to do (costly, lengthy, unethical)
Hypothesis testing & Parameter Estimation◦ We can use mechanistic models together with data to test
different mechanisms/hypotheses
◦ We can estimate parameters that are not directly measurable
19

Quantitative Mechanistic, Dynamical Models
Those are the models we’ll be focusing on, formulated as Ordinary Differential Equations
Many types of quantitative, mechanistic, Dynamical Models exist
Compartmental Agent-basedDiscrete time continuous timeDeterministic StochasticSpace-less (homogeneous) SpatialMemory-less (Markov) with memorySmall BigData-free With data
20

Between-host Within-host
Spread on the population level (ecology, epidemiology)
Spread inside a host (virology, microbiology, immunology)
Populations of hosts (humans, animals)
Populations of cells & pathogens
Epidemic/Endemic (e.g. Flu/TB) Acute/Persistent (e.g. Flu/TB)
Often no explicit modeling of pathogen
Usually (but not always) explicit modeling of pathogen
21

More recent than between-host modeling. HIV garnered a lot of attention starting in the late 80s, some influential
work happened in the early 90s (Perelson, Nowak). Since then, a fair amount of work on HIV, HCV, HBV (Perelson & Nelson
1999 SIAM Reviews, Perelson 2002 Nat Rev Imm, Nowak and May 2001 Oxford University Press).
Recently, interest in acute viral infections (flu) (Beauchemin & Handel 2011 BMC Public Health, Smith & Perelson 2011 WIRE)
A fair amount of work on other major diseases, e.g. TB (Kirschnergroup), Malaria (Read, others).
Also since the late 70s, models have been used to study the immune response, mainly T-cells (Antia 2003 Nat Rev Imm, Wodarz 2007 Springer).
Overall much less work has been done compared to between-host modeling, but it’s rapidly growing.
22

23

We will look at the dynamics (= changes in time) of an infection
We will try to model mechanisms that lead to dynamical patterns
We will take a system/population perspective
We need a few main ingredients:◦ The agents/players/entities (e.g. pathogen, immune components)
◦ The behavior/characteristics of each agent/entity by itself (e.g. doubling time of cells, rate of clearance of pathogen)
◦ The interactions between agents (e.g. infection of a cell by a virus)
◦ Characteristics of the “system” (e.g. drug interventions)
24

We often do not track individuals but instead describe the behavior of the “average” agent.
Of course somewhat crude, but often a good starting point.
Infection, b
Virus, V
25

Anything that’s intrinsic to each agent and doesn’t interact with other agents in the system
Often these characteristics are considered constant for the purpose of the modeling study
Examples:◦ Lifespan of a bacteria
◦ Rate of cell division
◦ Half-life of some cytokine
◦ Number of virus particles a cell produces (but: immune response)
26
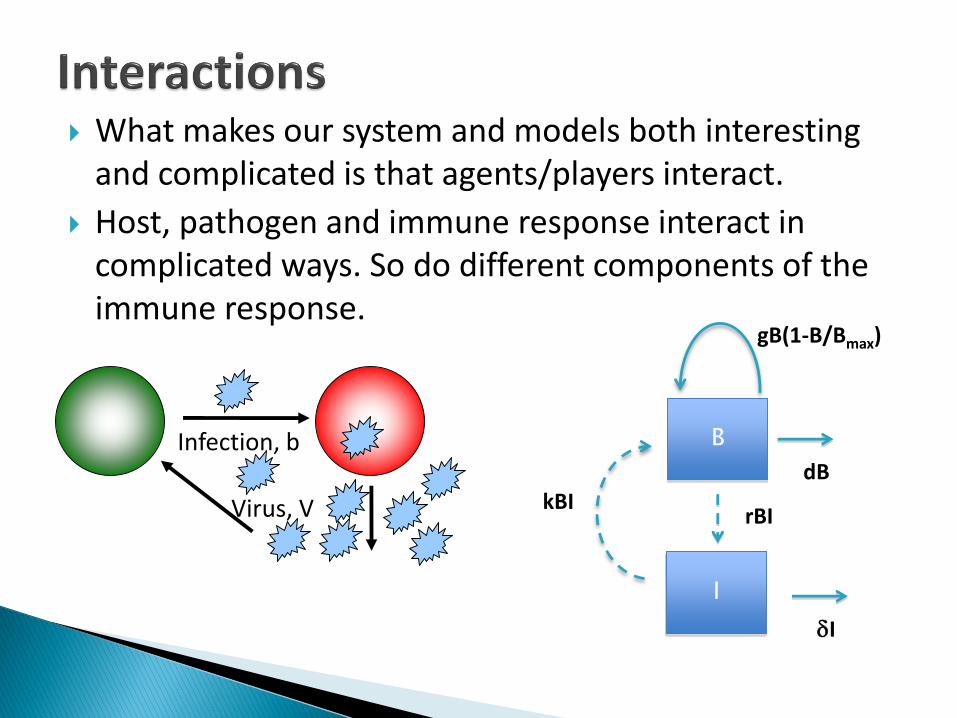
What makes our system and models both interesting and complicated is that agents/players interact.
Host, pathogen and immune response interact in complicated ways. So do different components of the immune response.
Infection, b
Virus, V
B
dB
gB(1-B/Bmax)
I
I
rBIkBI

Anything that’s not something the hosts/agents do on their own or through interactions◦ Interventions campaigns (vaccination, drug treatment…)
◦ External influences (weather, change in sanitation,…)
The simplest assumption is that nothing of this sort happens or matters.
Again, of course not right, but can often be assumed as a first step.
28

29

Bacteria dynamics (within-host or between-host, e.g. environment)
30
( )t t t t
B B gB dB B
dB
gB
Total number of bacteria right now
RHS describes how change happens (the mechanisms)
death/decay/outflowbirth/growth/inflow
Need to multiply by time step since a larger time step means more events can happen
Total number of bacteria at next time step

Assume g=12/hour, d=2/hour, =1 hour.
B at start (t=0) = 100
What do we get after 1,2,3,4,… hours?
B
dB
gB
( )t t t t
B B gB dB
31

The system is updated in discrete time-steps.
Good for systems where there is a “natural” time step◦ Example: Some pathogens have a more-or-less fixed replication cycle
(e.g. ≈24h for Plasmodium falciparum).◦ Example: For some animals, births occur during a small period in spring.
Modeling the long-term dynamics of an ID in such a population might lend itself to a model that is updated annually.
Complex models, such as Agent-based simulations are almost always discrete-time (for computational reasons).
For simple models where we track the total populations (instead of individuals), discrete-time models are not that commonly used. Continuous-time models, usually formulated as ordinary differential equations (ODE), are more common.
If the time-step becomes small, a discrete-time model approaches a continuous-time model.
32

ODEs can be derived as the continuum limit of discrete models:
rewrite( )
t tB B gB dB
( )t t
B BgB dB
0( ) t t
B BgB dB
or
( )( ) ( )
dB tgB t dB t
dt
B gB dB
33

Often, ODEs are derived as the continuum limit of discrete models:
The computer uses this We often can/could do math with this
Same flow diagram for both models
B gB dB ( )t t
B B gB dB
B
dB
gB
34

B
dB
gB
( )( ) ( )
dB tgB t dB t
dt
dBgB dB
dt
B gB dB
35

Bacteria dynamics
B gB dB B
dB
gB
LHS is the change in a variable/compartment
RHS describes how change happens (the mechanisms)
death/decay/outflowbirth/growth/inflow
36
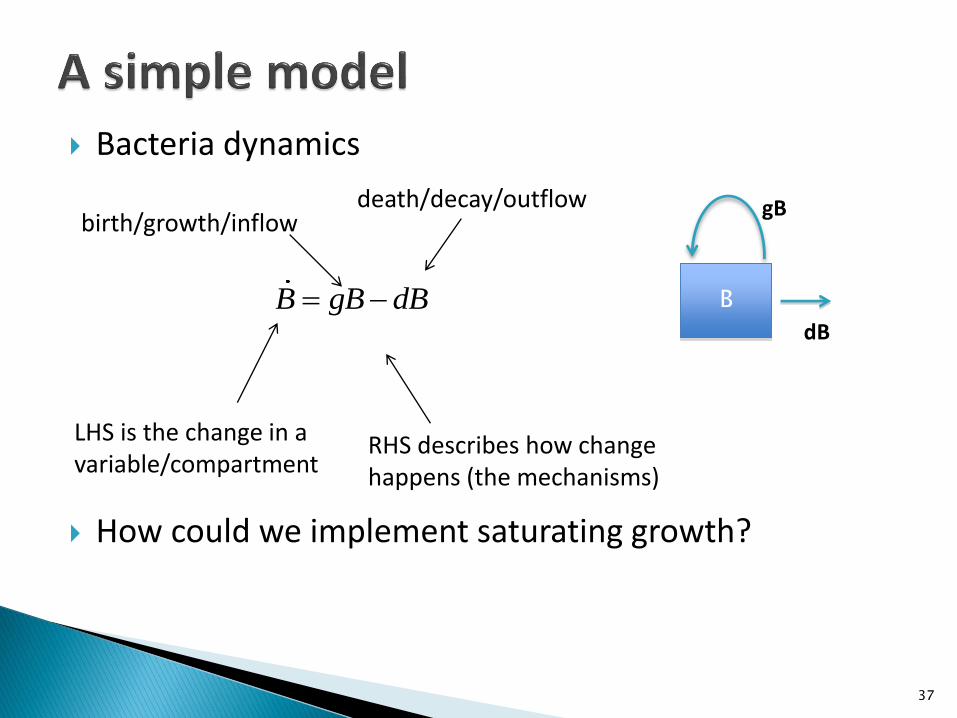
Bacteria dynamics
How could we implement saturating growth?
B gB dB B
dB
gB
LHS is the change in a variable/compartment
RHS describes how change happens (the mechanisms)
death/decay/outflowbirth/growth/inflow
37

Bacteria dynamics
How could we implement saturating growth?
max
(1 )B
B BB
gB d B
dB
gB(1-B/Bmax)
LHS is the change in a variable/compartment
RHS describes how change happens (the mechanisms)
death/decay/outflowSaturatingbirth/growth/inflow
38

Bacteria dynamics
What equation could we add to describe some (abstract) immune response?
max
(1 )B
B BB
gB d B
dB
LHS is the change in a variable/compartment
RHS describes how change happens (the mechanisms)
death/decay/outflowSaturatingbirth/growth/inflow gB(1-B/Bmax)
39

Bacteria dynamics with immune response (IR)
What’s missing?
max
(1 )B
B gB dB
I r I
B
BI
B
dB
gB(1-B/Bmax)
I
I
rBI
Immune response (IR)
Mechanisms of IR dynamics
40

Bacteria dynamics with immune response (IR)
(Predator-prey model)
max
(1 )B
B gB d kBIBB
I rBI I
B
dB
gB(1-B/Bmax)
I
I
rBIkBI
41

Bacteria dynamics with immune response (IR)
max
(1 )B
B gB dB kBIB
I rBI I
B
dB
gB(1-B/Bmax)
I I
rBIkBI
Dashed: System interactions, not necessarily flows
“actual/physical” flows
42

Bacteria dynamics with immune response (IR)
max
(1 )B
B gB dB kBIB
I rBI
D dB kBI
I
B
dB
gB(1-B/Bmax)
I I
rBIkBI
Dashed: System interactions, not necessarily flows
“actual/physical” flows
D
43

To fully specify a model, we need to pick values for the parameters.
Parameter values are chosen based on what we know about the biology of the infection.
We can choose our unit of time (hours, days, weeks,…), we just have to be careful that our parameters are in agreement.
Good practice: Pick a unit of time that makes sense for the disease, e.g. days or weeks for flu, measles, months or years for TB, HIV.
Parameter Value [Units] Comment
g 1 [1/day] bacteria growth rate
Bmax 1E6 [Bacteria units] max bacteria load
d 0.1 [1/day] bacteria death rate
k 1E-7 [1/(day*IR units)] bacteria killing rate
r 1e-3 [1/(day*Bacteria units)] IR activation/growth rate
1 [1/day] IR death/decay rate
max
(1 )B
B gB dB kBIB
I rBI I
44
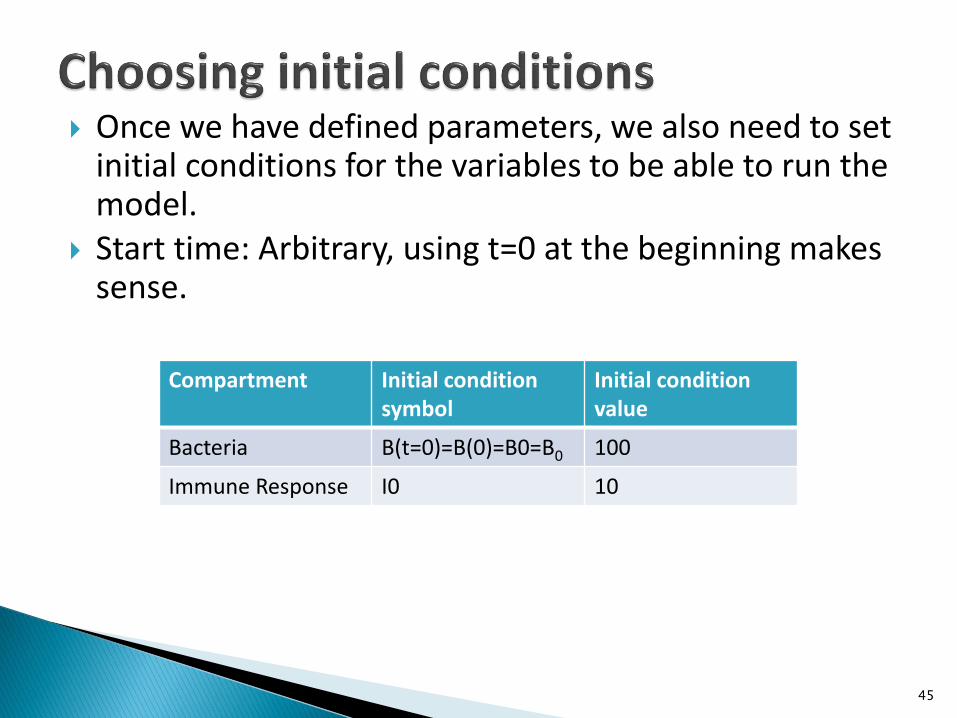
Compartment Initial condition symbol
Initial condition value
Bacteria B(t=0)=B(0)=B0=B0 100
Immune Response I0 10
Once we have defined parameters, we also need to set initial conditions for the variables to be able to run the model.
Start time: Arbitrary, using t=0 at the beginning makes sense.
45

Open the file SISMID-U2-bacteria.r in RStudio.
Read through the program and try to understand it.
Run the script by pressing the “Source” button.
Change some of the parameter values (g, Bmax, d, k, r, ), save the file. Then run the program again with the source button. Do that a few times to see how different parameter values affect your results.
0 2 4 6 8 10
1e
+0
01
e+
02
1e
+0
41
e+
06
1e
+0
8
time (days)
Bacteria
Immune Response
46

Uninfected cell, U
47

Uninfected cell, U Infected cell, I
Infection, b
Virus, V
(uninfected cells)
(infected cells)
(free virus)
dUbUV
dt
dIbUV
dt
dVbUV
dt
48

Uninfected cell, U Infected cell, I
Infection, b
Virus, V
(uninfected cells)
(infected cells)
(free virus)
bUV
bUV
bU
U
I
VV
49

Uninfected cell, U Infected cell, I
Virus production, p
Infection, b
Virus clearance, c(lifespan 1/c)
Virus, V
(uninfected cells)
(infected cells)
(free virus)
I
p
U bUV
I bUV
V bUVI cV
Virus-induced cell death, (average lifespan 1/ )
50

Uninfected cell, U Infected cell, I
Virus production, p
Infection, b
Virus, V
(uninfected cells)
(infected cells)
(free virus)
U bUV
I bUV I
V pI cV bUV
Sometimes, but not always ok to ignore
Virus clearance, c(lifespan 1/c)
Virus-induced cell death, (average lifespan 1/ )
51

Uninfected cell, U Infected cell, I
Virus production, p
Infection, b
Virus, V
(uninfected cells)
(infected cells)
(free virus)
U bUV
I bUV I
V pI cV bUV
Virus clearance, c(lifespan 1/c)
Virus-induced cell death, (average lifespan 1/ )
Might be needed if we express virus load not in units of infectious virions, but something else (for instance Plaque Forming Units, as done in experiments)
52

Uninfected cell, U Infected cell, I
Virus production, p
Infection, b
Virus, V
(uninfected cells)
(infected cells)
(free virus)
U bUV
I bUV I
V pI cV
Virus clearance, c(lifespan 1/c)
Virus-induced cell death, (average lifespan 1/ )
53

Uninfected cell, U Infected cell, I
Virus production, p
Infection, b
Virus, V
Days post infection10
uninfected cellsinfected cellsvirus
8642
U bUV
I bUV I
V pI cV
Virus clearance, c(lifespan 1/c)
54

Uninfected cell, U Infected cell, I
Virus production, p
Infection, b
Virus, V
It’s often useful to go from figures/diagrams to equations and back.
For this model, I used pretty(?) figures
U bUV
I bUV I
V pI cV
Virus clearance, c(lifespan 1/c)
Virus-induced cell death, (average lifespan 1/ )
55

Another way to illustrate equations is to draw box diagrams.
bUV
bUV
p cVI
U
I
V
I
δIU I
V
bUV
cV
pI
Change of hosts in each compartment at a given time
Specifying the change: Influx and outflow for each compartment
56

I’m trying to be (somewhat) consistent
If you go to the literature, you will find many different notations
* *
*
(uninfected target cell)
(infected target cells)
(free virus)
T s T TV
T TV dT
V NdT cV
(uninfected cells)
(infected cells)
(free virus)
x dx xv
y xv ay
v y uv
57

If we show a model with boxes, we usually imply that we use a compartmental model where we track total numbers in each box/compartment but not individuals.
We did not specify some other aspects of implementation.
58
( )
( )
( )
t dt t
t dt t
t dt t
U U bUV dt
I I bUV I dt
V V pI cV dt
δIU I
V
bUV
cV
pI
U bUV
I bUV I
V pI cV
Continuous in time, ODE
Discrete in time, Difference Equation

Open SISMID-U2-virus.r
The script implements the simple virus model as discrete time and continuous time models.
Read through the program and try to understand it.
See how results change as you change some of the parameter values.
Play around with the time step for the discrete model and see what it does.
You can also change some of the initial conditions (U0, I0, V0).
59

Mechanistic, dynamical models are useful for studying infectious diseases.
Such models come in all kinds of forms. Models can quickly become complex and hard to
analyze. For within-host models, one of the main “source of complexity” is the immune response.
No matter how detailed, a model is always a simplified abstractions of the real biology/system.
Finding the right model (type, complexity) for the question at hand is the challenge and “art” of modeling.
60

We will revisit and extend the models discussed here in various ways as we study specific pathogens (HCV, HIV, Influenza, Malaria, TB) in some more detail.
We will discuss more details about the biology of the within-host infectious disease processes for those pathogens.
We will apply models to these pathogens to gain general conceptual insights, to study treatment/intervention and to estimate parameters.
We will focus on compartmental, deterministic ODE models.
We will spend one session briefly going over alternative (more complicated) modeling approaches.
61
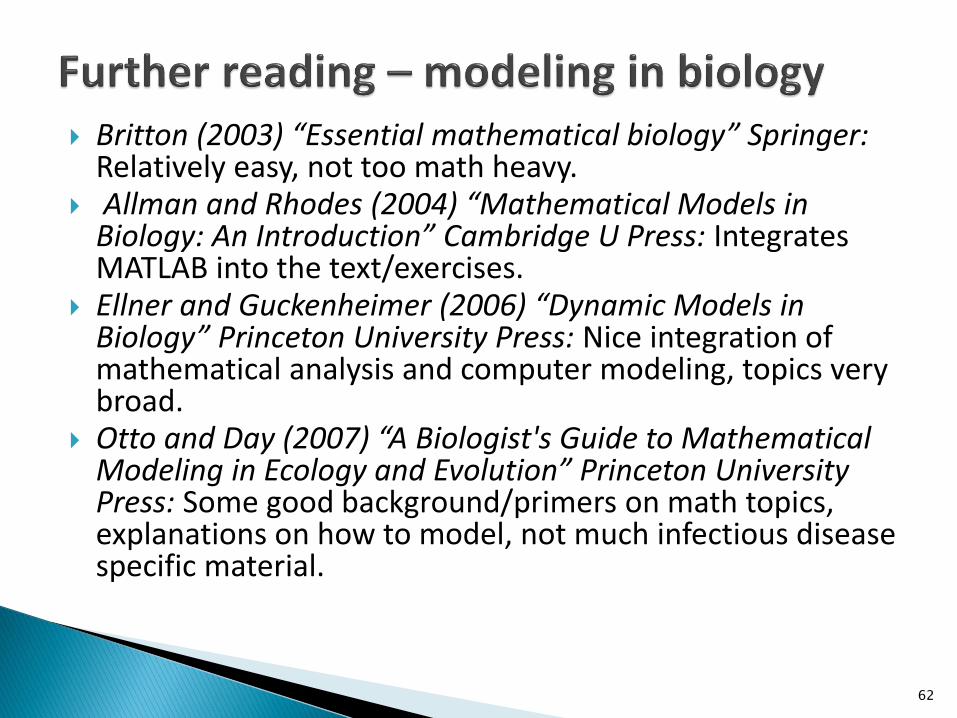
Britton (2003) “Essential mathematical biology” Springer: Relatively easy, not too math heavy.
Allman and Rhodes (2004) “Mathematical Models in Biology: An Introduction” Cambridge U Press: Integrates MATLAB into the text/exercises.
Ellner and Guckenheimer (2006) “Dynamic Models in Biology” Princeton University Press: Nice integration of mathematical analysis and computer modeling, topics very broad.
Otto and Day (2007) “A Biologist's Guide to Mathematical Modeling in Ecology and Evolution” Princeton University Press: Some good background/primers on math topics, explanations on how to model, not much infectious disease specific material.
62

Nowak and May (2000) “Virus dynamics” Oxford U. Press Anderson and May (1991) “Infectious Diseases of Humans –
Dynamics and Control” Oxford U. PressKeeling and Rohani (2008) “Modeling Infectious Diseases”Princeton U. Press(these books are about ID modeling on the population level, not individual hosts. But a lot of the concepts and math/equations are the same)
Alan Perelson (2002) “Modelling Viral and Immune System Dynamics”, Nature Reviews Immunology
A few names in the field: Rustom Antia, Becca Asquith, Rob de Boer, Sebastian Bonhoeffer, Denise Kirschner, Angela McLean, Martin Nowak, Alan Perelson, Ruy Ribeiro, Dominik Wodarz, many more….
63