introduction to r and rstudio -...
TRANSCRIPT

8/4/16
1
Introduction to R and Rstudio
Stephen Opiyo
R
History of R• Idea of R came from S developed at Bell Labs in 1976.
• S intended to support research and data analysis projects.
• S to S-Plus licensed to Insightful/SolutionMetric (“S-Plus”).
• S-plus is not a free software.
• R: Open source platform similar to S developed by Robert Gentleman and Ross Ihaka (U of Auckland, NZ) during the 1990s. Since 1997: international “R-core” developing team
• Updated versions available every two monthshttp://www.r-project.org/

8/4/16
2
R on Windows
R on MACs
R on Linux

8/4/16
3
What is R for?• Data handling and storage: numeric, textual
• Handling Matrix algebra
• Tables and regular expressions
• Graphics
• Data analysis
R is not
• R is not– a database
– a collection of “black boxes”
– a spreadsheet software package
– commercially supported
Useful reading materials
• R for Beginners• http://cran.r-project.org/doc/contrib/Paradis-rdebuts_en.pdf
• An Introduction to R” by Longhow Lam• http://cran.r-project.org/doc/contrib/Lam-IntroductionToR_LHL.pdf
• Practical Regression and Anova using R• http://cran.r-project.org/doc/contrib/Faraway-PRA.pdf
• An R companion to ‘Experimental Design• http://cran.r-project.org/doc/contrib/Vikneswaran-ED_companion.pdf
• The R Guide• http://cran.r-project.org/doc/contrib/Owen-TheRGuide.pdf
• R for Biologists• http://cran.r-project.org/doc/contrib/Martinez-RforBiologistv1.1.pdf

8/4/16
4
Useful reading materials
• Multilevel Modeling in R• http://cran.r-project.org/doc/contrib/Bliese_Multilevel.pdf
• R reference cards• http://cran.r-project.org/doc/contrib/refcard.pdf
• http://cran.r-project.org/doc/contrib/Short-refcard.pdf
• http://cran.r-project.org/doc/contrib/Baggott-refcard-v2.pdf
• R reference card data mining• http://cran.r-project.org/doc/contrib/Short-refcard.pdf
• RStudio - Documentation• http://www.rstudio.com/ide/docs/
Useful books
• Learning Rstudio for R Statistical Computingby Mark Van Der Loo, Edwin De JongePaperback, 126 pagesPublished December 25th 2012 by Packt PublishingISBN 1782160604 (ISBN13: 9781782160601)
• Getting Started with RStudioBy: John VerzaniPublisher: O'Reilly Media, Inc.Pub. Date: September 22, 2011Print ISBN-13: 978-1-4493-0903-9
• R Graphics Cookbook by Winston Chang (Jan 3, 2013)
• R For Dummies by Meys, Joris, de Vries
• The R Book by Michael J. Crawley
RStudio

8/4/16
5
RStudio
• RStudio is a free open source integrated development environment for R(http://www.rstudio.com/ide/)
• Free and commercial versions
• RStudio is available in two editions:– RStudio Desktop:Run locally as a regular desktop. – RStudio Server runs on remote Linux server.
• We will use RStudio in this workshop
Using RStudio
Scripteditor
Viewhelp,plots&files;managepackages
Viewvariablesinworkspaceandhistoryfile
Rconsole
R: Session management

8/4/16
6
R: session management
• You can enter a command at the command prompt in a console (>).
• To quit R, use >q().
• Simple math:
• > 3 + 9 + 12 – 7[1] 17
• The result begins with 1 not >, R is telling you that the first element of the answer is 17
R: session management
• Result is stored in an object using the assignment operator: (<-) or the equal character (=).
Test <- 2 and Test = 2
• Test is an object with a value of 2
• To print (show) the object just enter the name of the object
• Test
Naming object in R• Object names cannot contain `strange' symbols like
!, +, -, #.
• A dot (.) and an underscore (_) are allowed, also a name starting with a dot (.)
• Object names can contain a number but cannot start with a number.(E.g., Example_1, not 1Example_1)
• R is case sensitive, X and x are two different objects, as well as temp.1 and temP.1

8/4/16
7
Setting up a working directory
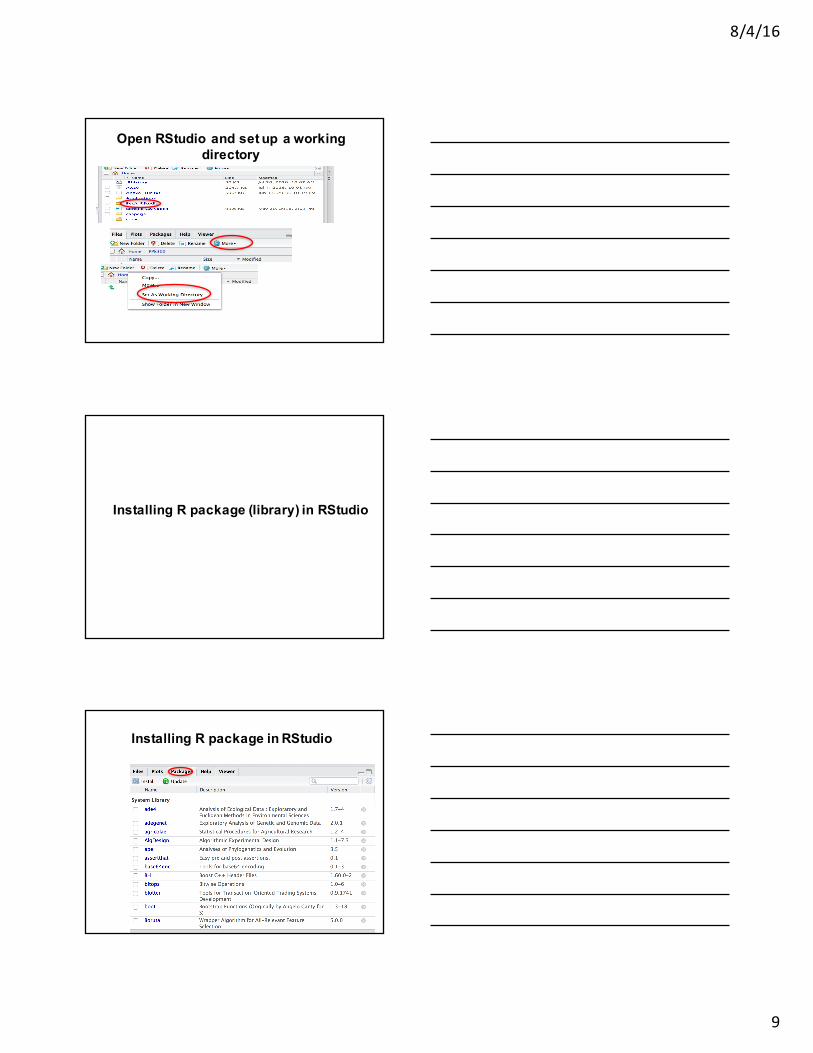
Open RStudio and set up a working directory
Open RStudio and set up a working directory

8/4/16
8
Open RStudio and set up a working directory
Open RStudio and set BecA_Rstudio as a working directory
Open RStudio and set BecA_Rstudio as a working directory
8/4/16
9
Open RStudio and set up a working directory
Installing R package (library) in RStudio
Installing R package in RStudio

8/4/16
10
Installing a package in RStudio
Installing a package in RStudio
Basic data types

8/4/16
11
Working with a rectangular dataset
• Samples are in rows of a dataset.
• Columns correspond to variables in a dataset.
• Two main structure of rectangular dataset are matrices and frames
• The main difference between the matrices and frames is type of data stored within them.
Vectors and Matrices• A vector
– Ordered collection of data of the same type.– Example: last names of all students in this workshop.– In R, single number is a vector of length 1.
• A matrix– Rectangular table of data of the same type.– Example: Mean intensities of all genes measured during a
microarray experiment.
Vectors
• Vector: Ordered collection of data of the same data type
X <- c(1, 2, 3, 4, 5)
Y <- 1:5 (: represents sequence)
Q <- seq(1,5, by=1)
• Function “length” shows the numbers of elements in a vector.
length(Y)[1] 5

8/4/16
12
Operation on vector elements• Mydata <- c(2, 3.5, -0.2) Vector (c=“concatenate”)
Mydata[1] 2 3.5 -0.2
x5 <- Mydata[Mydata>0]2,3.5
x6 <- Mydata[-c(1,3)]3.5
• Extract the positive elements
• Remove elements 1 and 3
Operation on vectorelements
Ø Colors <- c("Red","Green","Red") Character vector
Colors[2][1] "Green"
x1 <- 25:30 : Number sequences
x1[1] 25 26 27 28 29 30
x2<-x1[3:5][1] 27 28 29 Various elements 3 to 5
x3<-x1[c(2,6)] Elements 2 and 6[1] 26 30
Matrices• Matrix: Rectangular table of data of the same type.• Create a matrix with a function called “matrix”
M<- matrix(1:12) Create matrix using the “matrix function”M
[,1][1,] 1[2,] 2[3,] 3[4,] 4[5,] 5[6,] 6[7,] 7[8,] 8[9,] 9[10,] 10[11,] 11[12,] 12
Create a vector of 1 to 12
V<-c(1,2,3,4,5,6,7,8,9,10,11,12) vector

8/4/16
13
Matrices• Matrix: Rectangular table of data of the same type
MR <- matrix(1:12, 4) four rowsMR
[,1] [,2] [,3][1,] 1 5 9[2,] 2 6 10[3,] 3 7 11[4,] 4 8 12
• Matrix by row:MM <- matrix(1:12, 4, byrow = T); MM By row creation
[,1] [,2] [,3][1,] 1 2 3[2,] 4 5 6[3,] 7 8 9[4,] 10 11 12
Matrices• Matrix:byrow
mm <- matrix(1:12, 4, byrow = T); mm By row creation [,1] [,2] [,3]
[1,] 1 2 3[2,] 4 5 6[3,] 7 8 9[4,] 10 11 12
Transpose of matrix by a function (t)tmm<-t(mm) t is transpose[,1] [,2] [,3] [,4]
[1,] 1 4 7 10[2,] 2 5 8 11[3,] 3 6 9 12
0peration onmatricesMatrix M[row , column ]
tmm<-t(mm) t is transpose[,1] [,2] [,3] [,4]
[1,] 1 4 7 10[2,] 2 5 8 11[3,] 3 6 9 12
x.matr[,2] 2nd col[1] 4 5 6
x.matr[c(1,3),] 1st and 3rd lines
[,1] [,2] [3][4][1,] 1 4 7 10[2,] 3 6 9 12
x.mat[-2,] remove second row (No 2nd line)
[,1] [,2] [3][4][1,] 1 4 7 10[2,] 3 6 9 12

8/4/16
14
Data frame
Data frameData frame: Rectangular table with rows and columns; data within each column has the same type (e.g. number, text, logical), but different columns may have different types.Example of a data frame with 10 rows and 3 columns
Creating a data frame
• # create a data frame from scratch using “data.frame” function
• age <- c(25, 30, 56, 49, 12, 16, 60, 34, 45, 22)• gender <- c("male", "female", "male","male",
"female", "male","male", "female", "male","male")
• weight <- c(160, 110, 220, 100, 65, 120, 179, 134, 165, 153)
• mydata <- data.frame(age,gender,w eight)

8/4/16
15
Importing and exporting data frame in R
Importing Data • The easiest way to enter data in R is to work with a text file, in
which the columns are separated by tabs; or comma-separated values (csv) files .
• Example of importing data are provided below (console). mydata <- read.table("D1_Data_1.c sv", sep=”, ", header=TRUE)mydata <- read.csv("D1_Data_1.csv ", header=TRUE)mydatab<- read.table("D1_Data_1.txt”, sep=”,\t", header=TRUE)mydatab<- read.delim("D1_Dat a_1.txt", header=TRUE)
• Importing data in Rstudio using (Import Dataset) on the Workspace
Viewing Data There are a number of functions for listing the
contents of an object or dataset. # list the variables in mydata
names(mydata)
# list the structure of mydatastr(mydata)
# dimensions of an objectdim(mydata)

8/4/16
16
Viewing Data# class of an object (numeric, matrix, dataframe, etc)
class(mydata)# print mydata
mydata# print first 6 rows of mydata
head(mydata)# print first 2 rows of mydata
head(mydata, n=2)print last 6 rows of mydata
tail(mydata) # print last 2 rows of mydata
tail(mydata, n=2)
Operation on Data FrameData_Frame[row, column]
Data_Frame[1,] Data_Frame row 1
Data_Frame[,1] Data_Frame column 1
Data_Frame[-1,] Remove row 1 from Data_Frame
Data_Frame[,-1] Remove column 1 from Data_Frame
Data_Frame[c(1,3),] Remove rows 1 and 3 from Data_Frame
Data_Frame[,-c(1:3)] Remove columns 1 to 3 from Data_Frame
Missing DataIn R, missing values are represented by the symbol NA (not available) . Impossible values (e.g., dividing by zero) are represented by the symbol NaN (not a number).
Testing for Missing Valuesis.na(x) # returns TRUE of x is missingy <- c(1,2,3,NA)is.na(y) # returns a vector (F F F T)
Excluding missing values from analysesArithmetic functions on missing values yield missing values. x <- c(1,2,NA,3)mean(x) # returns NAmean(x, na.rm=TRUE) # returns 2

8/4/16
17
Exporting Data
• ToAcsvFilewrite.table(mydata, "mydata.csv",sep=",")write.csv(mydata, "mydata.csv")
• ToATabDelimitedTextFilewrite.table(mydata, "mydata.txt",,sep=“\t ")
• ExportingR objectsintootherformats.ForSPSS,SASandStata.youwillneed toloadtheforeign packages.
Hands on exercise