introduction to rna sequencing - scilifelab.github.io based data analysis pipeline olga (nbis)...
TRANSCRIPT

Introduction to RNA sequencingBioinformatics perspective
Olga Dethlefsen
NBIS, National Bioinformatics Infrastructure Sweden
November 2017
Olga (NBIS) RNA-seq November 2017 1 / 49

OutlineWhy sequence transcriptome?From RNA to sequenceThe most common way: reference based analysis pipelineWhat about de-novo assembly of transcriptomes?And what about scRNA-seq?Introduction to exercises
Olga (NBIS) RNA-seq November 2017 2 / 49

Why sequence transcriptome?
Why sequence transcriptome?
Olga (NBIS) RNA-seq November 2017 3 / 49

Why sequence transcriptome? Overview
Olga (NBIS) RNA-seq November 2017 4 / 49

Why sequence transcriptome? Overview
An RNA sequence mirrors the sequence of the DNA fromwhich it was transcribed.
Consequently, by analyzing transcriptome we can determinewhen and where each gene is turned on or off in the cells andtissues of an organism.
Olga (NBIS) RNA-seq November 2017 5 / 49
Why sequence transcriptome? Overview
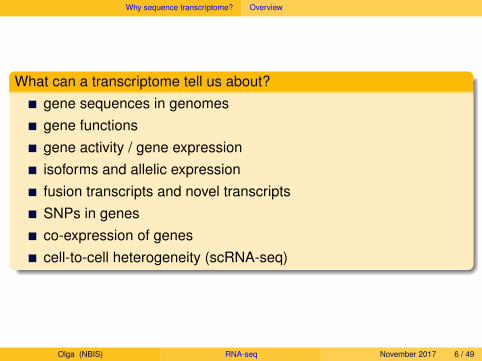
What can a transcriptome tell us about?gene sequences in genomesgene functionsgene activity / gene expressionisoforms and allelic expressionfusion transcripts and novel transcriptsSNPs in genesco-expression of genescell-to-cell heterogeneity (scRNA-seq)
Olga (NBIS) RNA-seq November 2017 6 / 49

Why sequence transcriptome? Overview
Transcriptomes are:
dynamic, that is not the same over tissues and time points
directly derived from functional genomics elements, that ismostly protein-coding genes, providing a useful functionallyrelevant subset of the genome, translating into smallersequence space
Olga (NBIS) RNA-seq November 2017 7 / 49

Why sequence transcriptome? Overview
OverviewExperimental design (biology, medicine, statistics)RNA extraction (biology, biotechnology)Library preparation (biology, biotechnology)High throughput sequencing (engineering, biology, chemistry,biotechnology, bioinformatics)Data processing (bioinformatics)Data analysis (bioinformatics & biostatistics)
Olga (NBIS) RNA-seq November 2017 8 / 49
From RNA to sequence
From RNA to sequence
Olga (NBIS) RNA-seq November 2017 9 / 49
From RNA to sequence Workflow
Olga (NBIS) RNA-seq November 2017 10 / 49
From RNA to sequence Workflow
Olga (NBIS) RNA-seq November 2017 11 / 49

From RNA to sequence .fastq
Olga (NBIS) RNA-seq November 2017 12 / 49

From RNA to sequence .fastq
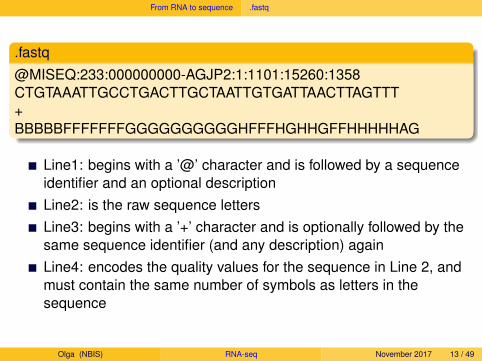
.fastq@MISEQ:233:000000000-AGJP2:1:1101:15260:1358CTGTAAATTGCCTGACTTGCTAATTGTGATTAACTTAGTTT+BBBBBFFFFFFFGGGGGGGGGGHFFFHGHHGFFHHHHHAG
Line1:
begins with a ’@’ character and is followed by a sequenceidentifier and an optional descriptionLine2: is the raw sequence lettersLine3: begins with a ’+’ character and is optionally followed by thesame sequence identifier (and any description) againLine4: encodes the quality values for the sequence in Line 2, andmust contain the same number of symbols as letters in thesequence
Olga (NBIS) RNA-seq November 2017 13 / 49

From RNA to sequence .fastq
.fastq@MISEQ:233:000000000-AGJP2:1:1101:15260:1358CTGTAAATTGCCTGACTTGCTAATTGTGATTAACTTAGTTT+BBBBBFFFFFFFGGGGGGGGGGHFFFHGHHGFFHHHHHAG
Line1: begins with a ’@’ character and is followed by a sequenceidentifier and an optional descriptionLine2:
is the raw sequence lettersLine3: begins with a ’+’ character and is optionally followed by thesame sequence identifier (and any description) againLine4: encodes the quality values for the sequence in Line 2, andmust contain the same number of symbols as letters in thesequence
Olga (NBIS) RNA-seq November 2017 13 / 49

From RNA to sequence .fastq
.fastq@MISEQ:233:000000000-AGJP2:1:1101:15260:1358CTGTAAATTGCCTGACTTGCTAATTGTGATTAACTTAGTTT+BBBBBFFFFFFFGGGGGGGGGGHFFFHGHHGFFHHHHHAG
Line1: begins with a ’@’ character and is followed by a sequenceidentifier and an optional descriptionLine2: is the raw sequence lettersLine3:
begins with a ’+’ character and is optionally followed by thesame sequence identifier (and any description) againLine4: encodes the quality values for the sequence in Line 2, andmust contain the same number of symbols as letters in thesequence
Olga (NBIS) RNA-seq November 2017 13 / 49

From RNA to sequence .fastq
.fastq@MISEQ:233:000000000-AGJP2:1:1101:15260:1358CTGTAAATTGCCTGACTTGCTAATTGTGATTAACTTAGTTT+BBBBBFFFFFFFGGGGGGGGGGHFFFHGHHGFFHHHHHAG
Line1: begins with a ’@’ character and is followed by a sequenceidentifier and an optional descriptionLine2: is the raw sequence lettersLine3: begins with a ’+’ character and is optionally followed by thesame sequence identifier (and any description) againLine4:
encodes the quality values for the sequence in Line 2, andmust contain the same number of symbols as letters in thesequence
Olga (NBIS) RNA-seq November 2017 13 / 49
From RNA to sequence .fastq
.fastq@MISEQ:233:000000000-AGJP2:1:1101:15260:1358CTGTAAATTGCCTGACTTGCTAATTGTGATTAACTTAGTTT+BBBBBFFFFFFFGGGGGGGGGGHFFFHGHHGFFHHHHHAG
Line1: begins with a ’@’ character and is followed by a sequenceidentifier and an optional descriptionLine2: is the raw sequence lettersLine3: begins with a ’+’ character and is optionally followed by thesame sequence identifier (and any description) againLine4: encodes the quality values for the sequence in Line 2, andmust contain the same number of symbols as letters in thesequence
Olga (NBIS) RNA-seq November 2017 13 / 49

From RNA to sequence Quality score
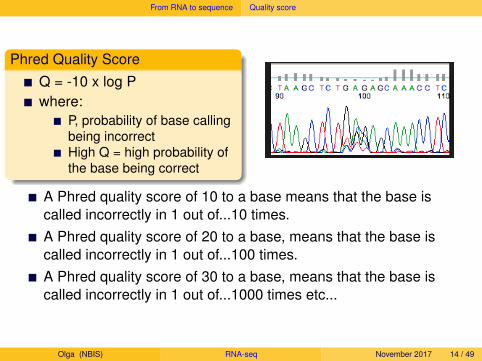
Phred Quality ScoreQ = -10 x log Pwhere:
P, probability of base callingbeing incorrectHigh Q = high probability ofthe base being correct
A Phred quality score of 10 to a base means that the base iscalled incorrectly in 1 out of...
10 times.A Phred quality score of 20 to a base, means that the base iscalled incorrectly in 1 out of...100 times.A Phred quality score of 30 to a base, means that the base iscalled incorrectly in 1 out of...1000 times etc...
Olga (NBIS) RNA-seq November 2017 14 / 49

From RNA to sequence Quality score
Phred Quality ScoreQ = -10 x log Pwhere:
P, probability of base callingbeing incorrectHigh Q = high probability ofthe base being correct
A Phred quality score of 10 to a base means that the base iscalled incorrectly in 1 out of...10 times.A Phred quality score of 20 to a base, means that the base iscalled incorrectly in 1 out of...
100 times.A Phred quality score of 30 to a base, means that the base iscalled incorrectly in 1 out of...1000 times etc...
Olga (NBIS) RNA-seq November 2017 14 / 49

From RNA to sequence Quality score
Phred Quality ScoreQ = -10 x log Pwhere:
P, probability of base callingbeing incorrectHigh Q = high probability ofthe base being correct
A Phred quality score of 10 to a base means that the base iscalled incorrectly in 1 out of...10 times.A Phred quality score of 20 to a base, means that the base iscalled incorrectly in 1 out of...100 times.A Phred quality score of 30 to a base, means that the base iscalled incorrectly in 1 out of...
1000 times etc...
Olga (NBIS) RNA-seq November 2017 14 / 49
From RNA to sequence Quality score
Phred Quality ScoreQ = -10 x log Pwhere:
P, probability of base callingbeing incorrectHigh Q = high probability ofthe base being correct
A Phred quality score of 10 to a base means that the base iscalled incorrectly in 1 out of...10 times.A Phred quality score of 20 to a base, means that the base iscalled incorrectly in 1 out of...100 times.A Phred quality score of 30 to a base, means that the base iscalled incorrectly in 1 out of...1000 times etc...
Olga (NBIS) RNA-seq November 2017 14 / 49

From RNA to sequence SE/PE
PE, paired-endTwo .fastq files are created per sequenced libraryThe order of reads in files is identical and naming of reads is thesame with the exception of the end informationThe way of naming reads are changing over time so the readnames depend on software version
@61DFRAAXX100204:1:100:10494:3070/1AAACAACAGGGCACATTGTCACTCTTGTATTTGAAAAACACTTTCCGGCCAT+ACCCCCCCCCCCCCCCCCCCCCCCCCCCCCBC?CCCCCCCCC@@CACCCCCA
@61DFRAAXX100204:1:100:10494:3070/2ATCCAAGTTAAAACAGAGGCCTGTGACAGACTCTTGGCCCATCGTGTTGATA+_^_a^cccegcgghhgZc`ghhc^egggd^_[d]defcdfd^Z^OXWaQ^ad
Olga (NBIS) RNA-seq November 2017 15 / 49

From RNA to sequence Strandness
SE
F: the single read is in the sense (F,forward) orientation
R: the single read is in theantisense (R, reverse) orientation
PE
RF: first read (/1) is sequenced asanti-sense (R) & second read (/2) isin the sense strand (F)
FR: first read (/1) is sequenced assense (F) & second read (/2) is inthe antisense strand (R)
Olga (NBIS) RNA-seq November 2017 16 / 49
Reference based data analysis pipeline
Reference based data analysis pipeline
Olga (NBIS) RNA-seq November 2017 17 / 49

Reference based data analysis pipeline Overview
Olga (NBIS) RNA-seq November 2017 18 / 49
Reference based data analysis pipeline Overview
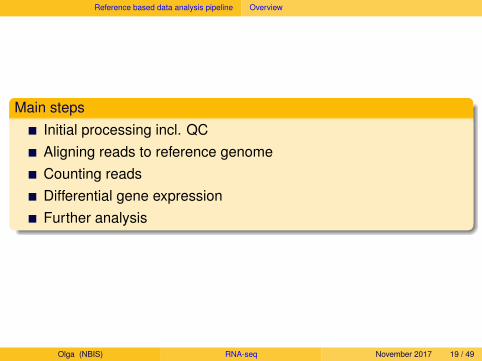
Main stepsInitial processing incl. QCAligning reads to reference genomeCounting readsDifferential gene expressionFurther analysis
Olga (NBIS) RNA-seq November 2017 19 / 49

Reference based data analysis pipeline Initial processing
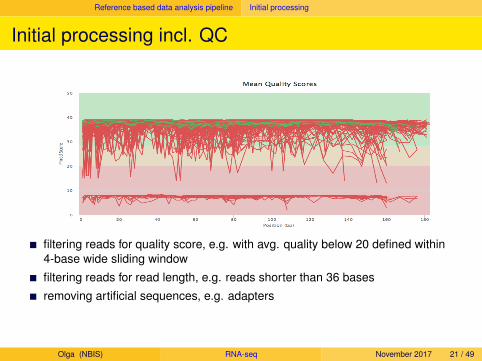
Initial processing incl. QC
Demultiplex by index orbarcode
Remove adaptersequences
Trim reads by quality
Discard reads byquality/ambiguity
Available tools
FastQC, PRINSEQ, TRIMMOMATIC, TrimGalore, FastX, Cutadapt
Olga (NBIS) RNA-seq November 2017 20 / 49
Reference based data analysis pipeline Initial processing
Initial processing incl. QC
filtering reads for quality score, e.g. with avg. quality below 20 defined within4-base wide sliding window
filtering reads for read length, e.g. reads shorter than 36 bases
removing artificial sequences, e.g. adapters
Olga (NBIS) RNA-seq November 2017 21 / 49
Reference based data analysis pipeline Aligning reads
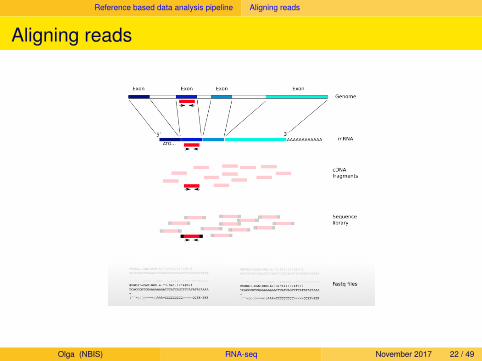
Aligning reads
Olga (NBIS) RNA-seq November 2017 22 / 49

Reference based data analysis pipeline Aligning reads
Aligning reads
Olga (NBIS) RNA-seq November 2017 23 / 49

Reference based data analysis pipeline Aligning reads
Aligning reads: mappers
important to use mappers allowing for a read to be "split" between distantregions of the reference in the event that the read spans two exons
lots of different aligners exists based on various algorithms e.g. brute forcecomparison, Burrows-Wheeler Transform, Smith-Waterman, Suffix tree
usually there is a trade-off between speed versus accuracy and sensitivity
usually the "biggest difference" is with default settings, most mappers will allowto optimize settings
performance vary by genome complexity
A good read: Barruzo et. al. Nature Methods 14, (2017)https://www.nature.com/articles/nmeth.4106
Available tools
STAR, HISAT, MapSlice2, Subread, TopHat
Olga (NBIS) RNA-seq November 2017 24 / 49

Reference based data analysis pipeline Aligning reads
Aligning reads: reference files
.fasta (download reference genome FASTA file)
.gtf (download the corresponding genome annotation in GTF or GFF)
SourceENSEMBL, NCBI
Olga (NBIS) RNA-seq November 2017 25 / 49

Reference based data analysis pipeline Aligning reads
Aligning reads: QC
Post mapping QC, e.g. reads should mostly map to known genes,most splice event should be known and canonical (GU-AG)
Olga (NBIS) RNA-seq November 2017 26 / 49

Reference based data analysis pipeline Counting
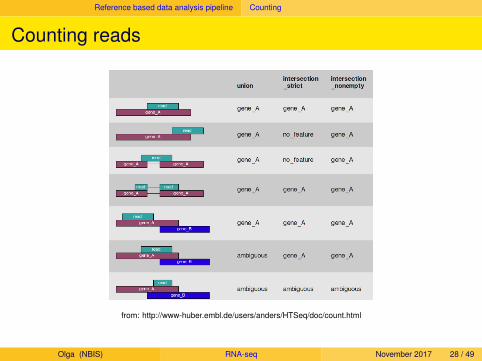
Counting reads
Available toolsHTSeq, featureCounts, R
Olga (NBIS) RNA-seq November 2017 27 / 49
Reference based data analysis pipeline Counting
Counting reads
from: http://www-huber.embl.de/users/anders/HTSeq/doc/count.html
Olga (NBIS) RNA-seq November 2017 28 / 49
Reference based data analysis pipeline Counting
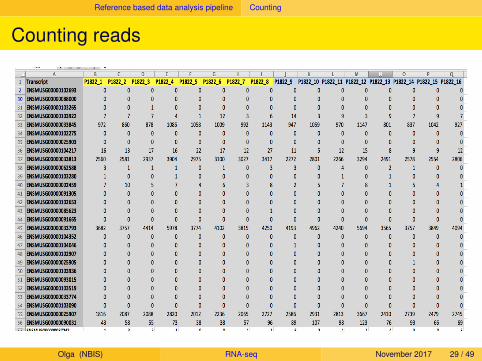
Counting reads
Olga (NBIS) RNA-seq November 2017 29 / 49

Reference based data analysis pipeline Counting
Normalizing counts
Gene counts depend e.g. on sequencing depth of a sampleand on the sequence length of the gene/transcript. Raw readcounts cannot be used to compare gene expression acrosslibraries.
Normalization methodsCPM, counts per million, accounts for sequencing depthRPKM/FPKM, Reads/Fragments Per Kilobase Per Milion accountsfor sequencing depth and transcript lengthTMM, Trimmed Mean of M-values, accounts for sequencing depthand transcript length and composition of the RNA populationand few other using scaling factors methods...
Olga (NBIS) RNA-seq November 2017 30 / 49

Reference based data analysis pipeline Differential expression
Differential gene expression
Outcomei = (Modeli) + errori
we collect data on a sample from a much larger population. Statistics lets us tomake inferences about the population from which it was derived
we try to predict the outcome given a model fitted to the data
Olga (NBIS) RNA-seq November 2017 31 / 49

Reference based data analysis pipeline Differential expression
Differential gene expression
t = x1−x2
sp
√1
n1+ 1
n2
height [cm]
Fre
quen
cy
165 170 175 180
010
3050
in RNA-seq case:
we take the normalized read counts
and we perform statistical analysisto discover quantitative changes inexpression levels betweenexperimental groups
e.g. to decide whether, for a givengene, an observed difference inread counts is significant, that is,whether it is greater than whatwould be expected just due tonatural random variation.
Olga (NBIS) RNA-seq November 2017 32 / 49

Reference based data analysis pipeline Differential expression
Differential expression
Usually, reads counts do not follow normal distribution & wework with low number of biological replicates
DE methodsDiscrete distribution models, e.g. edgeR, DESeq2Continuous discrete models, e.g. t-testNon-parametric model, e.g. SAMseq
Empirical frequency
Freq
uenc
y
0 200 400 600 800 1000
010
0020
0030
0040
0050
0060
00
0 5 10 15 20
0.0
0.1
0.2
0.3
0.4
0.5
Negative binomial distribution
−10 −5 0 5 100.
00.
10.
20.
30.
4
Normal distribution
Olga (NBIS) RNA-seq November 2017 33 / 49
Reference based data analysis pipeline Differential expression
Differential expression
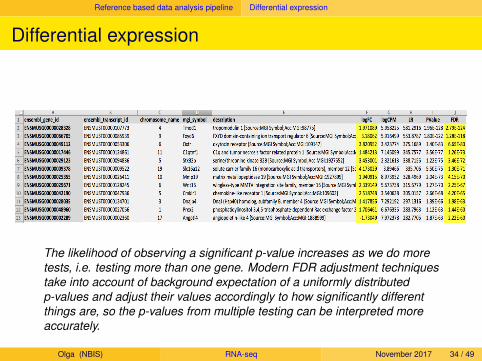
The likelihood of observing a significant p-value increases as we do moretests, i.e. testing more than one gene. Modern FDR adjustment techniquestake into account of background expectation of a uniformly distributedp-values and adjust their values accordingly to how significantly differentthings are, so the p-values from multiple testing can be interpreted moreaccurately.
Olga (NBIS) RNA-seq November 2017 34 / 49

Reference based data analysis pipeline Differential expression
Differential expression
10
100
150
200
Expre
ssion
E001 E003 E005 E007 E009 E011 E013 E015 E017 E019 E021
26916367 26917215 26918063 26918911 26919759
ENSMUSG00000014873 + FBS24 FBS48
Available toolsedgeR, DEXSeq
Olga (NBIS) RNA-seq November 2017 35 / 49

Reference based data analysis pipeline Further analysis
Further analysis
Annotating the results e.g. with gene symbols, GO termsVisualizing the results, e.g. Volcano plotsGene set analysis etc...
Available toolsbioMart (R), DAVID, GOrilla, REVIGO, ClustVis...
Olga (NBIS) RNA-seq November 2017 36 / 49

What about de-novo assembly of transcriptomes?
What about de-novo assembly of transcriptomes?
Olga (NBIS) RNA-seq November 2017 37 / 49

What about de-novo assembly of transcriptomes? Overview
Olga (NBIS) RNA-seq November 2017 38 / 49
What about de-novo assembly of transcriptomes? Building a reference transcriptome
Building a reference transcriptomealternative strategy when well-assembled reference genome from a relativelyrecently diverged organism is not available
primary goal: assembling a transcriptome de novo to reconstruct a set ofcontigous sequences (contigs) presumed to reflect accurately a large portion ofthe RNAs actually transcribed in the cells
not a trivial task, becausea limited amount of information about the original gene transcripts is retained in the shortreads produced by a sequencer
genes show different levels of gene expression (uneven coverage)
more sequencing depth is needed to represent less abundant genes and rare events
reads from the same transcript must be placed together in the face of variants introducedby polymorphism and sequencing errors
and the process must assemble reads from different but often similar, paralogoustranscripts as separate contigs
Olga (NBIS) RNA-seq November 2017 39 / 49

What about de-novo assembly of transcriptomes? Building a reference transcriptome
Solutions to sequence assembly arose from the field of mathematicsknown as graph theory. These approaches were designed with genomeassembly in mind but have been adapted for transcriptome assembly asnecessary. Most of them are based on de Brujin graphs.
Available toolsVelvet/Oases: Velvet constructs de Bruijn graphs, simplifies the graphs, andcorrects the graphs for errors and repeats. Oases post-processes Velvetassemblies with different k-mer sizes
Trans-ABySS: much like the Velvet/Oases model, Trans-ABySS (Robertson et al.2010) takes multiple ABySS assemblies (Simpson et al. 2009) produced from arange of k-mer sizes to optimize transcriptome assemblies in the face of varyingcoverage across transcripts
Trinity: "Inchworm" builds initial contigs by finding paths through k-mer graphs."Chrysalis" groups these contigs together and builds de Bruijn graphs for thesegroups, in which the overlaps are nodes and the k-mers connecting edges."Butterfly" simplifies the graphs when possible, then reconciles the graphs withoriginal reads to output individual contigs representative of unique splice variantsand paralogous transcripts
Olga (NBIS) RNA-seq November 2017 40 / 49
What about de-novo assembly of transcriptomes? Building a reference transcriptome
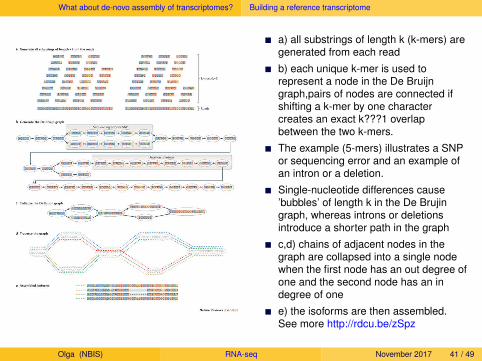
a) all substrings of length k (k-mers) aregenerated from each read
b) each unique k-mer is used torepresent a node in the De Bruijngraph,pairs of nodes are connected ifshifting a k-mer by one charactercreates an exact k???1 overlapbetween the two k-mers.
The example (5-mers) illustrates a SNPor sequencing error and an example ofan intron or a deletion.
Single-nucleotide differences cause’bubbles’ of length k in the De Brujingraph, whereas introns or deletionsintroduce a shorter path in the graph
c,d) chains of adjacent nodes in thegraph are collapsed into a single nodewhen the first node has an out degree ofone and the second node has an indegree of one
e) the isoforms are then assembled.See more http://rdcu.be/zSpz
Olga (NBIS) RNA-seq November 2017 41 / 49
What about de-novo assembly of transcriptomes? Annotations of transcripts
If a reference genome is available, annotation is relatively straightforward:genomic coordinates from the reference genome are normally associatedwith various forms of annotation information through databases. Atranscriptome assembled de novo, on the other hand, is often annotatedfrom scratch
NCBI-supported BLAST"match" query sequences to one or more databases of curated, annotatedsequences, using an efficient local sequence alignment approach.
it may be adequate to blast against a database of known or predicted transcriptsfrom the reference genome of a closely-related organism
it may be desirable to blast contigs against all nucleotide sequences in aninclusive database
if the annotation emphasis is on protein-coding transcripts, BLASTx, whichtranslates each query sequence (in all six reading frames) to amino acidsequences and uses these to query a protein database, may be an appropriatetool
Olga (NBIS) RNA-seq November 2017 42 / 49

And what about scRNA-seq?
And what about scRNA-seq?
Olga (NBIS) RNA-seq November 2017 43 / 49
And what about scRNA-seq?
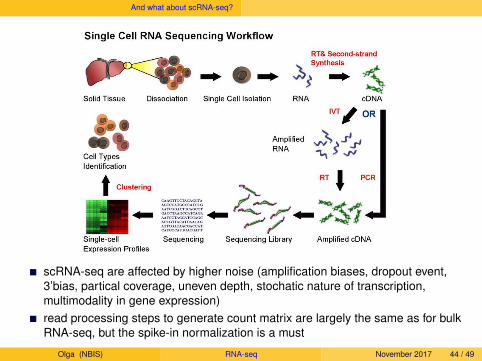
scRNA-seq are affected by higher noise (amplification biases, dropout event,3’bias, partical coverage, uneven depth, stochatic nature of transcription,multimodality in gene expression)read processing steps to generate count matrix are largely the same as for bulkRNA-seq, but the spike-in normalization is a must
Olga (NBIS) RNA-seq November 2017 44 / 49
And what about scRNA-seq? Common steps
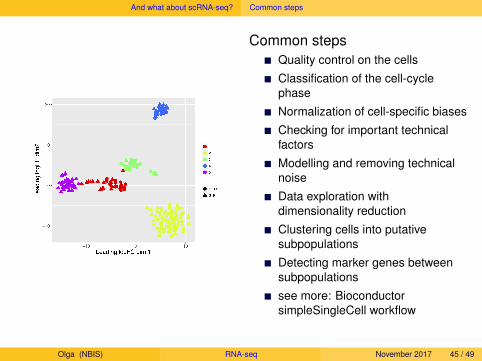
Common stepsQuality control on the cells
Classification of the cell-cyclephase
Normalization of cell-specific biases
Checking for important technicalfactors
Modelling and removing technicalnoise
Data exploration withdimensionality reduction
Clustering cells into putativesubpopulations
Detecting marker genes betweensubpopulations
see more: BioconductorsimpleSingleCell workflow
Olga (NBIS) RNA-seq November 2017 45 / 49

Exercises
Exercises
Olga (NBIS) RNA-seq November 2017 46 / 49
Exercises Main exercise
Main exercisechecking the quality of the raw reads with FastQCmapping the reads to the reference genome using STARconverting between SAM and BAM files format using Samtoolsassessing the post-alignment reads quality using QualiMapcounting reads overlapping with genes regions usingfeatureCountsbuilding statistical model to find DE genes using edgeR calledfrom a prepared R script
Olga (NBIS) RNA-seq November 2017 47 / 49

Exercises Bonus exercises
Bonus exercisesfunctional annotation, putting DE genes in the biological contextexon usage, studying the alternative splicingdata visualisation and graphicsde novo transcriptome assembly
Olga (NBIS) RNA-seq November 2017 48 / 49

Exercises Bonus exercises
Thank you for attentionQuestions?
Enjoy the rest of the course
Read moreRNA-seqlopediaRNA-Seq blogConesa et al. Genome Biology, 2016, A survey of best practicesfor RNA-seq data analysis
Olga (NBIS) RNA-seq November 2017 49 / 49