introduction to stream explorer and oracle event …...introduction to stream explorer and oracle...
TRANSCRIPT

Introduction to Stream Explorer and Oracle Event Processor
In this hands-on, we will work with Stream Explorer and Oracle Event Processor- along with JMS, REST,
SOA Suite and EDN.
In the hands-on you are working with a VM running in Oracle Virtual Box. The VM contains the Linux
Ubuntu operating system, an Oracle 11gR2 XE database and JDeveloper 12.1.3 with integrated WebLogic
Server 12.1.3 that also contains the SOA Suite 12c Quick Start Installation. The Oracle Event Processor
12c is installed with the Stream Explorer “patch” applied to it. An OEP domain has been created. Note
that this domain runs completely outside the integrated WebLogic Server domain started from
JDeveloper and running the SOA Suite 12c.
The hands-on leads you through the following steps:
learn the basics of Stream Explorer: how to get going with events produced from a CSV file and
simple event analysis
learn more advanced Stream Explorer techniques – both in terms of the analysis (enrichment
and pattern matching) and in terms of the integration and communication (using REST, JMS and
EDN)
learn how to export a StreamExplorer application to an OEP project that can be edited and fine
tuned in JDeveloper, then redeployed to OEP
1. Getting started The folder HandsOnStreamExplorerAndOEP_May2015 contains the Virtual Machine that you will be
using in this hands-on.
This VM is in a file called SX and OEP - JDev 12.1.3 with Oracle DB XE 11gR2 on
UbuntuHandsOnSOA_SIG19may2015.ova. You can import this file into Virtual Box. If you do not yet have
Virtual Box running on your machine, you can use the Virtual Box installer that is also in this directory.
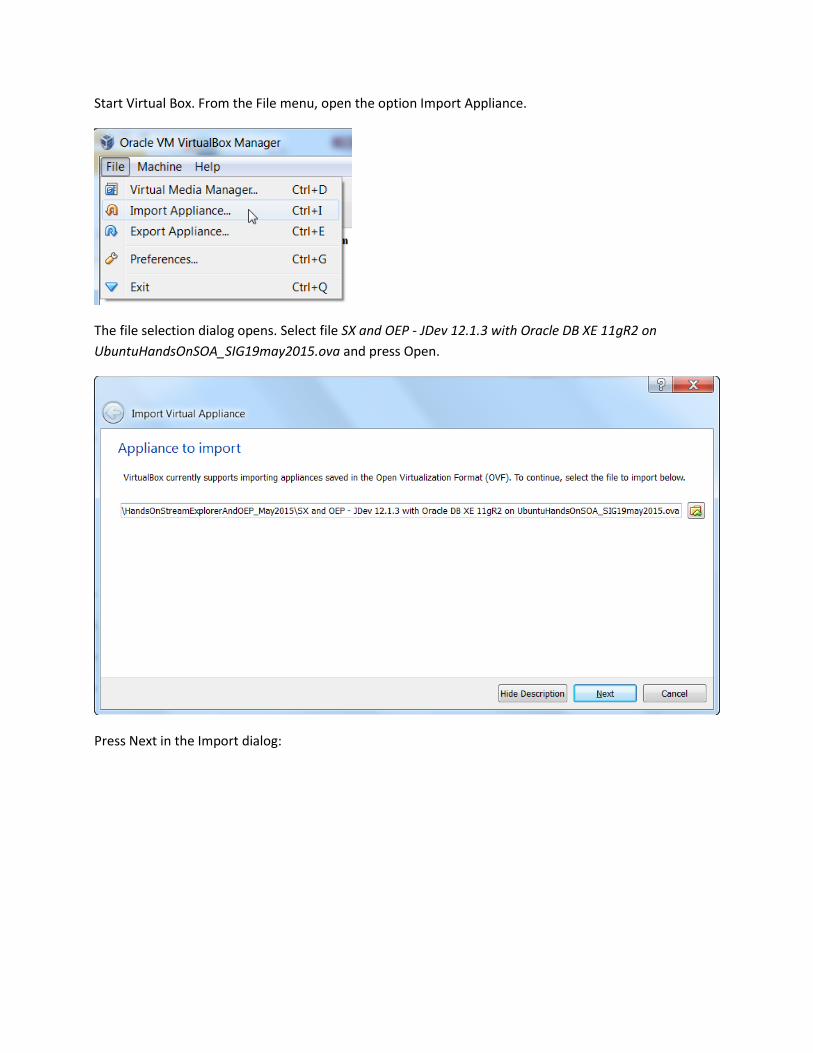
Start Virtual Box. From the File menu, open the option Import Appliance.
The file selection dialog opens. Select file SX and OEP - JDev 12.1.3 with Oracle DB XE 11gR2 on
UbuntuHandsOnSOA_SIG19may2015.ova and press Open.
Press Next in the Import dialog:
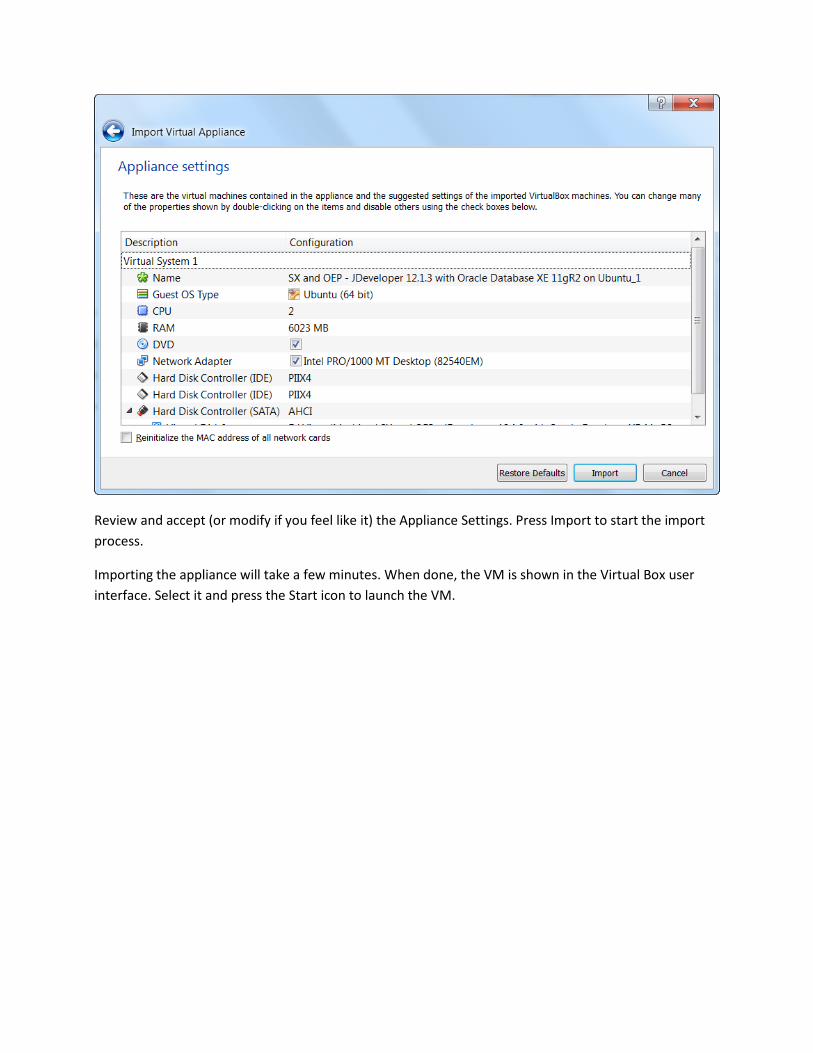
Review and accept (or modify if you feel like it) the Appliance Settings. Press Import to start the import
process.
Importing the appliance will take a few minutes. When done, the VM is shown in the Virtual Box user
interface. Select it and press the Start icon to launch the VM.
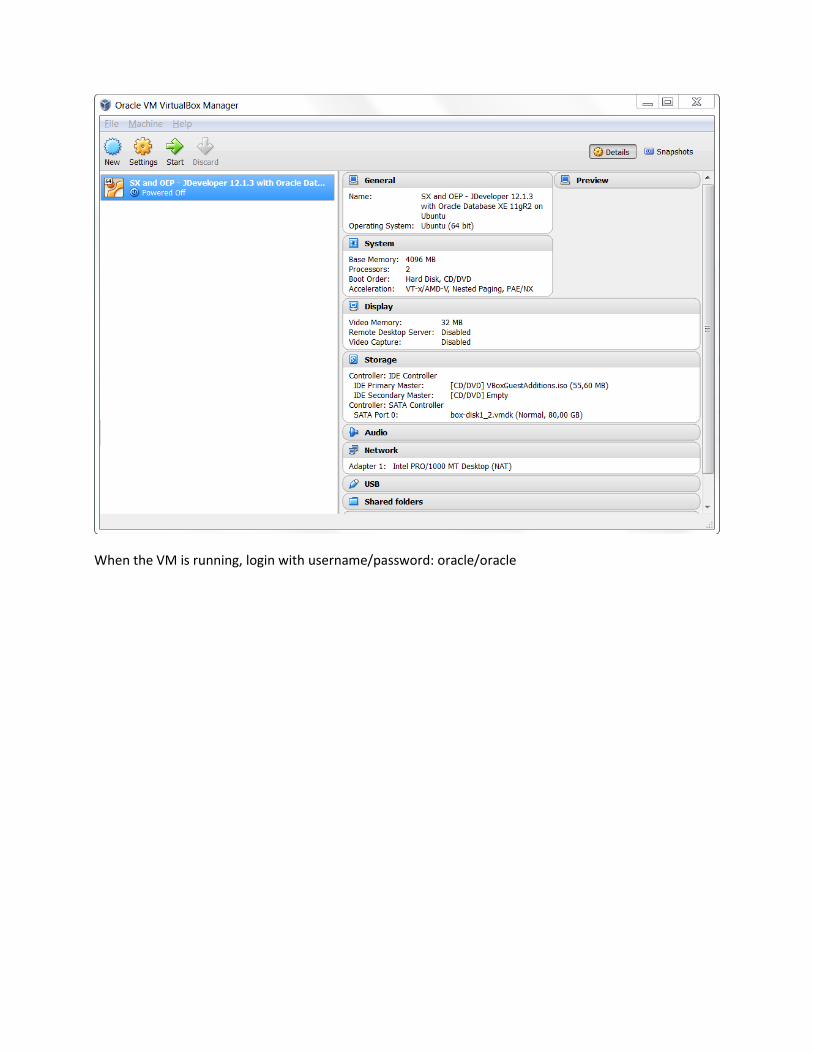
When the VM is running, login with username/password: oracle/oracle

Note: User vagrant with password vagrant can be used to assume root privileges.

At the end of this document are some details about the configuration of the VM – such as database
configuration and host folder mapping. The text document readme.txt that you find on the desktop also
contains such details:

The highlighted lines provide the instruction for running JDeveloper.
Start JDeveloper with the following steps:
open a new terminal (from the launcher icon)
change the directory: cd /u01/app/oracle/FMW12c/jdeveloper/jdev/bin/
run jdev: ./jdev
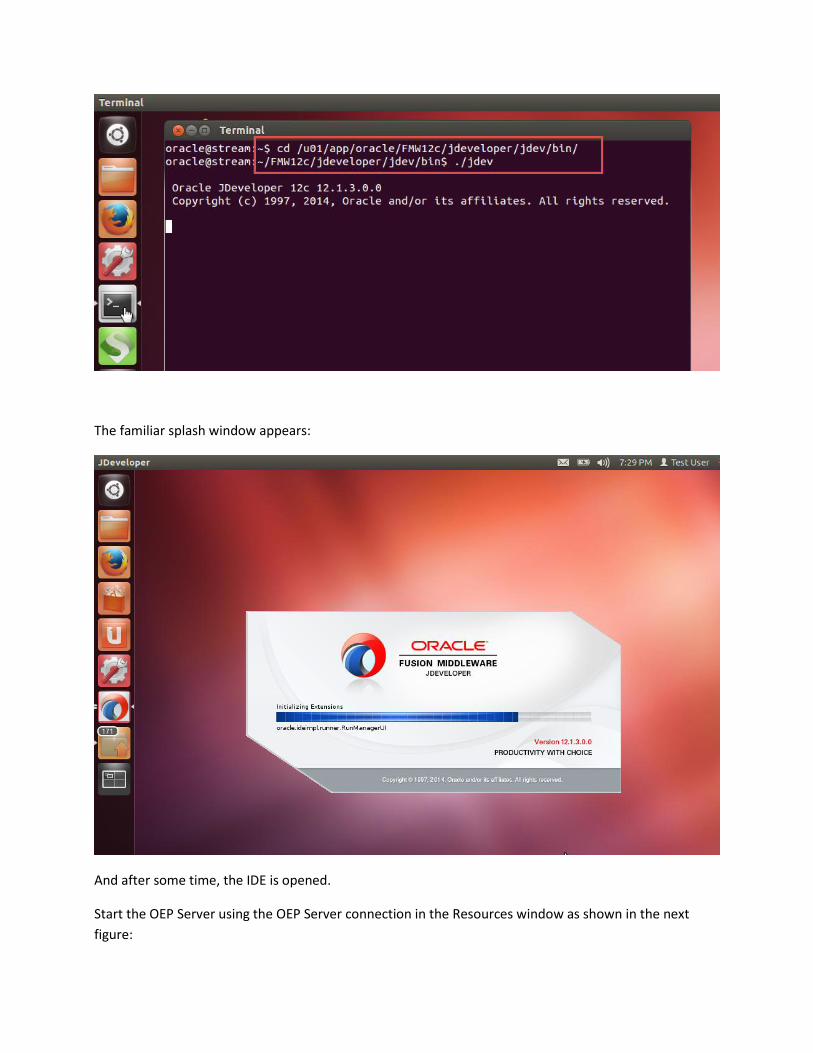
The familiar splash window appears:
And after some time, the IDE is opened.
Start the OEP Server using the OEP Server connection in the Resources window as shown in the next
figure:

The console displays:
and after some time, the server is running.
Both the StreamExplorer GUI and the Visualizer console can now be accessed in the browser.
Start Firefox from the launcher:
And use the bookmark to open StreamExplorer:
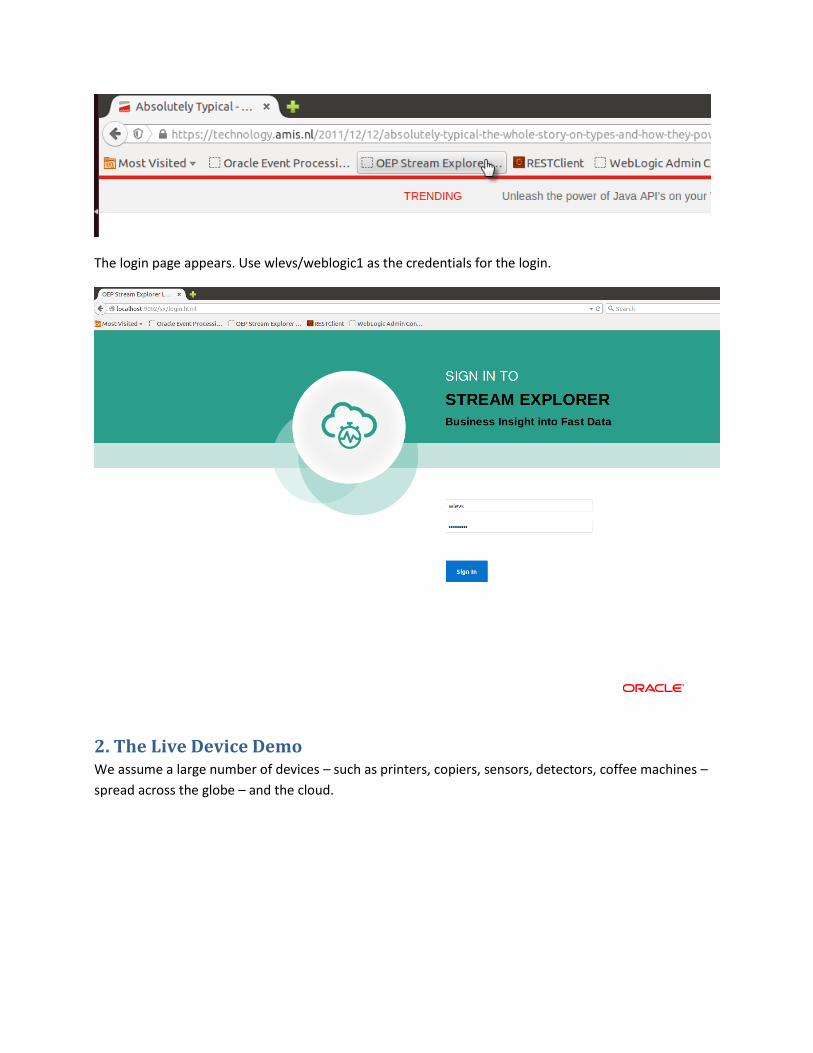
The login page appears. Use wlevs/weblogic1 as the credentials for the login.
2. The Live Device Demo We assume a large number of devices – such as printers, copiers, sensors, detectors, coffee machines –
spread across the globe – and the cloud.

All devices continuously report their status, by sending a message every other second that contains their
device identifier, a code that can indicate the healthy status or an error and some additional details. The
sheer number of devices combined with the continuous stream of reports they sent in set the challenges
perimeters within which we have to implement fast and effective monitoring. Our specific challenge is:
“whenever a device reports an error code three times within 10 seconds, we consider that device
broken, and action should be taken” (that also means that we do not spring into action on the first or
even second fault report from a device). Additionally: we only require a single action for a broken device
– once the action is initiated, we do not have to start an action again for that same device – unless of
course it is broken again at a much later point in time.
This first step with Stream Explorer uses a CSV file as the source for events – because it is convenient
during development, not because it is a realistic scenario for a production deployment. Normally, a live
stream such as a JMS destination or an HTTP channel would be used. Note that the Stream Explorer
implementation would be exactly the same for these other stream types. Stream Explorer processes the
device signals. For signals that satisfy the requirements of a broken device, the information is enriched
from a database with device details – such as the physical location of the device

Resources: this blog article provides an overview of this device monitoring example and this YouTube
video shows what it looks like.
With Stream Explorer - everything starts from a Stream - a source of events or messages such as a JMS Queue or Topic, the SOA Suite Event Delivery Network, an HTTP channel or a CSV file such as in this case. Through one or more Explorations - that each can do filtering, aggregation, enrichment and pattern matching - finally conclusions can be published to a target. Targets can be JMS destinations, HTTP channels, a CSV file and the Event Delivery Network of SOA Suite.
In a number of steps, we will go from the CSV file with device signals to an output file that holds all broken devices. In later practices we will not just send output to a file but to live channels such as JMS, EDN and REST service targets.
The first step will be an exploration that filters the non-ok signals from the stream:
The second step will find failing devices by counting the number of non-ok signals in a 10 second period and filtering on any device with a count greater than or equal to 3:
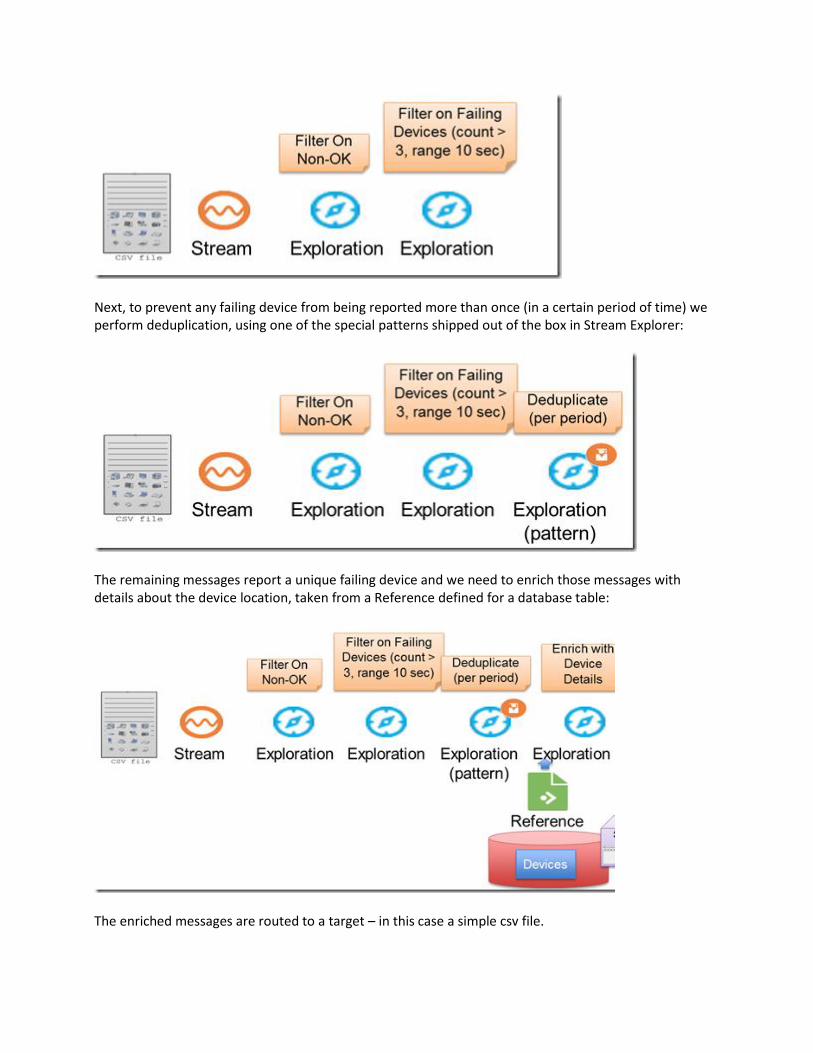
Next, to prevent any failing device from being reported more than once (in a certain period of time) we perform deduplication, using one of the special patterns shipped out of the box in Stream Explorer:
The remaining messages report a unique failing device and we need to enrich those messages with details about the device location, taken from a Reference defined for a database table:
The enriched messages are routed to a target – in this case a simple csv file.
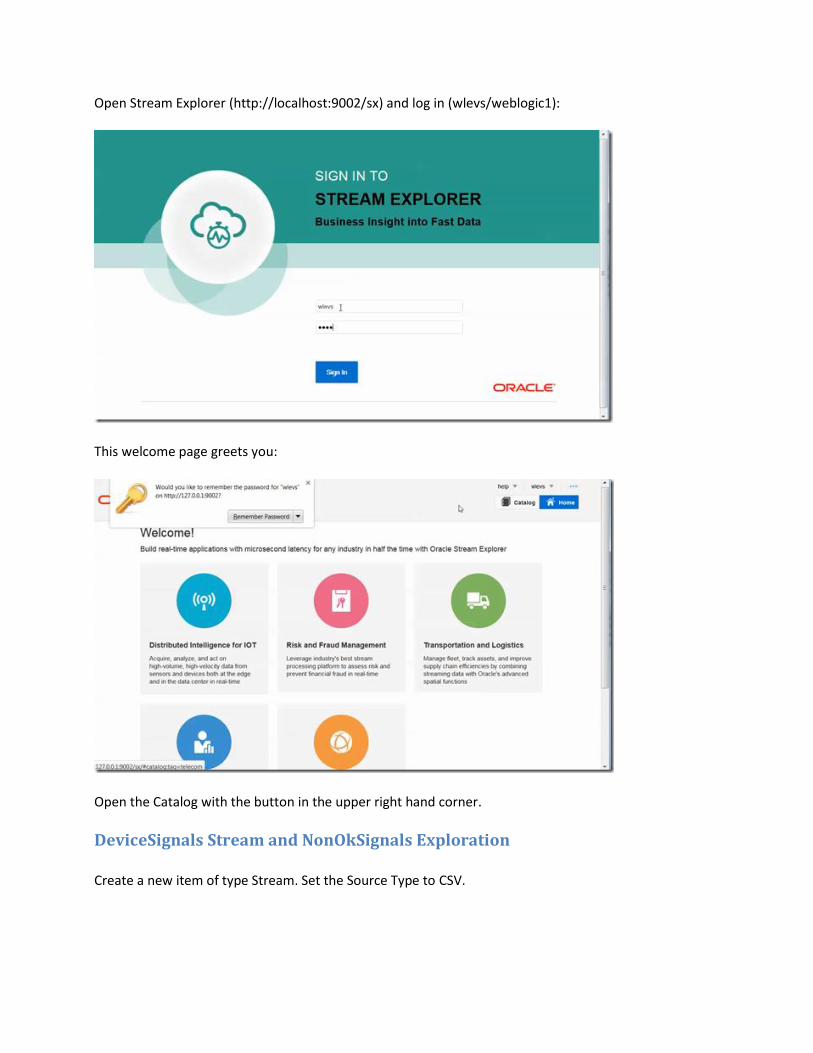
Open Stream Explorer (http://localhost:9002/sx) and log in (wlevs/weblogic1):
This welcome page greets you:
Open the Catalog with the button in the upper right hand corner.
DeviceSignals Stream and NonOkSignals Exploration
Create a new item of type Stream. Set the Source Type to CSV.
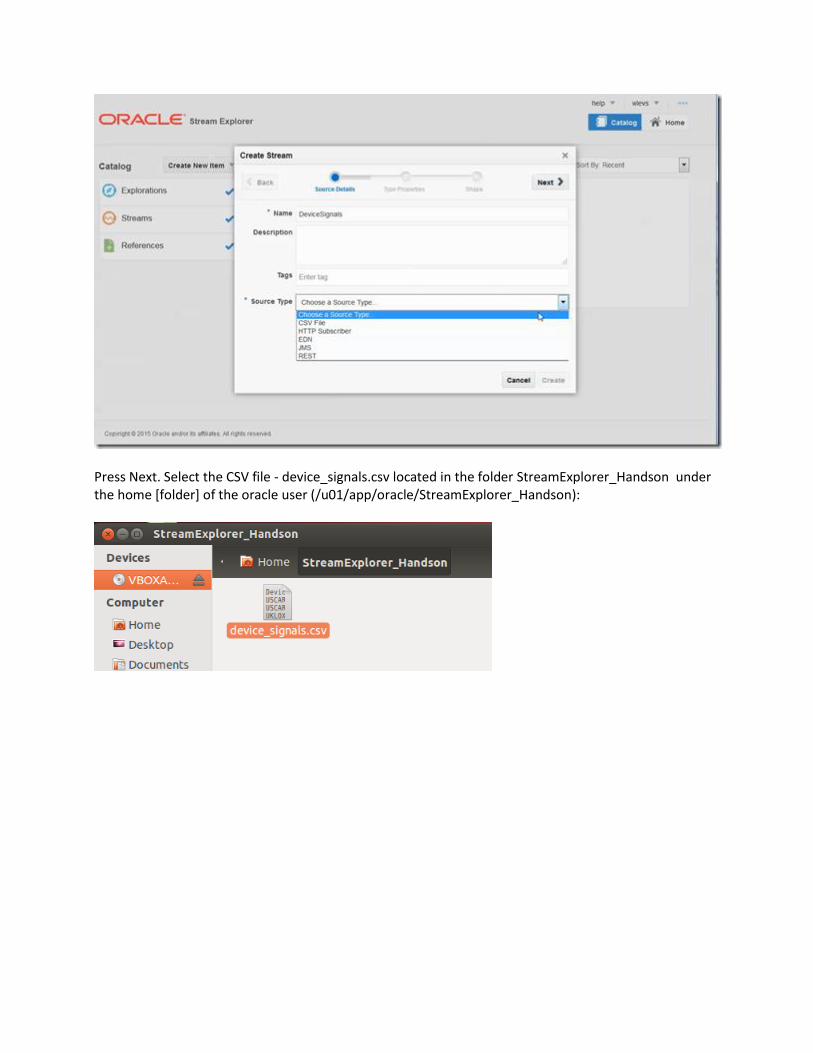
Press Next. Select the CSV file - device_signals.csv located in the folder StreamExplorer_Handson under the home [folder] of the oracle user (/u01/app/oracle/StreamExplorer_Handson):
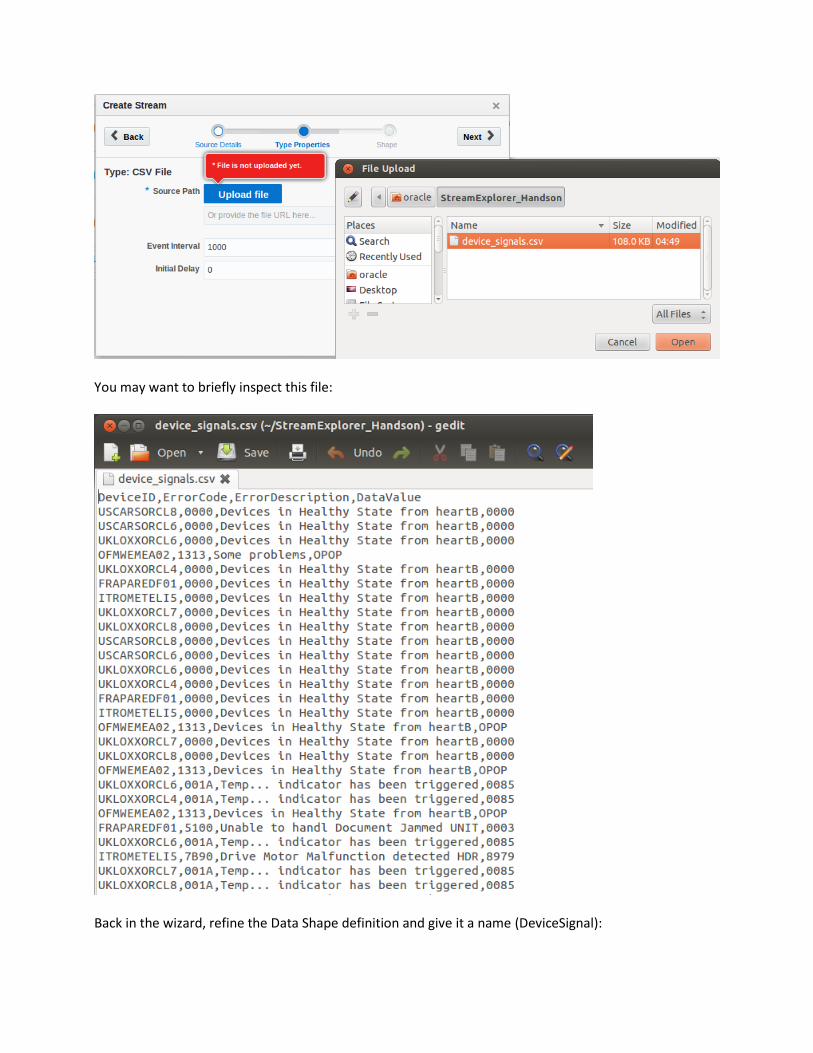
You may want to briefly inspect this file:
Back in the wizard, refine the Data Shape definition and give it a name (DeviceSignal):
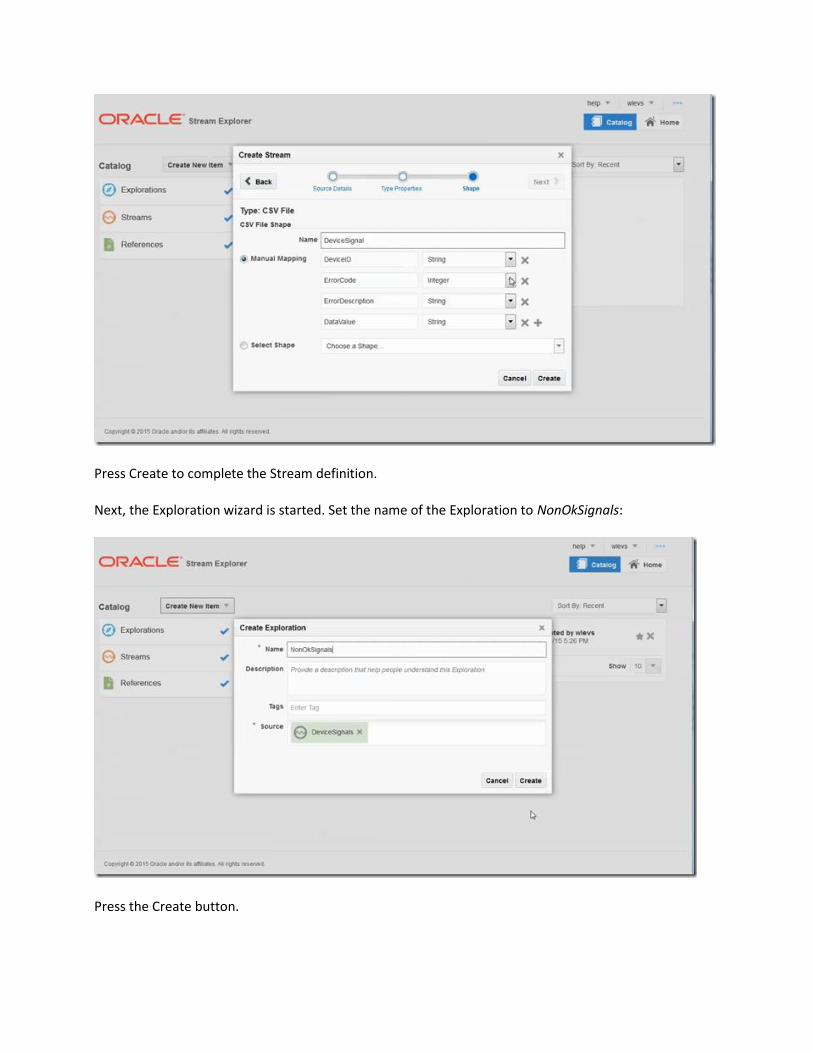
Press Create to complete the Stream definition.
Next, the Exploration wizard is started. Set the name of the Exploration to NonOkSignals:
Press the Create button.

The Exploration editor is showing and the first messages read from the CSV file are produced in the exploration:
Define a filter for the exploration, to only produce messages for non ok error codes:
Publish the exploration – click on the Actions button and select Publish - and return to the catalog.

Exploration for Failing Devices
Create a new Exploration. Call it FaultyDevice and use exploration NonOkSignals as the source.
Press Create to navigate to the editor for the exploration.
Specify a summary:
count DeviceId , group by DeviceId.
Next, add a filter, to produce results only when for a DeviceId we have counted 3 or more NonOkSignals. Finally, specify a time window over which to calculate the count. Set the range of the window to 20 seconds and set the evaluation frequency to [once every] 3 [seconds].
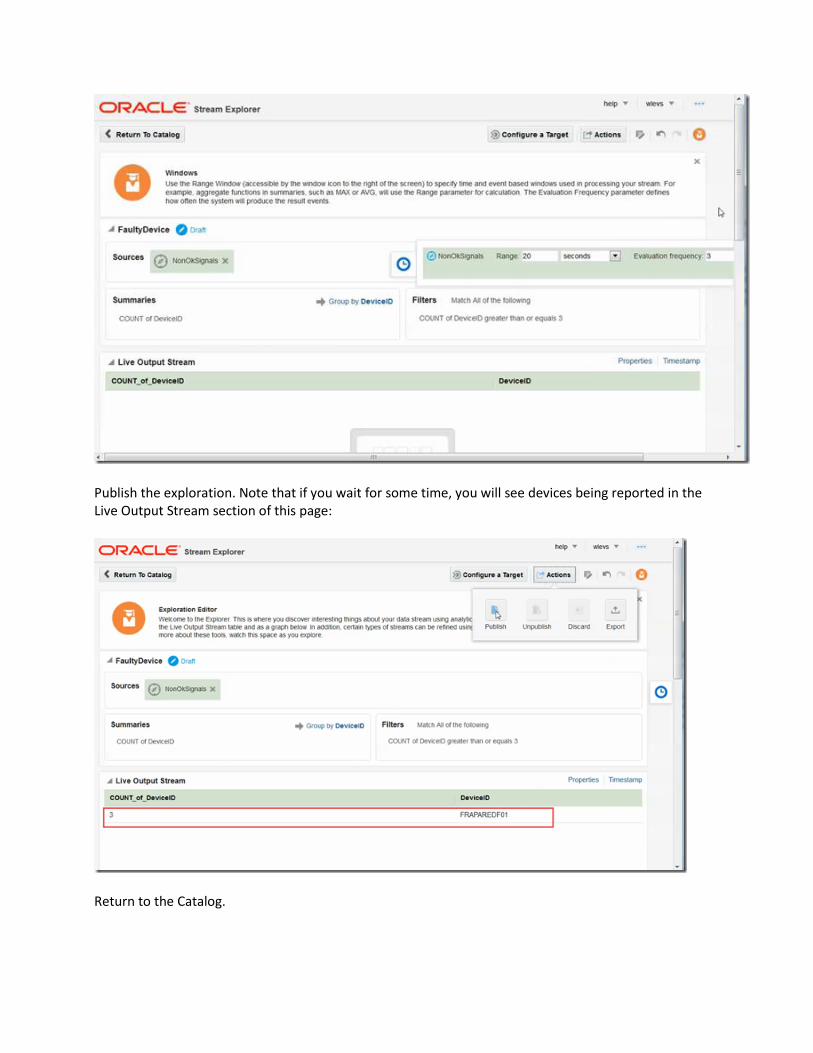
Publish the exploration. Note that if you wait for some time, you will see devices being reported in the Live Output Stream section of this page:
Return to the Catalog.

Deduplicate Devices
Create a Pattern - an exploration based on a predefined pattern. Pick the Eliminate Duplicates pattern.
Select FaultyDevice as the source for this pattern exploration. Select DeviceId as the key to determine the uniqueness by (eliminate the second and subsequent events from the FaultyDevice stream). Set the window to 1 minute. This means that any subsequent events for a device are blocked during 1 minute after the initial event for the device. After that minute, the slate is cleared for that device.
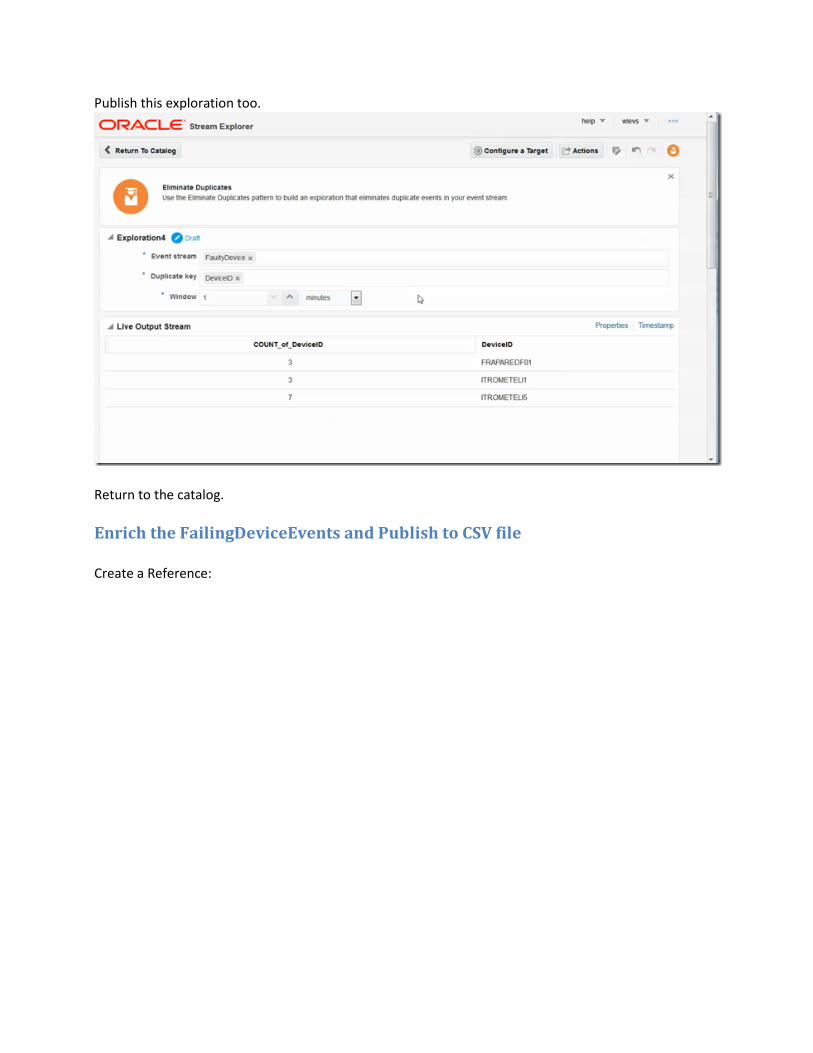
Publish this exploration too.
Return to the catalog.
Enrich the FailingDeviceEvents and Publish to CSV file
Create a Reference:

Note: before doing this, a Data Source to the schema (WC) that contains the database table should have been set up in OEP - either in the configuration file directly or through the WLEvent Visualizer console
(http://localhost:9002/wlevs/):
Click on the node defaultserver.
Open the tab Data Sources and click on the Add button.

The wizard for creating a [JDBC] Data Source is opened. Provide a name and a JNDI name, as shown in the figure:
In step two, select Oracle as the Data Type, provide the [JDBC} URL and the user name and password (both are wc).

Accept the defaults on step 3 and press Save.
This will create the data source and add its definition to the configuration file:

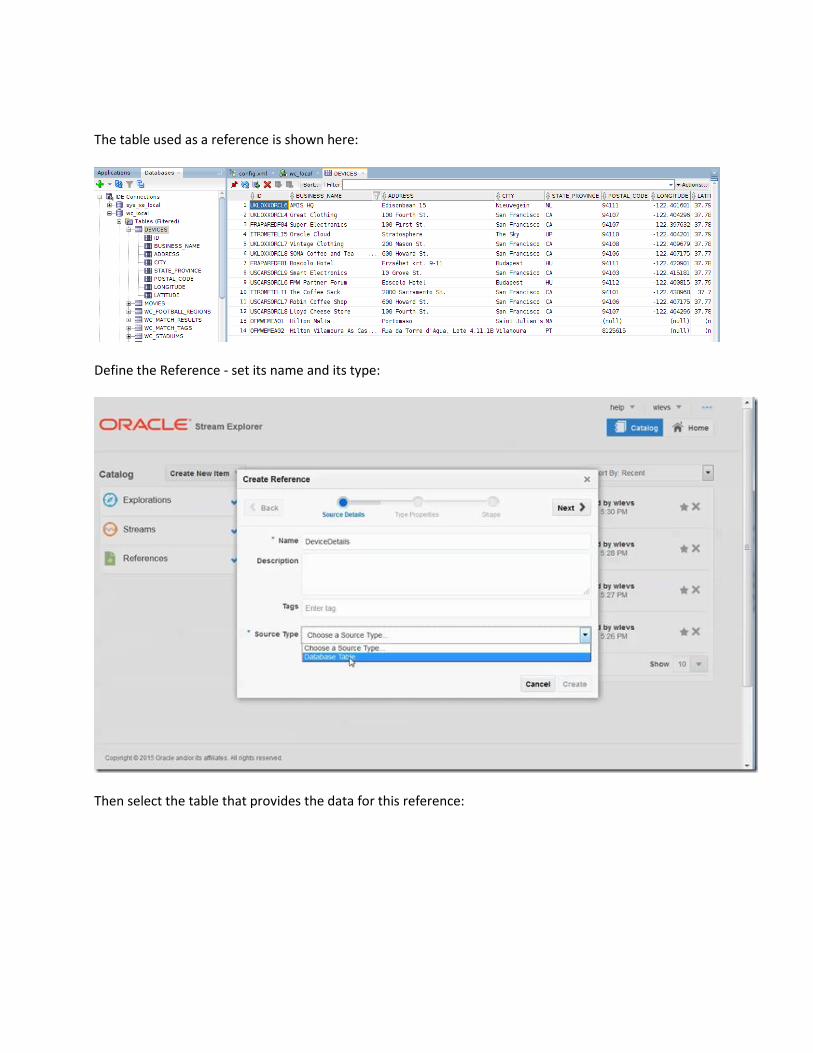
The table used as a reference is shown here:
Define the Reference - set its name and its type:
Then select the table that provides the data for this reference:

And press Create.
Now create a new exploration - our last one in this practice:
Set its name and select Exploration4 - the name auto-assigned to the [Eliminate Duplicates] Pattern based exploration - as the source:
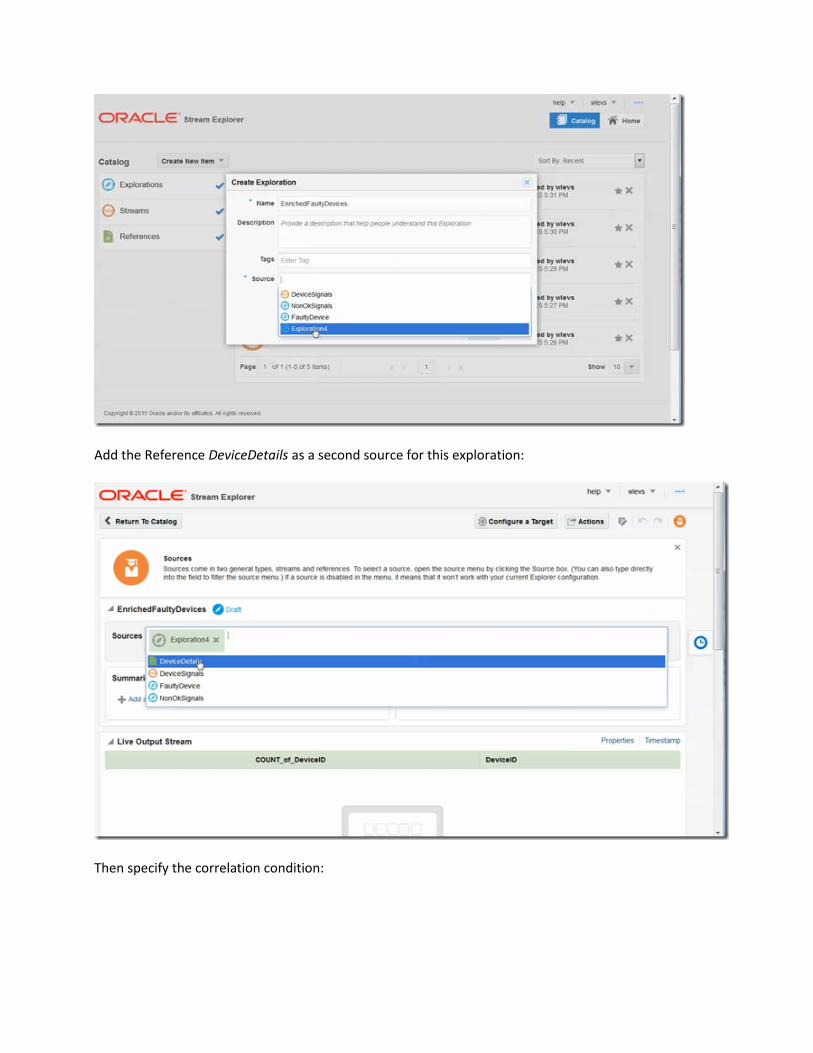
Add the Reference DeviceDetails as a second source for this exploration:
Then specify the correlation condition:
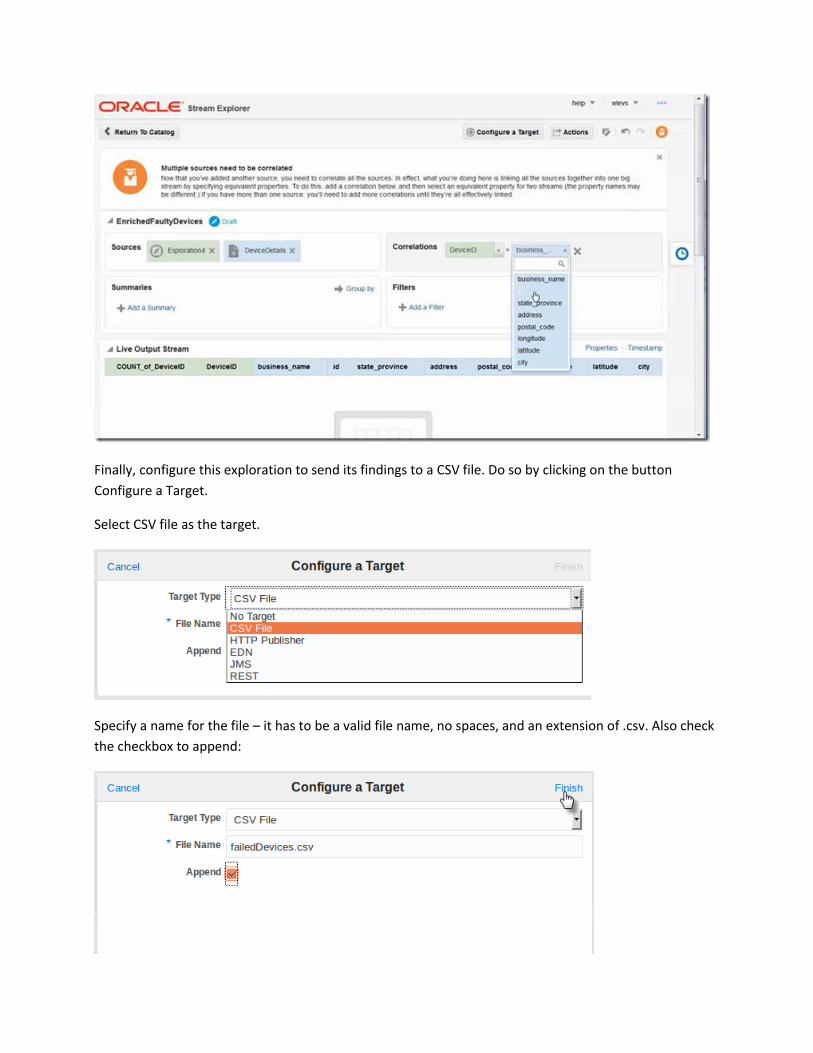
Finally, configure this exploration to send its findings to a CSV file. Do so by clicking on the button
Configure a Target.
Select CSV file as the target.
Specify a name for the file – it has to be a valid file name, no spaces, and an extension of .csv. Also check
the checkbox to append:
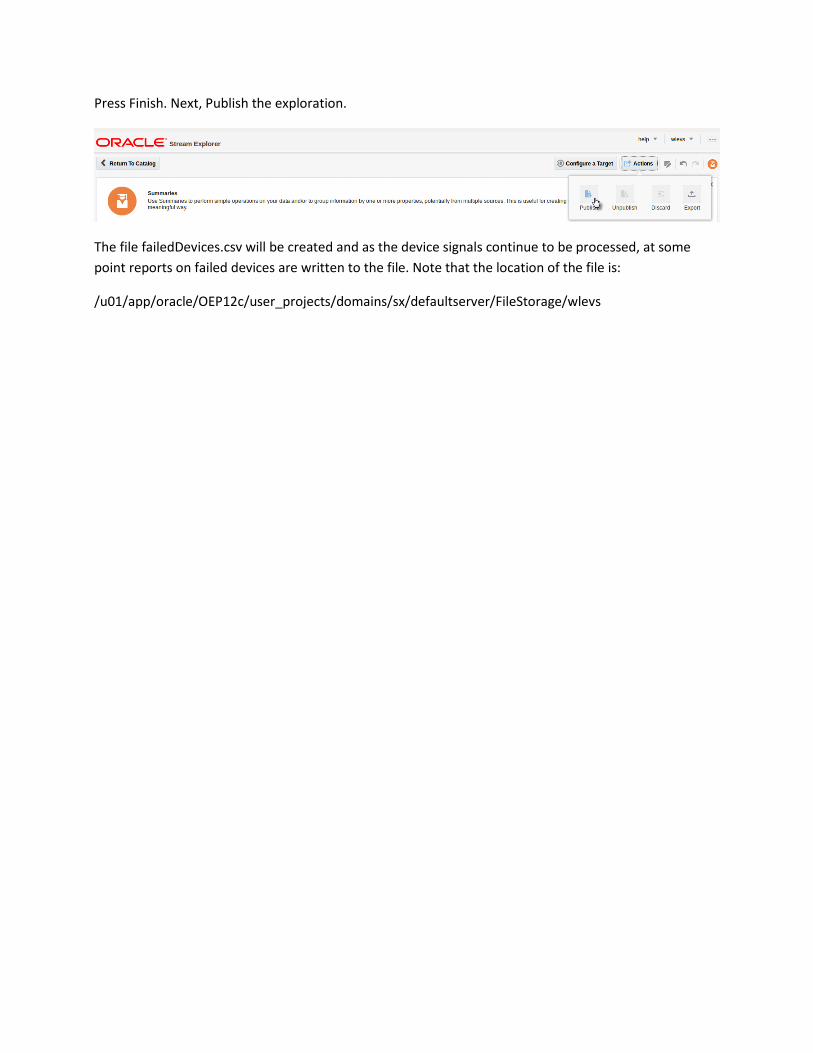
Press Finish. Next, Publish the exploration.
The file failedDevices.csv will be created and as the device signals continue to be processed, at some
point reports on failed devices are written to the file. Note that the location of the file is:
/u01/app/oracle/OEP12c/user_projects/domains/sx/defaultserver/FileStorage/wlevs
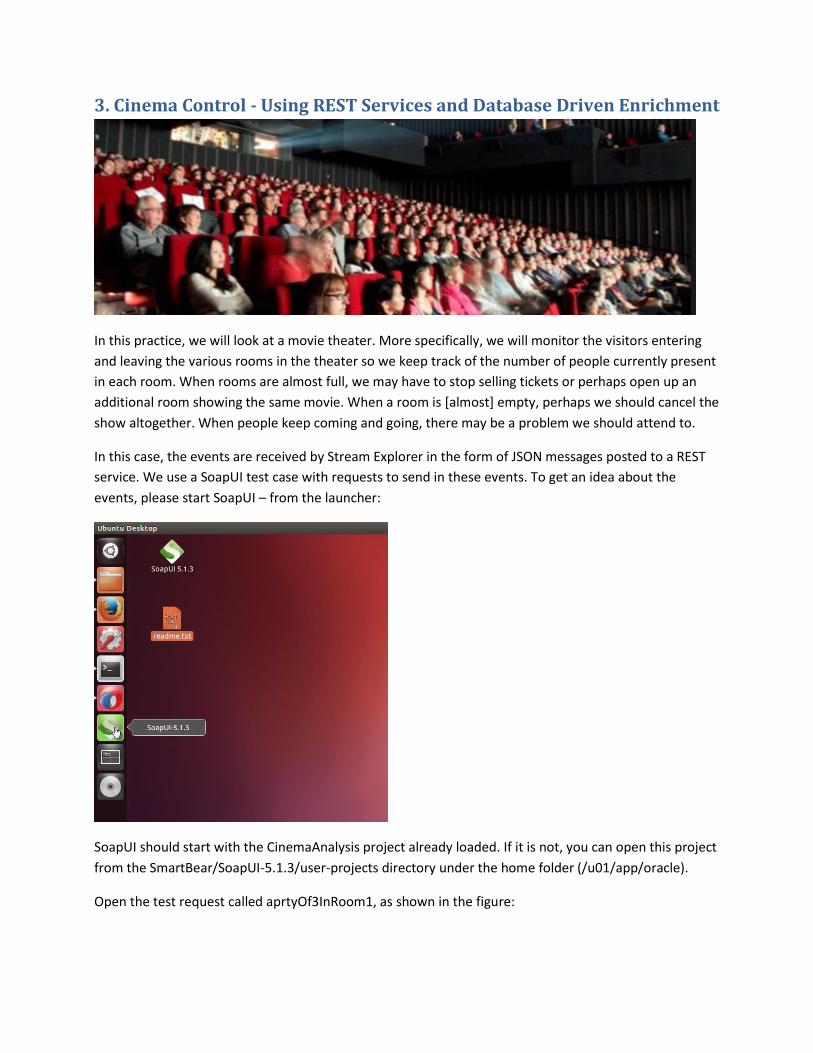
3. Cinema Control - Using REST Services and Database Driven Enrichment
In this practice, we will look at a movie theater. More specifically, we will monitor the visitors entering
and leaving the various rooms in the theater so we keep track of the number of people currently present
in each room. When rooms are almost full, we may have to stop selling tickets or perhaps open up an
additional room showing the same movie. When a room is [almost] empty, perhaps we should cancel the
show altogether. When people keep coming and going, there may be a problem we should attend to.
In this case, the events are received by Stream Explorer in the form of JSON messages posted to a REST
service. We use a SoapUI test case with requests to send in these events. To get an idea about the
events, please start SoapUI – from the launcher:
SoapUI should start with the CinemaAnalysis project already loaded. If it is not, you can open this project
from the SmartBear/SoapUI-5.1.3/user-projects directory under the home folder (/u01/app/oracle).
Open the test request called aprtyOf3InRoom1, as shown in the figure:

The request is configured to be sent to the endpoint http://localhost:9002. That is the endpoint for
Stream Explorer (and OEP and more specifically the Jetty server running the OEP domain on top of which
Stream Explorer was applied). The (REST) Resource is specified as /cinema. Together this means that this
request is sent as a POST request to the end point http://localhost:9002/cinema. So that is where our
StreamExplorer application will have to consume the message.
The message itself has a JSON payload with two simple properties: room (to identify a room in the movie
theater) and partySize (to stipulate the number of people involved in an observation). Note: the number
of people is positive when a party enters the room and negative when it leaves the room.
The TestSuite TestSuiteCinema contains a single test case with a number of steps that simulate events on
a slow night in the movie theater.
Create a Stream and a First Exploration for Handling Cinema Events Create a new Stream. The name is not crucial. The Source Type should be REST.
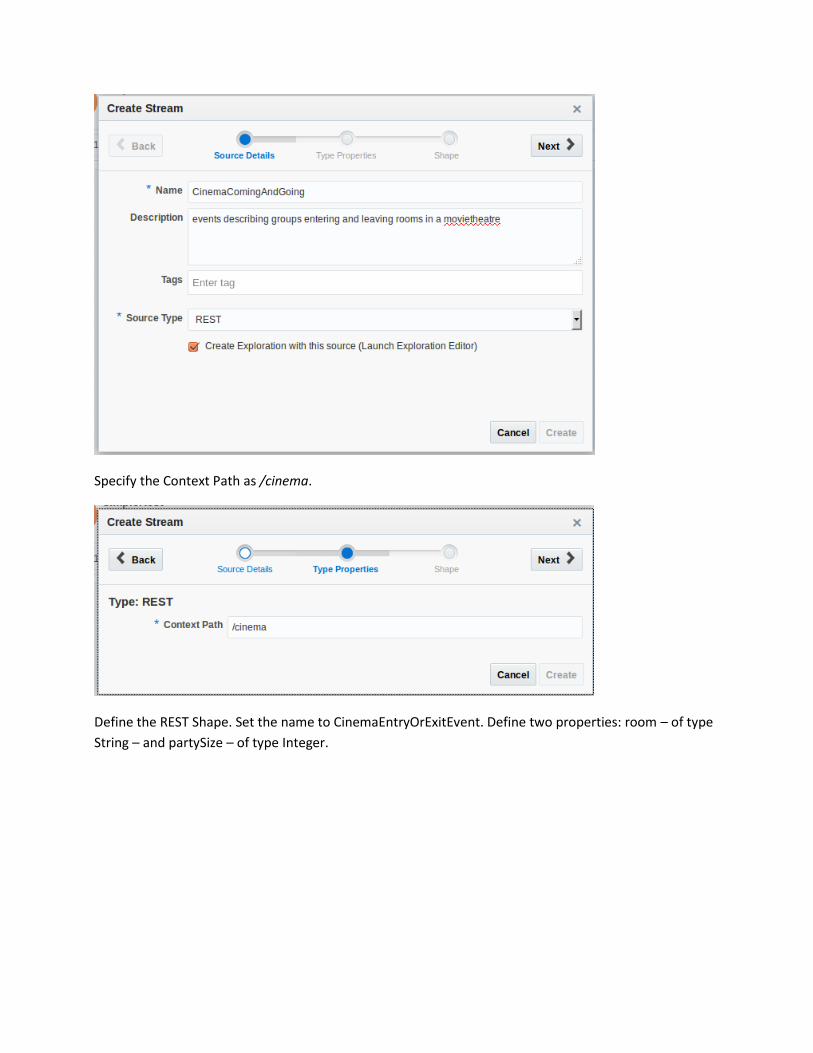
Specify the Context Path as /cinema.
Define the REST Shape. Set the name to CinemaEntryOrExitEvent. Define two properties: room – of type
String – and partySize – of type Integer.
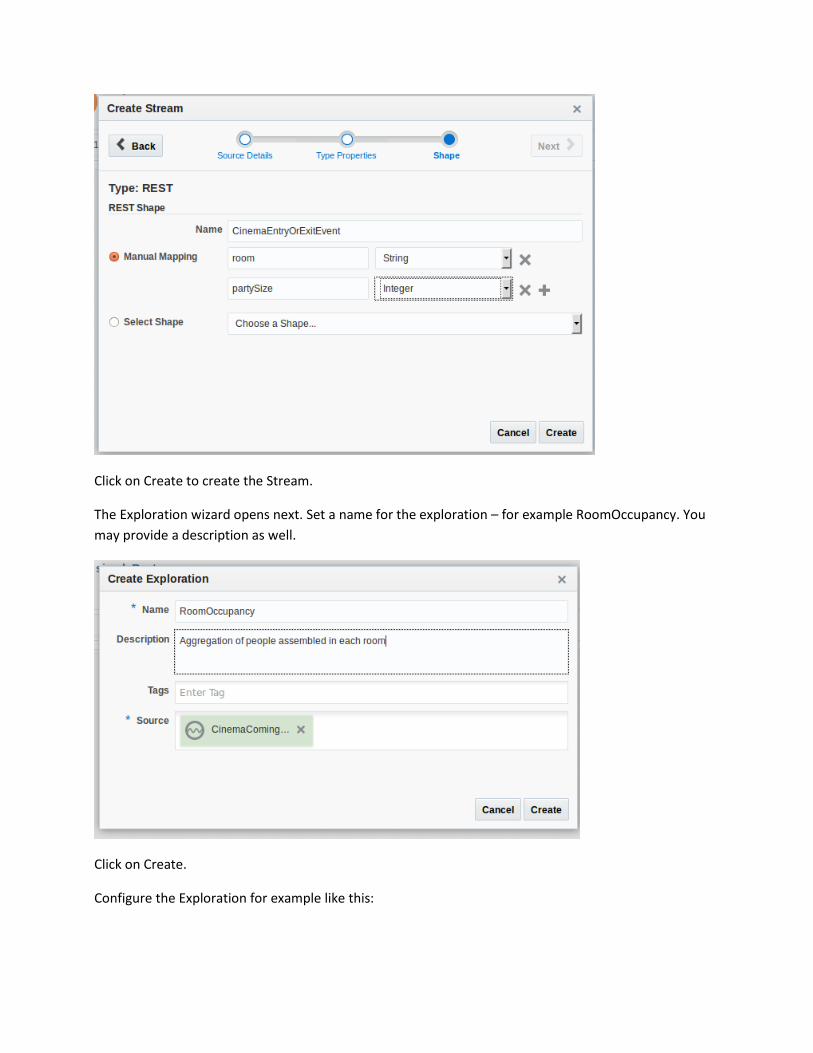
Click on Create to create the Stream.
The Exploration wizard opens next. Set a name for the exploration – for example RoomOccupancy. You
may provide a description as well.
Click on Create.
Configure the Exploration for example like this:
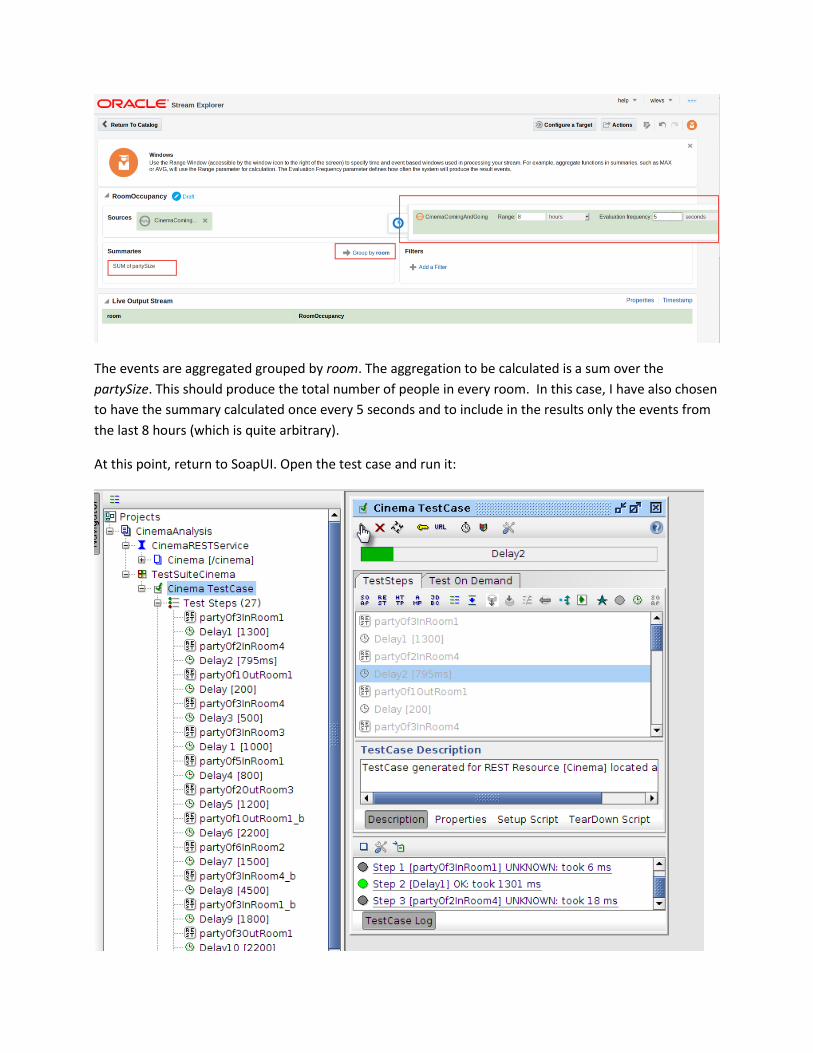
The events are aggregated grouped by room. The aggregation to be calculated is a sum over the
partySize. This should produce the total number of people in every room. In this case, I have also chosen
to have the summary calculated once every 5 seconds and to include in the results only the events from
the last 8 hours (which is quite arbitrary).
At this point, return to SoapUI. Open the test case and run it:

The exploration should start reporting its findings:
Feel free to edit the test case in SoapUI, influencing the data fed into StreamExplorer. By running the test
case again [and again] from SoapUI, you can keep the events flowing into the stream and exploration.
Enrich the Movie Theater Findings Configure a new Reference called MovieDetails based on table Movies:
Note: we can leverage the Data Source that was set up in the previous section.
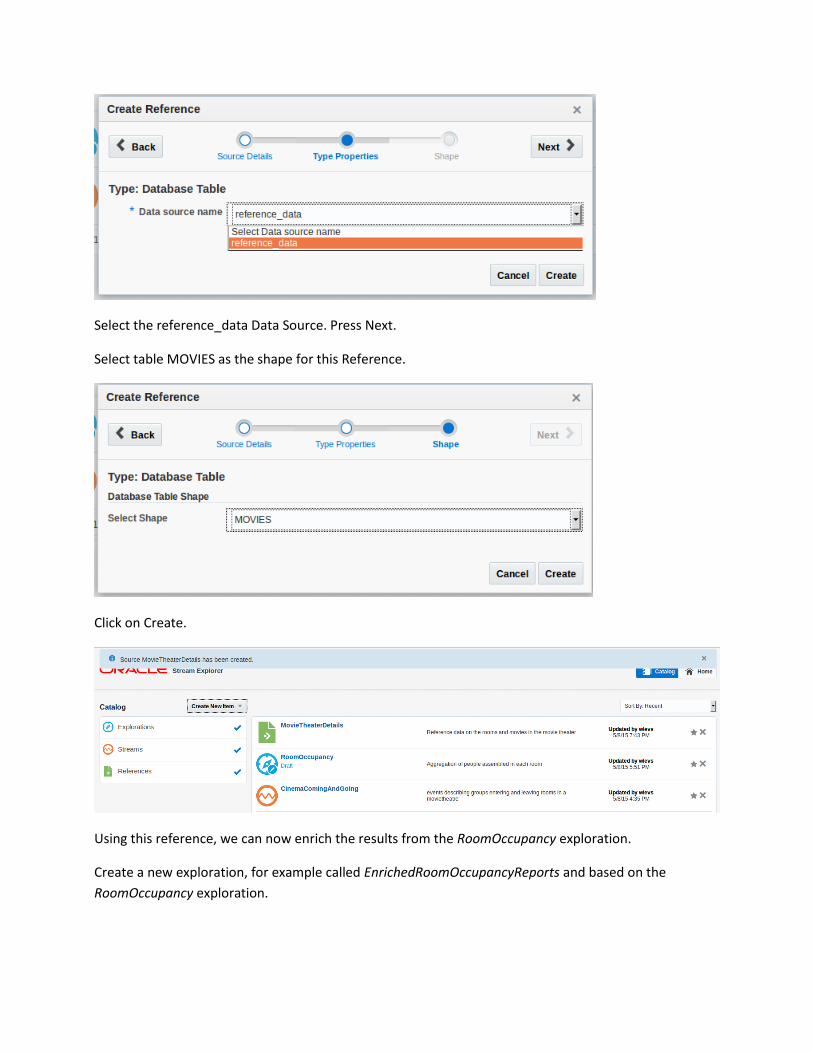
Select the reference_data Data Source. Press Next.
Select table MOVIES as the shape for this Reference.
Click on Create.
Using this reference, we can now enrich the results from the RoomOccupancy exploration.
Create a new exploration, for example called EnrichedRoomOccupancyReports and based on the
RoomOccupancy exploration.

Click on the sources area and add the MovieTheaterDetails reference.
Next, define the correlation between the two sources in this exploration – based on the room:
After configuring the correlation, run the test case in SoapUI to push some events into the Stream
Explorer. Check whether the results in this exploration are enriched alright:

You may want edit the properties, for a better result in the Live Output Stream.
You may also want to configure a target – for example a CSV file – to somehow publish the results from
this exploration.

4. Publish Events from PL/SQL in the Database [to a REST Service] Publishing events to a REST service is easy to today from within many environments. All it takes is
sending an HTTP request – and that is something we can easily do from JavaScript, Java, SOA Suite and
also from PL/SQL.
We will look now at how events can be pushed to a REST service from PL/SQL running in the Oracle
Database 11gR2 XE in the hands-on VM. A PL/SQL procedure publish_cinema_event will be created, after
we have made some preparations as DBA concerning network security.
Open the file publishEventsFromDatabase.txt.
The file contains a section to be executed as SYS in order to allow database user WC to call out through
UTL_HTTP to localhost at port 9002. Note: these actions are already performed.
Next, a PL/SQL procedure is created that takes a room identifier, a party size and an optional waiting
time (in seconds). This procedure creates the JSON message and sends it to the
http://localhost:9002/cinema REST resource as a POST request. Note: this procedure is also already
created.
Finally, the procedure can be invoked once or multiple times to push events to the StreamExplorer
stream – just like we have done from SoapUI. Statements such as:
begin
publish_cinema_event(‘1’, 3);
end;
suffice to publish an event to the REST service exposed by the Stream Explorer stream. This event tells
the story of 3 people entering room 1. The next PL/SQL fragment corresponds roughly to the SoapUI test
case – with the 3rd parameter the delay in seconds before pushing the event.
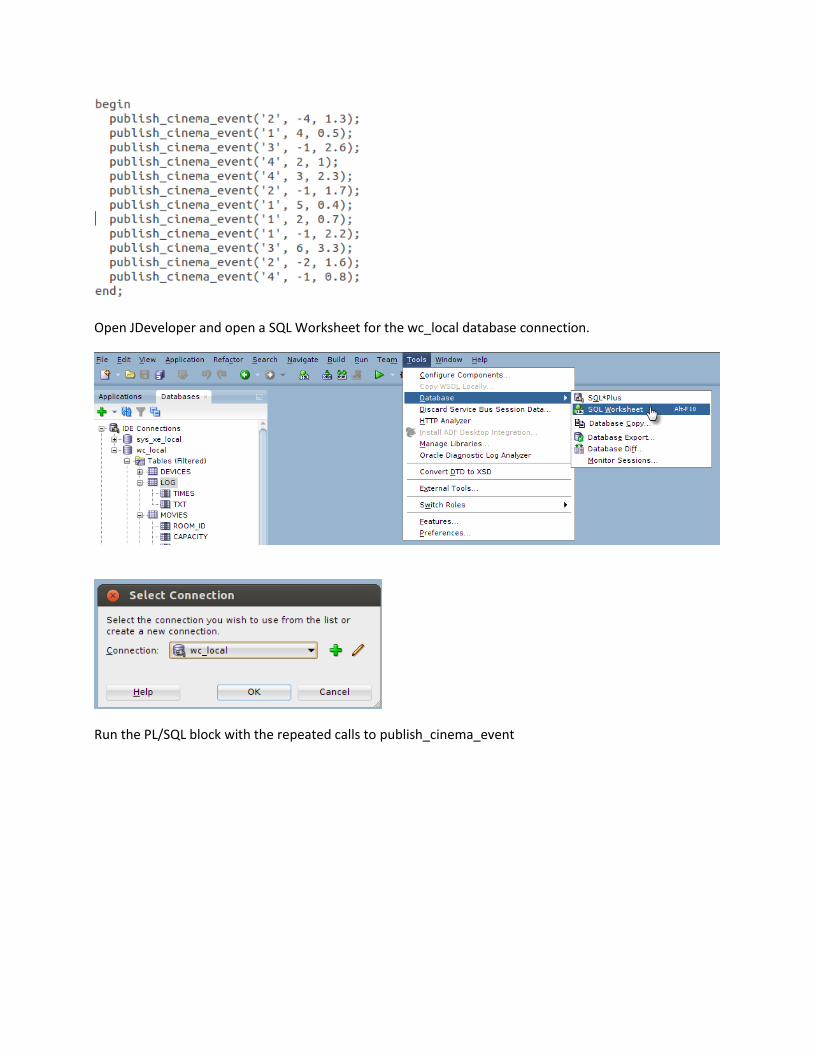
Open JDeveloper and open a SQL Worksheet for the wc_local database connection.
Run the PL/SQL block with the repeated calls to publish_cinema_event
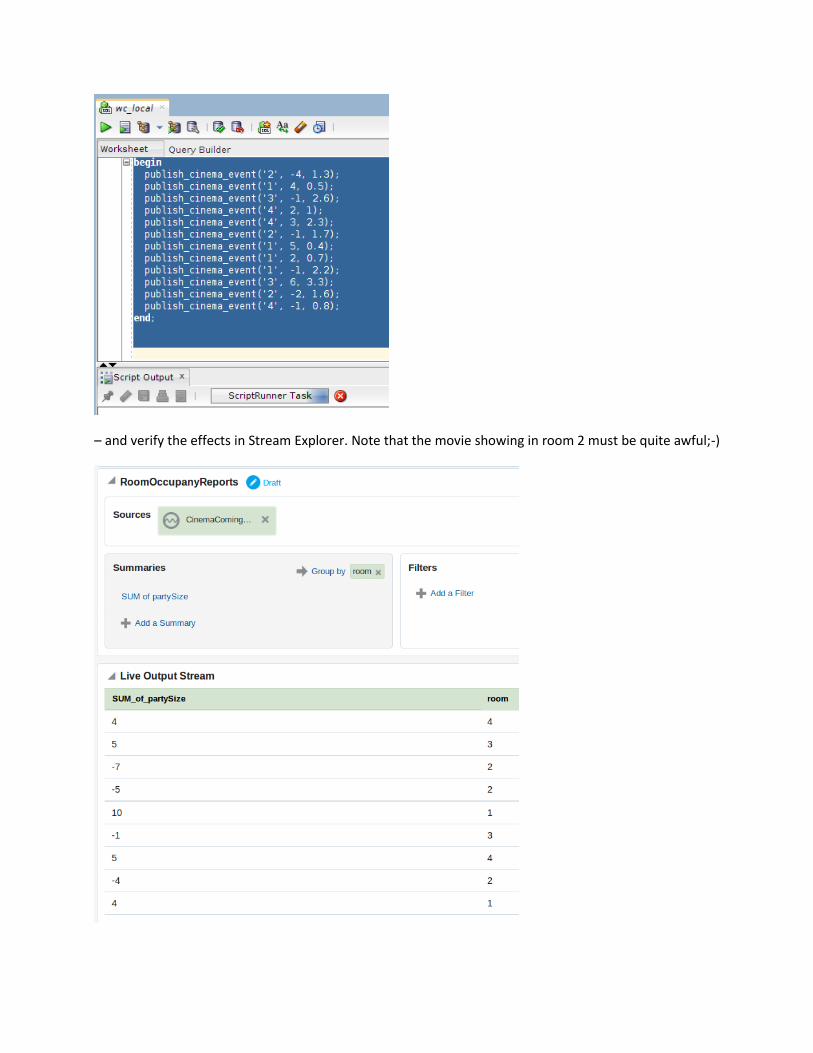
– and verify the effects in Stream Explorer. Note that the movie showing in room 2 must be quite awful;-)

Feel free to experiment with the parameters in PL/SQL calls to simulate a different spread of people over
the rooms in the theater.
5. Publish Exploration Outcomes to a REST Service Findings from Stream Explorer explorations can be published to a CSV file as we have seen. This is not
often useful, as CSV files are not really an appropriate mechanism in a real time environment. Other,
more useful publication channels include JMS, EDN and HTTP Channel (for consumption by Dojo based
Web Applications directly from a browser).
We will next look at a yet another way of publishing findings from an SX exploration: push to a REST
service. This service can be implemented in a number of ways – that does not concern StreamExplorer.
In this case we will use an implementation in a Java Servlet (JAX-RS). Alternatives are a SOA Suite service
or even a Stream Explorer application with a REST based input stream.
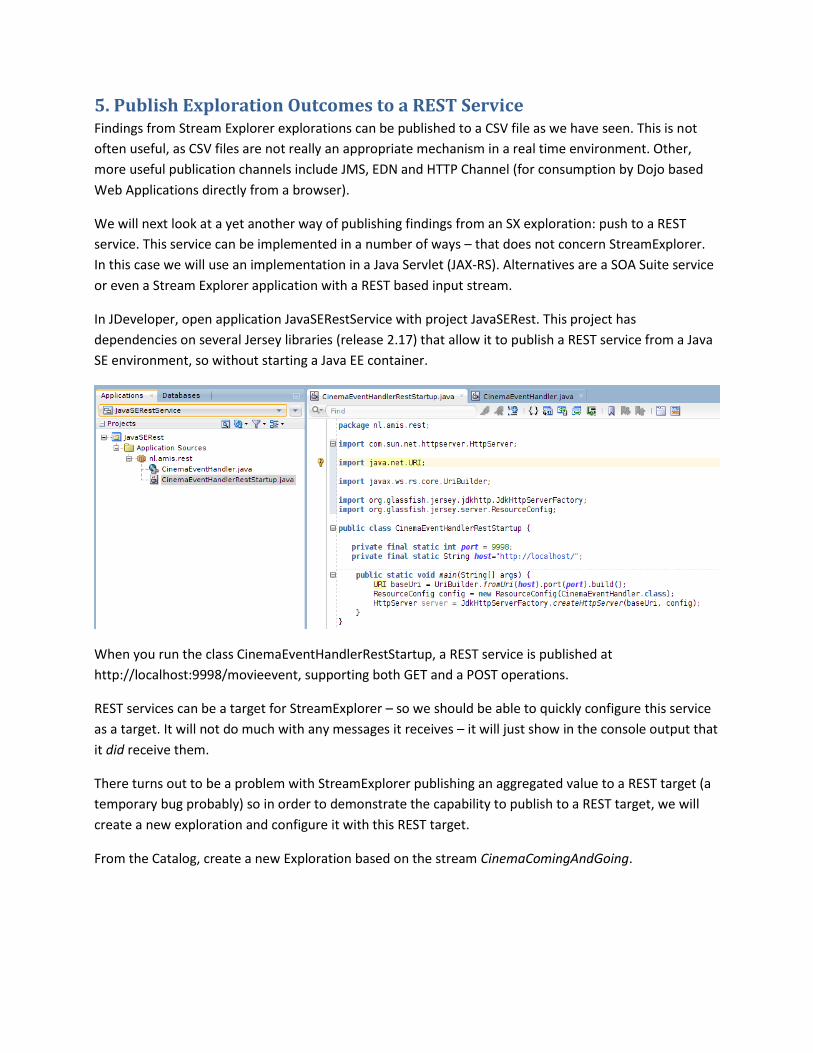
In JDeveloper, open application JavaSERestService with project JavaSERest. This project has
dependencies on several Jersey libraries (release 2.17) that allow it to publish a REST service from a Java
SE environment, so without starting a Java EE container.
When you run the class CinemaEventHandlerRestStartup, a REST service is published at
http://localhost:9998/movieevent, supporting both GET and a POST operations.
REST services can be a target for StreamExplorer – so we should be able to quickly configure this service
as a target. It will not do much with any messages it receives – it will just show in the console output that
it did receive them.
There turns out to be a problem with StreamExplorer publishing an aggregated value to a REST target (a
temporary bug probably) so in order to demonstrate the capability to publish to a REST target, we will
create a new exploration and configure it with this REST target.
From the Catalog, create a new Exploration based on the stream CinemaComingAndGoing.

Then run either the SoapUI test case or the PL/SQL script to have some cinema events published. Verify
that these events lead to results in the new exploration.
Next, click on Configure a Target. Select REST as the target type

and set the resource URL to http://localhost:9998/movieevent .
Click on Finish. Next, publish the Exploration.

Then: either run the SoapUI test case or the PL/SQL script. New rows should appear in the Live Output
Stream and output should appear in the log window in JDeveloper, showing the reception by the REST
service of the messages sent from the exploration.
For example the SoapUI test case publishing to Stream Explorer results in the following outcome in the
Java REST service:
In preparation for the next practice, please also configure this REST service as the target for the
exploration EnrichedRoomOccupancyReports. At the present, this will not actually work correctly as a
result of the naming of property SUM_of_partySize. In practice 6 we will address this problem.
Send Events from Java REST Service to PL/SQL
One of the things we could do from the CinemaEventHandler is pass events to the database. From Java
there is of course the option of using JDBC to talk to a database. However, let’s use HTTP as our protocol.
Using MOD_PLSQL – see the script restFulPLSQLJSON.sql in the StreamExplorer_Handson folder
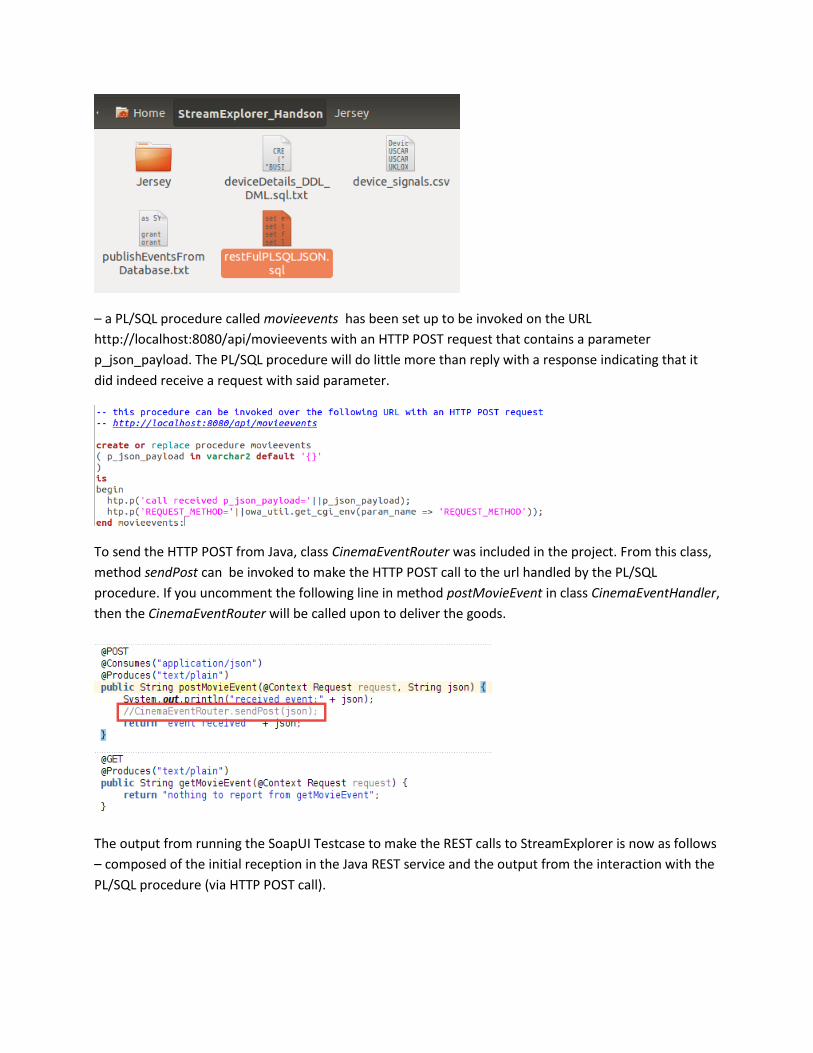
– a PL/SQL procedure called movieevents has been set up to be invoked on the URL
http://localhost:8080/api/movieevents with an HTTP POST request that contains a parameter
p_json_payload. The PL/SQL procedure will do little more than reply with a response indicating that it
did indeed receive a request with said parameter.
To send the HTTP POST from Java, class CinemaEventRouter was included in the project. From this class,
method sendPost can be invoked to make the HTTP POST call to the url handled by the PL/SQL
procedure. If you uncomment the following line in method postMovieEvent in class CinemaEventHandler,
then the CinemaEventRouter will be called upon to deliver the goods.
The output from running the SoapUI Testcase to make the REST calls to StreamExplorer is now as follows
– composed of the initial reception in the Java REST service and the output from the interaction with the
PL/SQL procedure (via HTTP POST call).

6. Refine Stream Explorer application as OEP project in JDeveloper At the present, StreamExplorer has a number of shortcomings that limit its usefulness. We cannot for
example perform any calculations, derive or manipulate the value of properties or leverage built in
functions. The built in patterns are handy, but only when there is a direct fit. There is no way for us in
StreamExplorer to manipulate the CQL that is behind the pattern, to make it appropriate for our use
case.
StreamExplorer as it turns out is [just] a pretty face on top of Oracle Event Processor. By creating streams
and explorations in the StreamExplorer browser based user interface we are actually creating OEP
projects that consist of adapters, channels and processors using [fairly simple] CQL queries. And we can
export these OEP project from StreamExplorer and subsequently import them into JDeveloper – the IDE
for OEP 12c – to fine tune them to our particular need.
Continuing from the MovieTheater example discussed in the previous two sections, we can now add the
logic to spot rooms in the theater that are close to filling up (occupancy > 90%) so we can take
appropriate action. Note that StreamExplorer at the present does not allow us to check for 90%
occupancy unless we resort to tricks such as create a (Virtual) Column in the MOVIES table that contains
the value for 90% occupancy and use it in a filter on the exploration.
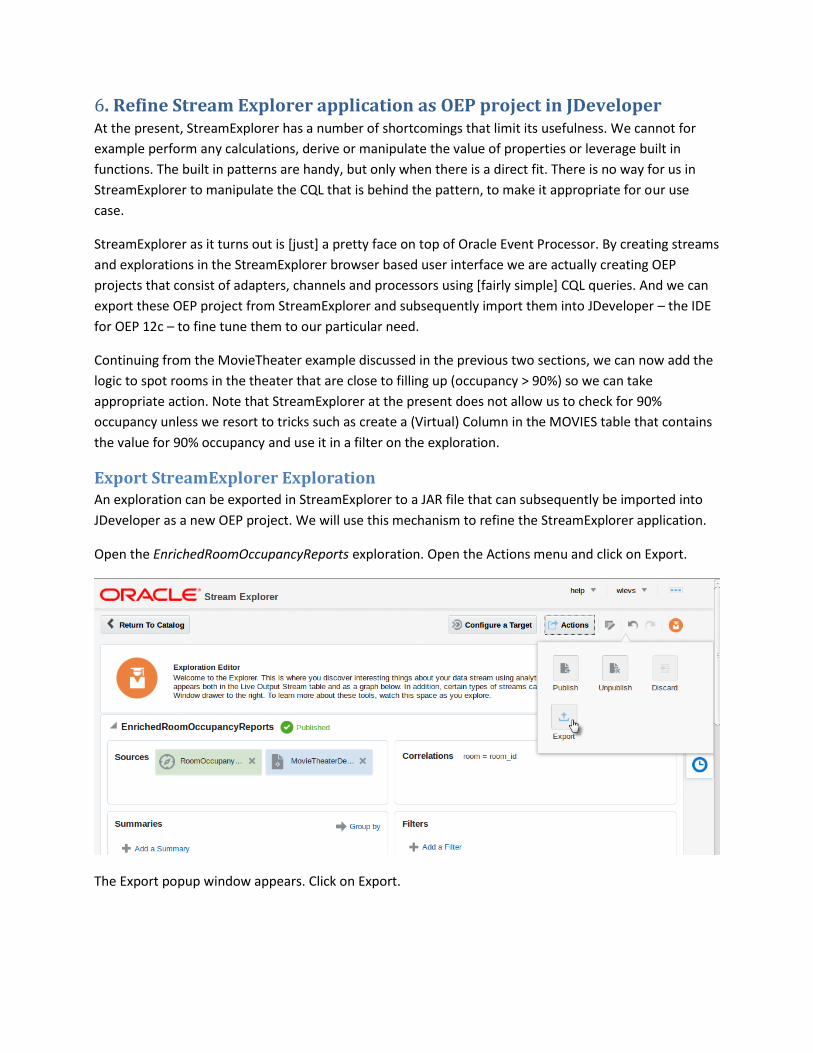
Export StreamExplorer Exploration An exploration can be exported in StreamExplorer to a JAR file that can subsequently be imported into
JDeveloper as a new OEP project. We will use this mechanism to refine the StreamExplorer application.
Open the EnrichedRoomOccupancyReports exploration. Open the Actions menu and click on Export.
The Export popup window appears. Click on Export.

The browser’s file download dialog appears.
Click on OK to save the Jar file.
Import OEP bundle into JDeveloper Return to JDeveloper. Create a new OEP application.

Click Finish.
The Project1 that is created by default can be deleted. We do not need it.
Click on File | Import
we ge
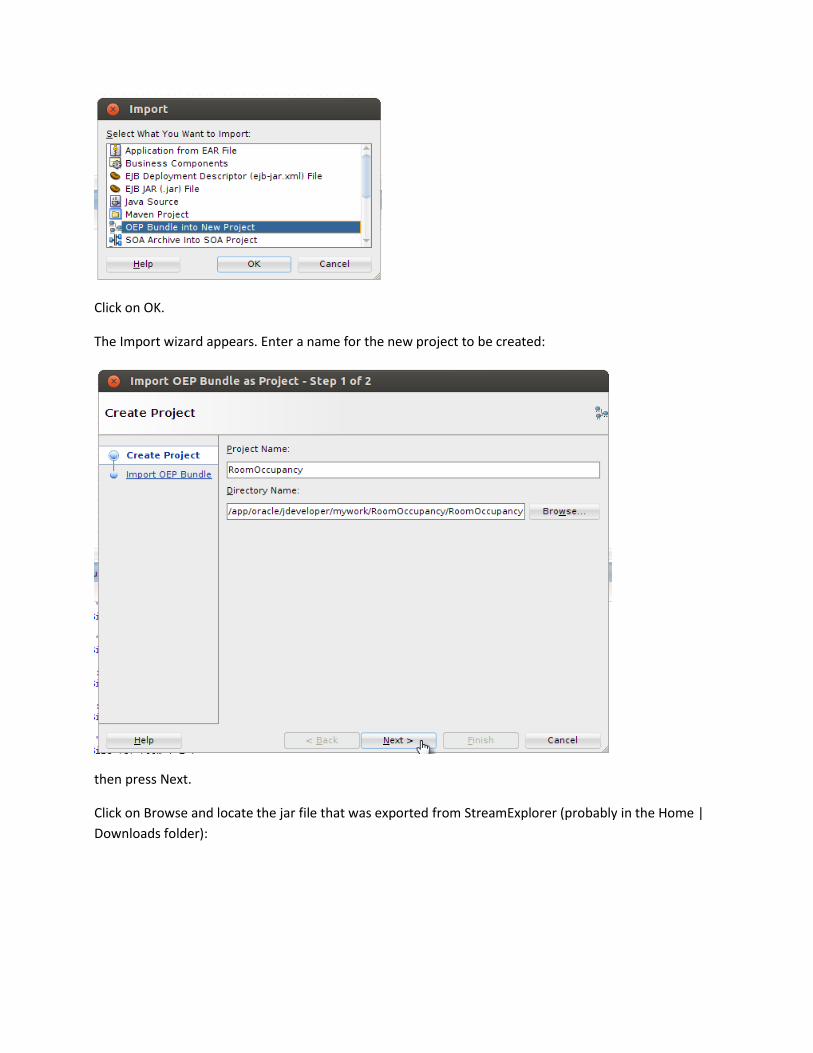
Click on OK.
The Import wizard appears. Enter a name for the new project to be created:
then press Next.
Click on Browse and locate the jar file that was exported from StreamExplorer (probably in the Home |
Downloads folder):

Press Open, then press Finish.
A new OEP project is created from the sources in the jar file:
This project contains the sources that were created through our manipulations in the StreamExplorer
GUI. In the EPN (the visual Event Processing Network) it is easy to see the inbound rest adapter that
together with the first channel and processor (convertor) is based on the Stream definition in
StreamExplorer. The second channel and processor processor_1 represent the first exploration – the one
that aggregates the party sizes. The Movies cache is based on the Reference that was created for the
MOVIES database table. The second processor is created for the EnrichedRoomOccupancyReports

exploration and the final channel and outbound rest adapter are created from the target was that
configured for this exploration.
Open file config.xml to inspect the CQL queries that were generated by StreamExplorer:
The first one performs the aggregation, the second one the enrichment (based on the correlation or join
between two channels).
We can change the logic of the second processor to have it produce only events in case the aggregated
number of people in the room (sum_of_partySize) is larger than 90% of the room capacity – a piece of
processing logic we currently cannot define through the StreamExplorer UI.
First however, we have to correct the results of an unfortunate characteristic of StreamExplorer – the
naming of the property SUM_of_partySize. This name is not conform bean property naming standards
and as such causes several problems including our inability to publish the outcomes from the
(Enriched)RoomOccupancy to either CSV file or REST service.
In the file config.xml please replace every occurrence of SUM_of_partySize with sum_of_partySize. Do
the same in the file context.xml. Finally, edit the Java Class that was generated for the event type to be
reported to the outbound REST adapter – probably called something like
sx_7_4_EnrichedRoomOccupancyReports_6. The bean property should be called sum_of_partySize and
the getter and setter methods should be named accordingly, as is shown in the next screenshot.

With these changes, the publication of the outcomes from EnrichedRoomOccupancyReports to the REST
service will now be successful. Before we go an deploy the OEP project, let’s first add a little bit of CQl
logic.
Open file config.xml as shown below. Add the following line to the Where clause of the CQL query of
processor processor:
and p105.sum_of_partySize > 0.9 * p104.capacity
Note: the alias p105 and p104 could be different in your particular case.
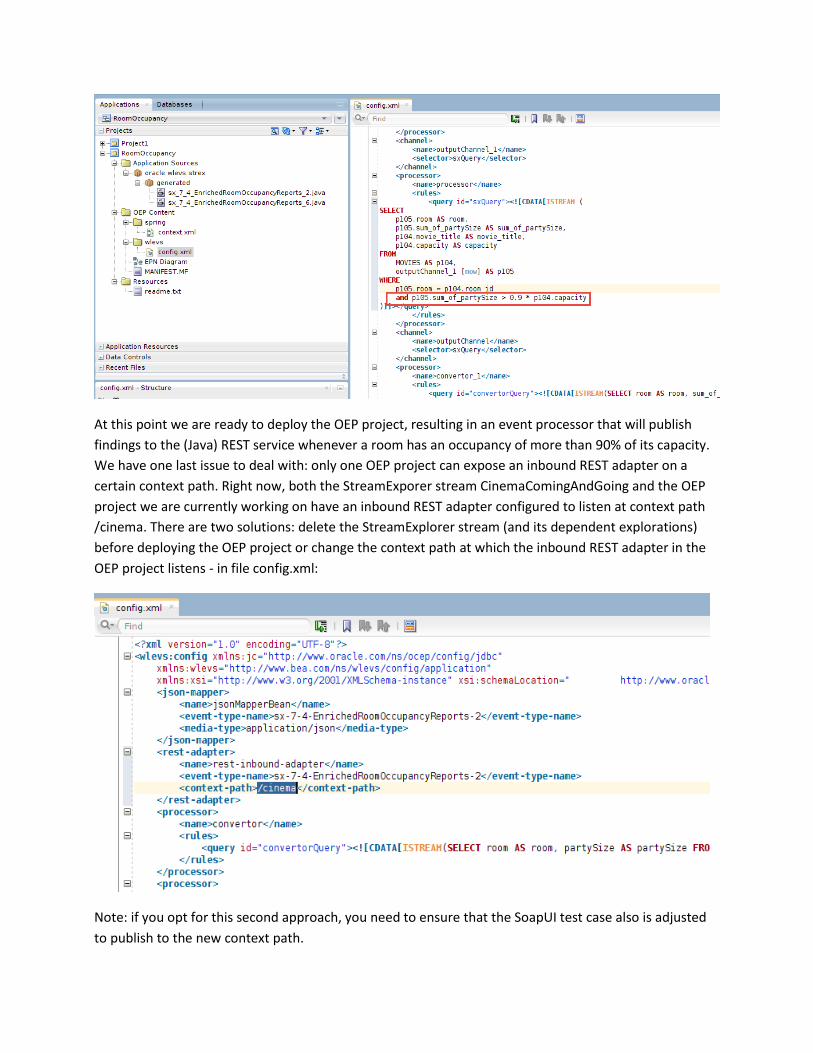
At this point we are ready to deploy the OEP project, resulting in an event processor that will publish
findings to the (Java) REST service whenever a room has an occupancy of more than 90% of its capacity.
We have one last issue to deal with: only one OEP project can expose an inbound REST adapter on a
certain context path. Right now, both the StreamExporer stream CinemaComingAndGoing and the OEP
project we are currently working on have an inbound REST adapter configured to listen at context path
/cinema. There are two solutions: delete the StreamExplorer stream (and its dependent explorations)
before deploying the OEP project or change the context path at which the inbound REST adapter in the
OEP project listens - in file config.xml:
Note: if you opt for this second approach, you need to ensure that the SoapUI test case also is adjusted
to publish to the new context path.

For example:
update context path in OEP application to /cinemaEventsSink
and adjust SoapUI resource accordingly:
Now let’s deploy the OEP project, with these steps:
Open the context menu for the project node and select Deploy | New Deployment Profile

Select the OEP Project Deployment Profile and click on OK
Accept the default definition of the Deployment Profile and click OK.
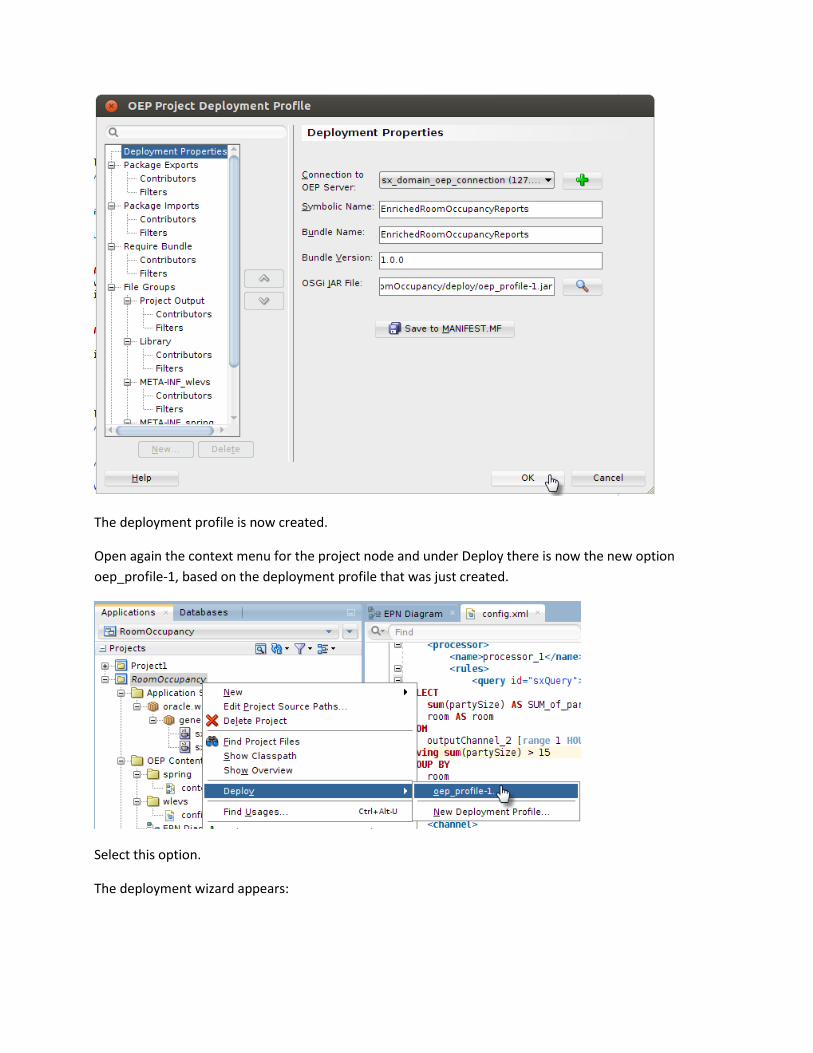
The deployment profile is now created.
Open again the context menu for the project node and under Deploy there is now the new option
oep_profile-1, based on the deployment profile that was just created.
Select this option.
The deployment wizard appears:

Click on Next.
Click on Finish. Deployment will now take place:

The OEP project has been deployed and is ready for action.
Run the SoapUI test case (set to publish JSON messages to the updated context path) and see the results
streaming in to the (Java) REST Service. Note: you may have to adjust the partySize values in the test
case or run the test case multiple times in order to get output in the REST service.
This ouput tells us that both rooms 4 and 2 have an occupancy that is larger than 90% of their capacity.
We also know that rooms 3 and 1 have an occupancy that is lower than 90% of their capacity. By
changing the requests in the test case it is easy to overload room 1 as well:
The effect is visible within a few seconds:

7. Using JMS as Source and Target for Stream Explorer In this section, we will look at the very common interaction between Stream Explorer and JMS. JMS is a
commonly used channel for decoupled exchange of messages or events. Stream Explorer can both
consume messages from a JMS destination (through Stream) and publish findings to a JMS destination
(with a target). The use case we discuss here is about temperature sensors: small devices distributed
over a building, measuring the local room temperature every few seconds and reporting it over JMS. The
Stream Explorer application has to look out for rooms with quickly increasing temperatures and report
those over a second JMS queue.
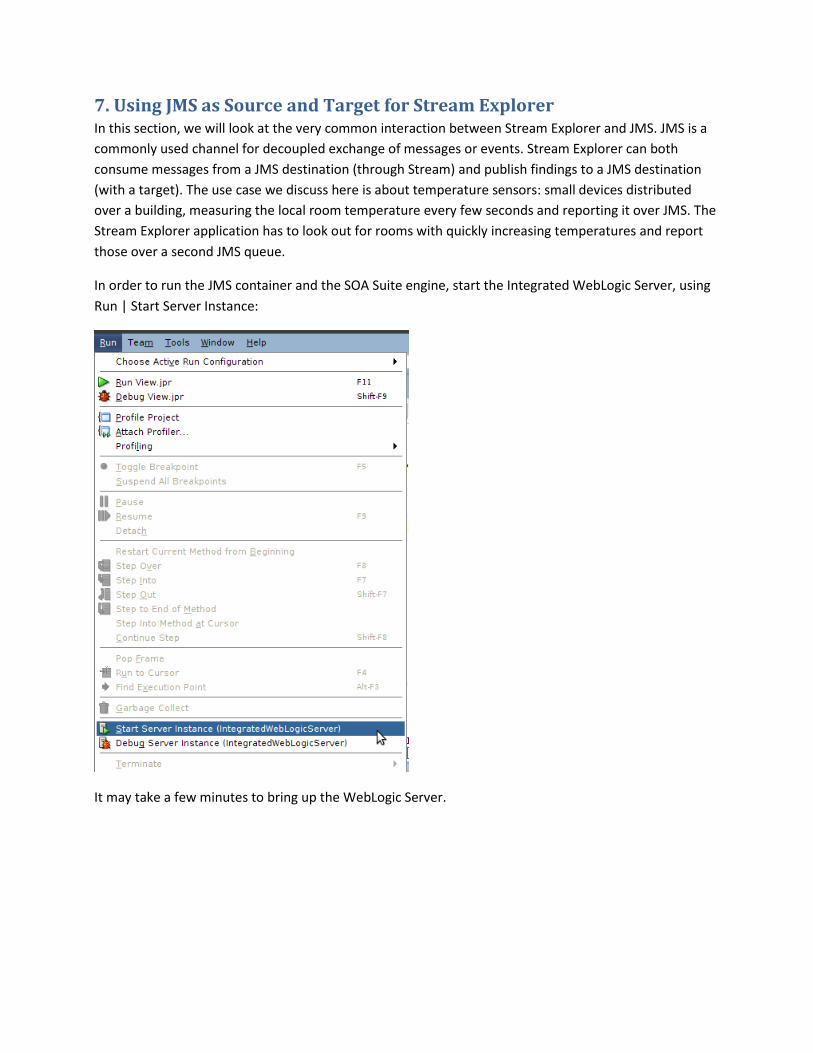
In order to run the JMS container and the SOA Suite engine, start the Integrated WebLogic Server, using
Run | Start Server Instance:
It may take a few minutes to bring up the WebLogic Server.

When the message appears “IntegratedWebLogicServer started”, the server has been started and you
can proceed.
In this WebLogic domain, a number of JMS resources has been configured. For this practice we will use
the queues jndi/temperatureMeasurements and jndi/hotRooms

The JDeveloper application TemperatureMonitoring contains two projects that each contain a single
class. One project is HotRoomAlertProcessor with class HotRoomAlertProcessor that registers as a
listener to the HotRooms queue. Any message received on that queue is reported to the console.
The second project is TemperatureSensors. It contains class TemperatureSensorSignalPublisher. This
class generates temperature values (in Celsius!) for a number of rooms, and publishes these to the
queue temperatureMeasurements. At some random point, the class will start a fire in a randomly
selected room. In this room, temperatures will soon be over 100 degrees.
Our objective in this practice is to read the temperature measurements from the JMS Queue into a
Stream Explorer application, calculate the average value per room and then detect the room on fire. This
hot room should then be reported to the JMS Queue.
Run class TemperatureSensorSignalPublisher to start producing messages on the JMS queue jndi/
temperatureMeasurements.
From the Stream Explorer Catalog page, create a new item of type Stream. Select JMS as the source type.

Press Next.
Configure the URL for the WebLogic domain (http://localhost:7101), the WebLogic Admin’s username
and password (weblogic/weblogic1) and the JNDI Name for the JMS Queue (or Topic): jndi/
temperatureMeasurements

Press Next.
Define a new Shape. The properties in the JMS (Map)Message produced by the Java Class
TemperatureSensorSignalPublisher are called RoomId (of type String) and Temperature (of type Float).
Press Create.
The Exploration editor appears to create an exploration based on the Stream.
Define a Name. Then click on Create.
The temperature measurement events start streaming in:
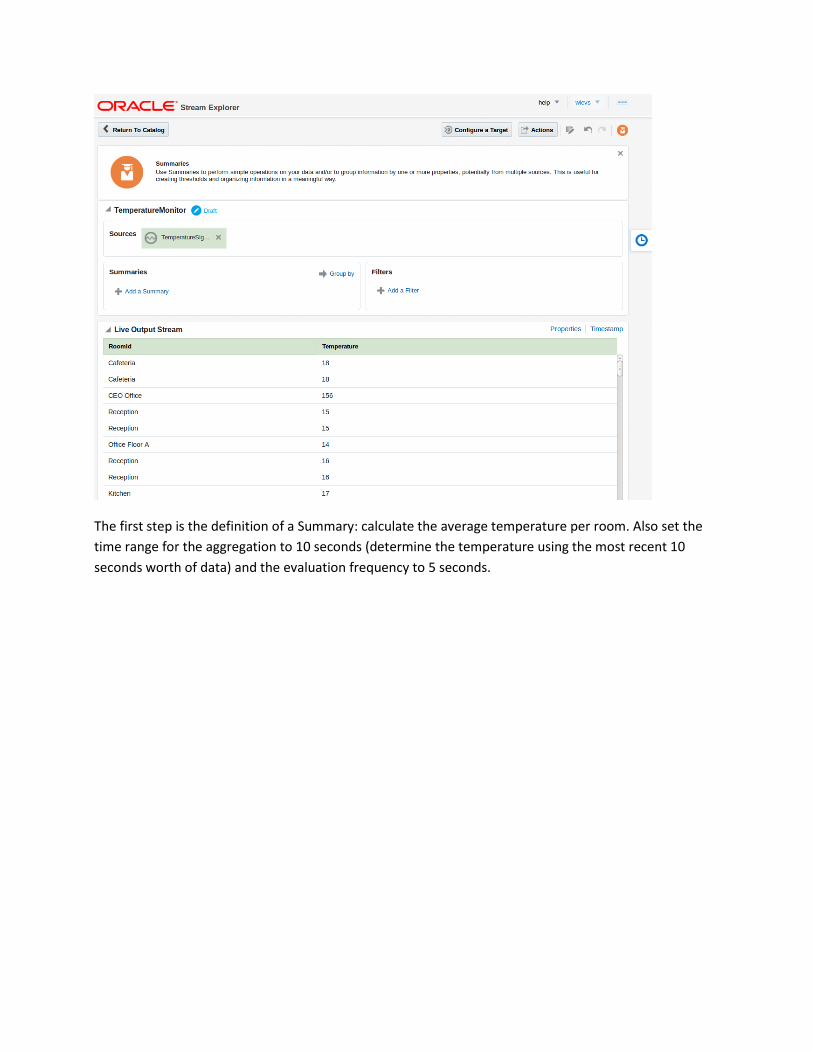
The first step is the definition of a Summary: calculate the average temperature per room. Also set the
time range for the aggregation to 10 seconds (determine the temperature using the most recent 10
seconds worth of data) and the evaluation frequency to 5 seconds.
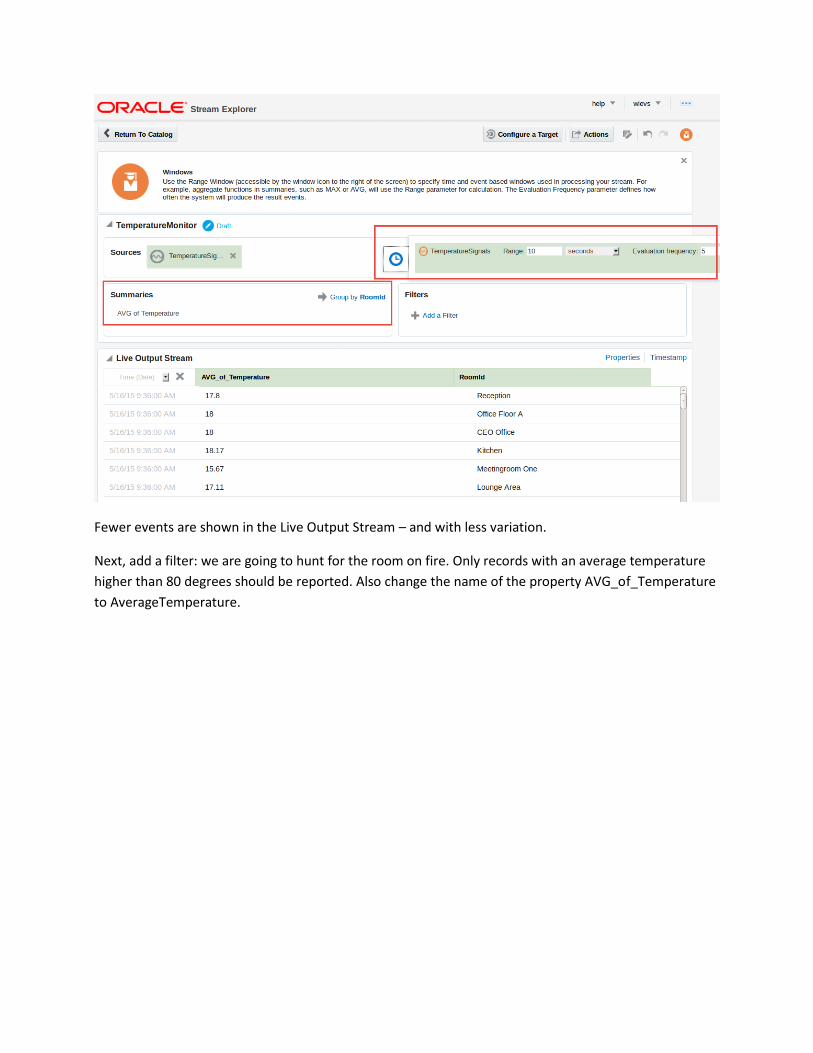
Fewer events are shown in the Live Output Stream – and with less variation.
Next, add a filter: we are going to hunt for the room on fire. Only records with an average temperature
higher than 80 degrees should be reported. Also change the name of the property AVG_of_Temperature
to AverageTemperature.

The screenshot shows that in this case, it is the Cafeteria where there is a fire. If you stop class
TemperatureSensorSignalPublisher and then start it again, it will take some time for it to start a fire
again and when the fire was started, the Live Output Stream will show it.
Finally, click on Configure Target.
Configure a JMS Target, as shown in the figure. The URL is the familiar one (t3://localhost:7101),
username and password are weblogic and weblogic1 and the JNDI Name of the JMS target is
jndi/hotRooms.

Click on Finish. Publish the Exploration.
When there is now a room discovered with temperatures in the hot zone, a message will be published to
the JMS Queue, in the form of a MapMessage with properties RoomId and AverageTemperature.
Stop and start class TemperatureSensorSignalPublisher. Run class HotRoomAlertProcessor to have it
start listening to the jndi/hotRooms queue.
The former writes:
And the latter will report hot rooms by writing a message to the console:
While the Stream Explorer browser interface shows:


8. Integrating with SOA Suite 12c through the Event Delivery Network We assume here that you have started the Integrated WebLogic Server and therefore the SOA Suite 12c
run time environment is up and running.
Two simple SOA Composites have been deployed to the SOA Suite runtime:
The BusinessEventPublisher contains a Mediator that can be invoked to have a very simple EDN event –
operationalEvent - published (that contains one element called payload of type String):
The BusinessEventConsumer also contains a Mediator. This one will consume a different EDN event –
alertEvent. When it does, it invokes a BPEL component that does absolutely nothing.
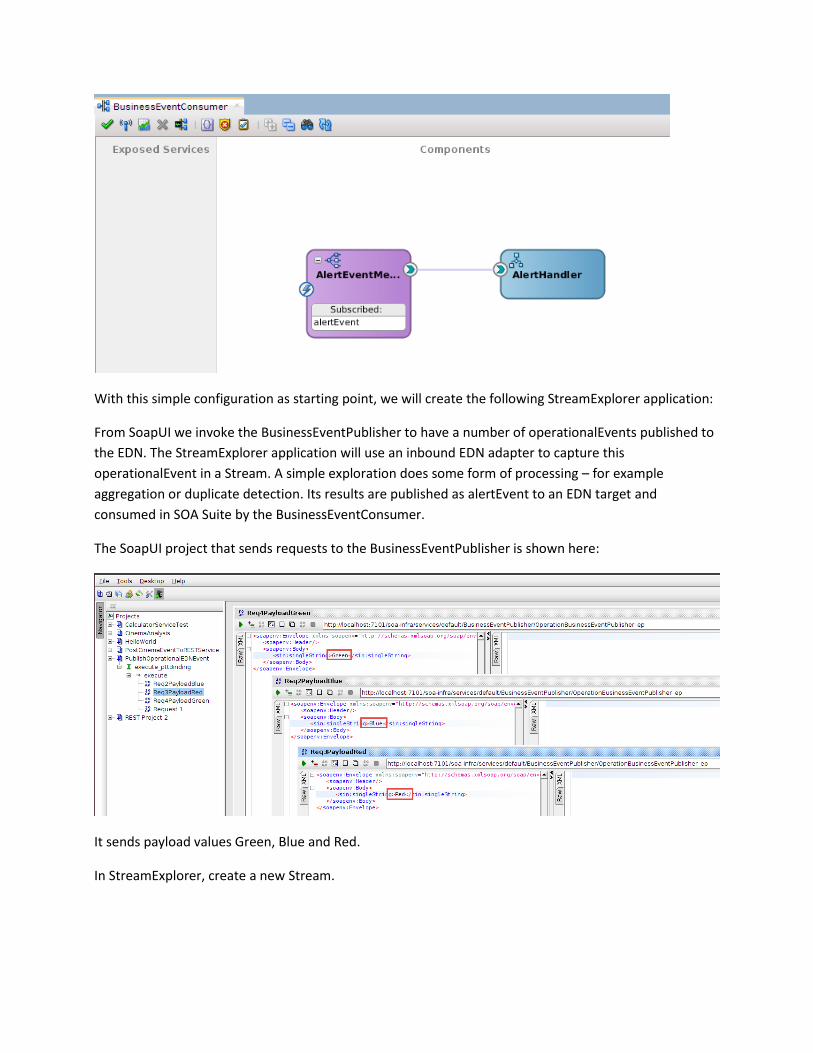
With this simple configuration as starting point, we will create the following StreamExplorer application:
From SoapUI we invoke the BusinessEventPublisher to have a number of operationalEvents published to
the EDN. The StreamExplorer application will use an inbound EDN adapter to capture this
operationalEvent in a Stream. A simple exploration does some form of processing – for example
aggregation or duplicate detection. Its results are published as alertEvent to an EDN target and
consumed in SOA Suite by the BusinessEventConsumer.
The SoapUI project that sends requests to the BusinessEventPublisher is shown here:
It sends payload values Green, Blue and Red.
In StreamExplorer, create a new Stream.
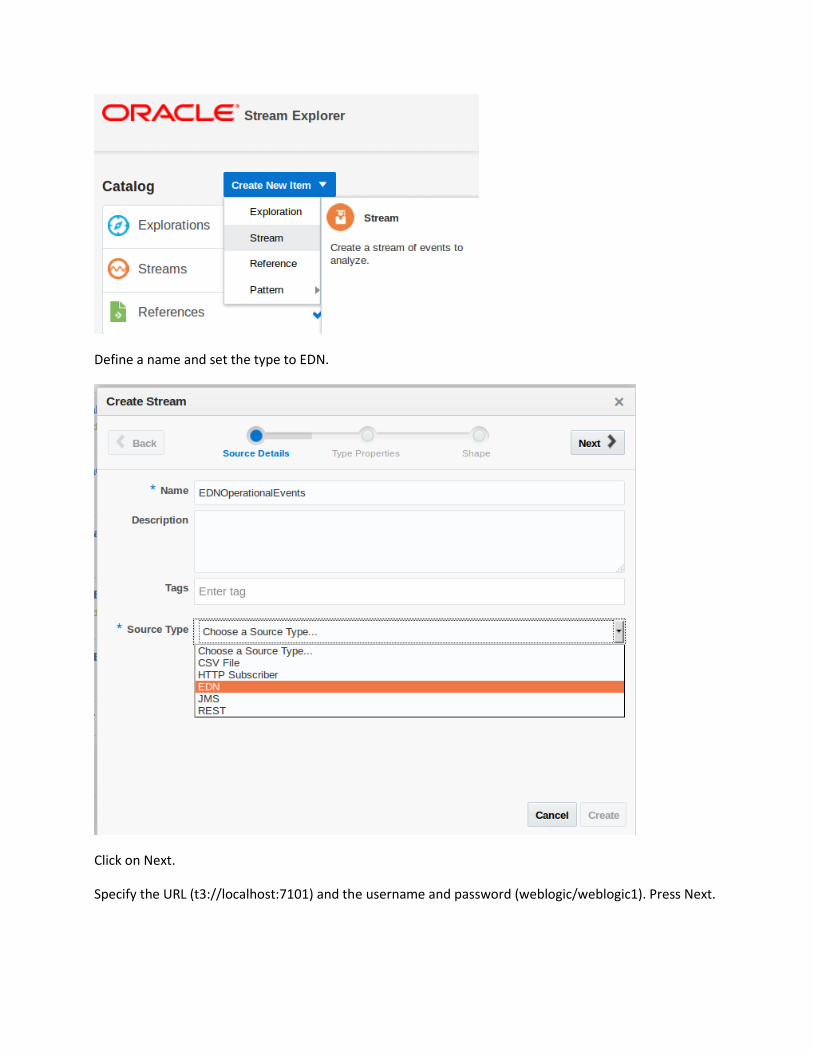
Define a name and set the type to EDN.
Click on Next.
Specify the URL (t3://localhost:7101) and the username and password (weblogic/weblogic1). Press Next.
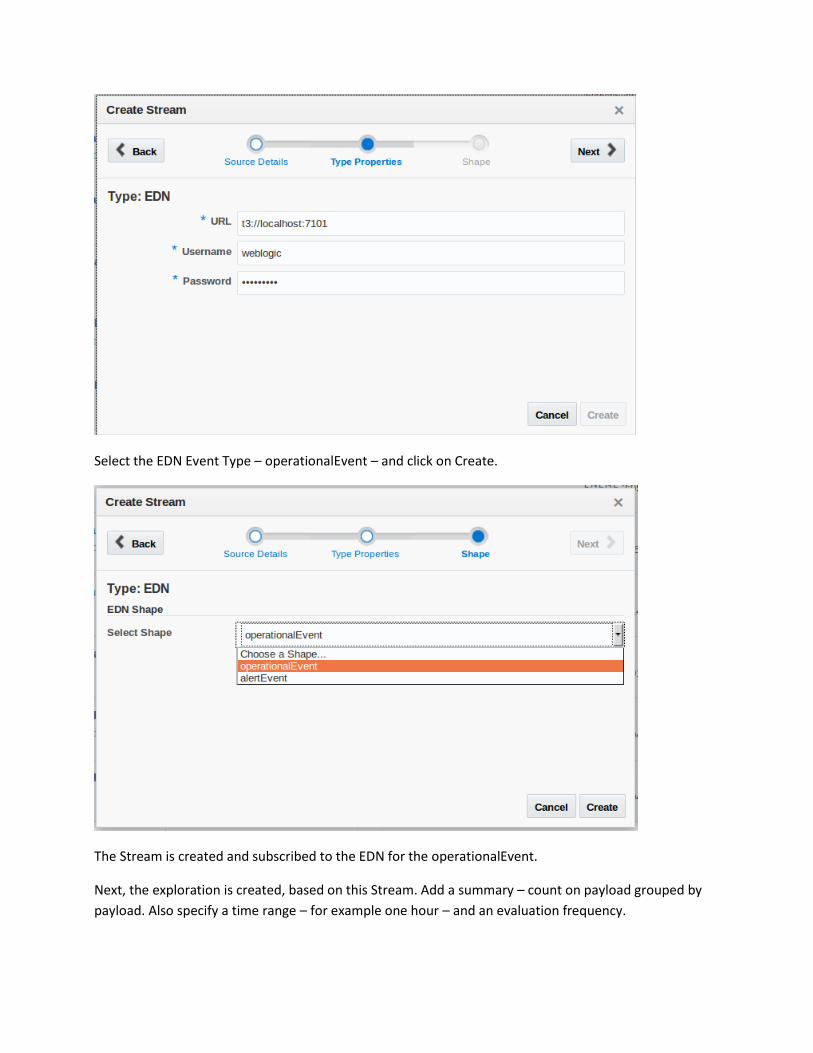
Select the EDN Event Type – operationalEvent – and click on Create.
The Stream is created and subscribed to the EDN for the operationalEvent.
Next, the exploration is created, based on this Stream. Add a summary – count on payload grouped by
payload. Also specify a time range – for example one hour – and an evaluation frequency.

Send some requests to the BusinessEventPublisher composite, for example from SoapUI, to have
operationlEvents published to EDN. These events are consumed by the Stream and reported in
aggregated form by the exploration.
In EM FMW Control, we can see that instances of the BusinessEventPublisher have been created; these
instances were responsible for publishing the EDN events.
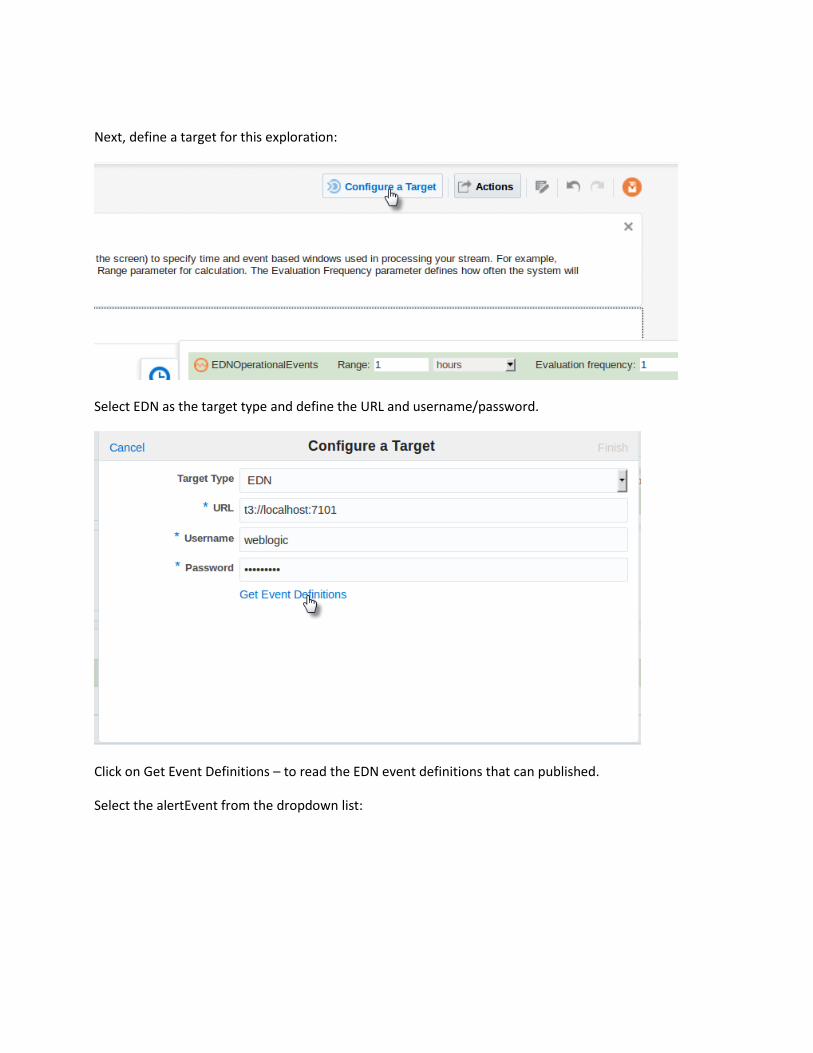
Next, define a target for this exploration:
Select EDN as the target type and define the URL and username/password.
Click on Get Event Definitions – to read the EDN event definitions that can published.
Select the alertEvent from the dropdown list:

Accept the proposed property mapping:
And click on finish.
Finally, publish the exploration:

Return to SoapUI and make a number of calls to the BusinessEventPublisher.
Let’s check the results of these actions in the EM FMW Control; a number of new instances is created of
the BusinessEventConsumer composite.
Drilling down on one of them shows that the instance as started from an EDN alertEvent:

and when we drill down on the BPEL component in this instance, we will find the payload value for this
event:
Clearly we have established a route from EDN to Stream Explorer and from Stream Explorer to EDN for
decoupled interaction between SOA Suite 12c and Stream Explorer (& OEP).
Note: one limitation in V1 of Stream Explorer is that all properties of the EDN event have to be set in an
Exploration’s target mapping in order to have the EDN event successfully published. Additionally, all
elements in the EDN event type definition must have a value for an EDN event to be successfully
consumed by a Stream Explorer stream.
9. SOA Suite Service Execution Monitoring One of the interesting opportunities offered to us by StreamExplorer and OEP is the ability to monitor
the execution of services exposed by SOA Composite applications from SOA Suite. Through such
monitoring we can keep an eye on response times, volume, trends in number of requests, fault
percentage and more business oriented aspects derived from the contents of messages flowing into or
out from service operations.
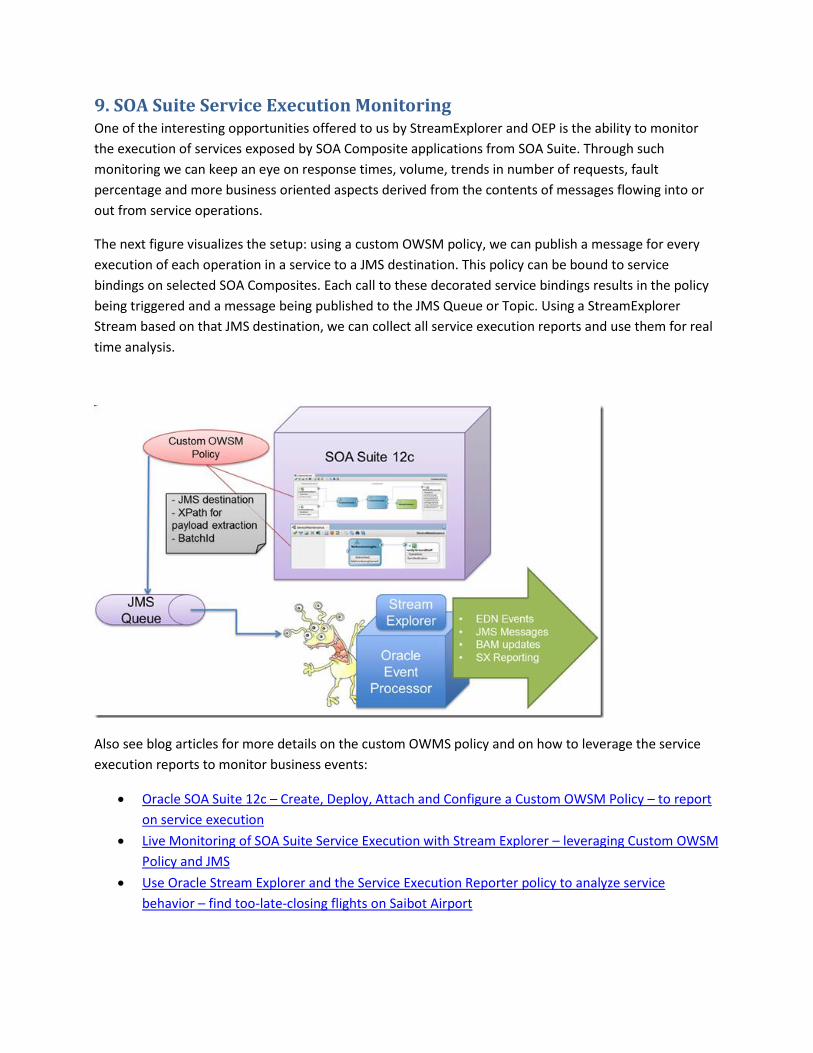
The next figure visualizes the setup: using a custom OWSM policy, we can publish a message for every
execution of each operation in a service to a JMS destination. This policy can be bound to service
bindings on selected SOA Composites. Each call to these decorated service bindings results in the policy
being triggered and a message being published to the JMS Queue or Topic. Using a StreamExplorer
Stream based on that JMS destination, we can collect all service execution reports and use them for real
time analysis.
Also see blog articles for more details on the custom OWMS policy and on how to leverage the service
execution reports to monitor business events:
Oracle SOA Suite 12c – Create, Deploy, Attach and Configure a Custom OWSM Policy – to report
on service execution
Live Monitoring of SOA Suite Service Execution with Stream Explorer – leveraging Custom OWSM
Policy and JMS
Use Oracle Stream Explorer and the Service Execution Reporter policy to analyze service
behavior – find too-late-closing flights on Saibot Airport

Explore the HelloWorld Composite The custom policy is installed in the SOA Suite running in the Integrated WebLogic Server. This has been
done by:
copying the JAR file that holds the relevant Java classes to the DOMAIN_HOME\lib directory
configuring the policy in Enterprise Manager
A binding for the policy has been created for the HelloWorld SOA composite application. This causes
every call to the service exposed by this composite to be reported to the JMS destination. Let’s verify
how this policy binding has been configured.
Select the HelloWorld SOA composite in the default partition:
Click on the HelloWorldService_ep service binding. Open the Policies tab.
You will find the custom policy attached to this service binding:
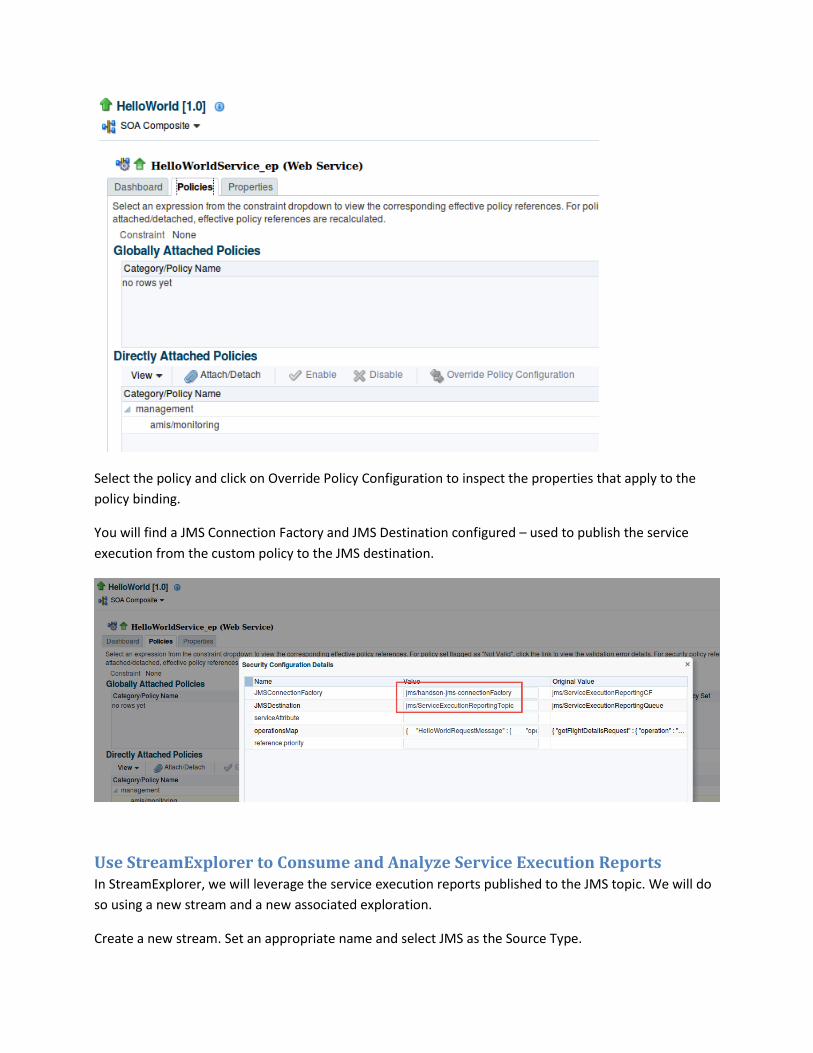
Select the policy and click on Override Policy Configuration to inspect the properties that apply to the
policy binding.
You will find a JMS Connection Factory and JMS Destination configured – used to publish the service
execution from the custom policy to the JMS destination.
Use StreamExplorer to Consume and Analyze Service Execution Reports In StreamExplorer, we will leverage the service execution reports published to the JMS topic. We will do
so using a new stream and a new associated exploration.
Create a new stream. Set an appropriate name and select JMS as the Source Type.
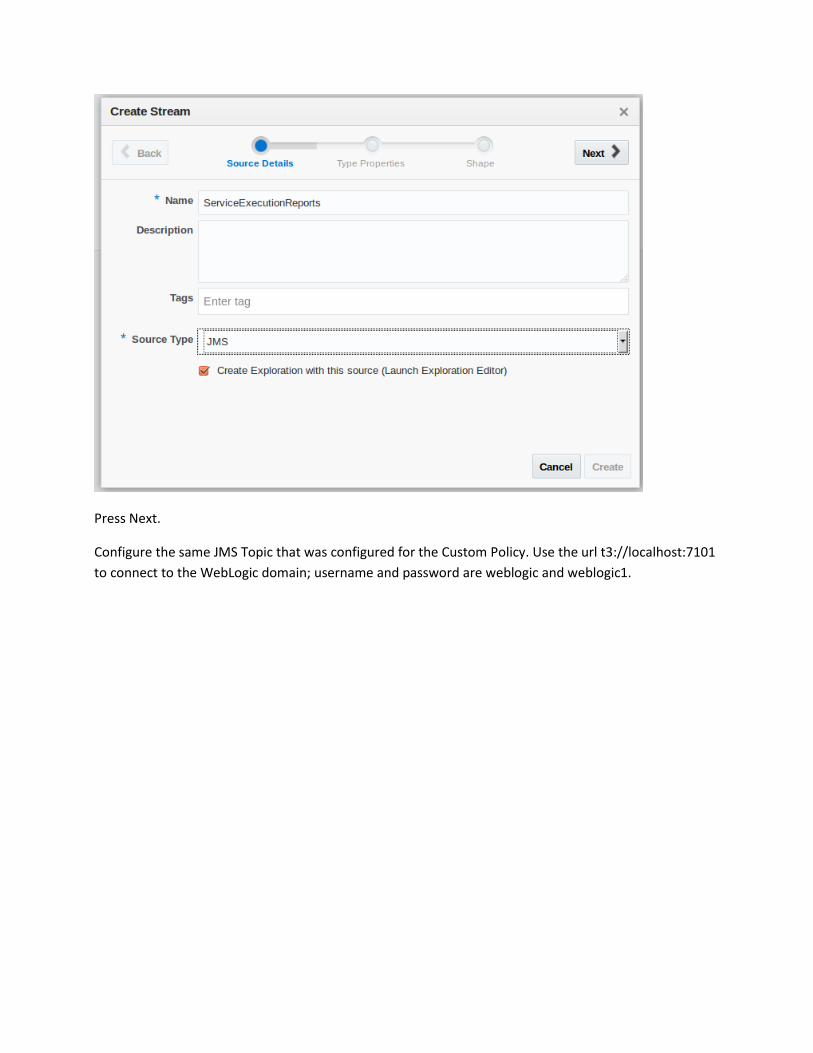
Press Next.
Configure the same JMS Topic that was configured for the Custom Policy. Use the url t3://localhost:7101
to connect to the WebLogic domain; username and password are weblogic and weblogic1.

Press Next.
Configure the shape as shown in the next figure:

Press Create.
The Exploration editor opens. Enter a name:
Press Create.
The Exploration appears.
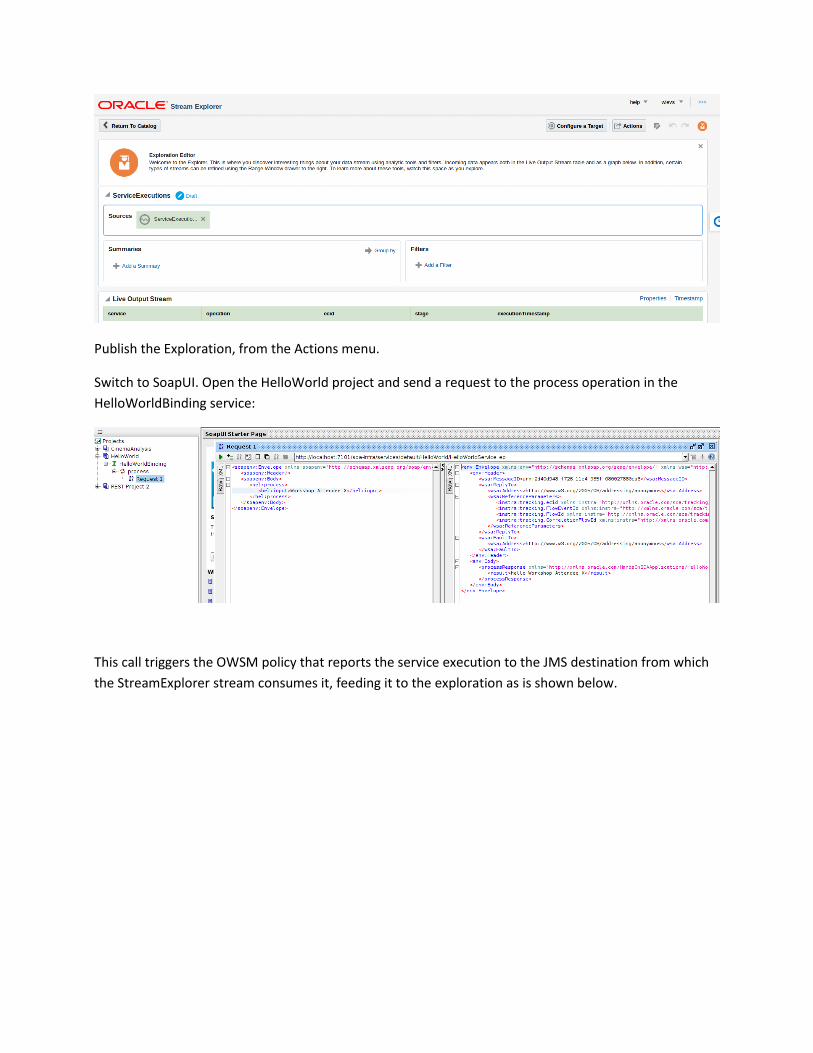
Publish the Exploration, from the Actions menu.
Switch to SoapUI. Open the HelloWorld project and send a request to the process operation in the
HelloWorldBinding service:
This call triggers the OWSM policy that reports the service execution to the JMS destination from which
the StreamExplorer stream consumes it, feeding it to the exploration as is shown below.

Make a few additional calls in SoapUI – to see more results produced in the Exploration.
Create an Exploration to Report the Number of Calls Per Service Operation One step beyond what we have done so far would be an aggregation exploration that reports the
number of calls made to all services and operations. Using StreamExplorer, that is of course easy to
achieve.
New Exploration, using previous as source
Add a Summary: count(ecid) group by service, operation. Add a Range – say one hour. You could play a
little with the evaluation frequency – once per second is pretty often.
Note: now both request and response are included; add a filter to block events with stage equal to
response.
make some calls from SoapUI.

The service calls are counted and reported:
The Calculator Composite added into the mix There is another SOA Composite deployed that also exposes a service that has the policy attached to it:
the Calculator composite. It offers three operations – add, subtract and multiply. SoapUI has a test
project for the service exposed by this composite:
The policy is attached to the service binding in this composite, meaning that every call made from
SoapUI (or any other consumer) to the service results in messages being published to the JMS target and
being consumed by the StreamExplorer application. You may want to briefly inspect this policy
attachment:

Make a few calls to the Calculator service from SoapUI. Verify that StreamExplorer also starts reporting
on these calls:

You can probably come up with some ideas as to how this information about service invocations can be
used in monitoring scenarios – remember that we also have access in Stream Explorer to the timestamps
for start of request [processing] and end of response [creation].
Note: the console for the Integrated WebLogic Server also shows the output from the OWMS Policy:

10. Stream Explorer, Web Socket and Dashboard A common desire when doing real time event processing with Stream Explorer and/or Oracle Event
Processor is the ability to present the findings from Stream Explorer in a live dashboard. This dashboard
should hold a visualization of whatever information we have set up Stream Explorer to find for us – and it
should always show the latest information.
User interfaces are commonly presented in web browsers and created using HTML(5) and JavaScript. As
part of the HTML5 evolution that brought today’s browsers, we now have the ability to use Web Sockets
through which we can push information from server to browser to have the user interface updated
based on messages pushed from the server. This allows us to create a dashboard that listens from the
browser to a Web Socket and use whatever messages appear on the web socket to actualize the user
interface.
We will extend the Stream Explorer application last discussed in section 6 (on events in a movie theater)
(the one that exposes a REST interface to which publish JSON messages). These messages report on
groups of people entering or leaving a specific room in a movie theater.
The exploration we add will aggregate the information from the messages – providing us with a constant
insight in the total number of people in each room. This information is subsequently pushed to the REST
service exposed by a Java EE application that routes that information across the web socket to the
HTML5 client. The next figure illustrates the application architecture

See blog articles https://technology.amis.nl/2015/05/14/java-web-application-sending-json-messages-
through-websocket-to-html5-browser-application-for-real-time-push/ and
https://technology.amis.nl/?p=36008 for background and details.
The steps are:
Open URL http://localhost:7101/CinemaMonitor/CinemaMonitor.html - or use the bookmark in the
browser toolbar. This will show the monitor web application – running in WebLogic, based on the
application CinemaMonitorWebApplication in folder /u01/app/oracle/jdeveloper/mywork.

This monitor connects to a web socket channel at ws://localhost:7101/CinemaMonitor/cinemaSocket
that is exposed by a class in the web application called CinemaEventSocketMediator.
The same web application also publishes a REST service. The JSON payload for any POST message sent to
http://localhost:7101/CinemaMonitor/resources/cinemaevent will be forwarded to the WebSocket
channel and from CinemaEventSocketMediator also to the web client.
Open SoapUI. Use the PostCinemaEventToRESTService project to make some test calls to this REST
service.
After posting one or more requests from SoapUI, the monitor will show the latest numbers received:

Note: after a period of idleness, the web socket channel may time out. That is currently not visible in the
Cinema Monitor. If you have the impression that the dashboard is not updated although it really should,
please reload the web page in the your browser to create a fresh web socket connection.
The next step is to create a StreamExplorer exploration that uses the same incoming events about
parties entering or leaving the rooms in the theater that we used before and turns them into summation
messages that are forwarded to the REST service called from SoapUI. That exploration will then start
feeding the live dashboard Cinema Monitor.
Create an exploration, for example called CinemaExploration. Create a Summary of type SUM based on the property partySize and group by room. Edit the Properties and change the name of property SUM_of_partySize to occupation. The exploration will look like this:
Next, click on Configure a Target.

Select type REST and set the URL
Click on Finish.
Publish the Exploration.
Now we can run a test case in SoapUI to send test messages to the Stream Explorer application:

Here is what the live output stream in the Stream Explorer UI shows next to a screenshot taken of the Cinema Monitor dashboard:
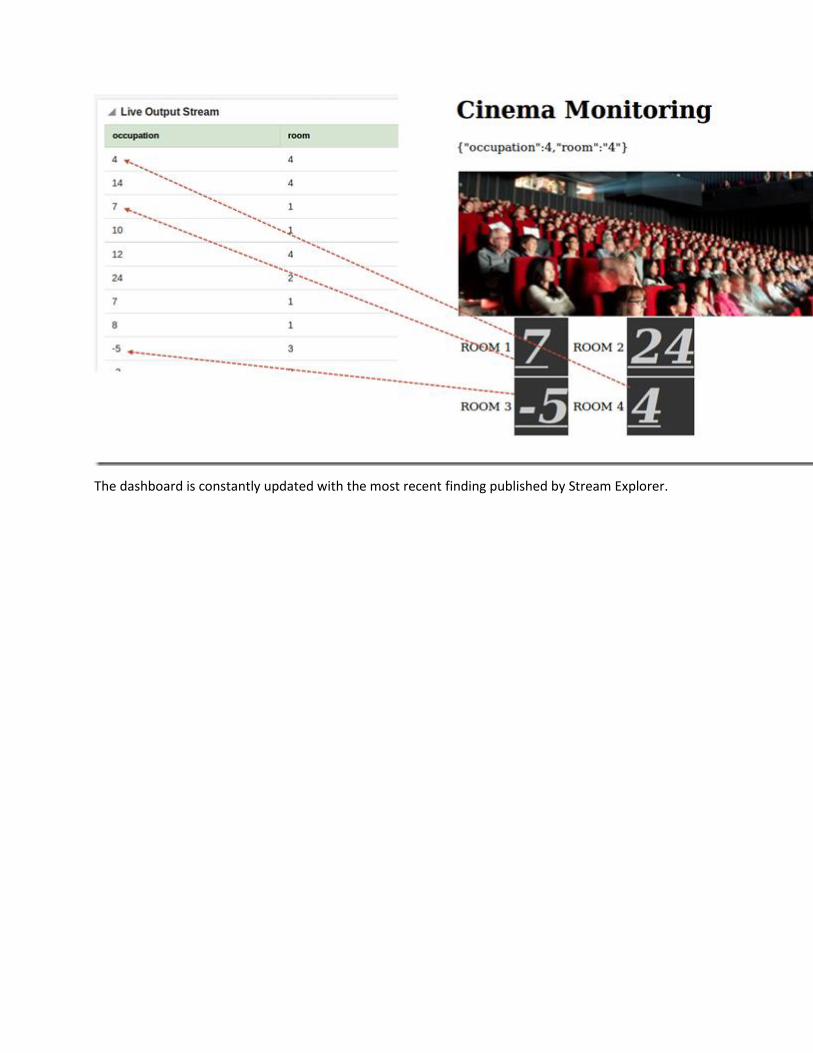
The dashboard is constantly updated with the most recent finding published by Stream Explorer.

Appendix: VM configuration details The local Oracle XE database (SID = XE, port =152, host: localhost)
The SYS user: sys/oracle
The WC account that holds several database resources: wc/wc
APEX can be used as well: http://localhost:8080/apex. The administrator credentials: admin/admin and
the default workspace is called INTERNAL.
To run JDeveloper:
cd /u01/app/oracle/FMW12c/jdeveloper/jdev/bin/
./jdev
The Integrated WebLogic Server (start from within JDeveloper) : weblogic/weblogic1 – running at port
7101. Administration Console URL: http://localhost:7101/console
To run the OEP domain:
cd /u01/app/oracle/OEP12c/user_projects/domains/sx/defaultserver
. /startwlevs.sh
(or start from within JDeveloper from the Resources palette: IDE Connections, OEP Server,
sx_domain_oep_connection | start)
username/password OEP domain: wlevs/weblogic1
WLevs Visualizer Console: http://localhost:9002/wlevs/
Stream Explorer Console: http://localhost:9002/sx
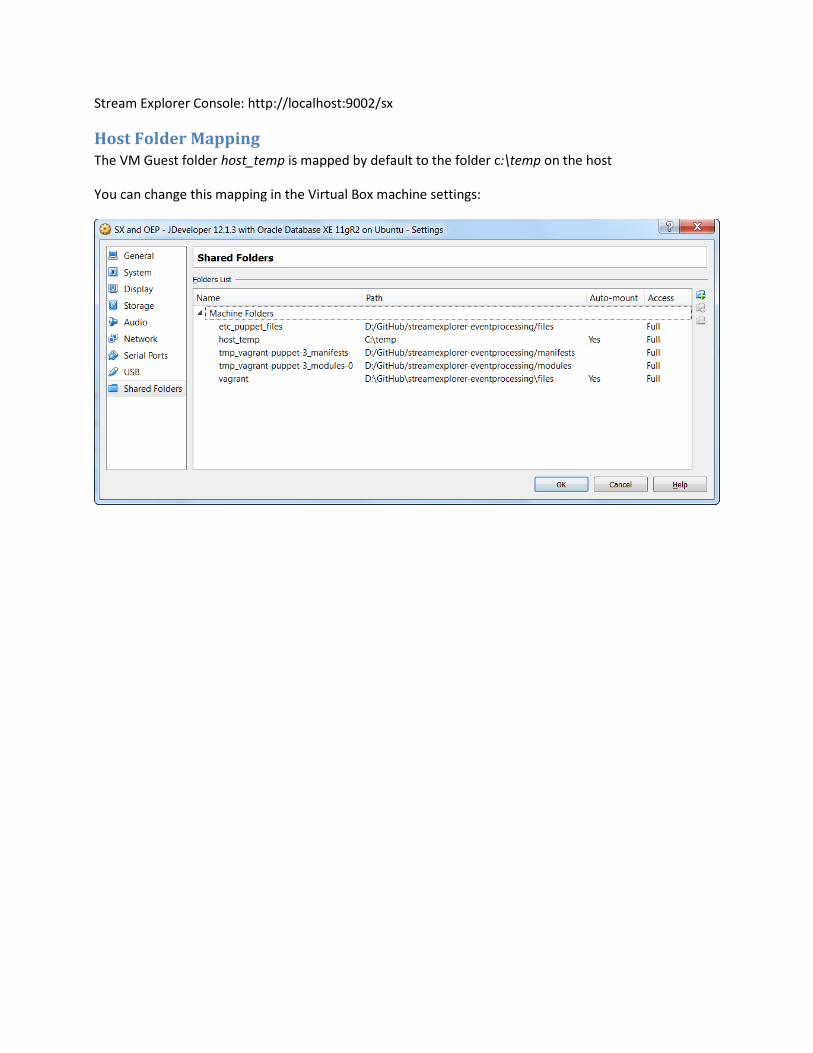
Host Folder Mapping The VM Guest folder host_temp is mapped by default to the folder c:\temp on the host
You can change this mapping in the Virtual Box machine settings: