introduction to uml - dacc
TRANSCRIPT

Team Emertxe
Introduction to UML Introduction to UML

What is
UML? • Unified Modeling Language
– OMG Standard, Object Management Group
– Based on work from Booch, Rumbaugh, Jacobson
• UML is a modeling language to express and design documents, software
– Particularly useful for OO design
– Not a process, but some have been proposed using UML
– Independent of implementation language
Why use
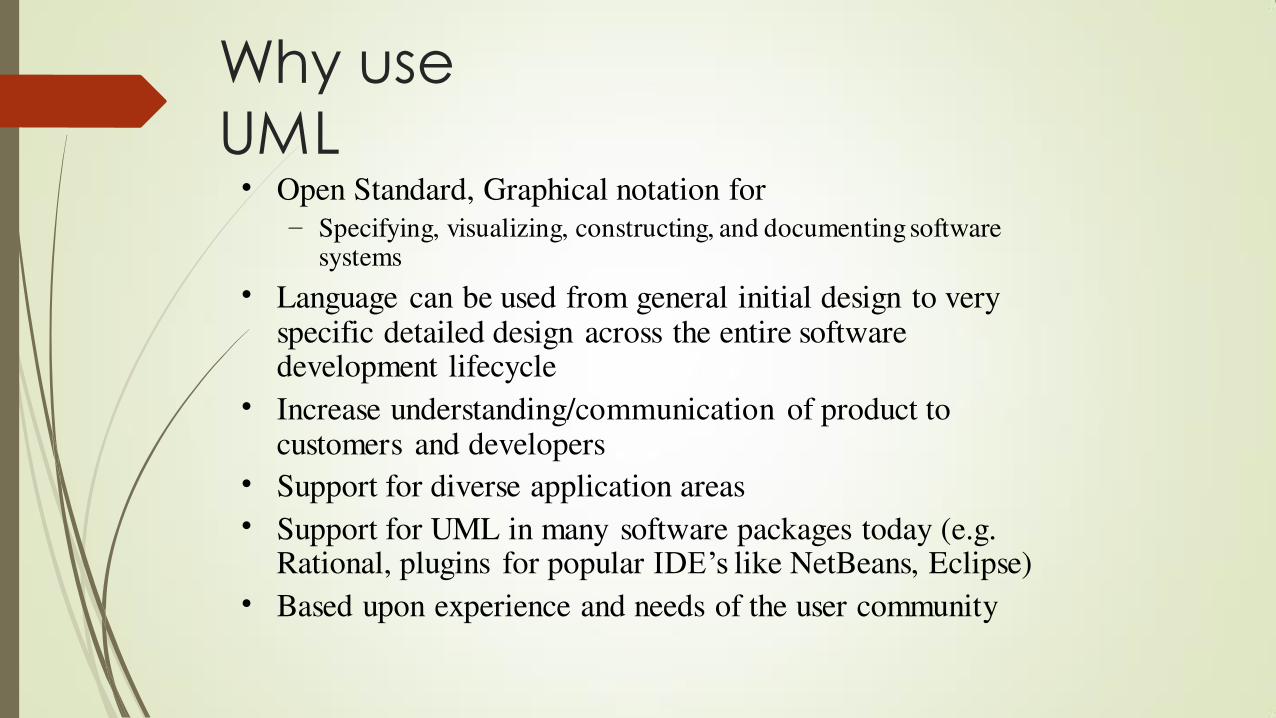
UML • Open Standard, Graphical notation for
– Specifying, visualizing, constructing, and documenting software systems
Language can be used from general initial design to very specific detailed design across the entire software development lifecycle
Increase understanding/communication of product to customers and developers
Support for diverse application areas
Support for UML in many software packages today (e.g. Rational, plugins for popular IDE’s like NetBeans, Eclipse)
Based upon experience and needs of the user community
•
•
• •
•
Brief
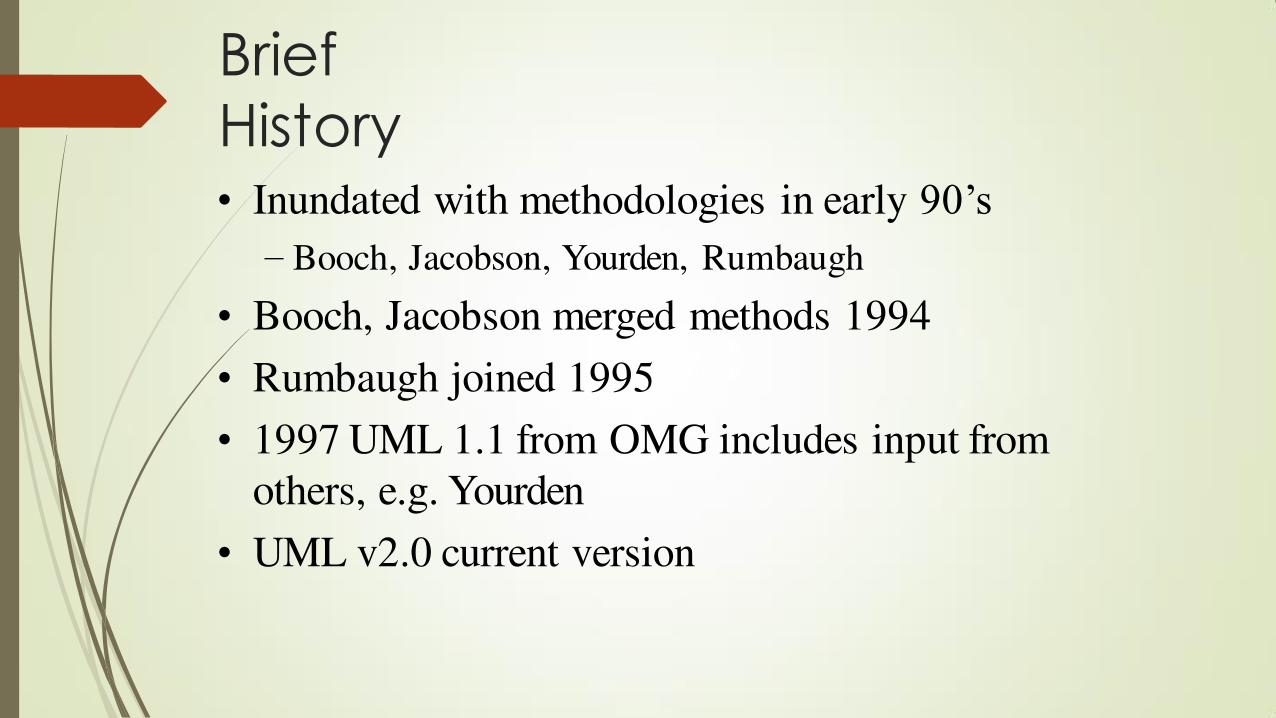
History • Inundated with methodologies in early 90’s
– Booch, Jacobson, Yourden, Rumbaugh
• Booch, Jacobson merged methods 1994
• Rumbaugh joined 1995
• 1997 UML 1.1 from OMG includes input from
others, e.g. Yourden
• UML v2.0 current version

History of
UML

Contributions to
UML

Systems, Models and Views
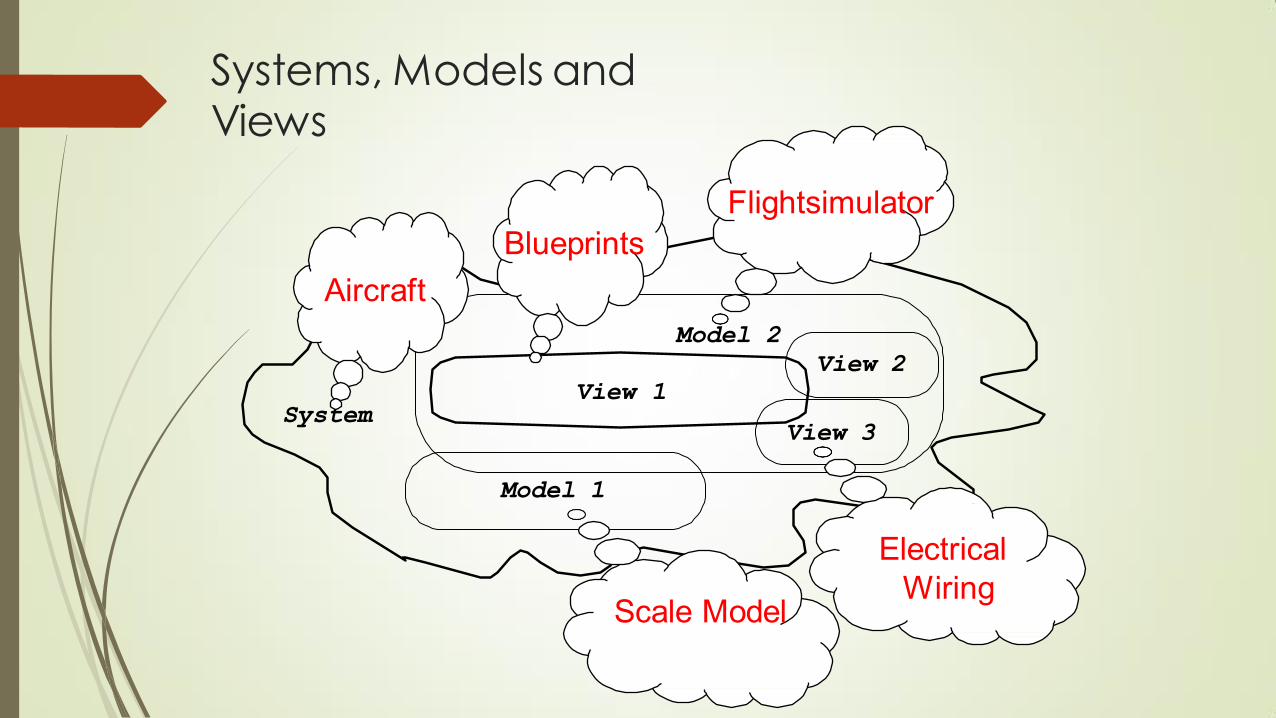
• A model is an abstraction describing a subset of a system
• A view depicts selected aspects of a model
• A notation is a set of graphical or textual rules for depicting
views
• Views and models of a single system may overlap each other
Examples:
• System: Aircraft
• Models: Flight simulator, scale model
• Views: All blueprints, electrical wiring, fuel system
Systems, Models and Views
System View 3
Model 1
Scale Model
Flightsimulator
Blueprints
Aircraft
Model 2 View 2
View 1
Electrical
Wiring

Models, Views,
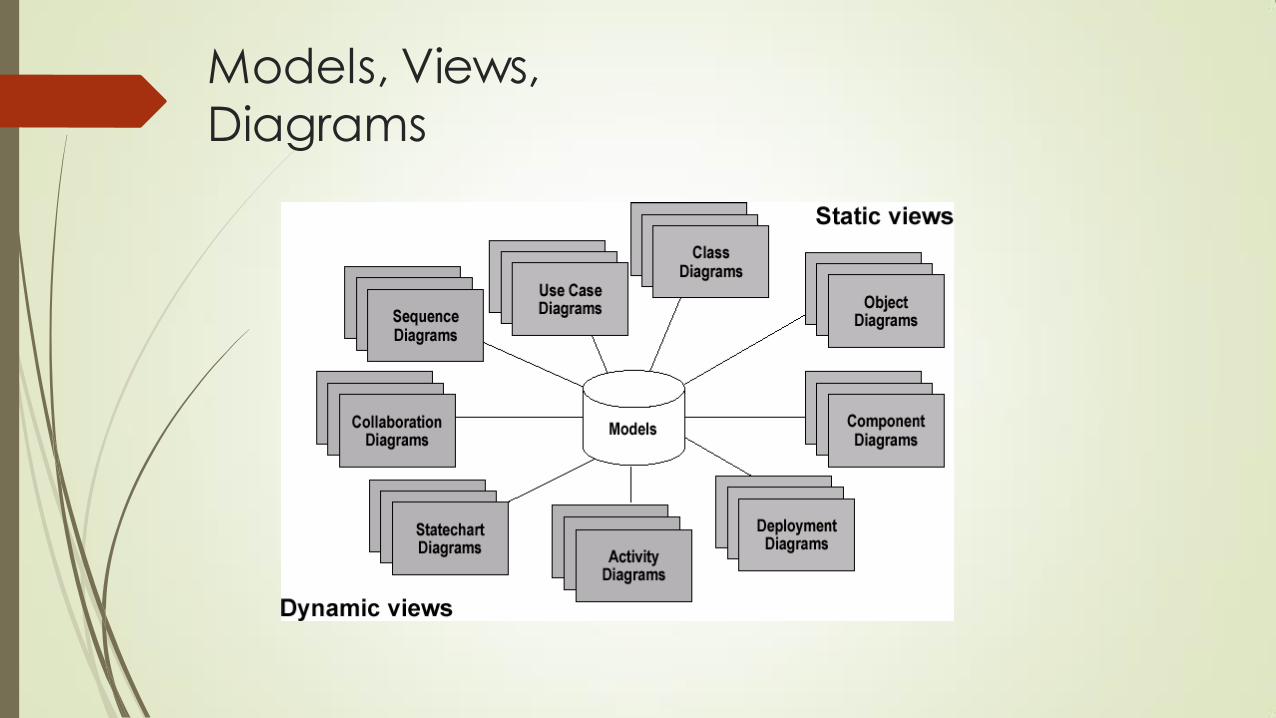
Diagrams • UML is a multi-diagrammatic language
– Each diagram is a view into a model • Diagram presented from the aspect of a particular stakeholder • Provides a partial representation of the system
• Is semantically consistent with other views
– Example views
Models, Views,
Diagrams
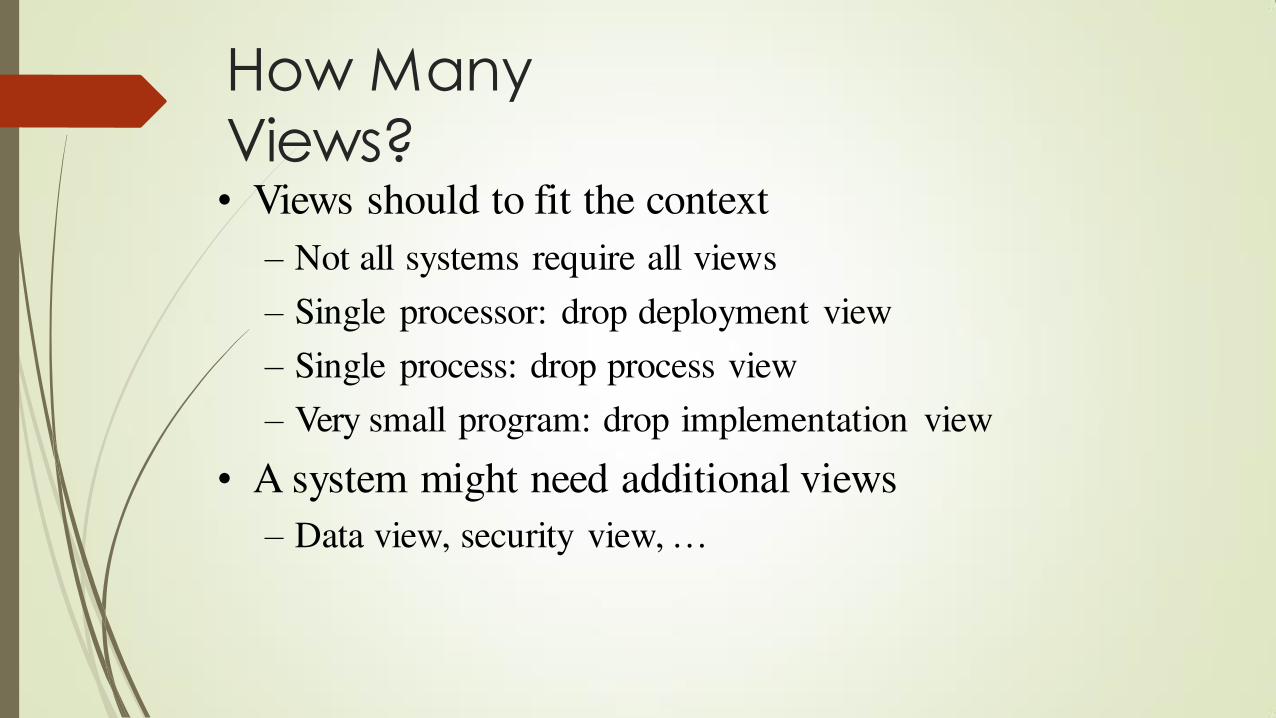
How Many
Views? • Views should to fit the context
– Not all systems require all views
– Single processor: drop deployment view
– Single process: drop process view
– Very small program: drop implementation view
• A system might need additional views
– Data view, security view, …
UML: First Pass
• You can model 80% of most problems by
using about 20 % UML
• We only cover the 20% here
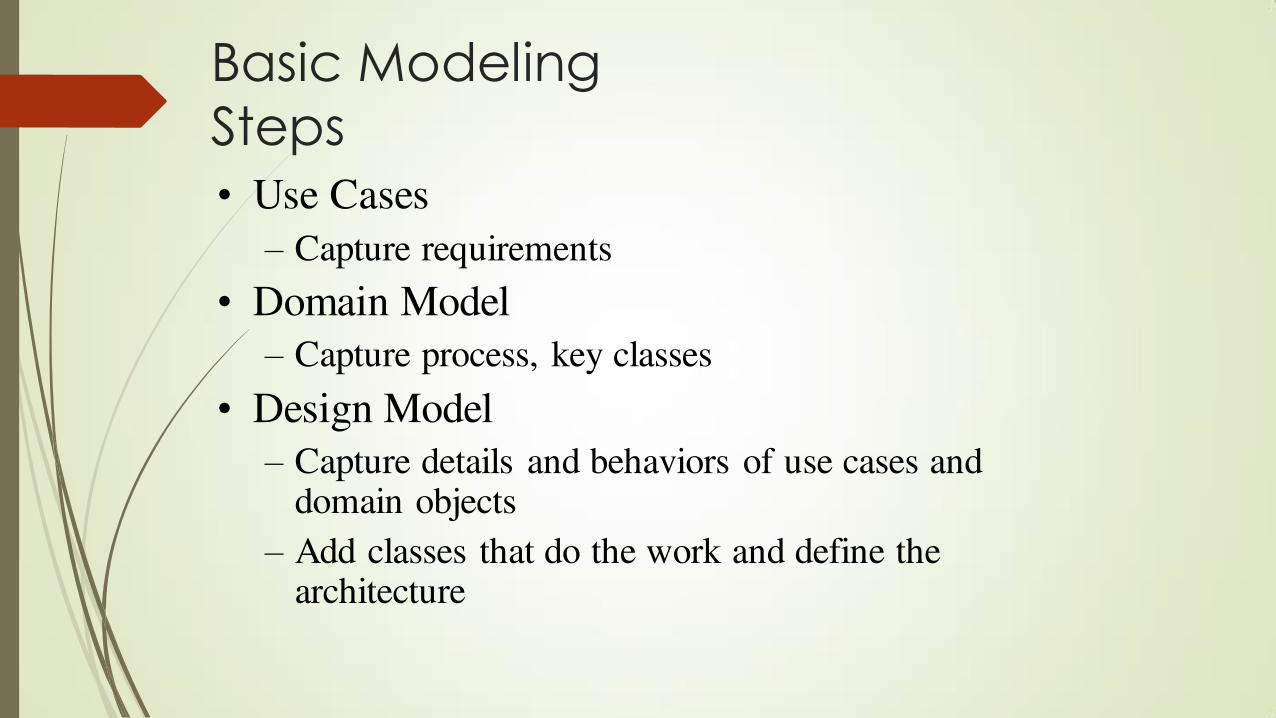
Basic Modeling
Steps
• Use Cases
– Capture requirements
• Domain Model
– Capture process, key classes
• Design Model
– Capture details and behaviors of use cases and domain objects
– Add classes that do the work and define the architecture
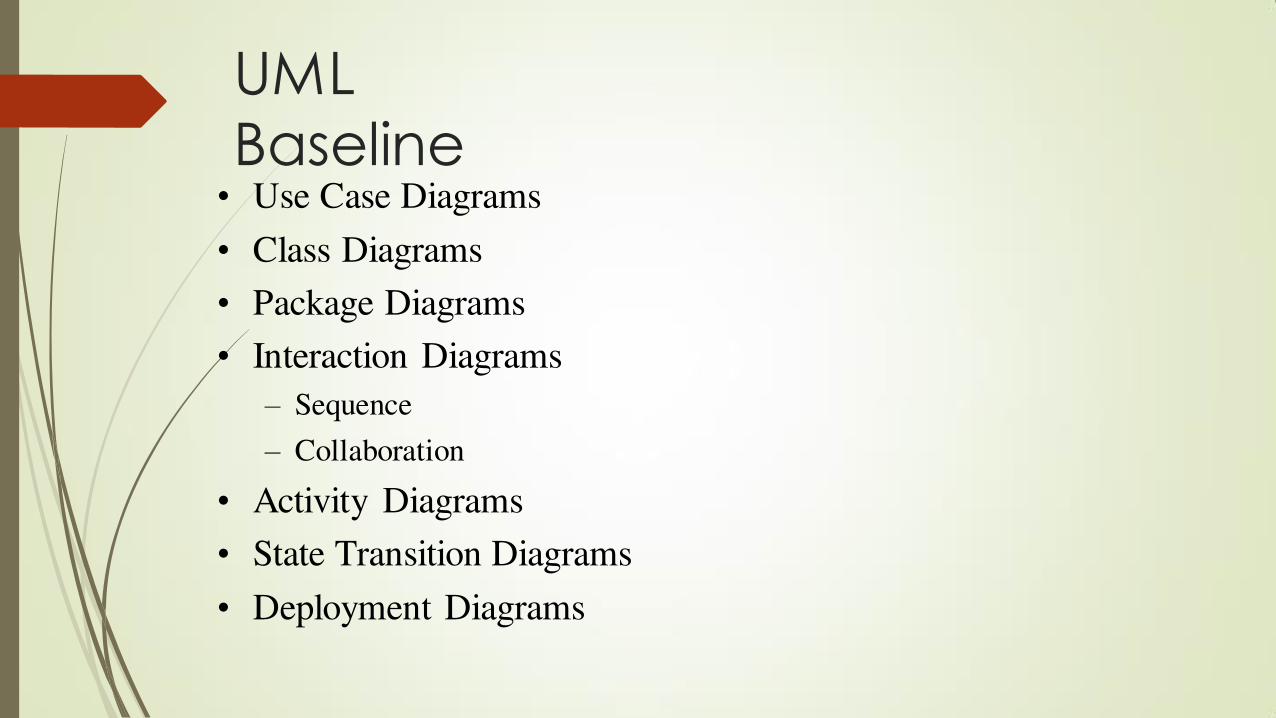
UML
Baseline • Use Case Diagrams
• Class Diagrams
• Package Diagrams
• Interaction Diagrams
– Sequence
– Collaboration
• Activity Diagrams
• State Transition Diagrams
• Deployment Diagrams
Use Case
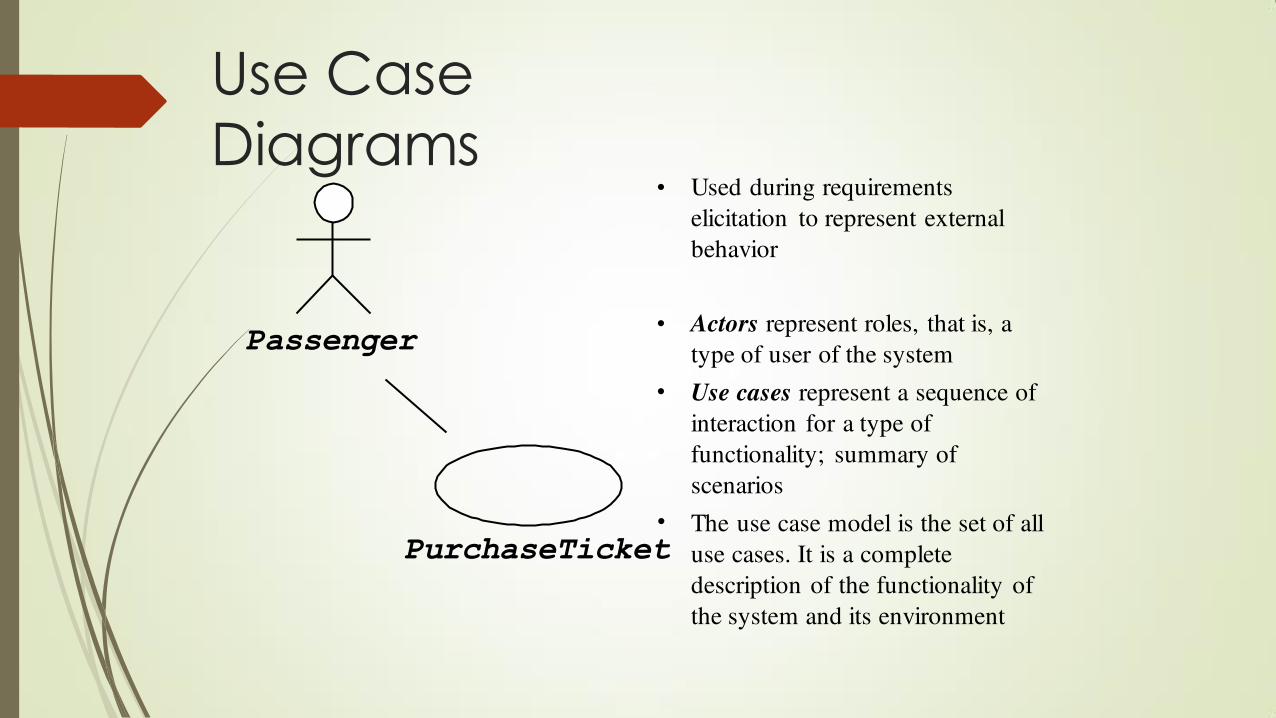
Diagrams • Used during requirements
elicitation to represent external
behavior
• Actors represent roles, that is, a
type of user of the system
Use cases represent a sequence of
interaction for a type of
functionality; summary of
scenarios
The use case model is the set of all
use cases. It is a complete
description of the functionality of
the system and its environment
•
•
Passenger
PurchaseTicket
Actor
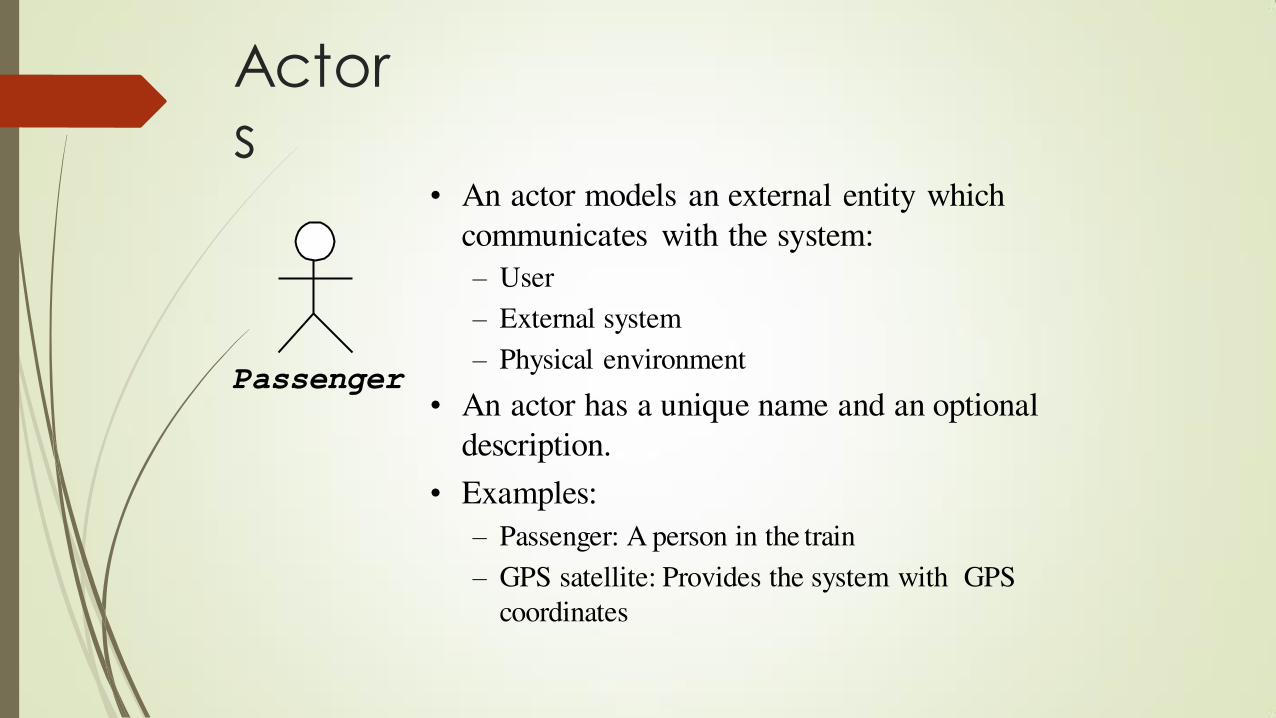
s • An actor models an external entity which
communicates with the system:
– User
– External system
– Physical environment
• An actor has a unique name and an optional
description.
• Examples:
– Passenger: A person in the train
– GPS satellite: Provides the system with GPS
coordinates
Passenger

Use
Case A use case represents a class of functionality
provided by the system as an event flow.
A use case consists of:
• Unique name
• Participating actors
• Entry conditions
• Flow of events
• Exit conditions
• Special requirements
PurchaseTicket

Use Case
Diagram:
Example
Name: Purchase ticket
Participating actor: Passenger
Entry condition:
Passenger standing in front o
ticket distributor.
Passenger has sufficient
money to purchase ticket.
Exit condition:
Passenger has ticket.
Event flow:
1.Passenger selects the
number of zones to be
traveled.
2. Distributor displays the
amount due.
3.Passenger inserts money, of
at least the amount due.
4. Distributor returns change.
5. Distributor issues ticket.
Anything missing?
Exceptional cases!
The <<extends>>
Relationship •
•
•
•
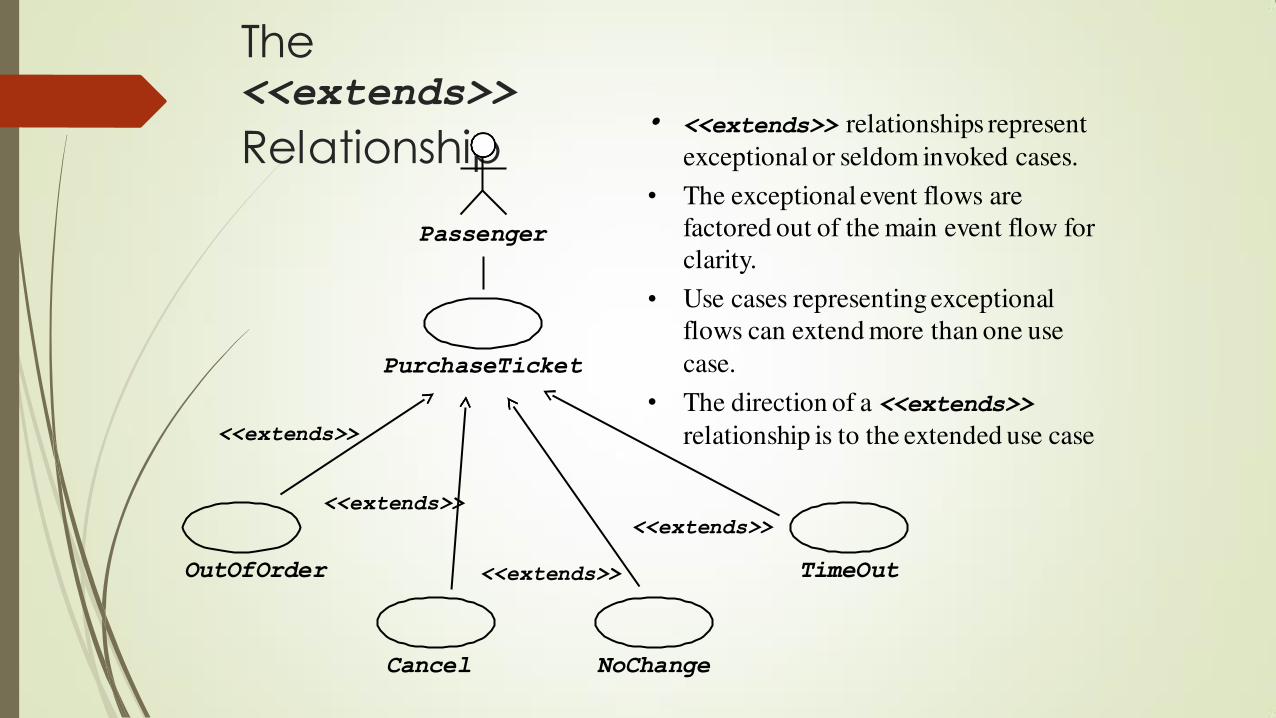
<<extends>> relationships represent
exceptional or seldom invoked cases.
The exceptional event flows are
factored out of the main event flow for
clarity.
Use cases representing exceptional
flows can extend more than one use
case.
The direction of a <<extends>>
relationship is to the extended use case
Passenger
PurchaseTicket
TimeOut
<<extends>>
NoChange
<<extends>> OutOfOrder
<<extends>>
Cancel
<<extends>>

The <<includes>>
Relationship • <<includes>> relationship
represents behavior that is
factored out of the use case.
<<includes>> behavior is
factored out for reuse, not because
it is an exception.
The direction of a
<<includes>> relationship is to
the using use case (unlike <<extends>> relationships).
•
•
Passenger
NoChange
<<extends>>
Cancel
<<extends>>
PurchaseMultiCard
PurchaseSingleTicket
<<includes>>
<<includes>>
CollectMoney
Use Cases are useful
to…
• Determining requirements
– New use cases often generate new requirements as the
system is analyzed and the design takes shape.
• Communicating with clients
– Their notational simplicity makes use case diagrams a good
way for developers to communicate with clients.
• Generating test cases
– The collection of scenarios for a use case may suggest a
suite of test cases for those scenarios.

Use Case Diagrams: Summary • Use case diagrams represent external behavior
• Use case diagrams are useful as an index into
the use cases
• Use case descriptions provide meat of model,
not the use case diagrams.
• All use cases need to be described for the
model to be useful.

Class
Diagrams • Gives an overview of a system by showing its
classes and the relationships among them.
– Class diagrams are static
– they display what interacts but not what happens when they do interact
• Also shows attributes and operations of each class
• Good way to describe the overall architecture of system components

Class
Diagram:
Perspectives • We draw Class Diagrams under three
perspectives
– Conceptual
• Software independent
• Language independent
– Specification
• Focus on the interfaces of the software
– Implementation
• Focus on the implementation of the software
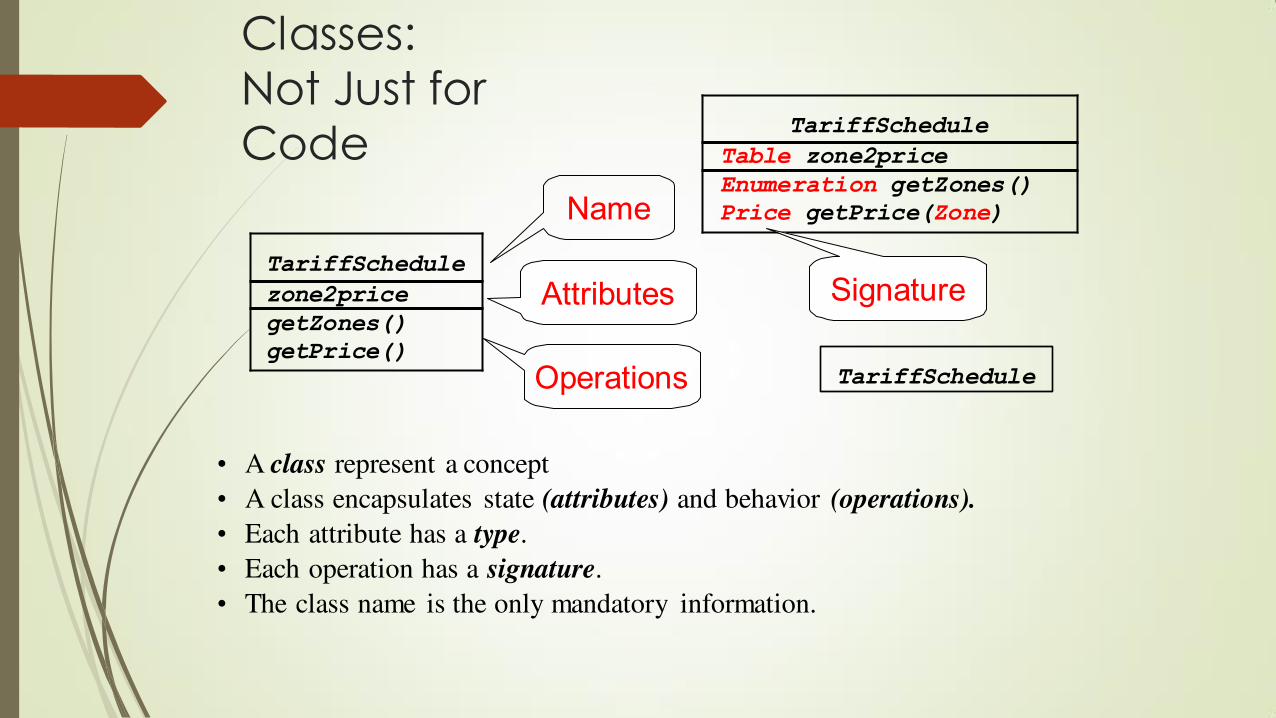
Classes: Not Just for Code
• A class represent a concept
• A class encapsulates state (attributes) and behavior (operations).
• Each attribute has a type.
• Each operation has a signature.
• The class name is the only mandatory information.
TariffSchedule
zone2price
getZones() getPrice()
TariffSchedule
Table zone2price
Enumeration getZones() Price getPrice(Zone) Name
Attributes
Operations
Signature
TariffSchedule
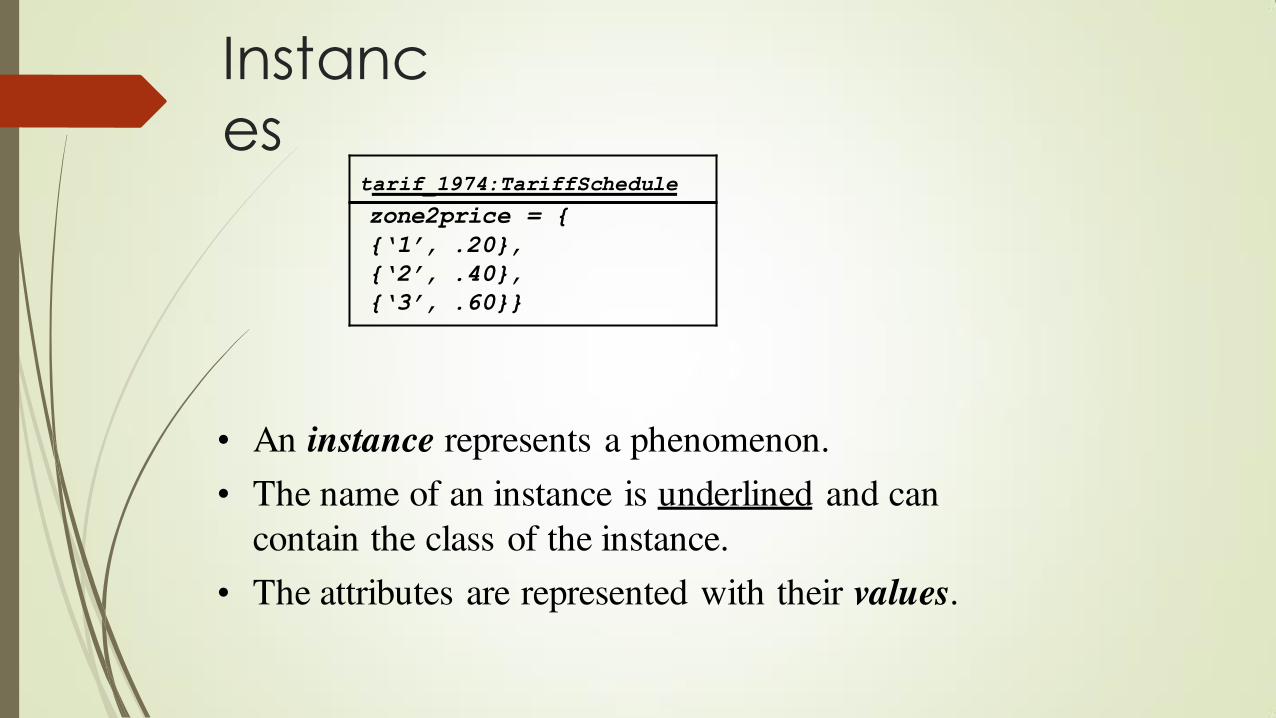
Instanc
es
• An instance represents a phenomenon.
• The name of an instance is underlined and can
contain the class of the instance.
• The attributes are represented with their values.
tarif_1974:TariffSchedule
zone2price = {
{‘1’, .20}, {‘2’, .40}, {‘3’, .60}}
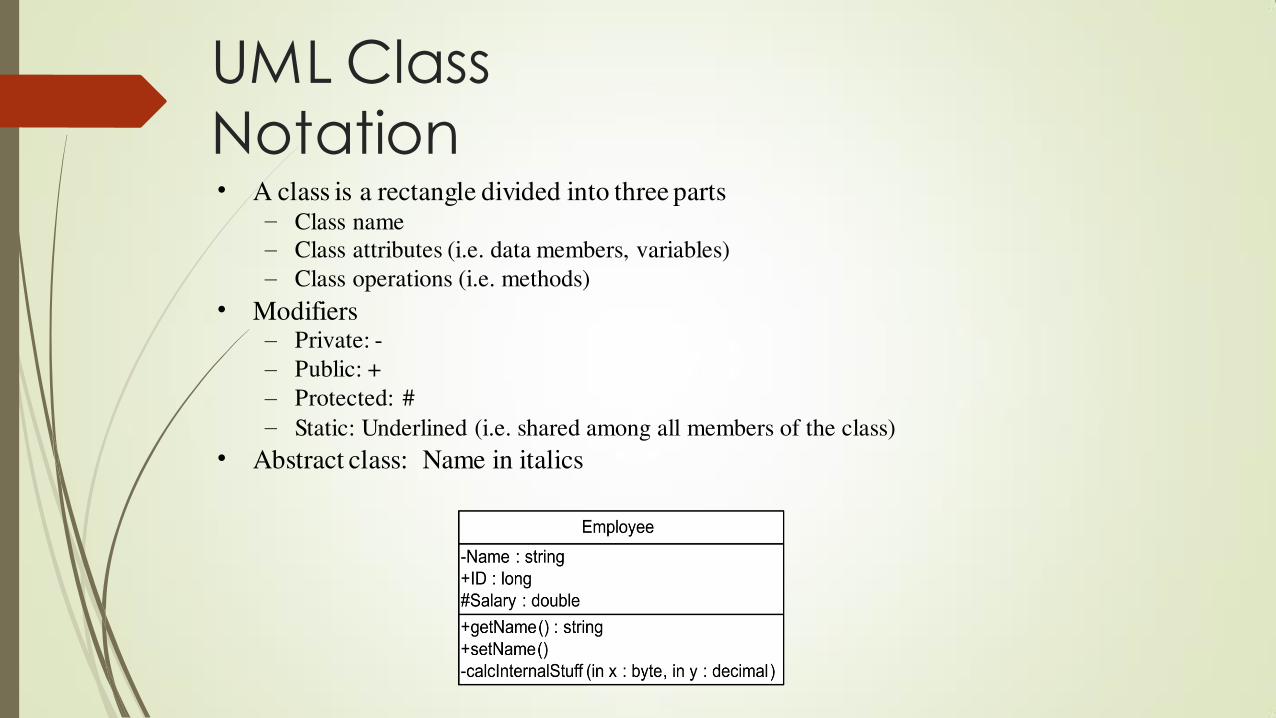
UML Class
Notation • A class is a rectangle divided into three parts
–
–
–
Class name
Class attributes (i.e. data members, variables)
Class operations (i.e. methods)
• Modifiers –
–
–
–
Private: -
Public: +
Protected: #
Static: Underlined (i.e. shared among all members of the class)
• Abstract class: Name in italics

UML Class
Notation • Lines or arrows between classes indicate relationships – Association
• A relationship between instances of two classes, where one class must know about the other to do its work, e.g. client communicates to server
• indicated by a straight line or arrow
– Aggregation • An association where one class belongs to a collection, e.g. instructor part of
Faculty
• Indicated by an empty diamond on the side of the collection
– Composition
• • •
Strong form of Aggregation
Lifetime control; components cannot exist without the aggregate
Indicated by a solid diamond on the side of the collection
– Inheritance • An inheritance link indicating one class a superclass relationship, e.g. bird is
part of mammal
• Indicated by triangle pointing to superclass
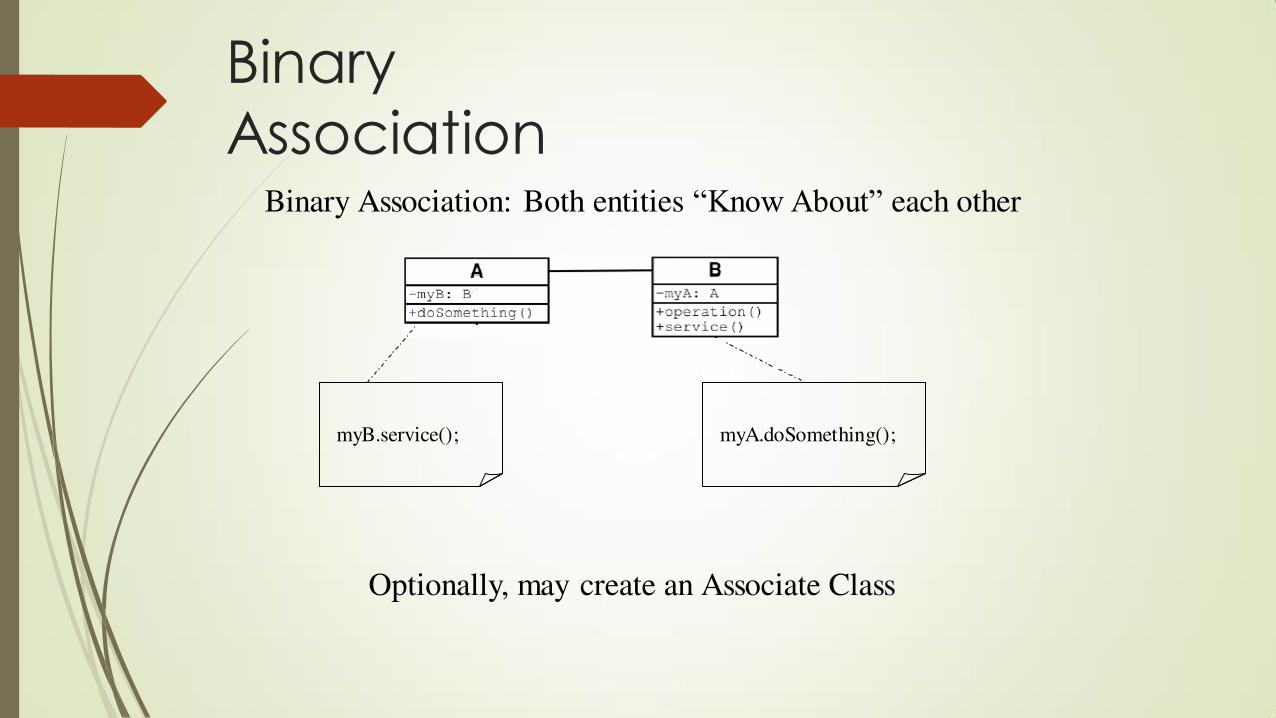
Binary
Association
myB.service(); myA.doSomething();
Binary Association: Both entities “Know About” each other
Optionally, may create an Associate Class
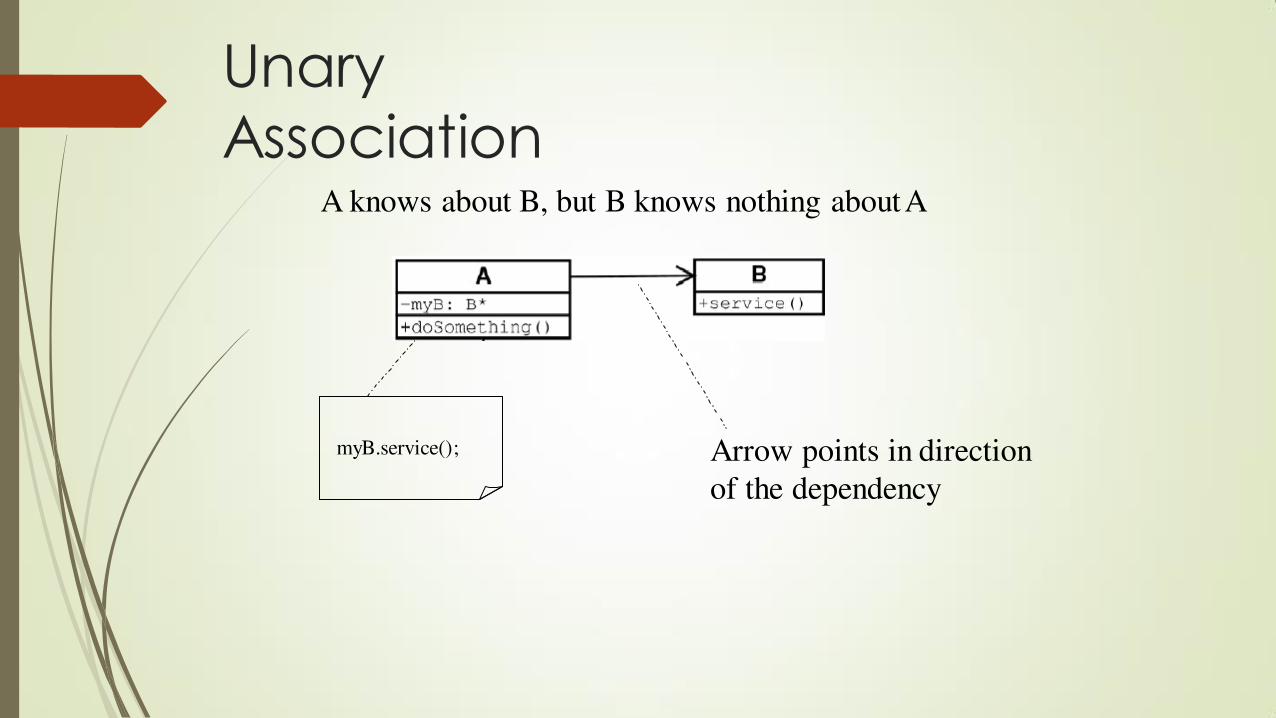
Unary
Association A knows about B, but B knows nothing about A
Arrow points in direction
of the dependency
myB.service();
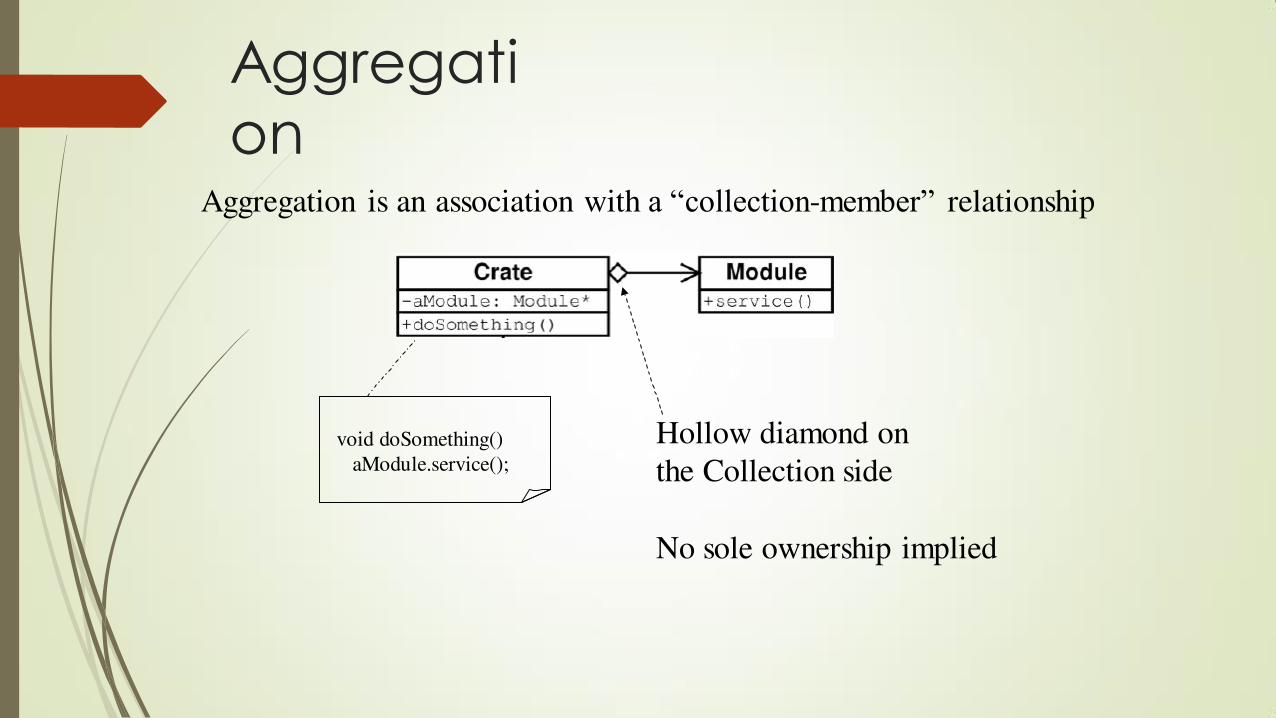
Aggregati
on Aggregation is an association with a “collection-member” relationship
void doSomething()
aModule.service();
Hollow diamond on
the Collection side
No sole ownership implied
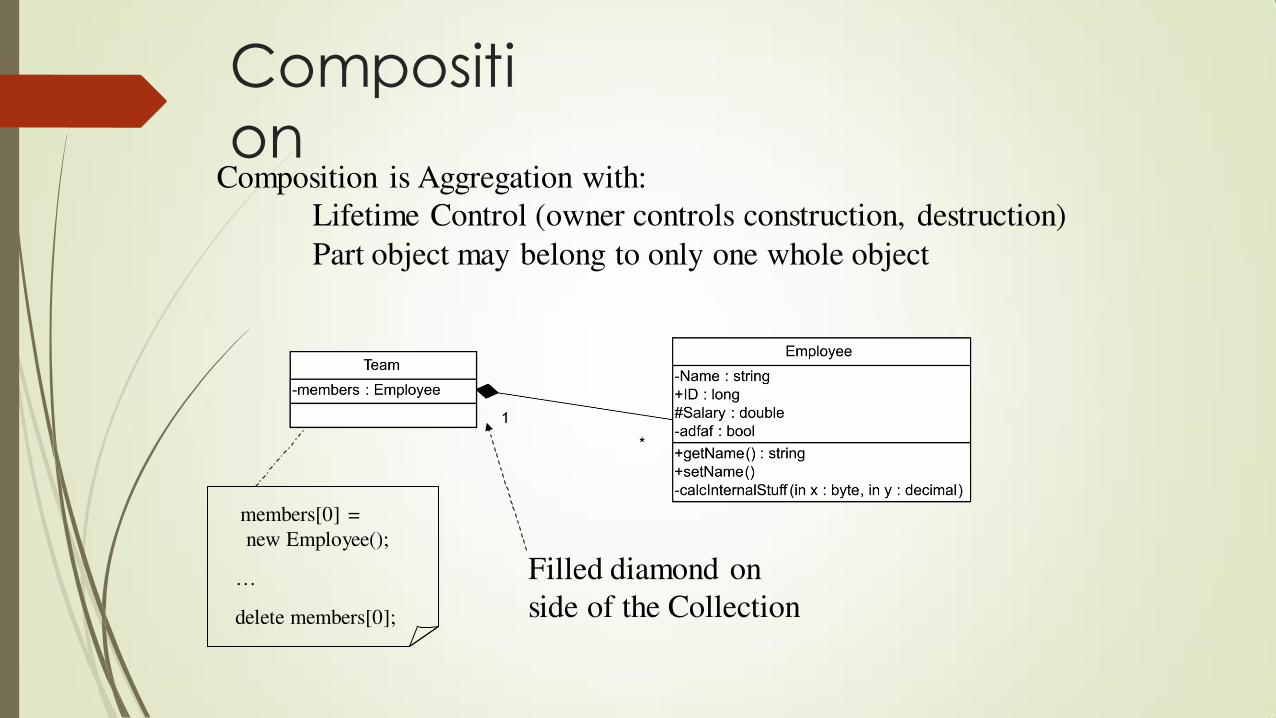
Compositi
on Composition is Aggregation with:
Lifetime Control (owner controls construction, destruction)
Part object may belong to only one whole object
Filled diamond on
side of the Collection
members[0] =
new Employee();
…
delete members[0];
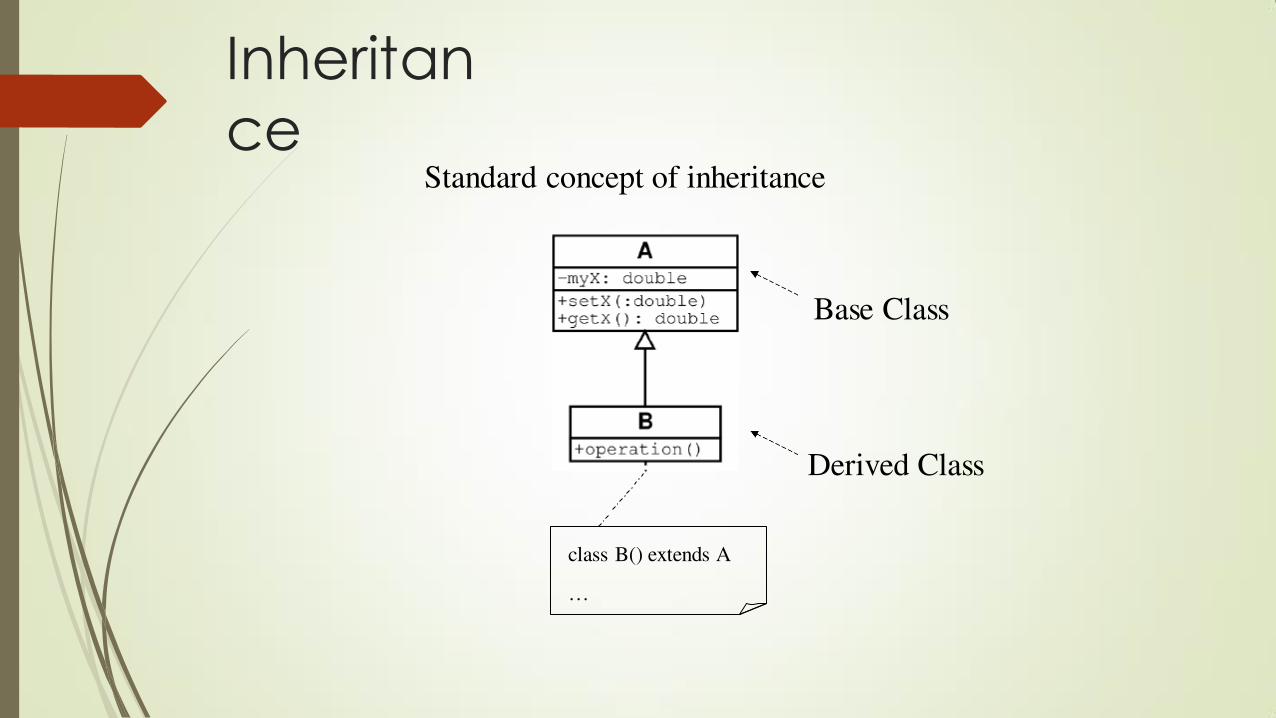
Inheritan
ce
class B() extends A
…
Standard concept of inheritance
Base Class
Derived Class
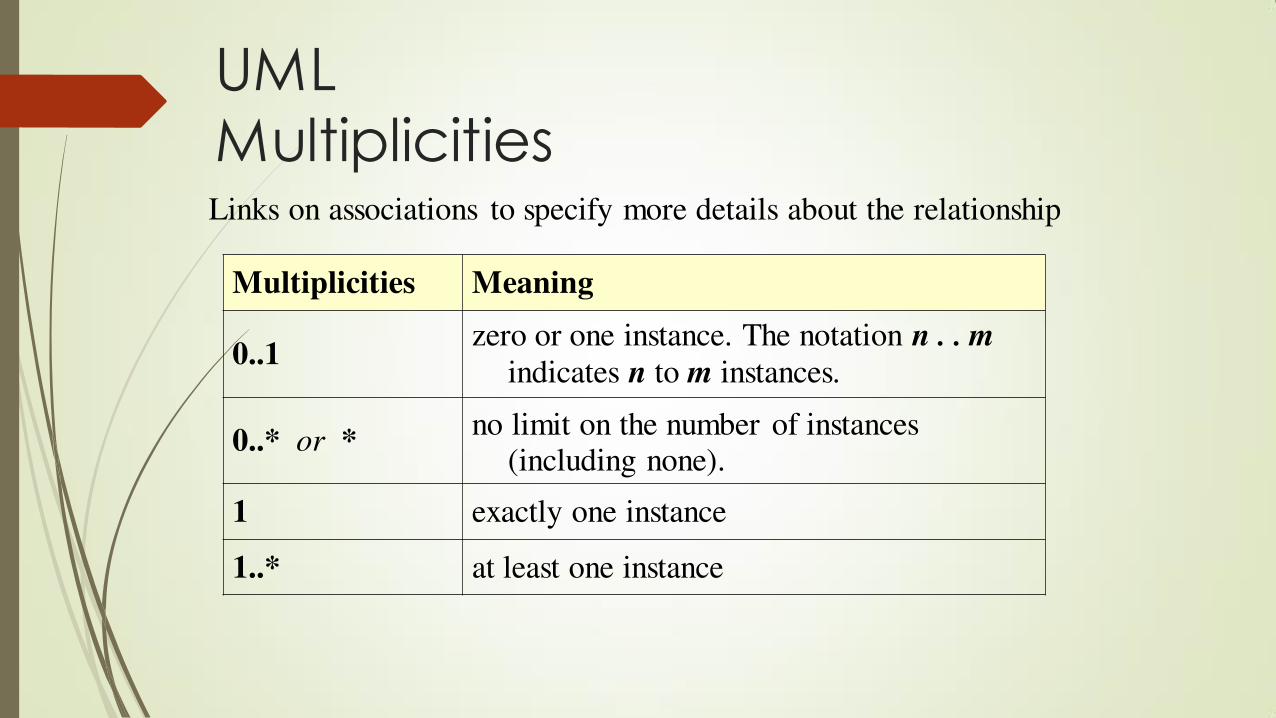
UML
Multiplicities
Multiplicities Meaning
0..1 zero or one instance. The notation n . . m
indicates n to m instances.
0..* or * no limit on the number of instances
(including none).
1 exactly one instance
1..* at least one instance
Links on associations to specify more details about the relationship

UML Class
Example
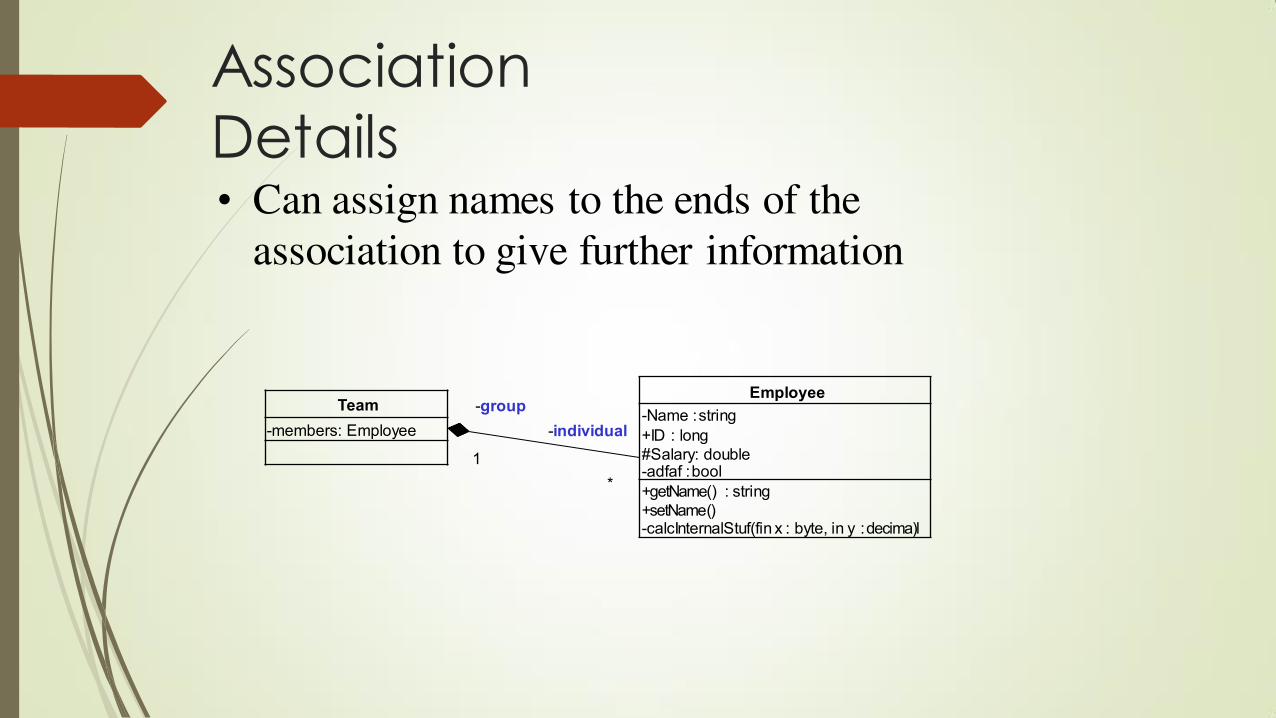
Association
Details • Can assign names to the ends of the
association to give further information
Employee
-Name : string
+ID : long
#Salary: double -adfaf : bool
+getName() : string
+setName() -calcInternalStuf(fin x : byte, in y : decima)l
Team
-members: Employee
-group
-individual
1
*
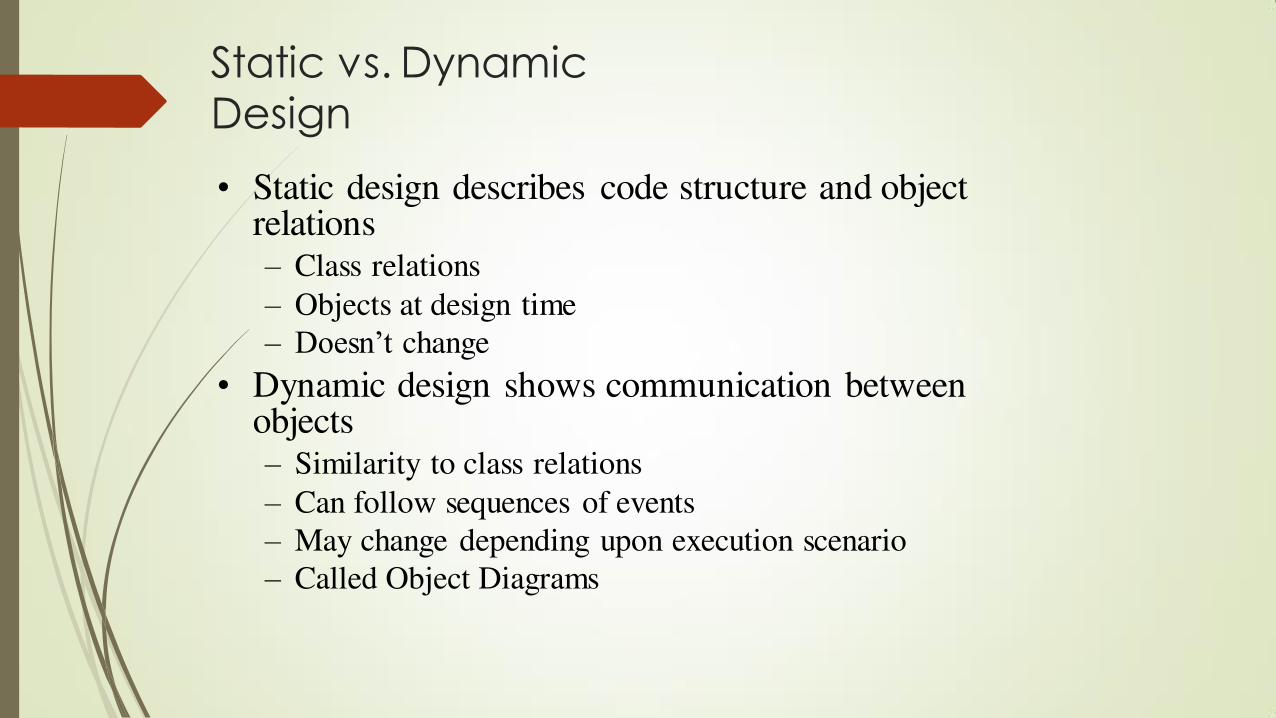
Static vs. Dynamic Design
• Static design describes code structure and object relations – Class relations
– Objects at design time
– Doesn’t change
• Dynamic design shows communication between objects – Similarity to class relations
– Can follow sequences of events
– May change depending upon execution scenario
– Called Object Diagrams
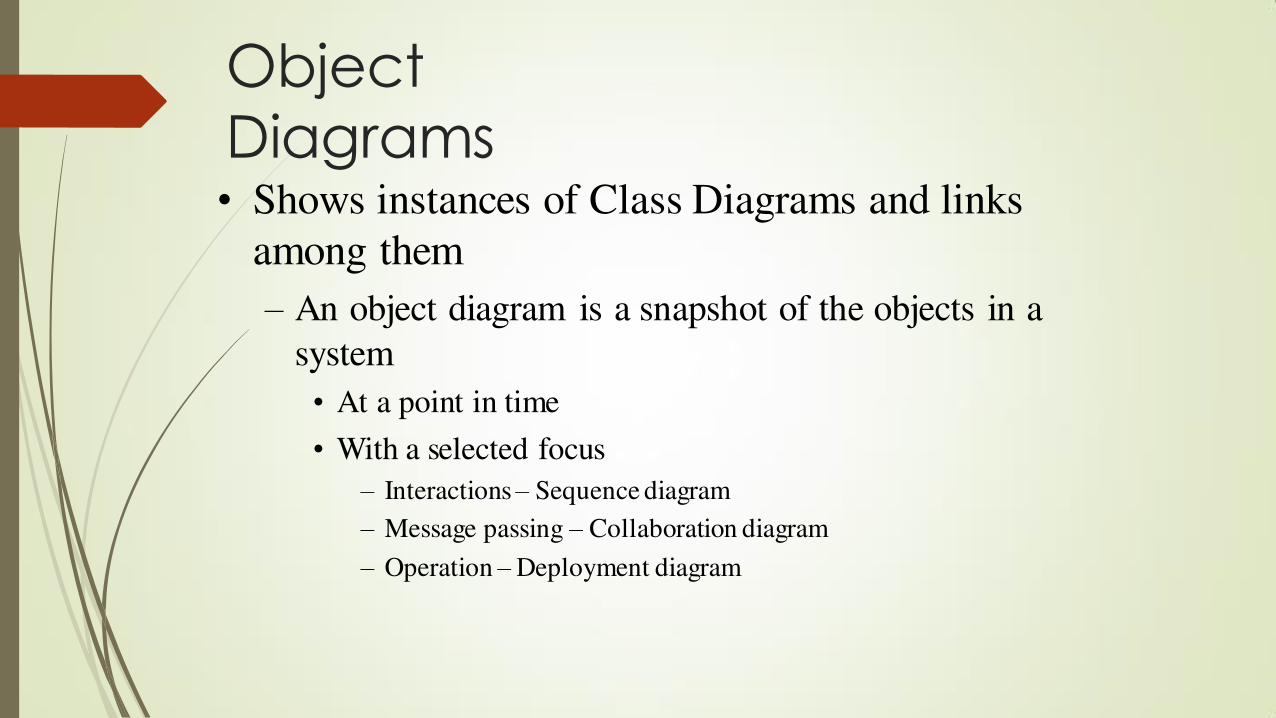
Object
Diagrams • Shows instances of Class Diagrams and links
among them
– An object diagram is a snapshot of the objects in a
system
• At a point in time
• With a selected focus
– Interactions – Sequence diagram
– Message passing – Collaboration diagram
– Operation – Deployment diagram

Object
Diagrams
• Format is
– Instance name : Class name
– Attributes and Values
– Example:
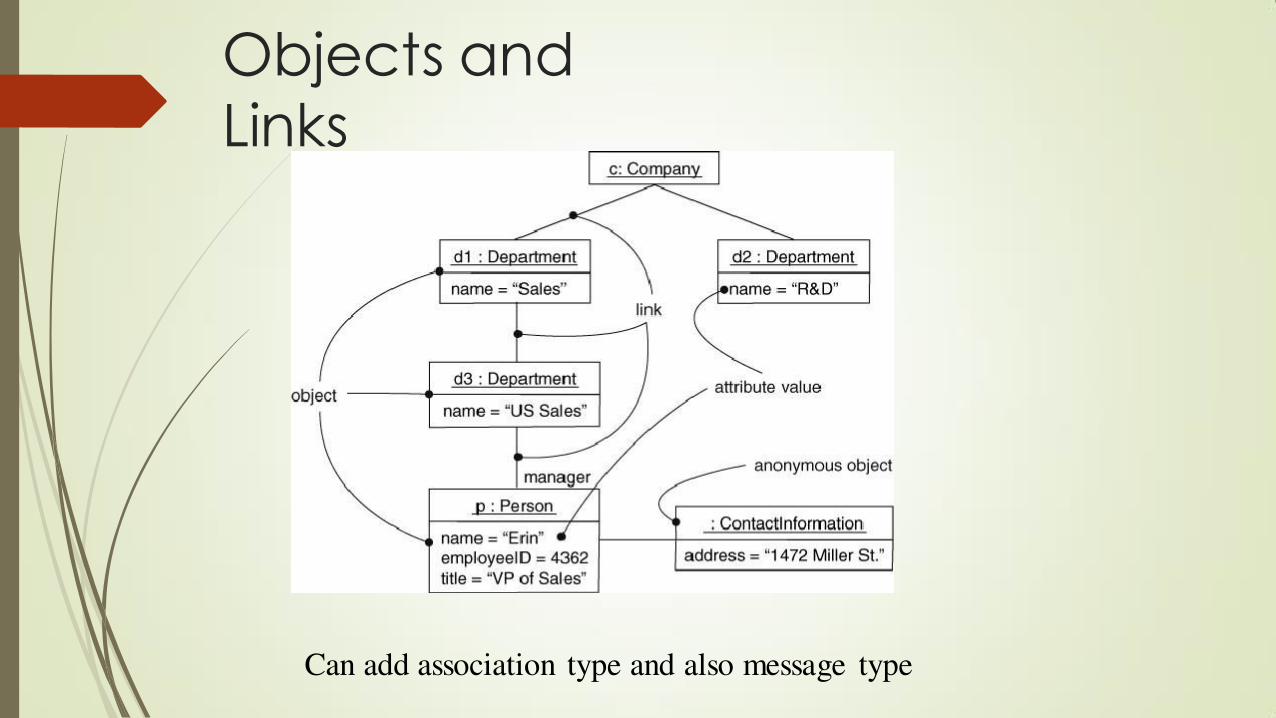
Objects and
Links
Can add association type and also message type

Package
Diagrams • To organize complex class diagrams, you can group
classes into packages. A package is a collection of logically related UML elements
• Notation
– Packages appear as rectangles with small tabs at the top.
– The package name is on the tab or inside the rectangle.
– The dotted arrows are dependencies. One package depends on another if changes in the other could possibly force changes in the first.
– Packages are the basic grouping construct with which you may organize UML models to increase their readability
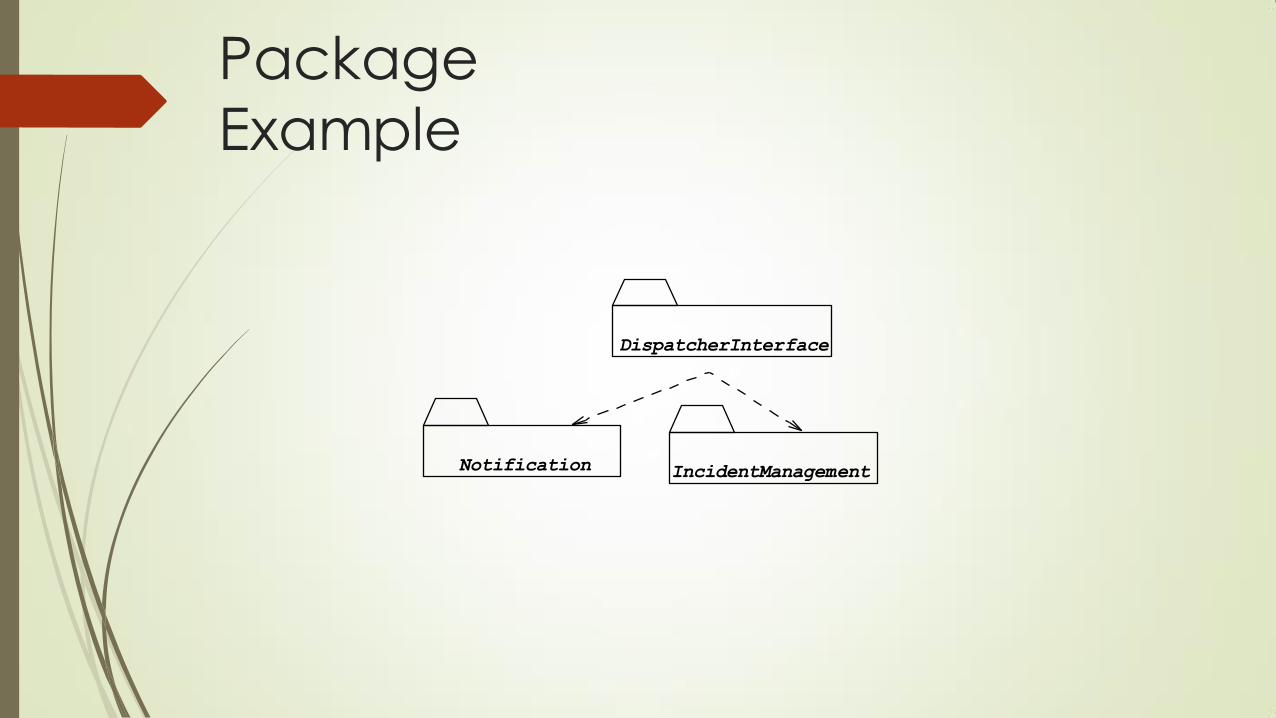
Package
Example
DispatcherInterface
Notification
IncidentManagement
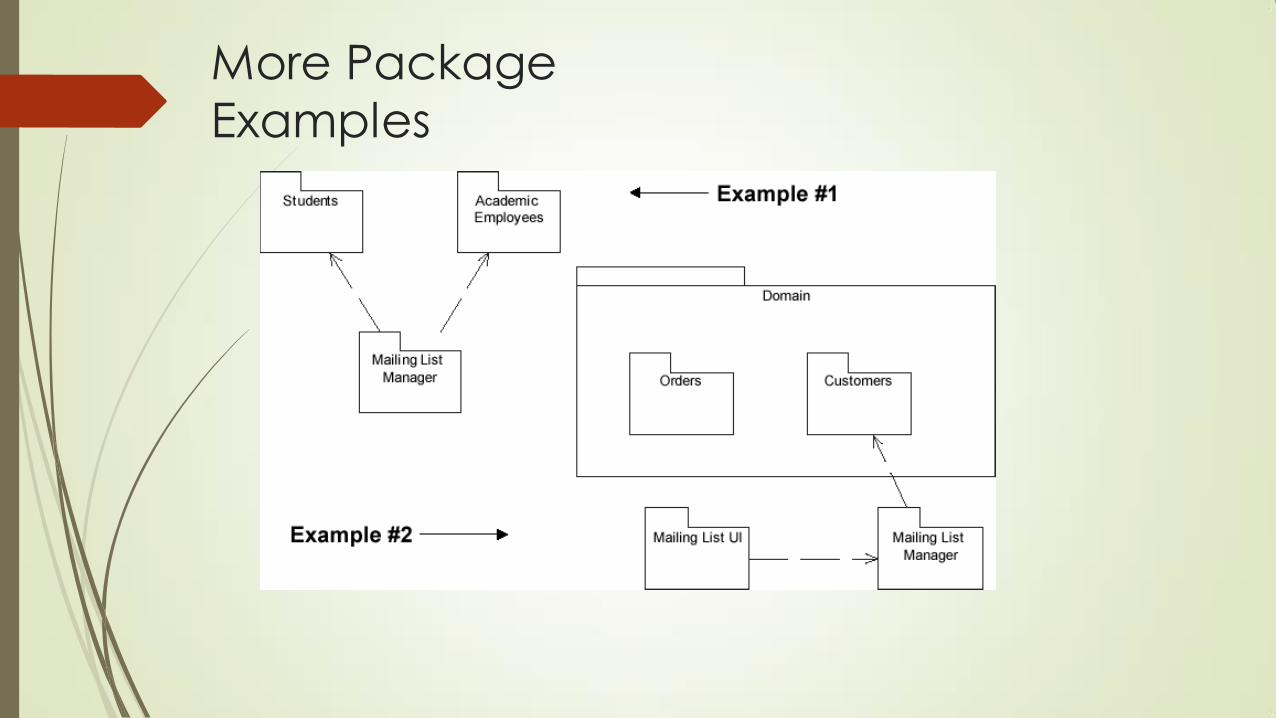
More Package
Examples
Interaction
Diagrams • Interaction diagrams are dynamic -- they
describe how objects collaborate.
• A Sequence Diagram:
– Indicates what messages are sent and when
– Time progresses from top to bottom
– Objects involved are listed left to right
– Messages are sent left to right between objects in sequence
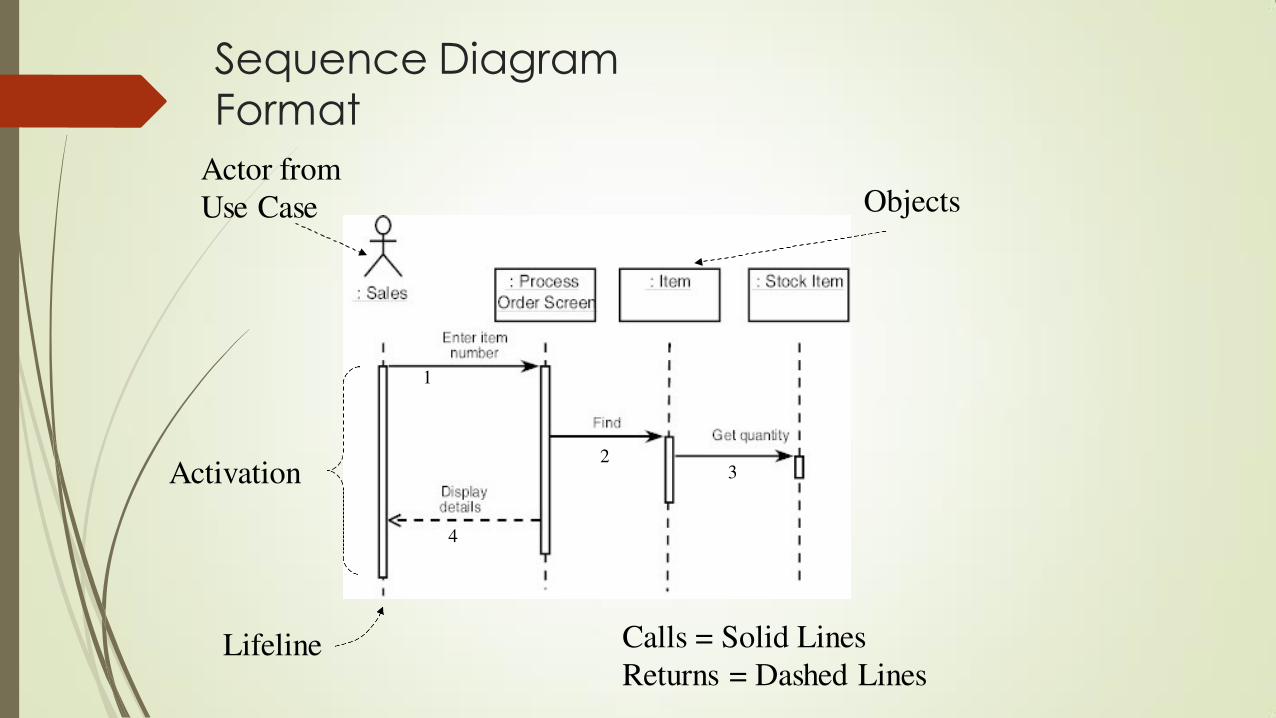
Sequence Diagram Format
Actor from
Use Case Objects
1
2 3
4
Lifeline Calls = Solid Lines
Returns = Dashed Lines
Activation
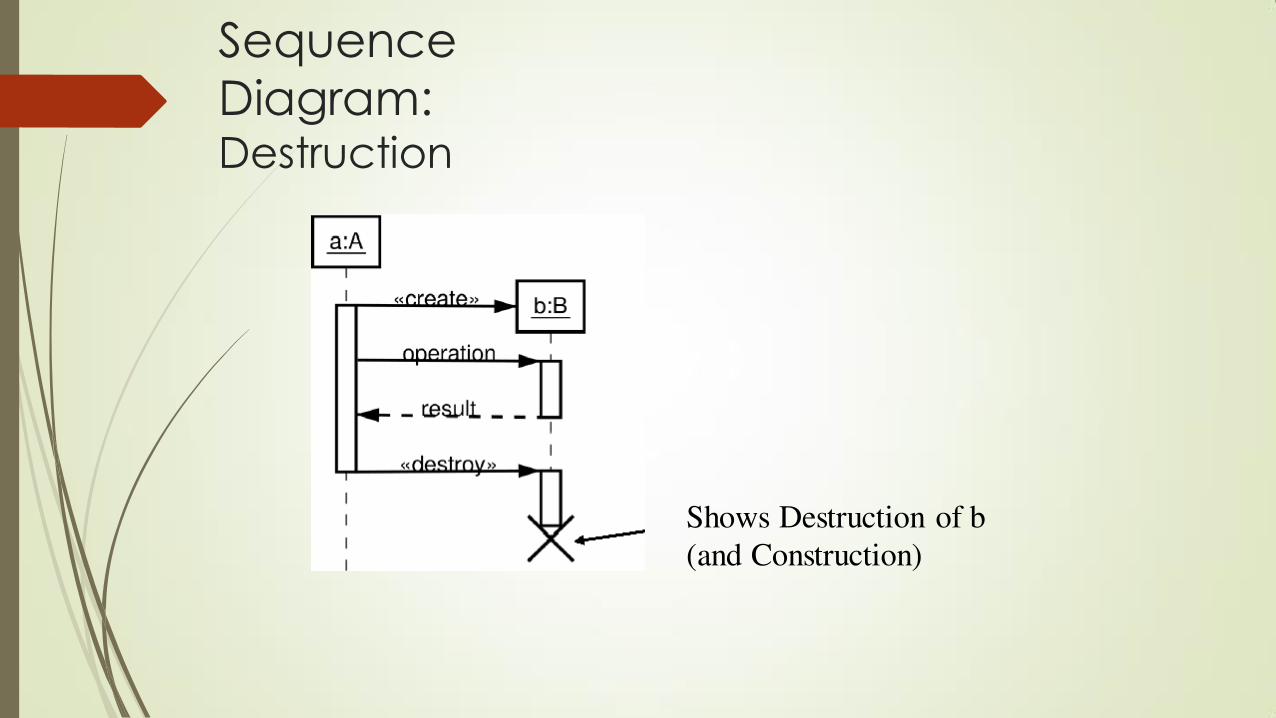
Sequence
Diagram: Destruction
Shows Destruction of b
(and Construction)
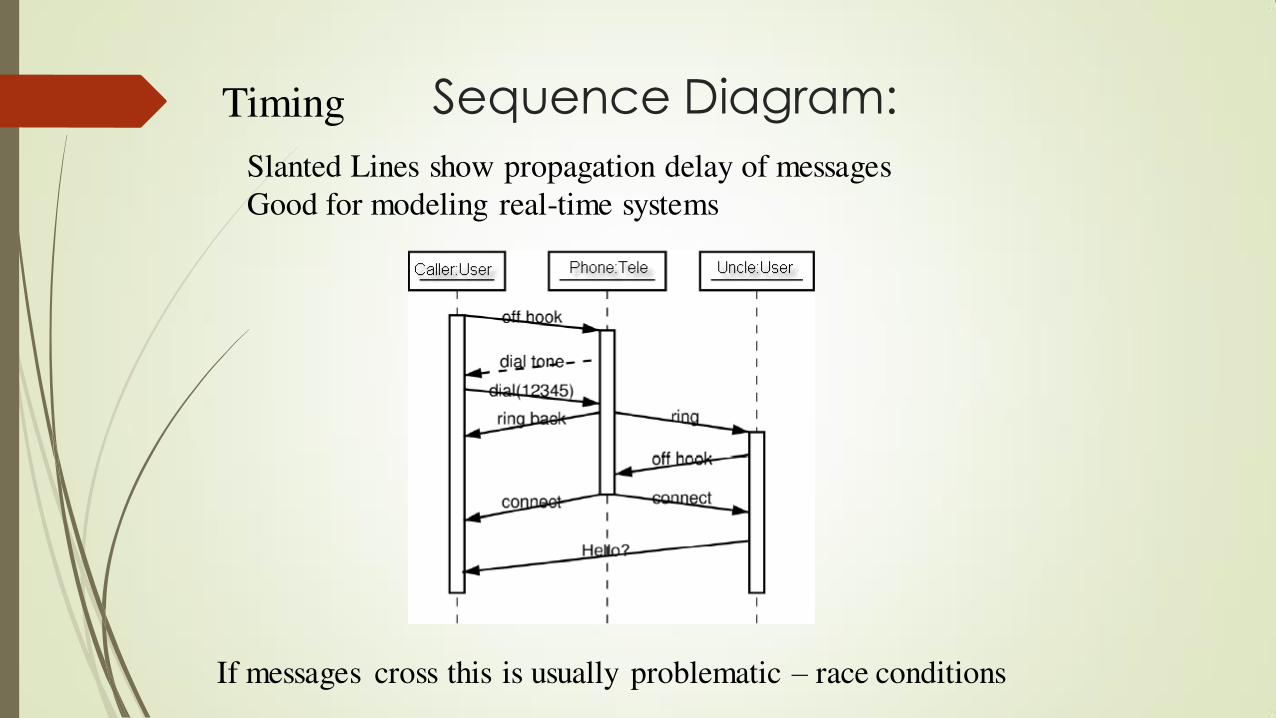
Sequence Diagram: Timing
Slanted Lines show propagation delay of messages
Good for modeling real-time systems
If messages cross this is usually problematic – race conditions
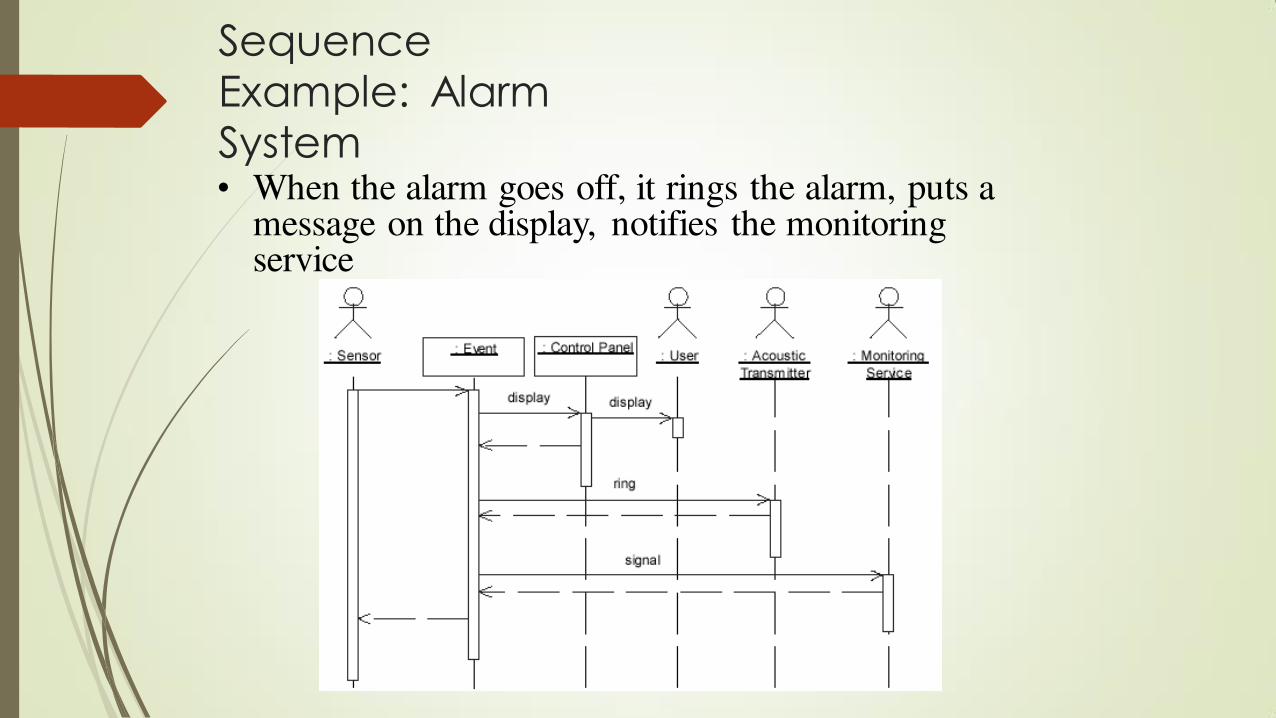
Sequence Example: Alarm System • When the alarm goes off, it rings the alarm, puts a
message on the display, notifies the monitoring service

Example
Hotel Reservation
Collaboration
Diagram
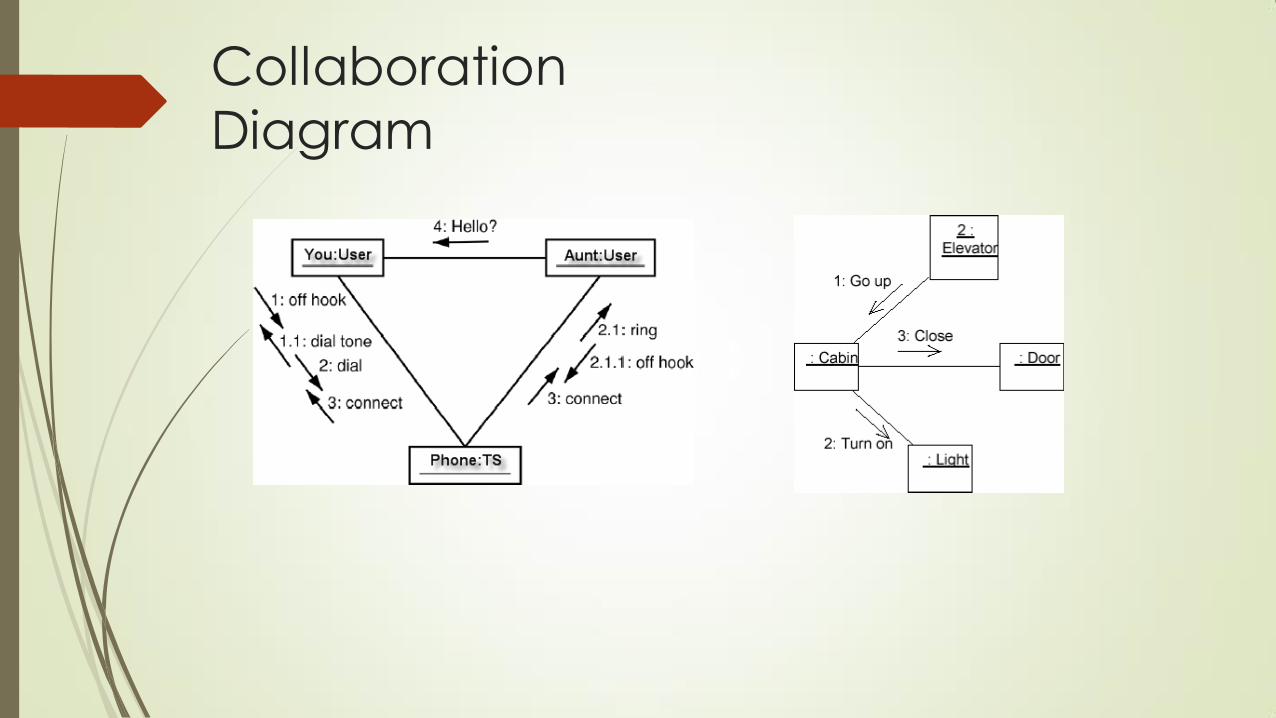
• Collaboration Diagrams show similar information to sequence diagrams, except that the vertical sequence is missing. In its place are:
– Object Links - solid lines between the objects that interact
– On the links are Messages - arrows with one or more message name that show the direction and names of the messages sent between objects
• Emphasis on static links as opposed to sequence in
the sequence diagram
Collaboration
Diagram
Activity
Diagrams • Fancy flowchart
– Displays the flow of activities involved in a single process
– States • •
Describe what is being processed
Indicated by boxes with rounded corners
– Swim lanes • Indicates which object is responsible for what activity
– Branch • •
Transition that branch
Indicated by a diamond
– Fork • •
Transition forking into parallel activities
Indicated by solid bars
– Start and End
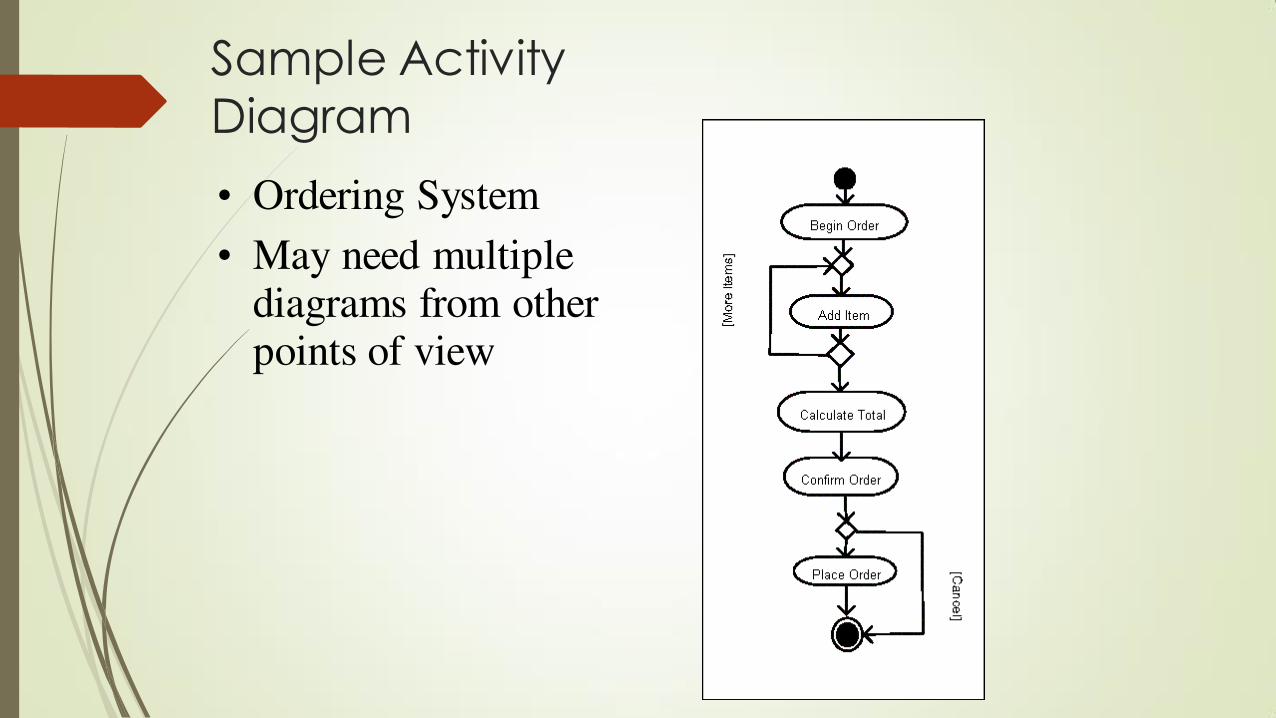
Sample Activity
Diagram
• Ordering System
• May need multiple diagrams from other points of view
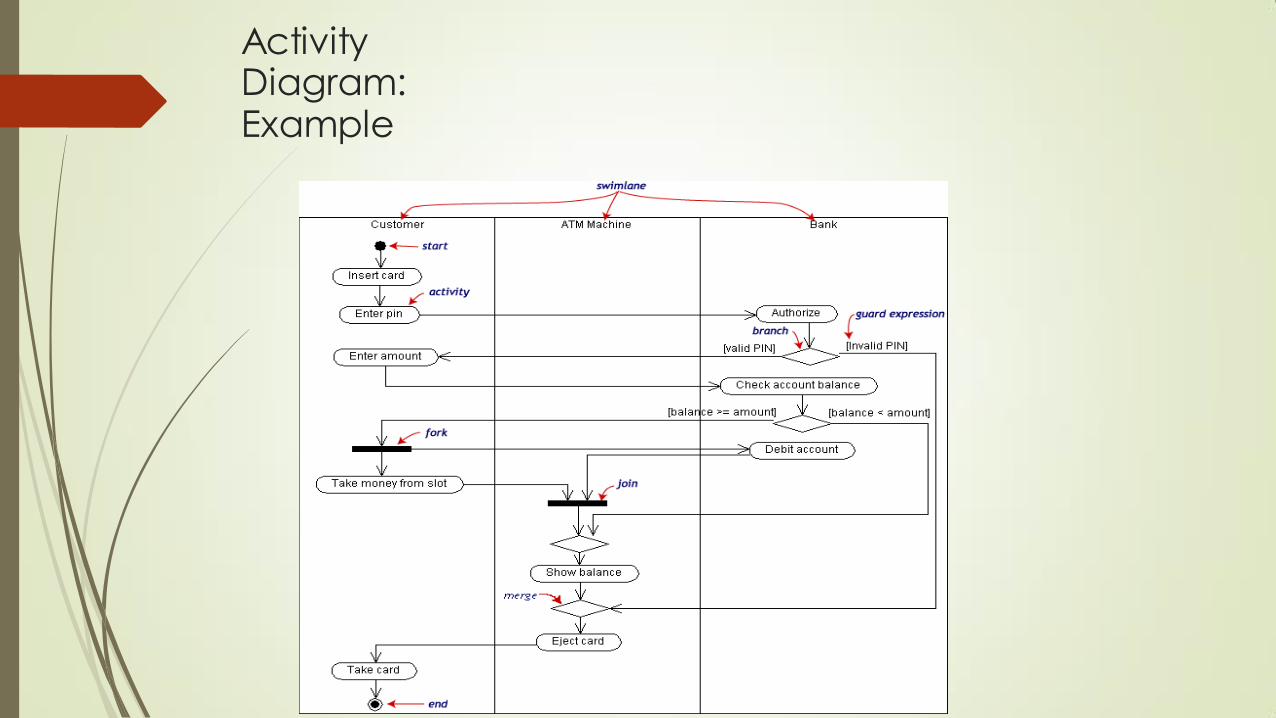
Activity Diagram: Example
State Transition
Diagrams
• Fancy version of a DFA
• Shows the possible states of the object and the transitions that cause a change in state – i.e. how incoming calls change the state
• Notation – States are rounded rectangles
– Transitions are arrows from one state to another. Events or conditions that trigger transitions are written beside the arrows.
– Initial and Final States indicated by circles as in the Activity Diagram
• Final state terminates the action; may have multiple final states
State
Representation • The set of properties and values describing the object
in a well defined instant are characterized by
– Name
– Activities (executed inside the state)
• Do/ activity
– Actions (executed at state entry or exit)
• Entry/ action
• Exit/ action
– Actions executed due to an event
• Event [Condition] / Action ̂ Send Event

Notation for States

Simple Transition Example

Simple State Examples...
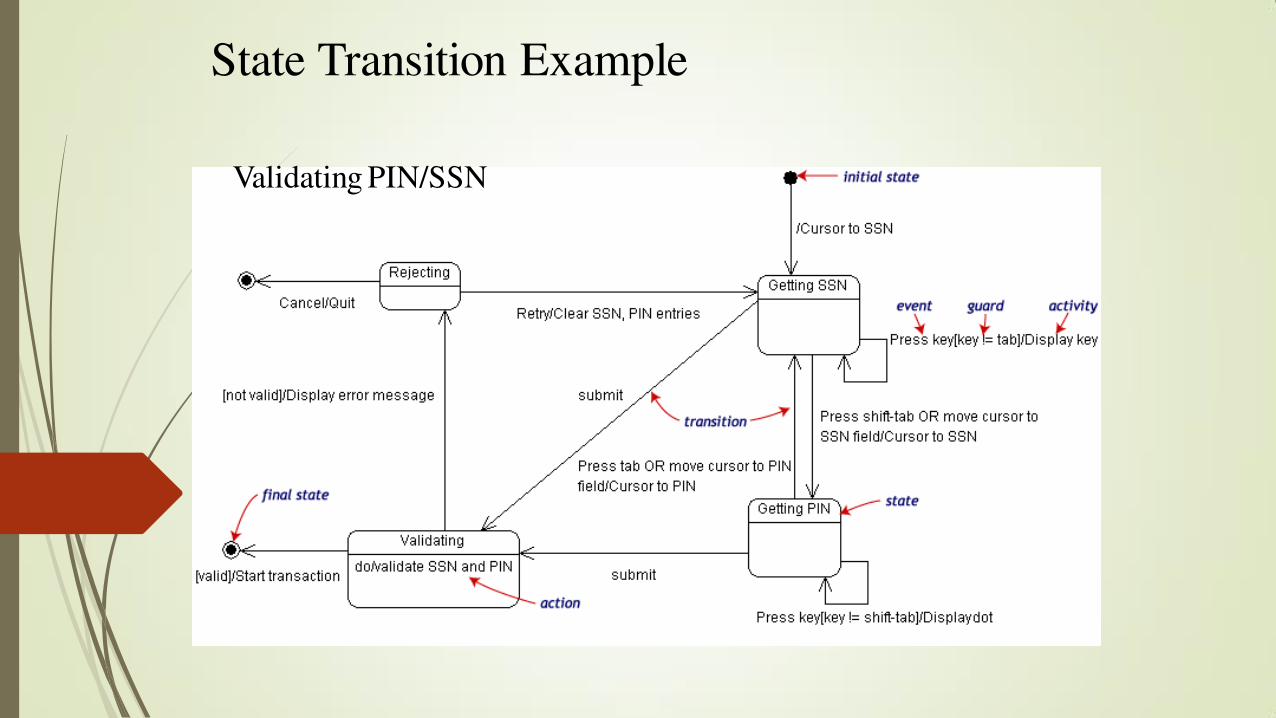
State Transition Example
Validating PIN/SSN

State Charts: Local Variables • State Diagrams can also store their own local
variables, do processing on them
• Library example counting books checked out and returned
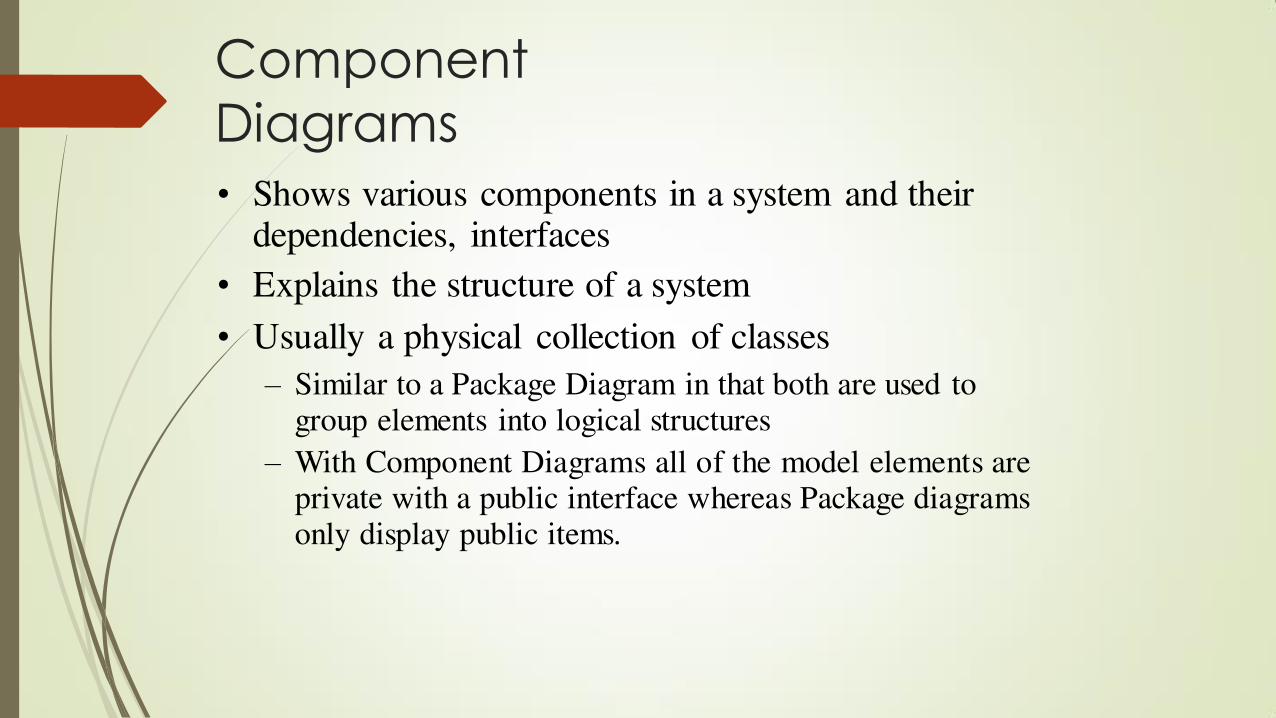
Component
Diagrams
• Shows various components in a system and their dependencies, interfaces
• Explains the structure of a system
• Usually a physical collection of classes
– Similar to a Package Diagram in that both are used to group elements into logical structures
– With Component Diagrams all of the model elements are private with a public interface whereas Package diagrams only display public items.
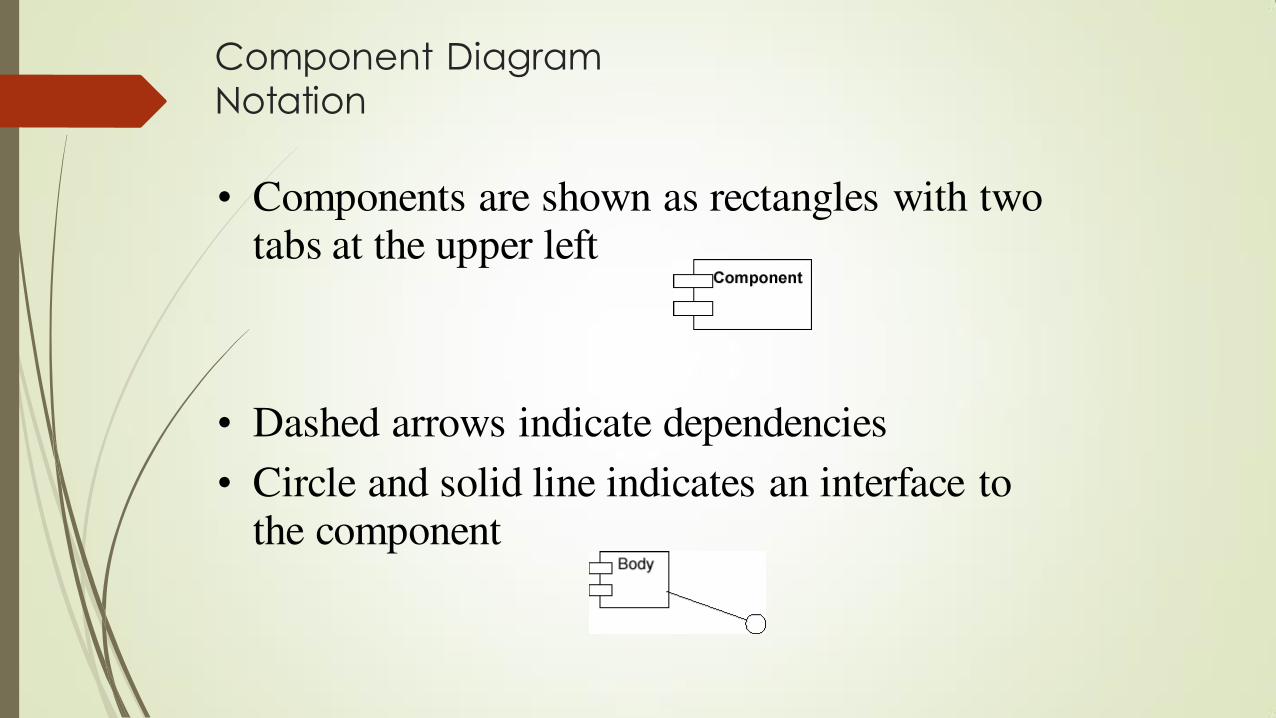
Component Diagram Notation
• Components are shown as rectangles with two tabs at the upper left
• Dashed arrows indicate dependencies
• Circle and solid line indicates an interface to the component
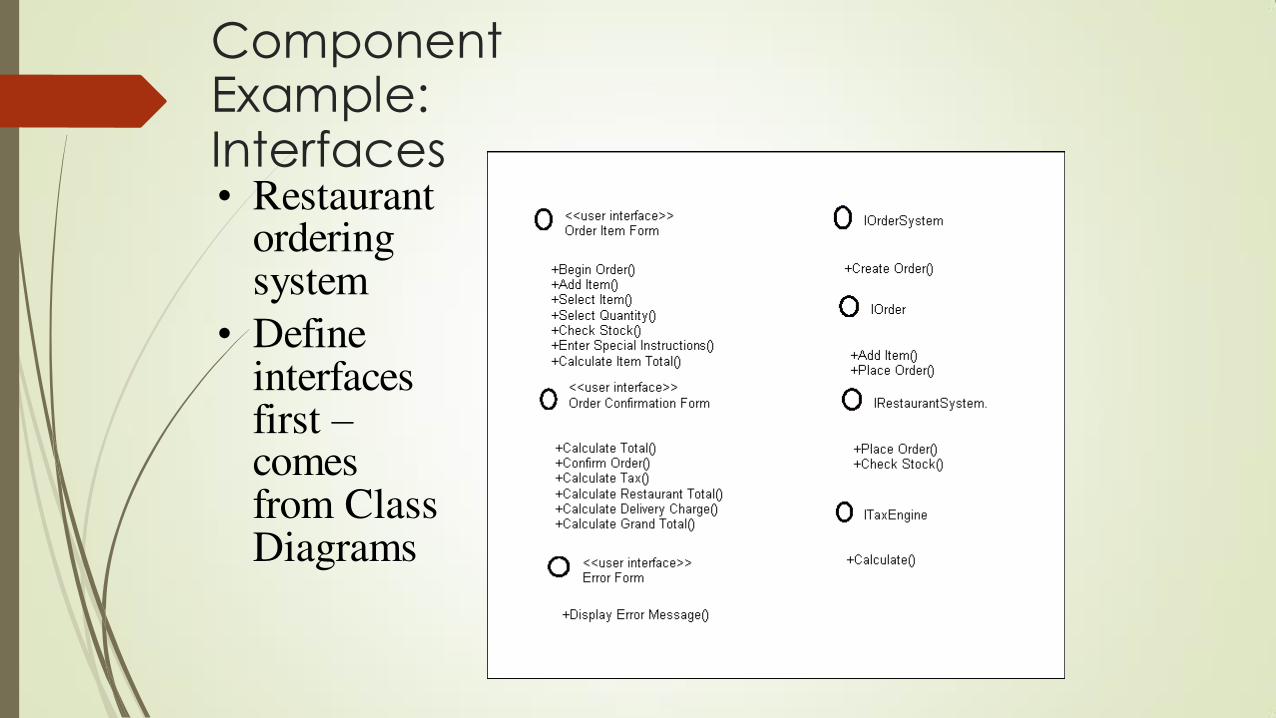
Component Example: Interfaces • Restaurant
ordering system
• Define interfaces first – comes from Class Diagrams
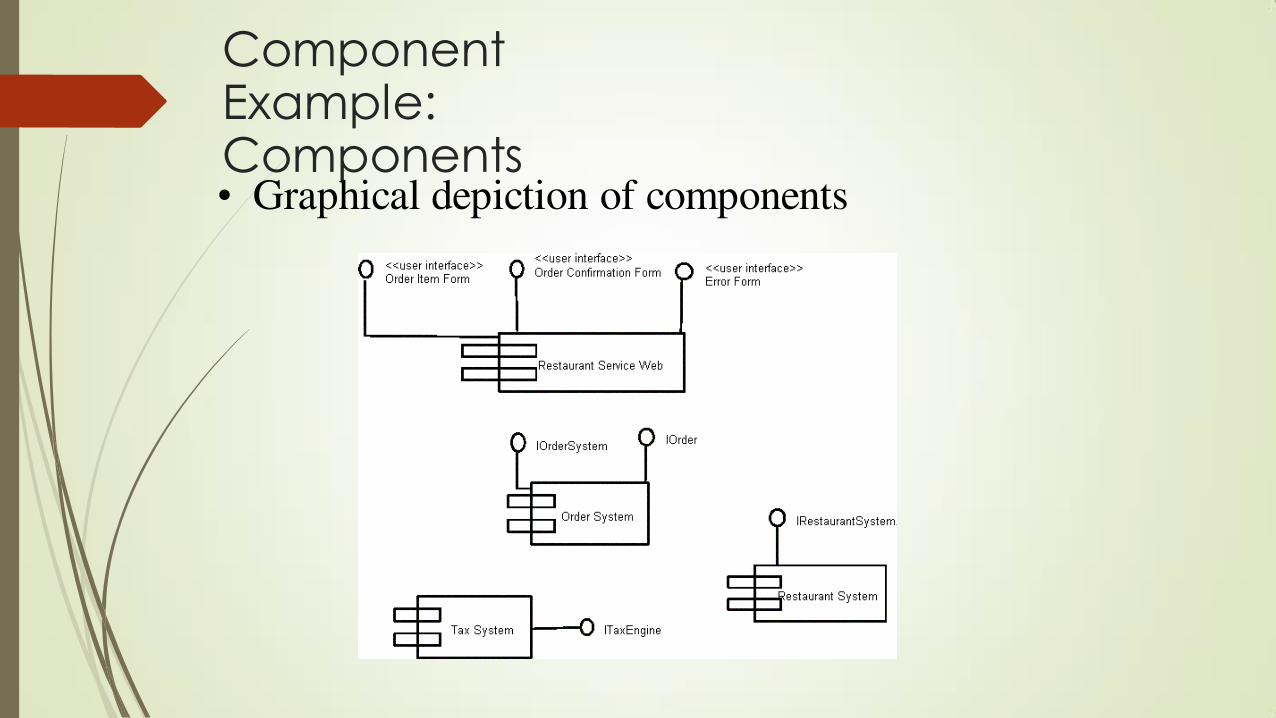
Component Example: Components • Graphical depiction of components

Component Example: Linking
• Linking components with dependencies
Deployment
Diagrams
• Shows the physical architecture of the hardware and software of the deployed system
• Nodes
– Typically contain components or packages
– Usually some kind of computational unit; e.g. machine or device (physical or logical)
• Physical relationships among software and hardware in a delivered systems
– Explains how a system interacts with the external environment
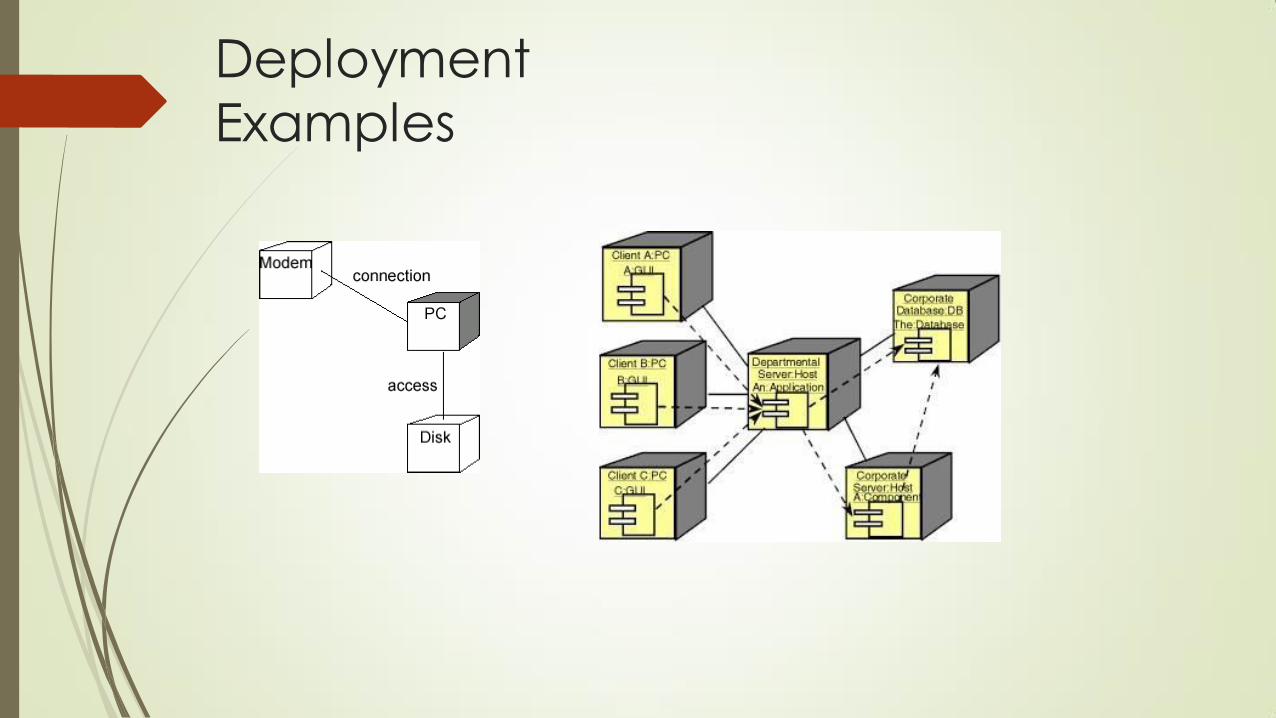
Deployment
Examples
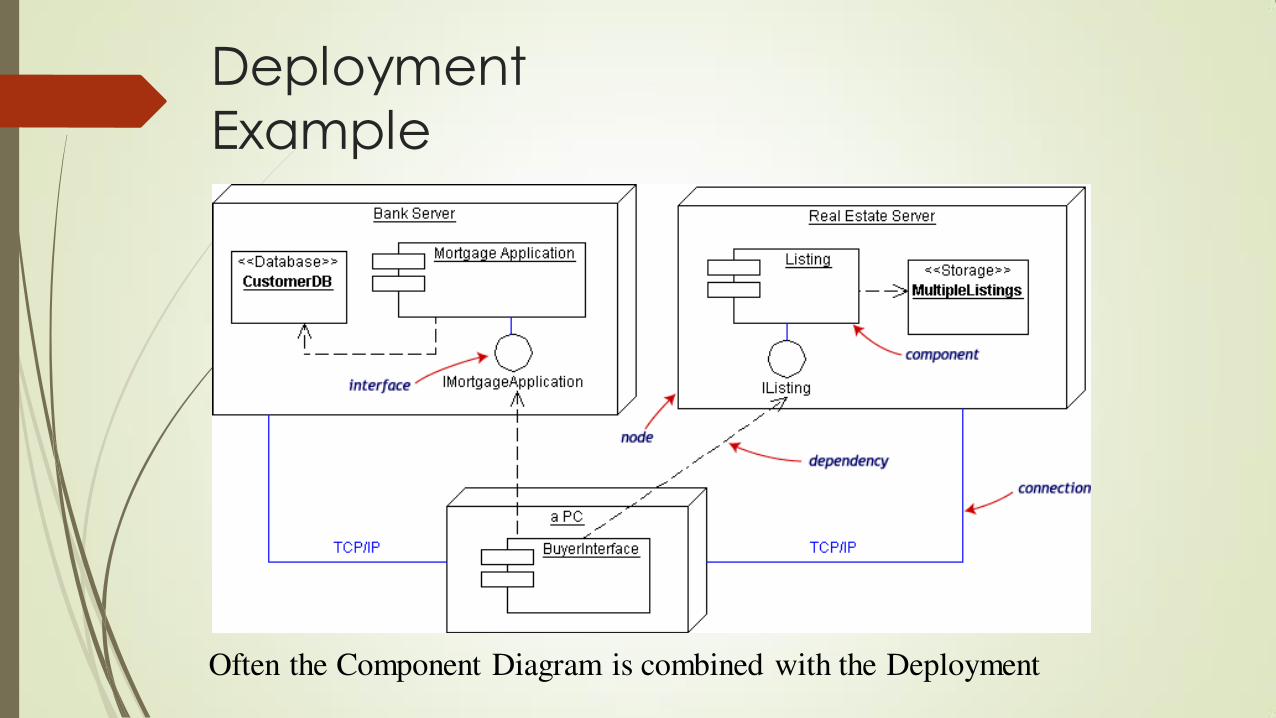
Deployment
Example
Often the Component Diagram is combined with the Deployment
Summary and
Tools
UML is a modeling language that can be used independent of
development
Adopted by OMG and notation of choice for visual modeling
http://www.omg.org/uml/
Creating and modifying UML diagrams can be labor and time intensiv
Lots of tools exist to help
Tools help keep diagrams, code in sync
Repository for a complete software development project
Examples tools Microsoft Visio, Dia
•