introductiond-scholarship.pitt.edu/.../sharbaughm_mphessay_12_2015.docx · web viewthe absolute...
TRANSCRIPT

QUANTIFYING THE IMPACT OF THE MEASLES VACCINE BY ESTIMATING THE
NUMBER OF MEASLES CASES PREVENTED FOR EACH STATE
FROM 1964 TO 2010
by
Michael Sharbaugh
B.S., Saint Francis University, 2008
Submitted to the Graduate Faculty of
Department of Epidemiology
Graduate School of Public Health in partial fulfillment
of the requirements for the degree of
Master of Public Health
University of Pittsburgh
2015

ii
UNIVERSITY OF PITTSBURGH
GRADUATE SCHOOL OF PUBLIC HEALTH
This essay is submitted
by
Michael Sharbaugh
on
December 18, 2015
and approved by
Essay Advisor:Maria Mori Brooks, PhD ______________________________________Associate Professor of Epidemiology and BiostatisticsVice Chair for Education, Department of EpidemiologyGraduate School of Public HealthUniversity of Pittsburgh
Essay Reader:Wilbert van Panhuis, MD PhD ______________________________________Assistant ProfessorAffiliated Faculty, Public Health Dynamics LabDepartment of EpidemiologyGraduate School of Public HealthUniversity of Pittsburgh
Essay Reader:Julia Driessen, PhD ______________________________________Assistant Professor, Health Policy and ManagementAssistant Professor (secondary), EconomicsAssistant Professor (secondary), Biomedical InformaticsAffiliated Faculty, Health Policy InstituteGraduate School of Public HealthUniversity of Pittsburgh

iii
Copyright © by Michael Sharbaugh
2015

ABSTRACT
iv

Measles is regarded as one of the most contagious infectious diseases, but since the
licensure of the vaccine in 1963, the incidence of measles has decreased significantly. Although
the United States achieved measles elimination in 2000, there are still outbreaks due to pockets
of low vaccination coverage and imported cases. This essay will provide background information
about the virus, the disease, the vaccine, and current trends in measles vaccination. The objective
of the analysis in this essay was to estimate, at the state level, the number of measles cases
prevented since the licensure of the vaccine.
Using data from before the vaccine was licensed, 20 statistical models were assessed
based on their predictive ability, with the best model being used to estimate the number of
measles cases there would have been without the vaccine. The different approaches examined
were descriptive statistics, linear regression, moving averages, and time series models. The
estimated number of measles cases from 1964-2010 were compared to the observed number of
measles cases to estimate the number of measles cases prevented.
The best fit model estimated that the total number of measles cases prevented from 1964-
2010 in the United States was over 23 million, while the number of cases prevented at the state
level ranged from 4.1 million to only 155.
The best predictive statistical model demonstrated that the measles vaccine prevented
millions of cases across the United States and that the impact of the vaccine varied among the
v
Maria Mori Brooks, PhD
QUANTIFYING THE IMPACT OF THE MEASLES VACCINE BY ESTIMATING THE NUMBER OF MEASLES CASES PREVENTED FOR EACH
STATE FROM 1964 TO 2010
Michael Sharbaugh, MPH
University of Pittsburgh, 2015

states. The public health significance of this analysis is that it adds to the analytical evidence
demonstrating the significant effect that the measles vaccine had in preventing the disease, which
can be used to support the recommendations for high coverage rates of vaccinations or to support
the widespread implementation of new vaccines.
vi

TABLE OF CONTENTS
1.0 INTRODUCTION.........................................................................................................1
1.1 MEASLES.............................................................................................................1
1.1.1 The Virus...........................................................................................................1
1.1.2 Pathogenicity.....................................................................................................2
1.1.3 Clinical Presentations.......................................................................................3
1.1.4 Complications...................................................................................................3
1.2 THE MEASLES VACCINE................................................................................4
1.3 CURRENT TRENDS IN MEASLES VACCINATION...................................6
1.4 OBJECTIVE.......................................................................................................10
2.0 METHODS..................................................................................................................11
2.1 MODELS.............................................................................................................12
2.2 ASSESSMENT OF MODELS...........................................................................15
2.3 ESTIMATING THE NUMBER OF MEASLES CASES PREVENTED......15
3.0 RESULTS....................................................................................................................17
3.1 ASSESSMENT OF THE MODELS.................................................................17
3.2 ESTIMATING THE NUMBER OF CASES PREVENTED..........................18
4.0 DISCUSSION..............................................................................................................20
APPENDIX A: TOTAL MEASLE CASES...............................................................................24
vii

APPENDIX B: STATE DIFFERENCE AND PERCENT ERROR.......................................27
BIBLIOGRAPHY........................................................................................................................29
viii
LIST OF TABLES
Table 1. Summary of Vaccination Coverage Reports.....................................................................9
Table 2. Absolute U.S. Difference of Each Model........................................................................17
ix

LIST OF FIGURES
Figure 1. Total U.S. Measles Cases from 1930-2010......................................................................5
Figure 2. Total Measles Cases Prevented by State, 1964-2010.....................................................19
Figure 3. Total Measles Cases from 1930-1950 for Northeast Census Region.............................24
Figure 4. Total Measles Cases from 1930-1950 for Midwest Census Region..............................24
Figure 5. Total Measles Cases from 1930-1950 for South Atlantic Census Region.....................25
Figure 6. Total Measles Cases from 1930-1950 for South Central Census Region......................25
Figure 7. Total Measles Cases from 1930-1950 for West Census Region....................................26
Figure 8. State Difference for Model A during the Test Period of 1951-1963.............................28
Figure 9. Percent Error for Model A during the Test Period of 1951-1963..................................28
x

PREFACE
I would like to acknowledge Proma Paul, PhD candidate in Epidemiology, University of
Pittsburgh; Jenna Geiman and Linda Huang, First Experience in Research students, University of
Pittsburgh; and Lindsay Bow, MPH Epidemiology, University of Pittsburgh. The data that they
entered and digitized, as part of an effort for Project Tycho at the University of Pittsburgh, was
used in this analysis.
xi

1.0 INTRODUCTION
Since 2013, the CDC has identified 39 measles outbreaks, including a multi-state
outbreak in 2015 that originated at Disneyland in California. 1 The outbreak in California
included over 125 cases and spread to seven states, with the original source still being unknown.
2 In July, 2015, the United States had the first death due to measles in 12 years, when a woman in
Washington State died after she contracted measles during an outbreak in the previous spring. 3
In 2000, the United States achieved measles elimination, which is defined as the interruption of
year-round endemic measles transmission.4 However, there is still a continued occurrence of
outbreaks and cases continue due to international travel and pockets of the population that are
unvaccinated. 5,6 This essay will provide background information about the measles virus and
disease, the measles vaccine, current trends in measles vaccination, and presents an evaluation of
statistical methods used to demonstrate the effectiveness of the measles vaccine at preventing the
disease.
1

1.1 MEASLES
1.1.1 The Virus
The measles virus is a spherical, enveloped, single stranded, negative-sense RNA virus of
the Paramyxoviridae family, Morbillivirus genus. 7,8 The potential time in which clinical measles
disease was first recognized varies from the 7th century up to potentially the 11th or 12th century. 9-
12 The virus consists of about 16,000 nucleotides as well as eight encoded proteins. Of the
proteins, the hemagglutinin and fusion surface proteins are central in regard to causing infection.
The hemagglutinin protein bonds with either the CD46 cell receptors, which are found on all
nucleated cells in humans, or CD150 cell receptors, which are found on T and B lymphocytes,
and the fusion protein ensures the connection between the virus and the cell membrane. 7-9,13
Measles is a unique virus in that there is only one antigenic type of the virus, meaning that there
has been no mutation in the surface proteins of the virus. The lack of mutations of the virus help
ensure lifelong immunity, because any future exposures to the measles virus will contain the
same surface proteins that was targeted by the initial immune response. 7-9
1.1.2 Pathogenicity
Measles is regarded as one of the most contagious infectious diseases in the world, with a
secondary attack rate of 90% in susceptible populations and a basic reproductive number of 15-
20. 12,14 The basic reproductive number reflects the number of new infections caused by one
person who is infectious with the disease.7 Measles is spread through airborne droplets and can
remain in the air for up to two hours.7,9 Due to the high secondary attack rate and time in which
2

measles can remain in the area after an infected person has left, an outbreak can occur when only
10% of the population are susceptible. 7,14
After the upper respiratory tract, the virus replicates in the lymphatic tissue, where it then
spreads through the blood to other sites in the body such as the lymph nodes, skin, kidney,
gastrointestinal tract, and liver. The spread to other tissues usually occurs within five to seven
days of exposure. 7-9
1.1.3 Clinical Presentations
Although virus replication occurs within days of being exposed to the virus, the
incubation period is relatively long at between 10 and 12 days. The initial symptoms include an
increasing fever that can peak between 103-105o F, cough, runny nose, and conjunctivitis.7-10
Small blueish-white lesions called Koplik spots appear in the mouth a few days before the onset
of the rash.7-10 Probably the most noted symptom of measles is the rash that occurs, on average,
14 days after exposure.7-10 The rash begins at the hairline and spreads downward over the body, is
characterized as being red with small bumps, and lasts between three and six days.7-10 Those with
measles are contagious from two days before symptoms appear until four days after the onset of
the rash. 9,10,12
1.1.4 Complications
Between 30% and 40% of measles cases have complications. 8-10,12 Complications occur
most frequently in those who are under the age of 5 or over 20 years of age. 8-10,12 Complications
can include a middle ear infection, diarrhea, pneumonia, seizures, or encephalitis, with
3

pneumonia being the most common complication.8-10,12 From 1985 through 1992, the case fatality
rate of measles was approximately 0.3% in the United States, with the majority of deaths being
caused from pneumonia. 9,12
1.2 THE MEASLES VACCINE
The measles vaccine was first licensed in 1963. 8,9,15 The vaccine was comprised of a live
attenuated strain of measles, called the Edmonston B strain, which was first isolated by John
Enders and Thomas Peebles in 1954.8,9,15 In the early 1960’s, there was also an inactivated
measles vaccine, but that version of the vaccine was withdrawn in 1967 due to it causing atypical
measles in children who received the vaccine. Further attenuated strains of Edmonston lineage
have been used in the vaccine, but a more attenuated Edmonston-Enders strain is the only one
currently licensed in the United States. 8,9
Since 1971, the measles vaccine has been included in a combination vaccine along with
Mumps and Rubella (MMR). In 2005, the MMR-V vaccine became available, which additionally
includes the varicella vaccine.8,9 The Centers for Disease Control and Prevention (CDC)
currently recommends receiving two doses of the MMR vaccine, once between 12-15 months of
age, and the second dose coming between four and six years of age, unless there is a medical
condition that would cause a reaction to the vaccine.16 The second dose is recommended since
about 2-5% of individuals who receive the first dose do not respond to it, but about 99% of those
who receive two doses have serologic immunity.9 Shortly after the measles vaccine was licensed,
there was a 95% decrease in the incidence of measles.9
4

Figure 1. Total U.S. Measles Cases from 1930-2010
With the MMR vaccine, there are a few adverse events and reactions that can occur. In
25% of susceptible women, joint pain does occur, though that event is due to the rubella
component of the MMR vaccine.9 Allergic reactions such as rash, pruritus, and purpura are
associated with the mumps component of the MMR vaccine, but do not commonly occur.9 The
two most common adverse reactions are fever, which occurs in 5-15% of those receiving the
vaccine, rash, which occurs 5% of the time.9 Fever and rash typically appear between 7 and 12
days after receiving the MMR vaccine.9 Thrombocytopenia may occur within 2 months after
receiving the vaccine, but it has been shown that only 1 case occurs per 30,000-40,000 persons
vaccinated.9
Although the CDC can issue recommendations regarding the schedule of vaccines, the
power to implement laws about mandatory vaccinations lies with the individual states.17 In all
states, at least one dose of the MMR vaccine is required prior to students beginning kindergarten.
18 Even with the mandatory requirements to get the MMR vaccine, all states except for
5

California, West Virginia, and Mississippi allow for religious exemptions, and twenty states
allow a personal belief exemption. The states that allow for personal belief exemptions are
Arizona, Arkansas, California, Colorado, Idaho, Louisiana, Maine, Michigan, Minnesota,
Missouri, North Dakota, Ohio, Oklahoma, Oregon, Pennsylvania, Texas, Utah, Vermont,
Washington and Wisconsin. In the 2015, both California and Vermont passed laws that will
repeal the personal belief exemption, although Vermont will still allow religious exemptions.19
1.3 CURRENT TRENDS IN MEASLES VACCINATION
Using data from the 2014 National Immunization Survey (NIS), Hill et al. published a
report in the CDC’s Morbidity and Mortality Weekly Report on vaccination coverage for
children aged 19-35 months.20 The NIS data are collected through landline and cell phone
surveys, where households with age-eligible children are interviewed about their children’s
vaccination status and asked to provide consent to contact the children’s vaccine provider, who is
contacted to validate household responses, if consent is obtained. The information collected
through the survey, which included 14,893 children in 2014, is weighted to be representative of
all U.S. children aged 19-35 months. This sample is used to calculate estimates of vaccine
coverage for the U.S. 20 For 2014, it was found that changes between 2013 and 2014 were small
and that 91.5% of children had at least one dose of the MMR vaccine. Since 2010 which was the
first year included in the Hill report, the lowest MMR coverage estimate was 90.8% in 2012. In
regard to state level MMR coverage, Maine had the highest estimated coverage with 97.2% of
children having received at least one dose, while Arizona had the lowest estimated coverage at
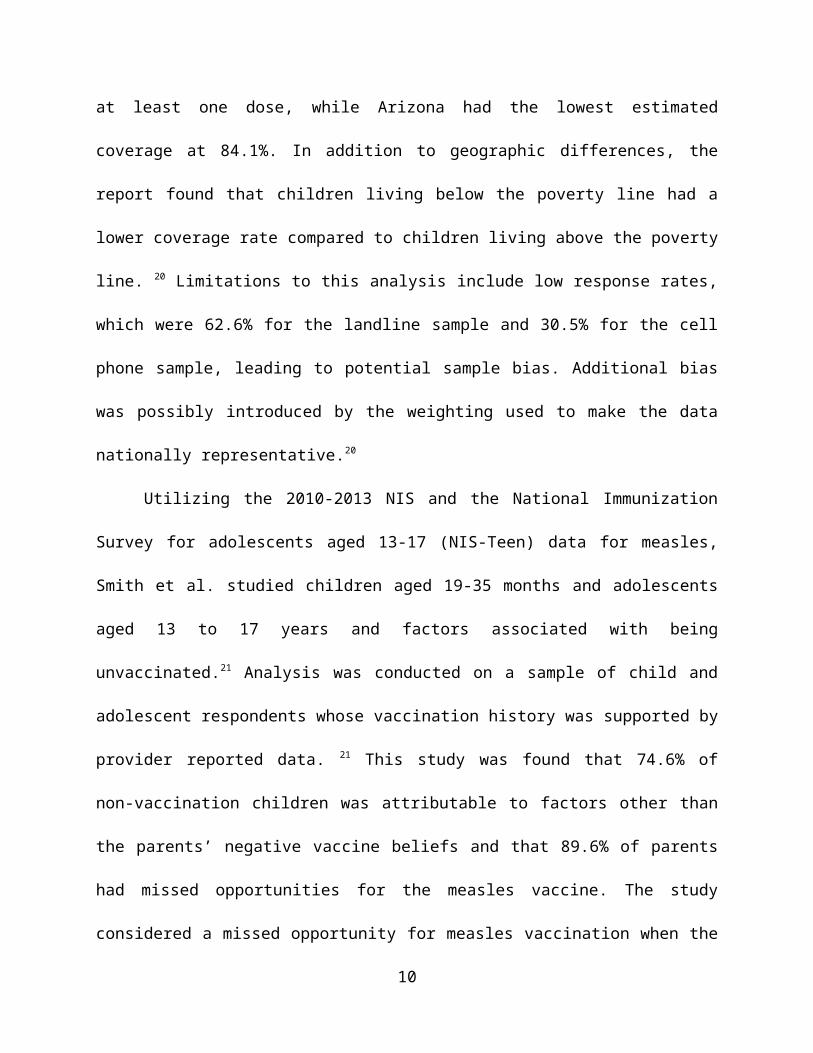
84.1%. In addition to geographic differences, the report found that children living below the
6

poverty line had a lower coverage rate compared to children living above the poverty line. 20
Limitations to this analysis include low response rates, which were 62.6% for the landline
sample and 30.5% for the cell phone sample, leading to potential sample bias. Additional bias
was possibly introduced by the weighting used to make the data nationally representative.20
Utilizing the 2010-2013 NIS and the National Immunization Survey for adolescents aged
13-17 (NIS-Teen) data for measles, Smith et al. studied children aged 19-35 months and
adolescents aged 13 to 17 years and factors associated with being unvaccinated.21 Analysis was
conducted on a sample of child and adolescent respondents whose vaccination history was
supported by provider reported data. 21 This study was found that 74.6% of non-vaccination
children was attributable to factors other than the parents’ negative vaccine beliefs and that
89.6% of parents had missed opportunities for the measles vaccine. The study considered a
missed opportunity for measles vaccination when the child did not receive the measles vaccine,
but received at least one dose of another recommended vaccine after 12 months of age.21
Furthermore, of the non-vaccinees, only 34.6% of parents reported refusing vaccine doses. Of
the entire study population, 5.5% of parents reported not believing that vaccines are necessary to
protect children’s health. Within that 5.5% of parents, 77.6% had refused vaccine doses for their
children.21 These results indicate that other factors may be involved in unvaccinated children and
not just parental beliefs. Limitations of this study were low response rates to the survey and
underrepresentation of survey participants from the states with larger populations.21
The Hill et al. and Smith et al. studies focused on children aged 19-35 months, which is
typically before the start of kindergarten. Seither et al. reported on the vaccine coverage of
children in kindergarten for the 2014-15 school year.22 Immunization coverage data was
collected and submitted by each state to the CDC. Data collection methods varied between states,
7

as some states collected their data through a census of all schools, while other states only
collected data from a sample of schools. 22 For the 2014-2015 school year, the median coverage
of 2 doses of the MMR vaccine was 94.0%, while the median estimate of students with any
exemption was 1.7%. The estimated coverage for the MRR vaccine was 85.9% in Colorado to
99.2% in Mississippi, with 17 states reporting coverage rates greater than 95% and seven states
below 90% coverage. The estimated range for students with any exemption, was from 6.5% in
Idaho to <0.1% in Mississippi.22 Of those students with exemptions, the majority of the
exemptions were non-medical, as the state with the highest estimated rate of medical exemptions
was Washington State, at only 1.2%. Every other state had below 1% of students with medical
exemptions. There were five states with an estimated rate of non-medical exemptions greater
than 5%. Those states were Michigan (5.0%), Colorado (5.4%) Oregon (5.8%), Vermont
(5.9%) ,and Idaho (6.2%).22 The limitations for this report were the variations within each state’s
data collection and reporting; a lack of transparency within exemptions, since a student can have
an exemption for one or all required vaccines, which was not captured in these data; data only
being reflective of the vaccination status at the beginning of the school year; and the adjustments
that were made to account for nonresponses.22
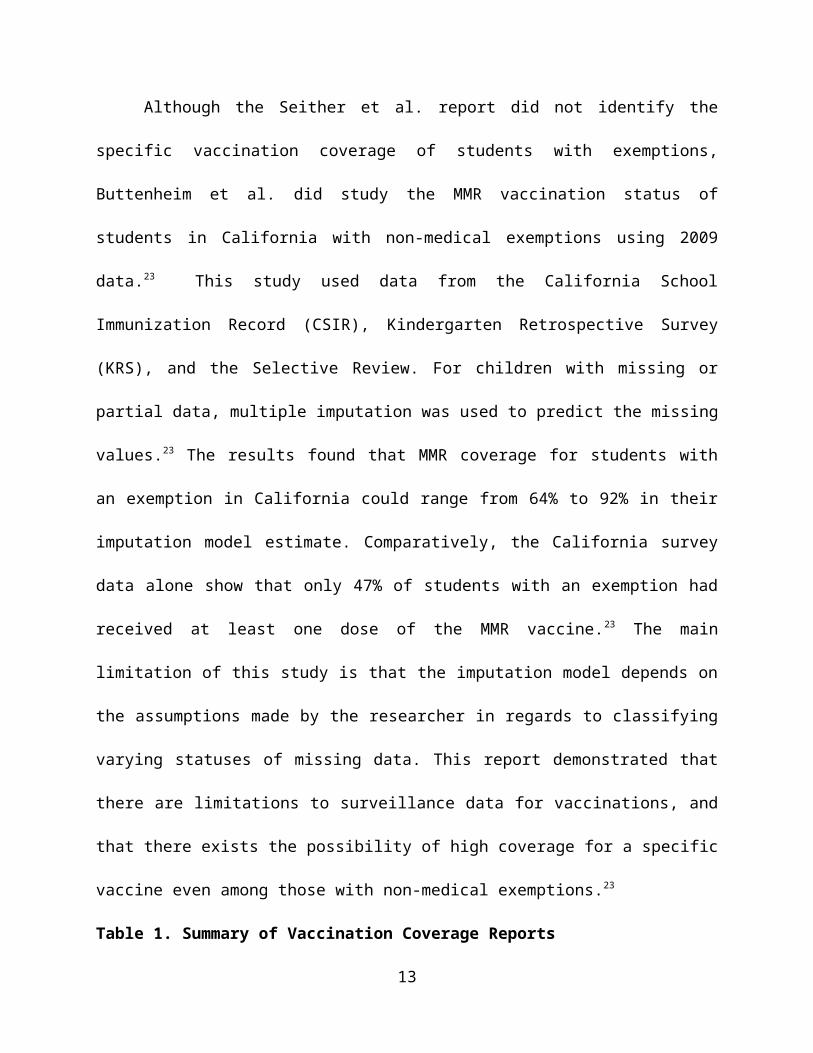
Although the Seither et al. report did not identify the specific vaccination coverage of
students with exemptions, Buttenheim et al. did study the MMR vaccination status of students in
California with non-medical exemptions using 2009 data.23 This study used data from the
California School Immunization Record (CSIR), Kindergarten Retrospective Survey (KRS), and
the Selective Review. For children with missing or partial data, multiple imputation was used to
predict the missing values.23 The results found that MMR coverage for students with an
exemption in California could range from 64% to 92% in their imputation model estimate.
8

Comparatively, the California survey data alone show that only 47% of students with an
exemption had received at least one dose of the MMR vaccine.23 The main limitation of this
study is that the imputation model depends on the assumptions made by the researcher in regards
to classifying varying statuses of missing data. This report demonstrated that there are limitations
to surveillance data for vaccinations, and that there exists the possibility of high coverage for a
specific vaccine even among those with non-medical exemptions.23
Table 1. Summary of Vaccination Coverage ReportsAuthors Data Source Population Conclusions
Hill, et al.20 2014 NIS U.S. children aged 19-35 months
- 91.5% of children had at least one dose of the MMR - State coverage rates for one dose of MMR were between 84.1-97.2%- Children living below the poverty line had a lower coverage rate compared to children living above the poverty line
Smith, et al.21 2010-2013 NIS and NIS-Teen
U.S. children aged 13-35 months and
adolescents aged 13-17 years
- 74.6% of non-vaccinees were due to factors other than a parents’ negative vaccine beliefs- 89.6% had missed opportunities for the measles vaccine- 5.5% of parents reported not believing that vaccines are necessary to protect children’s health
Seither, et al.22 2014-2015 School Year,
CDC
U.S. kindergarten students
- Median coverage of 2 doses of the MMR vaccine was 94.0%- Median estimate of students with any exemption was 1.7%
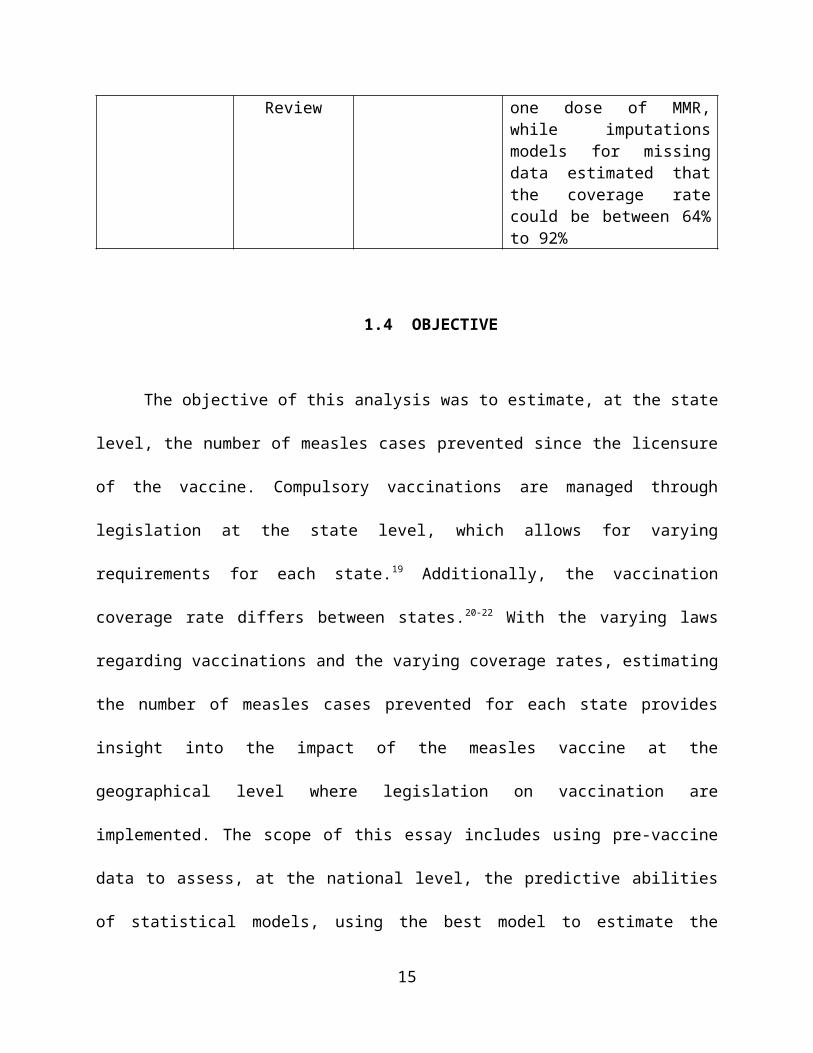
Buttenheim, et al.23 2009 CSIR, KRS, and Selective Review
California school students
Of students with an exemption, data showed 47% received one dose of MMR, while imputations models for missing data estimated that the coverage rate could be
9

between 64% to 92%
1.4 OBJECTIVE
The objective of this analysis was to estimate, at the state level, the number of measles
cases prevented since the licensure of the vaccine. Compulsory vaccinations are managed
through legislation at the state level, which allows for varying requirements for each state.19
Additionally, the vaccination coverage rate differs between states.20-22 With the varying laws
regarding vaccinations and the varying coverage rates, estimating the number of measles cases
prevented for each state provides insight into the impact of the measles vaccine at the
geographical level where legislation on vaccination are implemented. The scope of this essay
includes using pre-vaccine data to assess, at the national level, the predictive abilities of
statistical models, using the best model to estimate the number of measles cases there would
have been had the vaccine not been licensed, and comparing that estimate to the observed
measles cases to estimate the number of cases prevented for each state and the District of
Columbia from 1964-2010.
10
2.0 METHODS
The approach to this analysis was to begin with straightforward models to predict the
number of measles cases prevented and methodically progress through various types of more
sophisticated models. Although the plots of measles cases over time (Appendix A) could lead to
the conclusion that a time series model would be the only best approach, this analysis was aimed
at testing various approaches without an a priori preference in order to determine which model
had the best predictive capability based on a defined metric.
The final estimate of the number of measles cases prevented after licensure of the
measles vaccine was determined by using parameters from models fit using data prior to the
licensure of the vaccine. Due to forecasting beyond the years included in the model, the models
were evaluated in a similar manner. This involved using a training and a test period for the data
prior to vaccine licensure. The training period were the years in which the model parameters are
fit. The test period were the years after the training period, where the parameters of the training
period were applied to produce an estimate used to test the predictive ability of the model. The
training period of the models was 1930-1950, while the test period was 1951-1963, as 1963 was
the year in which the measles vaccine was first licensed.8,9,15
For each model, unique parameters were developed for each state and the District of
Columbia. The unique parameters were used to develop a state specific estimate for the number
of measles cases. The models were fit using the number of cases as opposed to the incidence
11

rate. This was done because the desired outcome was a point estimate for the number of measles
cases prevented. Alaska and Hawaii were excluded from this analysis because these states only
had measles case data starting in 1950, which was the last year of the training period. The data
sources for this analysis were the US Census Bureau for population estimates and birth rates and
Project Tycho at the University of Pittsburgh for the counts of measles cases. 24-26 All analysis
was done using SAS version 9.4 (SAS Institute Inc., Cary, NC).
2.1 MODELS
A: The approach was descriptive statistics, specifically the mean. The mean of measles cases for
each state from 1930-1950 was calculated and used as the estimated number of cases in the test
period.
B: The approach was descriptive statistics, specifically the median. The median was used
because the median is less sensitive to extreme values.27 The median of measles cases for each
state from 1930-1950 was calculated and used as the estimated number of cases in the test
period.
C: The approach used was linear regression with a training period of 1930-1950. The regression
model fit was: Measles Cases = β0 + Year*β1.
D: The approach used was linear regression with a training period of 1930-1950. The regression
model fit was: Measles Cases = β0 + Year*β1 + (Birth Rate)*β2.
E: The approach used was linear regression with a training period of 1930-1950. The regression
model fit was: Measles Cases = β0 + Year*β1 + Population*β2.
12

F: The approach used was linear regression with a training period of 1930-1950. The regression
model fit was: Measles Cases = β0 + Year*β1 + (Under-10 Population)*β2.
Models G through N used shorter training periods than the other models tested. The
shorter training periods were used to test whether the most recent history was a better predictor
of the future.
G: The approach used was linear regression with a training period of 1941-1950. The regression
model fit was: Measles Cases = β0 + Year*β1.
H: The approach used was linear regression with a training period of 1941-1950. The regression
model fit was: Measles Cases = β0 + Year*β1 + (Birth Rate)*β2.
I: The approach used was linear regression with a training period of 1941-1950. The regression
model fit was: Measles Cases = β0 + Year*β1 + Population*β2.
J: The approach used was linear regression with a training period of 1941-1950. The regression
model fit was: Measles Cases = β0 + Year*β1 + (Under-10 Population)*β2.
K: The approach used was linear regression with a training period of 1946-1950. The regression
model fit was: Measles Cases = β0 + Year*β1.
L: The approach used was linear regression with a training period of 1946-1950. The regression
model fit was: Measles Cases = β0 + Year*β1 + (Birth Rate)*β2.
M: The approach used was linear regression with a training period of 1946-1950. The regression
model fit was: Measles Cases = β0 + Year*β1 + Population*β2.
N: The approach used was linear regression with a training period of 1946-1950. The regression
model fit was: Measles Cases = β0 + Year*β1 + (Under-10 Population)*β2.
13
Models O and P utilized a moving average. Since measles has a temporal trend of two to
five years8, moving averages were applied to potentially smooth out the year to year variation.
O: The approach used was a three-year moving average (MA) linear regression with a training
period of 1930-1950.
The model fit was: 3-Yr MA of Measles Cases = β0 + Year*β1.
P: The approach used was a five-year moving average (MA) linear regression with a training
period of 1930-1950.
The model fit was: 5-Yr MA of Measles Cases = β0 + Year*β1.
Models Q through T used a time series model, specifically, an Autoregressive Integrated
Moving Average (ARIMA) model. Within an ARIMA model, there are three variables; auto-
regressive (p), differencing (d), and moving average (q), and the model is often notated as (p d
q).
For an ARIMA model, the residual series needs to be stationary, which is independent of trends
over time. Differencing in the model addresses whether the data are stationary or non-stationary,
where stationary data requires no adjustment.28 A differencing factor of 1 was used for each
ARIMA model examined, which analyzed the change in measles cases from one year to the next.
A three year moving average was used for all ARIMA models examined, since model O resulted
in a more accurate estimate than model P.
Q: ARIMA model (1 1 3).
R: ARIMA model (2 1 3).
S: ARIMA model (3 1 3).
T: ARIMA model (4 1 3).
14

2.2 ASSESSMENT OF MODELS
Since the objective is to estimate the number of measles cases prevented after the
licensure of the vaccine, it is necessary to estimate the number of measles cases there would have
been without the vaccine. Due to this, the models, which were fit with observed data from 1930-
1950, were assessed based on their ability to accurately predict the number of measles cases in
the test period of 1951-1963 compared to the observed number of measles cases during that same
period of time.
The main metric used to assess the models was named the Absolute U.S. Difference,
which is defined as follows:
Absolute U.S. Difference =
The Absolute U.S. Difference measures the predictive ability of the model by the
absolute deviation across all states for the entire test period, as opposed to providing insight into
the predictive accuracy for each individual state or year. The model with the lowest Absolute
U.S. Difference will be considered the best fit model.
2.3 ESTIMATING THE NUMBER OF MEASLES CASES
PREVENTED
Once the best performing model was determined, the training period of the model was
expanded to 1930-1963. This model was used to predict measles cases for 1964 through 2010 for
each state. If the estimated number of cases was less than zero, it was assumed that the predicted
15
number of cases was zero. The number of cases prevented for each state was the sum of the
estimated cases minus observed cases from 1964 to 2010. If the estimated cases minus observed
cases was less than zero, then the number of cases prevented for that year was considered zero.
16

3.0 RESULTS
3.1 ASSESSMENT OF THE MODELS
After calculating the Absolute U.S. Difference for each model, it was found that Model A
was the best fit, as it had the lowest value of 1,573,474 cases difference. Model A was a linear
regression model, with a training period of 1930-1950, and only Year as an independent variable.
It was hypothesized that a shorter but more recent training period could improve the fit of the
model, but that hypothesis was not be supported by the results as models G through N had the
highest Absolute U.S. Difference values. In regard to the ARIMA models, model S, which was
the (3 1 3) model, was the best fit, being only 10,631 absolute cases different from model A.
Table 2. Absolute U.S. Difference of Each Model
17

Model Approach Training Period Prediction Variables Absolute U.S. DifferenceC Linear 1930-50 Year 1,573,474 S ARIMA 1930-50 (3 1 3) 1,584,105 O 3 Yr. Moving Avg. 1930-50 Year 1,665,464 D Linear 1930-50 Year + Birth_Rate 1,838,639 R ARIMA 1930-50 (2 1 3) 1,860,834 P 5 Yr. Moving Avg. 1930-50 Year 1,883,289 Q ARIMA 1930-50 (1 1 3) 1,972,334 T ARIMA 1930-50 (4 1 3) 1,983,089 E Linear 1930-50 Year + Population 2,076,022 A Descriptive 1930-50 Mean 2,173,259 B Descriptive 1930-50 Median 2,389,779 F Linear 1930-50 Year + U-10 Population 2,421,505 H Linear 1941-50 Year + Birth_Rate 4,075,265 G Linear 1941-50 Year 4,200,378 I Linear 1941-50 Year + Population 4,613,825 K Linear 1946-50 Year 5,413,662 J Linear 1941-50 Year + U-10 Population 5,846,119 M Linear 1946-50 Year + Population 10,723,979 L Linear 1946-50 Year + Birth_Rate 12,603,480 N Linear 1946-50 Year + U-10 Population 26,712,324
3.2 ESTIMATING THE NUMBER OF CASES PREVENTED
Using model A and a training period of 1930-1963, we estimated the number of measles
cases prevented per year for each state from 1964-2010. Overall, this model estimated that
23,718,957 measles cases were prevented across the United States since the licensure of the
vaccine. Texas was the state with the highest number of estimated cases prevented at 4,161,600.
The state with the lowest estimated number of cases prevented was Nebraska, with 155 estimated
cases prevented. The models for North Carolina and South Dakota did not estimate any measles
cases prevented. This occurred because model A estimated less than 0 cases per year for South
Dakota starting in 1964 and estimated less than 0 cases per year for North Carolina starting in
1965. In 1964, it was estimated that there would be 26 measles cases in North Carolina, which
18

was less than the 1,265 measles cases observed, so there were no prevented cases estimated in
1964.
Figure 2. Total Measles Cases Prevented by State, 1964-2010
19
4.0 DISCUSSION
Immunizations, including the measles vaccine, are regarded as one of the greatest public
health achievements of the 20th century.29 This analysis measured the impact of the measles
vaccine at both the national and state level. It also showed that the impact of the vaccine varied
by state. The public health significance of this analysis is that it adds to the analytical evidence
demonstrating the significant effect that the measles vaccine had in preventing the disease.
Analytical evidence of this nature can be used to support the recommendations for high
vaccination coverage or help justify the widespread implementation of new vaccines.
Model A estimated that the total number of measles cases prevented from 1964-2010 in
the United States was over 23 million, while the number of cases prevented at the state level
ranged from 4.1 million to only 155. Since model A was determined to be the best fit model, the
State Difference and Percent Error were calculated for this model during the test period
(Appendix B). These secondary metrics were used to provide more insight into the predictive
tendencies of the model at the state level.
After calculating the State Difference, it was found that there was a large variation with
the accuracy of the estimates between states during the test period. The states with the largest
deviation from zero in regard to number of cases were: New Jersey, which the model estimated
92,302 more cases than observed; Illinois, which the model estimated 96,683 fewer cases than
observed; Texas, which the model estimated 100,019 fewer cases than observed; New York,
20

which the model estimated 114,227 fewer cases than observed; and Tennessee, which the model
estimated 118,392 fewer cases than observed. Using the Percent Error, it was found that 34 of
the 49 models had a Percent Error of ±50%. The states with the most extreme Percent Errors
were Nebraska at 89.7%, the District of Columbia at 83.6%, New Hampshire at -87.7%, and
Nevada at -151.4%.
Overall, the Percent Error of model A for the 1951-1963 test period underestimated the
number of measles cases for 65% of the states. This leads to the conclusion that this model may
be conservative in the estimated number of measles cases prevented. Although an assumption for
this analysis was that the trend of measles cases for each state during the final training period of
1930 to 1963 was the same across the entire forecasting period of 1964 to 2010, a way to account
for the model A’s tendency to underestimate is to apply state specific adjustments to the trend of
the number of measles cases. These adjustments could potentially improve the accuracy of the
model.
In 2013, Van Panhuis et al. estimated that there were 18,528,663 measles cases prevented
since the licensure of the vaccine, which is comparable to the 23,718,957 cases prevented
estimated in this analysis.30 An article in Morbidity and Mortality Weekly Report by Whitney et
al. in 2014 estimated that from 1994-2013 there were 70,748,000 measles cases prevented. 31
Although the Whitney et al. estimate includes a much shorter period of time than this analysis or
the Van Panhuis paper, the estimated number of measles cases prevented is significantly higher.
Further, each estimate used a different statistical approach; liner regression for this analysis, the
weekly median incidence rate for the Van Panhuis et al. estimate, and a decision analysis birth
cohort model for the Whitney et al. estimate. 30,31 The variation between these estimates
demonstrate the difficulty, due to the wild dynamics associated with measles in the United
21

States, with applying statistical models to measles. Mathematical models have been used to study
measles dynamics, in particular in the United Kingdom, but dynamics in the United States seem
to be more chaotic compared to the United Kingdom and difficult to replicate even with
mathematical models.32
In addition to the potential for underestimating the number of measles cases and the wild
dynamics of measles in the United States, there is another limitation to this analysis. One of the
main assumptions for linear regression is independence among observations.27 This assumption
was tested by utilizing autocorrelation functions. Autocorrelation functions that decline slowly
over time are considered to be nonstationary, or independent of a trend over time.28 After
reviewing the autocorrelation function plots for each state, it was found that no state had a slow
decline over time, which indicates that a temporal trend exists, so the conclusion was it is likely
that the independence assumption among observations required for linear regression is violated
for these data.
Despite these limitations, this analysis improves the statistical rigor involved in
estimating the number of cases prevented compared to previous methods used. In 2013, Van
Panhuis et al. published a report that estimated the number of cases prevented for seven
infectious diseases, since the introduction of their respective vaccine. The method used to
estimate the number of cases was to apply the median weekly incidence rate pre-vaccine to the
weekly population post-vaccine. The use of the median assumed that the incidence of the
diseases would have remained unchanged had the vaccine not been introduced.30 By using linear
regression in this analysis, we incorporated the trends of measles incidence prior to the vaccine
into the estimates for each state, as opposed to assuming a consistent level of cases over time.
22
This analysis stops at providing an estimate for the number of measles cases prevented
for each state, however, the potential exists for further analysis to be conducted using these
results. Potential future analytical projects include assessing how various factors influenced the
number of measles cases prevented for each state. Some of these factors could include
compulsory vaccination laws, per capita income, population, birth rates, health care
expenditures, and vaccine program expenditures. Additionally, a cost estimate could also be
developed that demonstrates the economic savings linked to the measles vaccine, such as
prevented hospitalizations and other medical costs.
The objective of this analysis was to estimate the number of measles cases prevented for
each state since the vaccine was licensed. The best predictive statistical model demonstrated that
the measles vaccine prevented millions of cases across the United States and that the impact of
the vaccine varied among the states.
23

APPENDIX A: TOTAL MEASLE CASES
Figure 3. Total Measles Cases from 1930-1950 for Northeast Census Region
24

Figure 4. Total Measles Cases from 1930-1950 for Midwest Census Region
Figure 5. Total Measles Cases from 1930-1950 for South Atlantic Census Region
25

Figure 6. Total Measles Cases from 1930-1950 for South Central Census Region
Figure 7. Total Measles Cases from 1930-1950 for West Census Region
26
APPENDIX B: STATE DIFFERENCE AND PERCENT ERROR
We also used secondary metrics to measure the predictive accuracy of the best fit model,
which was model A. The State Difference and Percent Error metrics were calculated for each
state individually.
The State Difference is defined as follows:
State Difference =
The Percent Error is defined as follows:
Percent Error =
The absolute value was not applied to either metric in order to demonstrate if model A
had a tendency to over or under estimate the number of measles cases for each state during the
test period. Additionally, the Percent Error was utilized as a way to account for the differences in
observed measles cases and to provide a normalized metric of the model’s tendency to over or
under estimate measles cases for each state. Using Model A, the following figures were
generated for the State Difference and Percent Error:
27

Figure 8. State Difference for Model A during the Test Period of 1951-1963
Figure 9. Percent Error for Model A during the Test Period of 1951-1963
28
BIBLIOGRAPHY
1. Centers for Disease Control and Prevention. Measles Cases and Outbreaks. http://www.cdc.gov/measles/cases-outbreaks.html. Accessed October 7, 2015.
2. Zipprich J, Winter K, Hacker J, Xia D, Watt J, Harriman K. Measles outbreak--California, December 2014-February 2015. MMWR. Morbidity and mortality weekly report. Feb 20 2015;64(6):153-154.
3. McCarthy M. US sees first measles death in 12 years. BMJ (Clinical research ed.). 2015;351:h3653.
4. Measles - United States, 2011. MMWR. Morbidity and mortality weekly report. Apr 20 2012;61:253-257.
5. Halsey NA, Salmon DA. Measles at Disneyland, a problem for all ages. Annals of internal medicine. May 5 2015;162(9):655-656.
6. Butler D. Measles by the numbers: A race to eradication. Nature. Feb 12 2015;518(7538):148-149.
7. Infectious Disease Epidemiology: Theory and Practice. 3rd ed: Jones & Bartlett Learning; 2014.
8. Moss WJ, Griffin DE. Measles. Lancet (London, England). Jan 14 2012;379(9811):153-164.
9. Centers for Disease Control and Prevention. Epidemiology and Prevention of Vaccine-Preventable Diseases. 13th ed: Washington D.C. Public Health Foundation; 2015.
10. Perry RT, Halsey NA. The clinical significance of measles: a review. The Journal of infectious diseases. May 1 2004;189 Suppl 1:S4-16.
11. Furuse Y, Suzuki A, Oshitani H. Origin of measles virus: divergence from rinderpest virus between the 11th and 12th centuries. Virology journal. 2010;7:52.
12. Sabella C. Measles: not just a childhood rash. Cleveland Clinic journal of medicine. Mar 2010;77(3):207-213.
13. de Vries RD, Mesman AW, Geijtenbeek TB, Duprex WP, de Swart RL. The pathogenesis of measles. Current opinion in virology. Jun 2012;2(3):248-255.
14. Zachariah P, Stockwell MS. Measles vaccine- past, present and future. Journal of clinical pharmacology. Aug 4 2015.
15. Baker J. The First Measles Vaccine. Pediatrics. 2011;128(3).16. MMR Vaccine Information Statement, 42 U.S.C. § 300aa-26(2012).17. Cole J, Swendiman K. Mandatory Vaccinations: Precendent and Current Laws.
Congressional Research Service. 2014;RS21414.18. Centers for Disease Control and Prevention. Vaccination Requirements for all grantees,
for MMR-Measles, Mumps, Rubella and Kindergarten. 2011; http://www2a.cdc.gov/nip/schoolsurv/schImmRqmtReport.asp?
29

s=grantee&d=4&w=WHERE%20a.gradeID=2%20AND%20a.vaccineID=8. Accessed October 11, 2015.
19. National Conference of State Legislatures. States with Religious and Philosophical Exemptions from School Immunization Requirements. 2015; http://www.ncsl.org/research/health/school-immunization-exemption-state-laws.aspx. Accessed October 11, 2015.
20. Hill HA, Elam-Evans LD, Yankey D, Singleton JA, Kolasa M. National, State, and Selected Local Area Vaccination Coverage Among Children Aged 19-35 Months - United States, 2014. MMWR. Morbidity and mortality weekly report. Aug 28 2015;64(33):889-896.
21. Smith PJ, Marcuse EK, Seward JF, Zhao Z, Orenstein WA. Children and Adolescents Unvaccinated Against Measles: Geographic Clustering, Parents' Beliefs, and Missed Opportunities. Public health reports (Washington, D.C. : 1974). Sep-Oct 2015;130(5):485-504.
22. Seither R, Calhoun K, Knighton CL, et al. Vaccination Coverage Among Children in Kindergarten - United States, 2014-15 School Year. MMWR. Morbidity and mortality weekly report. Aug 28 2015;64(33):897-904.
23. Buttenheim AM, Sethuramen K, Omer SB, Hanlon AL, Levy MZ, Salmon D. MMR vaccination status of children exempted from school-entry immunization mandates. Vaccine. Oct 1 2015.
24. United States Census Bureau. US Vital Statistics Reports, State Specific Birth Rates (1930-2010). https://www.census.gov/library/publications/time-series/statistical_abstracts.html.
25. United States Census Bureau. Population Estimates, State Specific Estimates (1930-2010). https://www.census.gov/popest/data/historical/pre-1980/state.html: https://www.census.gov/popest/data/historical/index.html.
26. Project Tycho: University of Pittsburgh. Measles Counts by State (1930-2010).27. Daniel W, Cross C. Biostatistics: A Foundation in the Analysis in the Health Sciences.
10th ed: Wiley; 2013.28. SAS Institute Inc. SAS/ETS 13.2 User's Guide. Cary, NC: SAS Institute Inc.; 2014.29. CDC. Ten great public health achievements--United States, 1900-1999. MMWR.
Morbidity and mortality weekly report. Apr 2 1999;48(12):241-243.30. van Panhuis WG, Grefenstette J, Jung SY, et al. Contagious diseases in the United States
from 1888 to the present. The New England journal of medicine. Nov 28 2013;369(22):2152-2158.
31. Whitney CG, Zhou F, Singleton J, Schuchat A. Benefits from immunization during the vaccines for children program era - United States, 1994-2013. MMWR. Morbidity and mortality weekly report. Apr 25 2014;63(16):352-355.
32. Dalziel B, et al. Persistent Chaos and Asynchrony of Prevaccination Measles Epidemics in the United States. PLoS Comp Biol. 2015;In Press.
30