intron features of key functional genes mediating nitrogen ... · pdf fileintron features of...
TRANSCRIPT
Marine Genomics xxx (2011) xxx–xxx
MARGEN-00098; No of Pages 7
Contents lists available at ScienceDirect
Marine Genomics
j ourna l homepage: www.e lsev ie r.com/ locate /margen
Intron features of key functional genes mediating nitrogen metabolism inmarine phytoplankton
Punyasloke Bhadury a,⁎, Bongkeun Song b, Bess B. Ward a
a Department of Geosciences, Guyot Hall, Princeton University, NJ 08544, USAb Department of Biology and Marine Biology, University of North-Carolina at Wilmington, Wilmington, NC 28409, USA
⁎ Corresponding author at: Department of BiologicaScience Education and Research Kolkata, Mohanpur CamOffice, Mohanpur-741252, West Bengal, India.
E-mail address: [email protected] (P. Bhadury
1874-7787/$ – see front matter © 2011 Elsevier B.V. Aldoi:10.1016/j.margen.2011.06.002
Please cite this article as: Bhadury, P., et al.,Mar. Genomics (2011), doi:10.1016/j.marg
a b s t r a c t
a r t i c l e i n f oArticle history:Received 21 October 2010Received in revised form 31 May 2011Accepted 4 June 2011Available online xxxx
Keywords:IntronsSplice-sitesGC contentNitrate reductaseNitrate transportersDiatoms
Introns are widespread and variable in eukaryotic genomes. Although their histories and functions, or evenwhether all of them have any function, remain largely unknown, analysis of intron sequences and genomiccontexts may shed light on the evolutionary history of genes and organisms. The number and frequency ofintrons vary widely in the small number of published genomes of protists and algae suggesting that the sameis true of the vast diversity of protists and algae that remain uncultivated. The objective of this study were toinvestigate introns in sequences of functional genes of phytoplankton, both in published genomes and insequences obtained from environmental clone libraries. We examined the introns of the genes involved innitrogen uptake and assimilation pathways in the genome sequences of cultivated phytoplankton as well as inenvironmental clone libraries of nitrate reductases (NR), nitrite reductase (NiR), nitrate transporter (Nrt2)and ammonium transporter (AMT) genes constructed from pelagic phytoplankton communities in MontereyBay (CA, USA) and Onslow Bay (NC, USA). Here we describe themost extensive set to date of intron sequencesfrom uncultivated marine algae and report important differences for diatom vs. non-diatom sequences. Themajority of the introns in NR, NiR, Nrt2 and AMT from cultured phytoplankton and environmental librariesshowed canonical splice patterns. Introns found in diatom-like NR environmental libraries had lower GCcontent than the respective exons. The green algal-like NR and Nrt2 environmental sequences had introns andexons of much more similar GC content, and both higher than in diatoms. These patterns suggest a differentevolutionary history and recent acquisition of diatom introns compared to other algae.
l Sciences, Indian Institute ofpus, P.O. BCKV Campus Main
).
l rights reserved.
Intron features of key functional genes mediaen.2011.06.002
© 2011 Elsevier B.V. All rights reserved.
1. Introduction
Marine phytoplankton communities are responsible for about halfof global primary production (Behrenfeld and Falkowski, 1997).Diatoms may be responsible for as much as 75% of the total annualprimary production occurring in some coastal and upwelling envi-ronments (Nelson et al., 1995). It is therefore important to understandthe physiology and genetics of marine phytoplankton, which provideinsights into their regulation and response to environmental condi-tions. Genomic analysis of cultured phytoplankton, including diatoms,cyanobacteria and green algae (Armbrust et al., 2004; Derelle et al.,2006; Palenik et al., 2007; Merchant et al., 2007; Bowler et al., 2008)has led to major evolutionary insights (e.g., the origin of algal plastids,Reyes-Prieto et al., 2007, and the mixed lineage of nitrogen metab-olism genes in the picoprasinophyte, Micromonas, Mcdonald et al.,2010). It has also led to the discovery of new metabolic and physio-
logical interactions and previously unknown genes and pathways,such as the urea cycle in diatoms (Allen et al., 2011), the use of ferritinfor iron storage in diatoms (Marchetti et al., 2009) and unusualregulation of the Calvin cycle in the picoprasinophyte, Ostreococcus(Robbens et al., 2007).
One of the major differences between eukaryotic and prokaryoticgene organization is that eukaryotic genomes are interspersed withintervening noncoding sequences, known as introns. The genomicintron organization and number varies among eukaryotic groups(Jeffares et al., 2006). Introns were initially conceived of as selfishgenes with no known function in the host genome (e.g., Dawkins,1976; Orgel and Crick, 1980). They may, however, have multiplefunctions that might explain their ubiquitous distribution (e.g. Zhanget al., 1998, Ying and Lin, 2004, Zhu et al., 2010). Possible functions forintrons include frameshifting, control sequences, regulation of nestedgenes, exon shuffling and generation of genetic diversity. Noncodingsequences also can be used to investigate genome evolution. Forexample, the rate of intron loss in extant organisms is thought to bevery low; therefore, the pattern of intron positions can be used as anindicator for orthology among paralogous groups (Ferrier et al., 2000;Endo et al., 2004). The presence or absence of introns can be used toinfer the mechanism of gene duplication, because intron absence is a
ting nitrogen metabolism in marine phytoplankton,

2 P. Bhadury et al. / Marine Genomics xxx (2011) xxx–xxx
hallmark of gene duplication by retroposition (Vanin, 1985). Intronsequences have also been used to resolve relationships betweenclosely related species (e.g. Pecon-Slattery et al., 2004; Willows-Munro et al., 2005).
As protists, eukaryotic phytoplankton fall between bacteria andarchaea on one side (Simon et al., 2008) and metazoans on the other(Kim et al., 2007; Barbazuk et al., 2008) in terms of the number ofintrons and genomic complexity. Additional insights into thecomplexity of phytoplankton functional genes and genomes can begained from clone libraries obtained from different oceanic regimesand environmental conditions. Some of the protistan functional genesequences from natural assemblages also contain introns, and couldprovide information on their genome organization and structure (e.g.Adhitya et al., 2007).
The introns of the genes responsible for nitrate uptake in plants andalgae have been well studied (Fernandez et al., 1989; Dawson et al.,1996; Campbell, 1999).Chlamydomonas reinhardtiihas 15 introns in itsnitrate reductase (NR) gene (Zhou and Kleinhofs, 1996) and Chlorellavulgarishas 18 (Dawson et al., 1996). Volvox carteri has 10 introns in itsNR gene, and the presence of some introns enhanced both geneexpression and cell growth rate by 100-fold compared to clones fromwhich the introns had been removed (Gruber et al., 1996). Song andWard (2004) characterized the first marine algal NR gene fromDunaliella tertiolecta (Chlorophyceae) and showed that its codingsequence was very similar to other green algal NRs. D. tertiolecta hastwo introns in its partial genomic NR gene (1,313 bp). The first intron(740 bp, 52.4% G+C) was much larger while the second intron(119 bp, 53.8% GC) was shorter compared to other freshwater greenalgal introns (Song and Ward, 2004).
The first study of diatom NR genes from cultured marine strains(Allen et al., 2005) did not identify any intron features because thesequence data were derived from cDNA. Adhitya et al. (2007)reported an intron of 102 bp from a partial NR sequence (~500 bp)of Skeletonema costatum (Bacillariophyceae) amplified from genomicDNA, from which the same primers (Allen et al., 2005) amplified a398 bp fragment from the cDNA. The same study reported thepresence of introns in 8% of 129 eukaryotic environmental NR clonessequenced from epiphytic and planktonic assemblages sampled fromseagrass communities off the coast of Florida (Adhitya et al., 2007).The intron length varied between 88 and 154 bp (Adhitya et al., 2007).
The nitrate transporters of marine phytoplankton can be broadlydifferentiated into high-affinity transporter systems (HATS) and low-affinity transporter systems (LATS), depending on the affinity andcapacity for transport of nitrate into the cell. In eukaryotic systems,two gene families, Nrt1 and Nrt2, encode nitrate transporter systems(Forde2000;Galván and Fernández, 2001). Although the physiologicalcharacteristics of the high affinity transport system in marineeukaryotic algae is not well characterized, the Nrt2 type (HATS) isexpected to be of importance formarine phytoplankton because of thelow concentration of nitrate (sub micromolar) in the surface ocean.Apparent affinity constants for mixed assemblages of a few tens ofnanomolars have been reported (Harrison et al. 1996) and purecultures of diatoms have Ks values forwhole cell nitrate assimilation ofb1 μM (Goldman and Glibert 1983). Three studies characterized theNrt2 genes and associated structural features, including introns inmarine phytoplankton species (Hildebrand andDahlin, 2000; He et al.,2004; Song and Ward, 2007). Hildebrand and Dahlin (2000) reportedthe first intron sequences for the Nrt1 and Nrt2 genes from the marinediatom Cylindrotheca fusiformis. Song and Ward (2007) characterizedNrt2 genes from six strains of marine phytoplankton and detected fourintrons (43–93 bp length) in partial Nrt2 gene sequences of E. huxleyi(Prymnesiophyceae).
As for nitrate transporters, eukaryotic phytoplankton also havemultiple ammonium transporters (AMT), although data and examplesare fewer. Hildebrand (2005) characterized five unique ammoniumtransporter genes from C. fusiformis. Based on sequence homology and
Please cite this article as: Bhadury, P., et al., Intron features of key functioMar. Genomics (2011), doi:10.1016/j.margen.2011.06.002
complementation in yeast mutants, the C. fusiformis AMT genes wereclassified into two types: AMT1 (AMT1 a and b) and AMT2 (AMT2abc).An 86 bp intron sequence was detected in the AMT1b gene while theAMT2 intron was 89 bp in length. The AMT2b intron differed by onenucleotide from AMT2a and c.
In this study we describe intron patterns in cultivated Chromo-phyte and Chlorophyte algal genomes. We also describe numerousintrons obtained from environmental clones identified as diatom- andchlorophyte-like sequences. We tested the hypotheses that GCcontent of introns is consistently different from the genetic contextin diatoms and that this contrasts with the intron/exon pattern inChlorophytes and other non-diatomChromophytes.We examined thenumber, position, length and GC content of introns in nitrogenmetabolism genes from six algal genomes as well as investigatedintron sequence patterns in four clone libraries of NR and Nrt2 genesequences obtained from the marine environment. We focused onthese key phytoplankton genes because they represent major steps innitrogen transformations and can provide direct information on theactivities and environmental response of the phytoplankton tochanges in physical and chemical characteristics of their environment.Additionally we also investigated the introns present in differentmetabolic genes in cultured algal genomes belonging to Chlorophyceaeand Chromophyceae.
2. Material and methods
2.1. Gene sequences from phytoplankton genomes
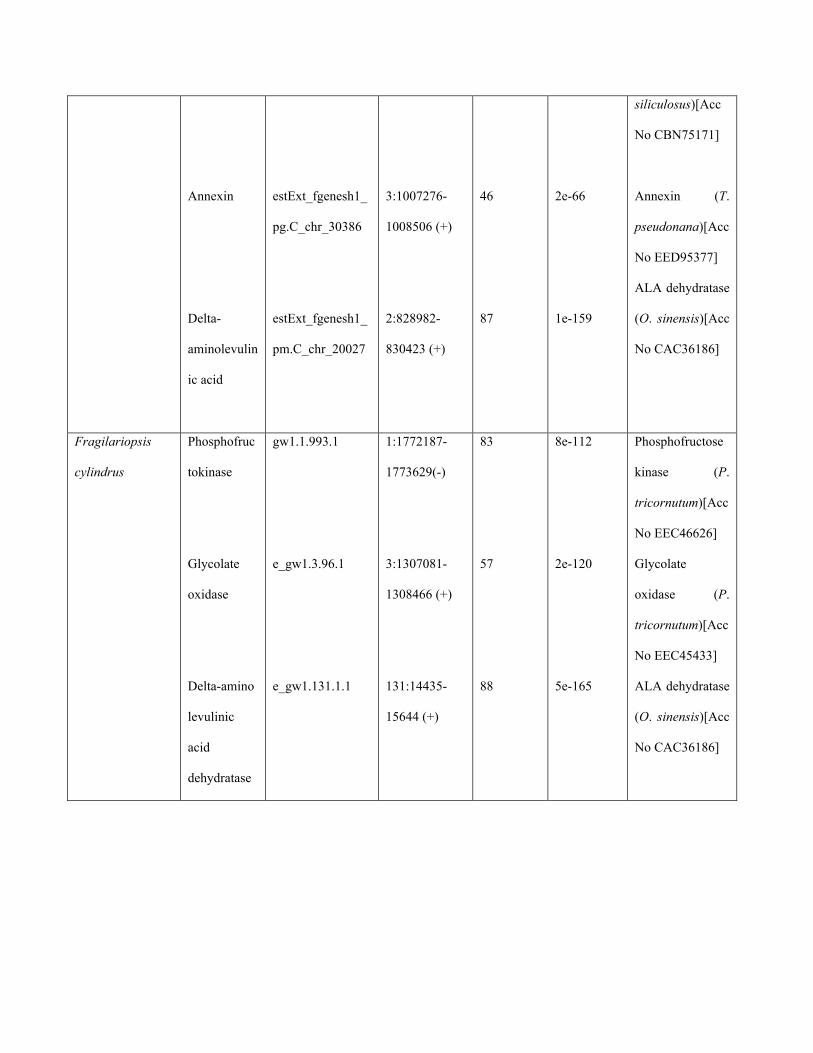
Genomic, transcript and coding fasta sequences ofNR,NiR,Nrt2 andAMT from four Chromophytes namely Thalassiosira pseudonana(Bacillariophyceae), Phaeodactylum tricornutum (Bacillariophyceae),Aureococcus anophagefferens (Pelagophyceae), Emiliania huxleyiCCMP1516 (Haptophyceae), and three Chlorophytes, Micromonaspusilla CCMP1545 (Prasinophyceae), Micromonas sp. RCC299 (Prasi-nophyceae) and Chlamydomonas reinhardtii (Chlorophyceae), weredownloaded from the JGI eukaryotic genomewebsite (http://genome.jgi-psf.org/euk_home.html) and subsequently validated using BLASTsearch (Blastx). In addition, representative sequences of some intron-containing genes mediating other key metabolic processes (e.g. carbonand hememetabolism, amino acidmetabolism, signaling and transcrip-tion, photorespiration) from cultured chromophytic (T. pseudonana,Fragilariopsis cylindrus, P. tricornutum and E. huxleyi) and chlorophytic(M. pusilla) phytoplankton genomes were also downloaded followingBLAST validation (Blastx). The gene models ID (as per JGI search),scaffold location, BLAST identitypercentage andaffiliations for thegenescontaining introns are detailed in the Supplementary Table 1.
2.2. Environmental NR and Nrt2 sequences from phytoplanktoncommunities
The presence of intronswas analyzed in partialNR gene sequences,identified by phylogenetic analysis as being of diatom origin, in clonelibraries generated as part of a study of phytoplankton communitycomposition and diversity in mesocosm incubations using watersfrom Monterey Bay (MB), California (Bhadury and Ward, 2009). NRsequences from planktonic and epiphytic samples from a seagrassenvironment in Tampa Bay (TB) Florida (Adhitya et al., 2007) werealso included in the analysis.
Additional NR sequences were obtained from clone librariesconstructed from PCR-amplified NR genes present in the in situ MBphytoplankton assemblages. Genomic DNAs were obtained from thestudy of O'Mullan and Ward (2005) from samples that had beencollected in central MB in 1998. Degenerate primers (AGNR1F,AGNR2F, AGNR1R, AGNR2R) for the NR genes in algae were designedusing the Codehop program (http://bioinformatics.weizmann.ac.il/blocks/codehop.html) based on a comparison of 8 different NR amino
nal genes mediating nitrogen metabolism in marine phytoplankton,

3P. Bhadury et al. / Marine Genomics xxx (2011) xxx–xxx
acid sequences fromhigher plants [Arabidopsis thaliana (NM_103364),Cucurbita maxima (P17569), Spinacia oleracea (P23312), andNicotianatabacum (P11605)] and green algae [Chlamydomonas reinhardtii(AF203033), Chlorella vulgaris (EF201807), Dunaliella tertiolecta(AY078279), and Volvox carteri (P36841)]. Genomic DNAs fromenvironmental samples were used as templates in touch down PCR.The PCR cycle was started with a 5 min denaturation step at 94 °C,followed by 20 cycles of a 1 min denaturation at 94 °C, primerannealing of 1 min starting at 60 °Cwith decrement of 0.5 °C per cycle,and followed by a 2 min extension at 72 °C. The PCRwas continued for20more cycles of 1 min denaturation at 94 °C, 1 min primer annealingat 55 °C and 2 min extension at 72 °C. PCR amplification was per-formed in a total volume of 50 μl containing 5 μl of 10X PCR buffer(500 mM KCl, 200 mM Tris–HCl [pH 8.4]), 1.5 mM MgCl2, 0.2 mM ofeach deoxyribonucleoside triphosphate, 1 μMof each primer (AGNR1Fand AGNR1R), 1 U Taq polymerase, and ~100 ng of genomic DNA.Nested PCR was conducted with the primers AGNR2F and AGNR2R.The PCRmixtures of the initial reactionwere used as a template for thenested reaction. The PCR cycle started with an initial denaturation at95 °C for 10 min and30 cycles of PCRwere as follows: 30 s at 95 °C, 30 sat 55 °C, 1 min at 72 °C. After the last cycle, the reaction was extendedat 72 °C for 10 min.
The genes encoding high affinity nitrate transporters (Nrt2) wereamplified from Onslow Bay samples (North Carolina) with specificprimers designed by Song andWard (2007). Nested PCR amplificationwas conducted using the primers DANAT1F and DANAT1R in the firstreaction, and the primers DANAT3F and DANAT2R in the secondreaction as described by Song and Ward (2007).
2.3. Intron prediction
Intron sequences from published phytoplankton genomes wereidentified by comparing the genomic and coding sequences. Introns inenvironmental NR and Nrt2 sequences were identified using acombination of GeneScan (http://genes.mit.edu/GENSCAN.html) andBLAST analysis. Intron sequences in environmentalNR clones fromMBand TB were aligned using ClustalW (http://www.ebi.ac.uk/clustalw).
Fig. 1. Comparison of GC content of introns (open bars) vs. exons (black bars, flanking gedeviation for % GC of multiple introns in the same gene (Table S1).
Please cite this article as: Bhadury, P., et al., Intron features of key functioMar. Genomics (2011), doi:10.1016/j.margen.2011.06.002
3. Results
3.1. Introns in nitrogen metabolizing genes from cultured phytoplanktongenomes
Introns of varying number and length were detected in fournitrogen metabolism genes (usually present as a single copy in eachgenome) from seven phytoplankton genomes (Supplementary TablesS2 and S3) and their GC content data is summarized in Figs. 1 and 2.
3.2. Assimilatory nitrate reductase (NR)
Among the sequenced algal genomes belonging to the greenlineages, introns were detected in NR of C. reinhardtii,M. pusilla CCMP1545 and Micromonas sp. RCC 299. Fifteen introns of variable length(138–329 bp) and GC content (53–70%) were detected in NR gene ofC. reinhardtii (Table S2). All of the C. reinhardtii NR introns showed thecanonical splice pattern commonly observed in eukaryotic introns i.e.,the U2-type splice pattern where the 3′ splice site precedes acharacteristic pyrimidine rich region. Average GC content for C.reinhardtii NR introns was 61.5% while for exon regions it was 63%.Two introns were also detected in the NR of the prasinophyte M.pusilla CCMP 1545. However in both the introns the 5′ terminal splicesite did not show a characteristic canonical pattern (Intron 1-GC,Intron 2-AG), but AG was present at the 3′ end in both cases. Twointrons rich in GC content were also detected in Micromonas sp. RCC299 NR and exhibited the U2 splice pattern (Table S2).
Two introns were detected in the chromophyte A. anophagefferensNR, with GC contents spanning the range of C. reinhardtiiwhile the GCcontent of the exon regions was 72%. Introns were absent in the NR ofthe chromophyte E. huxleyi. In case of diatoms, introns were detectedonly in the NR of T. pseudonana. Both the introns had low GC contentas evident in the Supplementary Table 2.
3.3. Nitrite reductase (NiR)
Nine introns were detected in the NiR gene of C. reinhardtii and allof them showed characteristic U2-type splice pattern. Average GC
nes) for NiR and NR genes in phytoplankton genomes. Error bars represent standard
nal genes mediating nitrogen metabolism in marine phytoplankton,
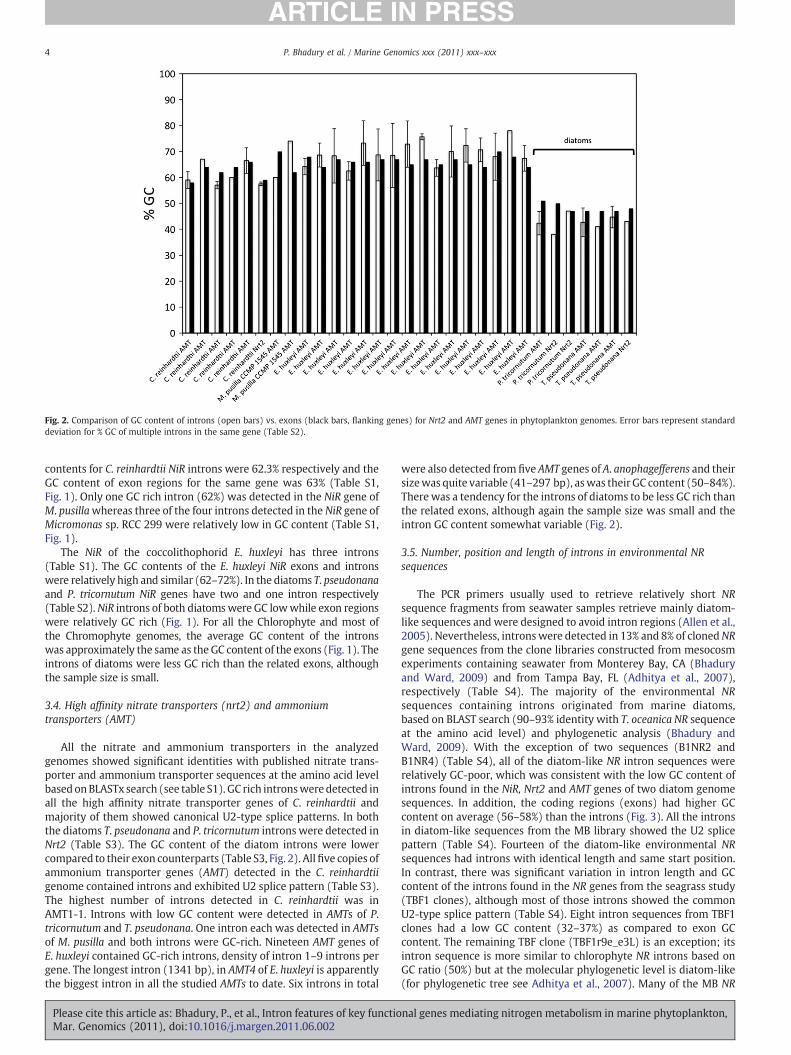
Fig. 2. Comparison of GC content of introns (open bars) vs. exons (black bars, flanking genes) for Nrt2 and AMT genes in phytoplankton genomes. Error bars represent standarddeviation for % GC of multiple introns in the same gene (Table S2).
4 P. Bhadury et al. / Marine Genomics xxx (2011) xxx–xxx
contents for C. reinhardtii NiR introns were 62.3% respectively and theGC content of exon regions for the same gene was 63% (Table S1,Fig. 1). Only one GC rich intron (62%) was detected in the NiR gene ofM. pusillawhereas three of the four introns detected in the NiR gene ofMicromonas sp. RCC 299 were relatively low in GC content (Table S1,Fig. 1).
The NiR of the coccolithophorid E. huxleyi has three introns(Table S1). The GC contents of the E. huxleyi NiR exons and intronswere relatively high and similar (62–72%). In the diatoms T. pseudonanaand P. tricornutum NiR genes have two and one intron respectively(Table S2).NiR introns of both diatomswere GC lowwhile exon regionswere relatively GC rich (Fig. 1). For all the Chlorophyte and most ofthe Chromophyte genomes, the average GC content of the intronswas approximately the same as the GC content of the exons (Fig. 1). Theintrons of diatoms were less GC rich than the related exons, althoughthe sample size is small.
3.4. High affinity nitrate transporters (nrt2) and ammoniumtransporters (AMT)
All the nitrate and ammonium transporters in the analyzedgenomes showed significant identities with published nitrate trans-porter and ammonium transporter sequences at the amino acid levelbasedonBLASTx search (see table S1). GC rich intronsweredetected inall the high affinity nitrate transporter genes of C. reinhardtii andmajority of them showed canonical U2-type splice patterns. In boththe diatoms T. pseudonana and P. tricornutum introns were detected inNrt2 (Table S3). The GC content of the diatom introns were lowercompared to their exon counterparts (Table S3, Fig. 2). Allfive copies ofammonium transporter genes (AMT) detected in the C. reinhardtiigenome contained introns and exhibited U2 splice pattern (Table S3).The highest number of introns detected in C. reinhardtii was inAMT1-1. Introns with low GC content were detected in AMTs of P.tricornutum and T. pseudonana. One intron each was detected in AMTsof M. pusilla and both introns were GC-rich. Nineteen AMT genes ofE. huxleyi contained GC-rich introns, density of intron 1–9 introns pergene. The longest intron (1341 bp), in AMT4 of E. huxleyi is apparentlythe biggest intron in all the studied AMTs to date. Six introns in total
Please cite this article as: Bhadury, P., et al., Intron features of key functioMar. Genomics (2011), doi:10.1016/j.margen.2011.06.002
were also detected from five AMT genes of A. anophagefferens and theirsizewas quite variable (41–297 bp), aswas their GC content (50–84%).There was a tendency for the introns of diatoms to be less GC rich thanthe related exons, although again the sample size was small and theintron GC content somewhat variable (Fig. 2).
3.5. Number, position and length of introns in environmental NRsequences
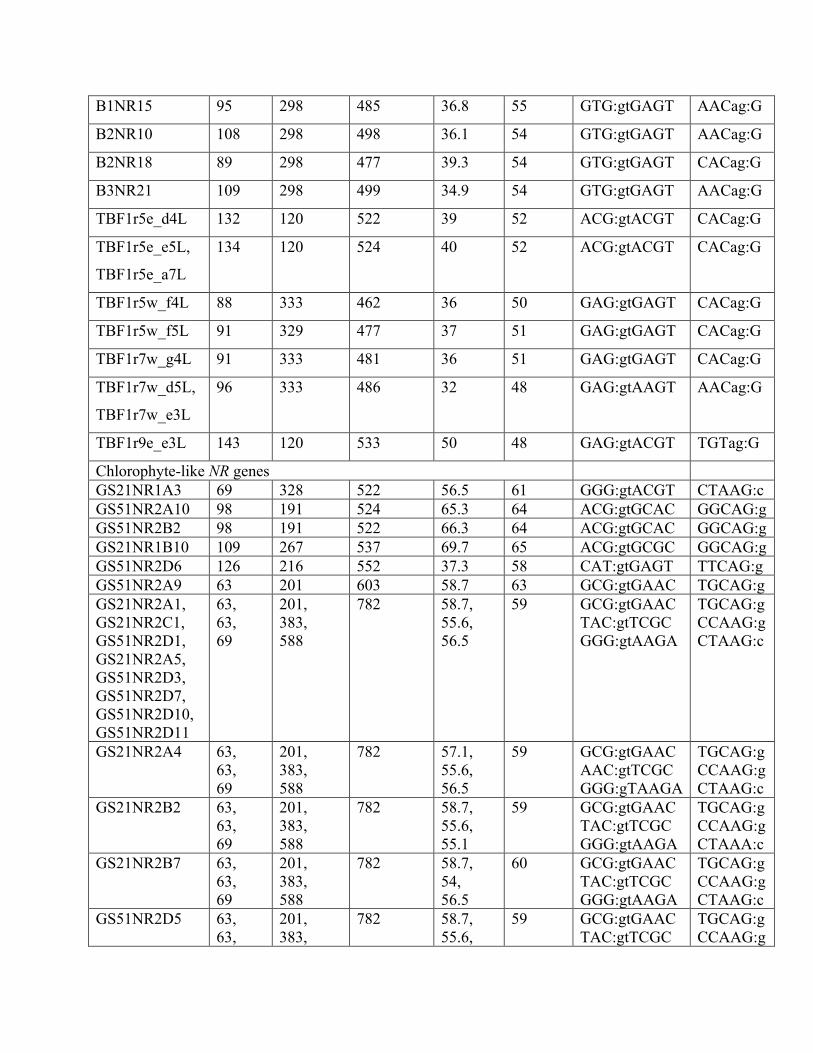
The PCR primers usually used to retrieve relatively short NRsequence fragments from seawater samples retrieve mainly diatom-like sequences and were designed to avoid intron regions (Allen et al.,2005). Nevertheless, intronswere detected in 13% and 8% of clonedNRgene sequences from the clone libraries constructed from mesocosmexperiments containing seawater from Monterey Bay, CA (Bhaduryand Ward, 2009) and from Tampa Bay, FL (Adhitya et al., 2007),respectively (Table S4). The majority of the environmental NRsequences containing introns originated from marine diatoms,based on BLAST search (90–93% identity with T. oceanica NR sequenceat the amino acid level) and phylogenetic analysis (Bhadury andWard, 2009). With the exception of two sequences (B1NR2 andB1NR4) (Table S4), all of the diatom-like NR intron sequences wererelatively GC-poor, which was consistent with the low GC content ofintrons found in the NiR, Nrt2 and AMT genes of two diatom genomesequences. In addition, the coding regions (exons) had higher GCcontent on average (56–58%) than the introns (Fig. 3). All the intronsin diatom-like sequences from the MB library showed the U2 splicepattern (Table S4). Fourteen of the diatom-like environmental NRsequences had introns with identical length and same start position.In contrast, there was significant variation in intron length and GCcontent of the introns found in the NR genes from the seagrass study(TBF1 clones), although most of those introns showed the commonU2-type splice pattern (Table S4). Eight intron sequences from TBF1clones had a low GC content (32–37%) as compared to exon GCcontent. The remaining TBF clone (TBF1r9e_e3L) is an exception; itsintron sequence is more similar to chlorophyte NR introns based onGC ratio (50%) but at the molecular phylogenetic level is diatom-like(for phylogenetic tree see Adhitya et al., 2007). Many of the MB NR
nal genes mediating nitrogen metabolism in marine phytoplankton,

Fig. 3. Comparison of GC content of introns (open bars) vs. exons (black bars, flanking sequences) for NR gene fragments in clone libraries from seawater. Error bars representstandard deviation for % GC of multiple introns in the same gene (Tables S3 and S4). In the clone libraries, identical introns occurred in several clones; these are counted as the sameintron in the figure (i.e., only one pair of bars for the group of identical introns) (see Table S3 for individual listing of each intron occurrence).
5P. Bhadury et al. / Marine Genomics xxx (2011) xxx–xxx
introns were very similar in sequence, and could be aligned withintron sequences from NR genes isolated from Tampa Bay (Fig. S1).
A total of the 65 mostly chlorophyte-like NR gene sequences wereretrieved from the amplified products of nested PCR conducted withthe AGNR primers and the environmental DNA extracted from the MBin situ samples (Tables S4). Based on BLAST searches, none of these NRsequences were closely related to diatom NRs, but they were moreclosely related to NR genes found in green algae and higher plants(data not shown). Twenty-one NR clones contained one to threeintrons and showed higher sequence identity to the NR genes found ingreen algae than those without introns. The intron sequences wereGC-rich and had the canonical splice pattern, which is consistent withprevious observations from C. reinhardtii and other non-diatomintrons. Thirteen out of 21 intron-containing chlorophyte-like NRsequences were identical in length and similar in start position. Withone exception, all the chlorophyte-like NR introns had GC contentvery similar to the flanking exon regions (Fig. 3).
3.6. Environmental high affinity transporters (Nrt2)
Only four out of 46 Nrt2 sequences from the Onslow Bay clonelibrary contained introns (Table S5) of 41–116 bp in length, all withthe canonical splice pattern. Intron GC content (48–59%) was similarto the respective exon GC content (50–61%). None of the chlorophyte-like Nrt2 sequences retrieved from MB contained introns.
3.7. Introns in non-nitrogen metabolizing genes from culturedphytoplankton genomes
We also surveyed a few intron-containing functional genes involvedin other metabolic processes from cultured diatom and non-diatomeukaryotic marine phytoplankton genomes. Most of the genes had atleast one intron and some had up to fourteen (Carbamoyl-phosphatesynthetase gene in E. huxleyi) (see Table S6). The introns showed the U2splice pattern and, in the diatoms (T. pseudonana, F. cylindrus,P. tricornutum), had lower % GC, while the coding sequences of thesegenes had higher % GC (Fig. 4). On the other hand the introns andexons of non-diatom eukaryotic genomes represented by E. huxleyi,
Please cite this article as: Bhadury, P., et al., Intron features of key functioMar. Genomics (2011), doi:10.1016/j.margen.2011.06.002
A. anophagefferens andM. pusilla had higher GC content. Thus it appearsthat diatom intronic sequences in diverse functional genes are generallylow % GC compared to other both Chromophyte and Chlorophyte algae.
4. Discussion
Large variations in intron length, number and GC content amongmetabolic genes in phytoplankton genomes (Chlorophyte and Chro-mophytes), as well as in environmental clone libraries, are documentedhere. The highest number of introns in NR and NiR for culturedphytoplankton genomes was recorded in the Chlorophyte C. reinhardtii.This is consistent with previous reports that NR genes in C. reinhardtiicontained more introns than the same genes in other algae (Zhou andKleinhofs 1996) and with the genome-wide analysis of Merchant et al.(2007), which reported that the C. reinhardtii genome contained moreand longer introns than the genomes of many other eukaryotes. Thelongest intron (540 bp) in NR was detected in the PrasinophyteM. pusilla. The intron density inNrt2 andAMT genes in cultured genomeswas higher in both the Haptophyte E. huxleyi and the PelagophyteA. anophagefferens than in the diatoms. The longest intron (1341 bp)detected in this study was found in the AMT4 gene of E. huxleyi.
Significant variationwas observed in intron length among differentnitrogen metabolizing genes from cultured phytoplankton andenvironmental clone libraries. The variation in intron length couldbe due to mutational pressure and resulting collapse in overall intronlength, as reported elsewhere (Comeron, 2001). Comeron (2001)suggested that recombination within the genome might be themissing key parameter for understanding the observed variation inlength of introns in eukaryotes. The vast majority of introns, forexample in the diatom T. pseudonana, appear to have been gained sinceearly eukaryotic evolution while nearly all of its ancestral introns havebeen lost (Roy and Penny, 2007). This is in contrast to all other knownintron rich species, which generally show a much higher conservationof intron position. The fact that we found introns in a significantfraction of modern diatom-like NR sequences in environmental clonelibraries from the marine environment suggests that introns arecommon in the functional genes of this group, despite the fact that thesame region of the NR gene in the two published diatom genomes,
nal genes mediating nitrogen metabolism in marine phytoplankton,

Fig. 4. Comparison of GC content of introns (open bars) vs. exons (black bars, flanking genes) for additional functional genes in phytoplankton genomes. Error bars representstandard deviation for % GC ofmultiple introns in the same gene (see Table S6 for individual listing of each intron occurrence). The abbreviations for the enzymes are as follows: DAL—Delta-aminolevulinic acid dehydratase, GOX-Glycolate oxidase, CPS— Carbamoyl phosphate synthetase, MgC-Magnesium chelatase, PEPC— Phosphenol pyruvate carboxylase, UPL—Ubiquitin protein ligase, PFK-Phosphofructokinase, ANX — Annexin, Myol-Myo-inositol dehydrogenase, GDH — Glutamate dehydrogenase, MS — Malate Synthase and XEP —
Xeazanthin epoxidase.
6 P. Bhadury et al. / Marine Genomics xxx (2011) xxx–xxx
T. pseudonona and P. tricornutum, do not contain introns. The primersused to retrieve these environmental gene sequences were chosen toexclude known intron regions, so the prevalence of introns may beeven higher than reported here. The fact thatmany of the intronswerehighly conserved, even compared to the exons in the same fragments,is consistent with the genome-wide investigation of Roy and Penny(2007), in suggesting recent intron acquisition.
While the intron sequences from the MB mesocosm experimentwere almost identical to each other, there was significant variation atthe exon level: the identical intron start position was detected in 18environmental diatom-like and 13 chlorophyte-like NR sequencesfromMB. These indicate that the introns originated at the same time inthe photosynthetic eukaryotes. A similar argument can be also madefor some of the environmental NR sequences reported previously byAdhitya et al. (2007). Many of the diatom-like TBF introns had thesame start position andwere of similar length, somewith quite similarsequence as well. The similarity between MB and TBF introns indiatom-like NR genes also suggest a similar source and or timing forinsertion of the introns in diatoms.
The recent origin of introns in diatoms may be linked to their lowGC content. The GC content of diatom introns was consistently lowerthan in introns of Chlorophytes and the non-diatom Chromophytephytoplankton groups (Figs. 1–4). Interestingly the exon sequences indiatom genomes, as well as in diatom-like environmental NRsequences, were more GC rich than the introns, and therefore moresimilar to the GC content of other coding phytoplankton sequencesthan the diatom intron sequences are to the introns of otherphytoplankton. The GC content of a genome is correlated with factorssuch as mutation, duplication rates and gene expression. Whetherthese factors are related to the low % GC intron patterns in diatomsremains to be explored. TheGC content of the noncodingDNA could bemolded by selection to conform to the base composition of the nearbycoding sequences (Bernardi and Bernardi, 1986; Zuckerkandl, 1992),but this has not yet occurred for the diatom NR introns described here.Mutational bias alonemay also affect the base composition of the non-coding DNA (Vinogradov, 2001) and any one of the above factors maybe involved in the patterns reported here.
Please cite this article as: Bhadury, P., et al., Intron features of key functioMar. Genomics (2011), doi:10.1016/j.margen.2011.06.002
The number and length of introns are both highest in C. reinhardtii,which has a relatively large genome. This is consistent with thepermissive explanation for accumulation of noncoding DNA and couldbe also linked to chromatin condensation and gene regulation. Thisexplanation does not apply consistently to E. huxleyi, however, whichhas a genome even larger than C. reinhardtii, but has introns in somegenes (AMT) but not others (NR). Previous studies have suggested theintrons might be a necessity for correct chromatin structure andtheir length seems to be associated with the level of gene expression,or at least, codon usage bias (Zuckerkandl, 1992; Vinogradov, 2001).In some unicellular organisms (e.g. S. cerevisiae, C. albicans), thiscorrelation tends to be positive (i.e. the longer introns occur in thehighly expressed genes), suggesting a functional role for introns,whereas inmulticellular organisms (e.g. C. elegans) the link, as a rule, isnegative (Vinogradov, 2001).
To extend our study beyond genes involved directly in N trans-formations, we investigated a few other functional genes from culturedphytoplankton genomes and found that there was a consistent rela-tionship betweenGC content of intronand exon indiatomsas comparedto non-diatoms. In the diatom genes investigated here, codingsequences could sometimes be distinguished from noncoding se-quences based on the GC content, as observed for the N metabolizinggenes in the samegenomes and in the clone libraries. This trendcouldbeuseful for identification of open reading frames in genomic DNA and toinvestigate the evolutionary history of diatom functional genes.
Acknowledgments
This work was supported by the US National Science Foundationgrants awarded to BBW.
Appendix A. Supplementary data
Supplementary data to this article can be found online at doi:10.1016/j.margen.2011.06.002.
nal genes mediating nitrogen metabolism in marine phytoplankton,

7P. Bhadury et al. / Marine Genomics xxx (2011) xxx–xxx
References
Adhitya, A., Thomas, F.I., Ward, B.B., 2007. Diversity of assimilatory nitrate reductasegenes from plankton and epiphytes associated with a seagrass bed. Microb. Ecol.54, 587–597.
Allen, A.E., Ward, B.B., Song, B.K., 2005. Characterization of diatom (Bacillariophyceae)nitrate reductase genes and their detection in marine phytoplankton communities.J. Phycol. 41, 95–104.
Allen, A.E., Dupont, C.L., Oborník, M., Horák, A., Nunes-Nesi, A., McCrow, J.P., Zheng, H.,Johnson, D.A., Hu, H., Fernie, A.F., Bowler, C., 2011. Evolution and metabolicsignificance of the urea cycle in photosynthetic diatoms. Nature 473, 203–207.
Armbrust, E.V., Berges, J.A., Bowler, C., Green, B.R., Martinez, D., Putnam, N.H., et al.,2004. The genome of the diatom Thalassiosira pseudonana: ecology, evolution, andmetabolism. Science 306, 79–86.
Barbazuk, W.B., Fu, Y., McGinnis, K.M., 2008. Genome-wide analyses of alternativesplicing in plants: opportunities and Challenges. Genome Res. 18, 1381–92.
Behrenfeld, M.J., Falkowski, P.G., 1997. Photosynthetic rates derived from satellite-based chlorophyll concentration. Limnol. Oceanogr. 42, 1–20.
Bernardi, G., Bernardi, G., 1986. Compositional constraints and genome evolution. J.Mol. Evol. 24, 1–11.
Bhadury, P., Ward, B.B., 2009. Molecular diversity of marine phytoplankton commu-nities based on key functional genes. J. Phycol. 45, 1335–1347.
Bowler, C., Allen, A.E., et al., 2008. The Phaeodactylum genome reveals the evolutionaryhistory of diatom genomes. Nature 456, 239–244.
Campbell, W.H., 1999. Nitrate reductase structure, function and regulation: bridgingthe gap between biochemistry and physiology. Annu. Rev. Plant Physiol. Plant Mol.Biol. 50, 277–303.
Comeron, J.M., 2001. What controls the length of noncoding DNA? Curr. Opin. Genet.Dev. 11, 652–659.
Dawkins, R., 1976. The Selfish Gene. Oxford University Press.Dawson, H.N., Pendleton, L.C., Solomonson, L.P., Cannons, A.C., 1996. Cloning and
characterization of the NR-encoding gene from Chlorella vulgaris: structure andidentification of transcription start points and initiator sequences. Gene 171,139–145.
Derelle, E., Ferraz, C., et al., 2006. Genome analysis of the smallest free-living eukaryoteOstreococcus tauri unveils many unique features. Proc. Natl. Acad. Sci. USA 103,11647–11652.
Endo, Y., Liu, Y., Kanno, K., Takahashi, M., Matsushita, M., Fujita, T., 2004. Identificationof the mouse H-ficolin gene as a pseudogene and orthology betweenmouse ficolinsA/B and human L-/M-ficolins. Genomics 84, 737–744.
Fernandez, E., Schnell, R., Ranum, L.P.W., Hussey, S.C., Silflow, C.D., Lefebvre, P.A.,1989. Cloning and characterization of the nitrate reductase structural gene ofChlamydomonas reinhardtii. Proc. Natl. Acad. Sci. USA 86, 6449–6453.
Ferrier, D.E.K., Minguillon, C., Holland, P.W.H., Garcia-Fernandez, J., 2000. Theamphioxus Hox cluster: deuterostome posterior flexibility and Hox14. Evol. Dev.2, 284–293.
Forde, B.G., 2000. Nitrate transporters in plants: structure, function and regulation.Biochim. Biophys. Acta 1465, 219–235.
Galván, A., Fernández, E., 2001. Eukaryotic nitrate and nitrite transporters. Cell. Mol. LifeSci. 58, 225–233.
Goldman, J.C., Glibert, P.M., 1983. Kinetics of inorganic nitrogen uptake by phyto-plankton. In: Carpenter, E.J., Capone, D.G. (Eds.), Nitrogen in the MarineEnvironment. Academic Press, New York, pp. 233–276.
Gruber, H., Kirzinger, S.H., Schmitt, R., 1996. Expression of the Volvox gene encodingnitrate reductase: mutation-dependent activation of cryptic splice sites and intron-enhanced gene expression from a cDNA. Plant Mol. Biol. 31, 1–12.
Harrison, W., Harris, L., Irwin, B., 1996. The kinetics of nitrogen utilization in the oceanicmixed layer: nitrate and ammonium interactions at nanomolar concentrations.Limnol. Oceanogr. 41, 16–32.
He, Q., Qiao, D., Zhang, Q., Li, Y., Wei, L., Gu, Y., Cao, Y., 2004. Cloning and expressionstudy of a putative high-affinity nitrate transporter gene from Dunaliella salina.J. Appl. Phycol. 16, 395–400.
Hildebrand, M., 2005. Cloning and functional characterization of ammonium trans-porters from the marine diatom Cylindrotheca fusiformis (Bacillariophyceae).J. Phycol. 41, 105–113.
Please cite this article as: Bhadury, P., et al., Intron features of key functioMar. Genomics (2011), doi:10.1016/j.margen.2011.06.002
Hildebrand, M., Dahlin, K., 2000. Nitrate transporter genes from the diatomCylindrotheca fusiformis (Bacillariophyceae): mRNA levels controlled by nitrogensource and by the cell cycle. J. Phycol. 36, 702–713.
Jeffares, D.C., Mourier, T., Penny, D., 2006. The biology of intron gain and loss. TrendsGenet. 22, 16–22.
Kim, E., Magen, A., Ast, G., 2007. Different levels of alternative splicing amongeukaryotes. Nucleic Acids Res. 35, 125–131.
Marchetti, A., Parker, M.S., Moccia, L.P., Lin, E.O., Arrieta, A.L., Ribalet, F., Murphy, M.E.P.,Maldonado, M.T., Armbrust, E.V., 2009. Ferritin is used for iron storage in bloom-forming marine pennate diatoms. Nature 457, 467–470.
McDonald, S.M., Plant, J.N., Worden, A.Z., 2010. The mixed lineage nature of nitrogentransport and assimilation in marine eukaryotic phytoplankton: a case study ofMicromonas. Mol. Biol. Evol. 27, 2268–2283.
Merchant, S.S., Prochnik, S.E., Vallon, O., Harris, E.H., et al., 2007. The Chlamydomonasgenome reveals the evolution of key animal and plant functions. Science 318,245–250.
Nelson, D., Treguer, P., Brzezinski, M., Leynaert, A., Queguiner, B., 1995. Production anddissolution of biogenic silica in the ocean: revised global estimates, comparisonswith regional data and relationship to biogeneic sedimentation. Glob. Biogeochem.Cycles 9, 359–372.
O'Mullan, G.D., Ward, B.B., 2005. Relationship of temporal and spatial variabilities ofammonia-oxidizing bacteria to nitrification rates in Monterey Bay, California. Appl.Environ. Microbiol. 71, 697–705.
Orgel, L.E., Crick, F.H.C., 1980. Selfish DNA: the ultimate parasite. Nature 284, 604–607.Palenik, B., et al., 2007. The tiny eukaryote Ostreococcus provides genomic insights into
the paradox of plankton speciation. Proc. Natl. Acad. Sci. USA 104, 7705–7710.Pecon-Slattery, J., Pearks Wilkerson, A.J., Murphy, W.J., O'Brien, S.J., 2004. Phylogenetic
assessment of introns and SINEs within the Y chromosome using the cat familyFelidae as a species tree. Mol. Biol. Evol. 21, 2299–2309.
Reyes-Prieto, A., Weber, A.P.M., Bhattacharya, D., 2007. The origin and establishment ofthe plastid in algae and plants. Annu. Rev. Genet. 41, 147–168.
Robbens, S., Petersen, J., Brinkmann, H., Rouze, P., Van de Peer, Y., 2007. Uniqueregulation of the Calvin cycle in the ultrasmall green alga Ostreococcus. J. Mol. Evol.64, 601–604.
Roy, S.W., Penny, D., 2007. A very high fraction of unique intron positions in the intron-rich diatom Thalassiosira pseudonana indicates widespread intron gain. Mol. Biol.Evol. 24, 1447–1457.
Simon, N., Cras, A-L., Foulon, E., Lemée, R., 2008. Diversity and evolution of marinephytoplankton. C. R. Biol. 332, 159–170.
Song, B., Ward, B.B., 2004. Molecular characterization of the assimilatory nitratereductase gene and its expression in the marine green alga Dunaliella tertiolecta(Chlorophyceae). J. Phycol. 40, 721–731.
Song, B., Ward, B.B., 2007. Molecular cloning and characterization of high-affinitynitrate transporters in marine phytoplankton. J. Phycol. 43, 542–552.
Vanin, E.F., 1985. Processed pseudogenes: characteristics and evolution. Annu. Rev.Genet. 19, 253–272.
Vinogradov, A.E., 2001. Within-intron correlation with base composition of adjacentexons in different genomes. Gene 276, 143–151.
Willows-Munro, S., Robinson, T.J.,Matthee, C.A., 2005.Utility ofnuclearDNA intonmarkersat lower taxonomic levels: phylogenetic resolution among nine Tragelaphus spp. Mol.Phylogenet. Evol. 35, 624–636.
Ying, S.Y., Lin, S.L., 2004. Intron-derived microRNAs-fine tuning of gene functions. Gene342, 25–38.
Zhang, J., Sun, X., Qian, Y., Maquat, L.E., 1998. Intron function in the nonsense-mediateddecay of beta-globin mRNA: indications that pre-mRNA splicing in the nucleus caninfluence mRNA translation in the cytoplasm. RNA 4, 801–815.
Zhou, J., Kleinhofs, A., 1996. Molecular evolution of nitrate reductase genes. J. Mol. Evol.42, 432–442.
Zhu, J., He, F., Wang, D., Liu, K., Huang, D., Xiao, J., Wu, J., Wu, S., Yu, J., 2010. A novel rolefor minimal introns: routing mRNAs to the cytosol. PLoS One 5, e10144.
Zuckerkandl, E., 1992. Revisiting junk DNA. J. Mol. Evol. 34, 259–271.
nal genes mediating nitrogen metabolism in marine phytoplankton,

Supplement Figure 1

Supplementary Table 1: Gene Model, Scaffold position within the genomes investigated,
BLASTx identity score, evalues based on BLASTx evaluation and closest taxonomic affiliations
for the genes containing introns investigated as part of this study.
Phytoplankton
genome
investigated
Gene Gene Model Location
(Scaffold)
BLAST
identity(
%)
E-value Affiliation
C. reinhardtii NR
NiR
Nrt2.1
Nrt2.2
estExt_fgenesh2_
kg.C_300022
estExt_fgenesh2_
pg.C_300056
C_520006
C_520007
30:402713-
410200 (+)
30:382383-
388049 (-)
52:183709-
185877 (+)
52:185708-
190503 (+)
75
70
65
63
6e-50
7e-30
5e-28
9e-42
Nitrate reductase
(Volvox carteri f.
nagariensis)
[Acc No
CAA45497]
Nitrite reductase
(Chlorella
vulgaris)[Acc No
ACF22998]
Nitrate
transporter
(Ricinus
communis)[Acc
No EEF34456]
Nitrate
transporter
(Ricinus
communis)[Acc
No EEF34456]
Nrt2.3
Nrt2.6
C_330081
C_20370
33:415884-
420457 (-)
2:888144-
893686 (-)
62
50
2e-15
1e-06
Nitrate
transporter
(Dunaliella
salina)[Acc No
AAU87579]
Major facilitator
superfamily
(Micromonas sp)
[Acc No
ACO67521]
Micromonas
pusilla CCMP
1545
NR
NiR
Nrt2
AMT4
fgenesh1_pg.C_sc
affold_4000472
AZW_PierreAnno
t2.00058
estExt_fgenesh1_
kg.C_40053
EuGene.0000070
4:1582447-1586504 (-) 4:1575754-1579168(+) 4:1580345-1582379 (+) 7:330609-332468(-)
52
73
72
85
2e-177
0.0
0.0
5e-152
Nitrate reductase
(Micromonas sp.
RCC299) [Acc
No ACO68770]
Nitrite reductase
(Micromonas sp.
RCC 299)[Acc
No ACO68769]
Nitrate
transporter (O.
taurii)[Acc No
ABO98215]
Ammonium

AMT5
GOX2
(Glycolate
oxidase)
ALAD
(Delta-
aminolevulin
ic acid
dehydratase)
180
EuGene.0000010
575
e_gw1.8.562.1
estExt_fgenesh1_
pm.C_20091
1:1118592-1120267(-) 8:624159-625825 (-) 2:1825836-1827458 (+)
63
79
71
2e-143
2e-82
7e-115
transporter
family
(Micromonas sp.
RCC299)[Acc
No ACO66964]
Ammonium
transporter
(Micromonas sp.
RCC 299)[Acc
No ACO64283]
Glycolate
oxidase
(Micromonas sp.
RCC 299)[Acc
No ACO66182]
Delta-
aminolevulinic
acid dehydratase
(C. reinhardtii)
[Acc No
EDP06754]
Micromonas sp. NR MSI_PierreAnnot Chr_01:496065-500689 (-)
52 0.0 Nitrate reductase

RCC 299
NiR
Nrt2
AMT
2.00108
PierreAnnot2.000
58
AZW_EuGene.01
00010217
estExt_fgenesh2_
pg.C_Chr_100075
Chr_01:490890-494428 (-)
Chr_01:489376-490403 (+) Chr_10:237711-239730 (+)
71
44
58
0.0
3e-26
4e-118
[Ostreococccus
tauri] [Acc No
CAL56049]
Nitrite reductase
[Micromonas
pusilla CCMP
1545][Acc No
EEH57892]
High affinity
nitrate transporter
(M. pusilla)[Acc
No EEH58271]
Ammonium
transporter (M.
pusilla)[Acc No
EEH52873]
Aureococcus
anophagefferns
NR
estExt_Genewise
1Plus.C_70101
7:396475-
399443 (-)
41
2e-141
assimilatory
nitrate reductase
(Emiliania
huxleyi
CCMP1516]
[Acc No

NiR
Nrt2
AMT2
AMT3
AMT4
dia_estExt_Gene
wise1.C_50033
fgenesh2_kg.C_sc
affold_39000006
estExt_Genewise
1Plus.C_20178
estExt_fgenesh2_
kg.C_290003
estExt_Genewise
5:95355-
97956 (+)
39:360822-
362899 (+)
2:522046-
523754 (-)
29:145511-
147308 (-)
45:20356-
62
50
44
44
43
3e-174
5e-103
7e-93
2e-41
1e-50
DAA12507]
Nitrite reductase-
ferredoxin
dependent [T.
pseudonana][Acc
No EED92802]
High affinity
nitrate transporter
[E.
siliculosus](Acc
No CBJ31727]
Ammonium
transporter (ISS)
[E. siliculosus]
[Acc No
CBJ33346]
Ammonium
transporter
Amt1;1 [Triticum
aestivum]
[Acc No
AAS19466]
Ammonium

AMT6
AMT9
CPSase
[Carbamoyl-
phosphate
synthetase]
Magnesium
chelatase
1Plus.C_450005
e_gw1.1.694.1
LWU_fgenesh2_p
g.C_scaffold_113
9000001
e_gw1.2.667.1
fgenesh2_pg.C_sc
affold_16000103
21660 (-)
1:1200951-
1202414 (-)
1139:123-
2397 (+)
2498816-
2503871 (-)
16:654201-
658785 (+)
47
49
56
75
1e-78
3e-77
0.0
0.0
transporter (ISS)
[E.
siliculosus][Acc
No CBJ26089]
Ammonium
transporter (ISS)
[O. tauri] [Acc
No CAL56669]
Ammonium
transporter (ISS)
[E. siliculosus]
[Acc No
CBJ26089]
CPSase [T.
pseudonana
CCMP1335][Acc
No EED92873]
Magnesium
chelatase subunit
H, putative
chloroplast
precursor [E.
siliculosus]
[Acc No

Phosphofruc
tokinase
gw1.15.33.1
15:723700-
725016 (+)
54
1e-66
CBJ25524]
Phosphofructokin
ase putative (R.
communis)[Acc
No EEF46366]
Emiliania huxleyi Nrt2
AMT1
AMT2
AMT3
fgenesh_newKGs
_kg.113__19__ES
T_ALL.fasta.Cont
ig11431
gm1.5300120
e_gw1.114.3.1
estExtDG_fgenes
h_newKGs_kg.C_
3100010
113:136397-
138748 (-)
53:267565-
270011 (+)
114:41945-44165 (+) 310:78019-79724 (+)
52
54
39
45
1e-62
2e-67
3e-44
2e-80
Major facilitator
family
(Micromonas sp.)
[Acc No
ACO86372]
Ammonium
transporter
(Candidatus
Nitrosoarchaeum
limnia SFB1)
[Acc No
EGG41554]
Ammonium
transporter-like
protein
(Cylindrotheca
fusiformis) [Acc
No AAK52491]
Ammonium
transporter
channel family
(M. pusilla) [Acc

AMT4
AMT5
AMT6
AMT7
AMT8
estExtDG_fgenes
hEH_pg.C_37004
3
estExtDG_Genew
ise1.C_250071
estExtDG_fgenes
hEH_pg.C_16200
18
estExtDG_Genem
ark1.C_2040022
estExtDG_fgenes
53:267565-270011 (+) 25:681734-683987 (-) 162:83562-85472 (+) 204:57439-59660 (+) 13:991815-994500(-)
42
43
48
42
53
8e-73
3e-48
1e-82
5e-48
2e-32
No EEH52873]
Ammonium
transporter (C.
reinhardtii) [Acc
No EDP08718]
Putative
ammonium
transporter
(Camellia
sinensis) [Acc
No BAD36826]
Ammonium
transporter
channel family
(Micromonas sp.)
[Acc No
AC069668]
Putative
ammonium
transporter
(Camellia
sinensis) [Acc
No BAD36826]
Ammonium

AMT9
AMT10
AMT11
AMT12
AMT13
h_newKGs_kg.C_
130145
e_gw1.263.7.1
estExtDG_fgenes
hEH_pg.C_97800
01
fgeneshEH_pg.16
73__1
gm1.100194
estExtDG_fgenes
263:47351-48961 (-) 978:2573-4538 (+) 1673:78-1144 (-) 1:511062-511767 (-) 10:1008248-1010901 (+)
53
52
55
56
29
4e-92
3e-47
1e-18
3e-15
6e-31
transporter
channel family
(M. pusilla)[Acc
No EEH52873]
Ammonium
transporter
channel family
(Micromonas sp.)
[Acc No
AC069668]
Putative
ammonium
transporter (A.
anophagefferens)
[Acc No
EGB12111]
Ammonium
transporter
(Myxococcus
xanthus)[Acc No
ABF87392]
Ammonium
transporter
channel family
(Micromonas
sp.)[Acc No
ACO68774)
Ammonium

AMT14
AMT15
AMT16
AMT17
AMT18
h_newKGs_kg.C_
100159
estExtDG_Genem
ark1.C_370125
estExtDG_Genem
ark1.C_680137
gm1.7400117
estExtDG_fgenes
hEH_pg.C_23016
9
LWU_fgeneshEH
_pg.1880__1
37:314289-317273 (+) 68:311906-315325 (-) 74:304239-308095 (+) scaffold_23:1008761-1011807 (-) 1880:6356-7057 (-)
35
29
60
72
46
9e-24
6e-31
7e-12
2e-55
1e-17
transporter
(Rhodothermus
marinus) [Acc
No ACY49404]
Ammonium
transporter
channel family
(Micromonas
sp)[Acc No
ACO69668]
Ammonium
transporter
(Rhodothermus
marinus) [Acc
No ACY49404]
Ammonium
transporter
putative
(Perkinsus
marinus)[Acc No
EER06420]
Predicted protein
(T. pseudonana)
[Acc No
EED92788]
Ammonium
transporter

AMT19
AMT20
AMT21
Magnesium
chelatase
Ppc
e_gw1.3.159.1
e_gw1.140.31.1
LWU_gm1.33600
017
fgenesh_newKGs
_pm.14__2
TLA_e_gw1.51.25.1
3:2510364-2511815 (+) 140:31621-32943 (-) 336:40175-41780 (-) scaffold_14:30937-35033 (+)
scaffold_51:27
83
66
53
73
41
9e-47
1e-48
2e-47
0.0
8e-70
channel family
(Micromonas sp.)
[Acc No
AC068774]
Ammonium
transporter
(Isochrysis
galbana) [Acc
No ABD91450]
Putative
ammonium
transporter (C.
sinensis) [Acc
No BAD36826)
Ammonium
transporter
(Candidatus
Nitrosoarchaeum
limnia
SFB1)[Acc No
EGG41554]
Magnesium
chelatase (E.
siliculosus) [Acc
No CBJ25524]
Phosphoenol

(Phosphoeno
l pyruvate
carboxylase)
Delta-
aminolevulin
ic acid
dehydratase
Carbamoyl-
phosphate
synthetase
Myo-inositol
dehydrogena
se
estExtDG_Genemark1.C_40842 estExtDG_fgeneshEH_pg.C_340119
e_gw1.8.17.1
8411-284745
(+)
scaffold_1493:2055-2394 (-) scaffold_34:807238-814214 (-)
8:509252-
512533
53
57
75
4e-44
0.0
2e-37
pyruvate
carboxylase
(Oryza nivara)
[Acc No
BAK09195]
Delta-
aminolevulinic
acid dehydratase
(Cyanidioschyzo
n merolae) [Acc
No BAD36769]
Carbamoyl-
phosphate
synthetase
(Prevotella
disiens) [Acc No
EFL45637]
Myo-inositol
dehydrogenase
(E. siliculosus)
[Acc No
CBJ31955)
Thalassiosira
pseudonana
NR
estExt_fgenesh1_
pg.C_chr_170188
chr_17:53063
3-534493 (+)
67
0.0
Nitrate reductase
(C. fusiformis)

NiR
Nrt2
AMT2
AMT3
AMT6
thaps1_ua_kg.chr
_4000135
estExt_thaps1_ua
_kg.C_chr_70193
gw1.2.139.1
gw1.9.57.1
estExt_thaps1_ua
_kg.C_chr_40355
chr_4:795965-
797811 (+)
chr_7:136018
7-1362070 (+)
chr_2:142980
2-1431446 (+)
chr_9:391755-
393293 (+)
chr_4:229379
2-2296193 (+)
50
80
54
71
49
4e-141
0.0
5e-152
2e-128
2e-129
[Acc No
AAY59538]
Nitrite reductase
(B. natans) [Acc
No AAP79144]
Putative nitrate
transporter
(Skeletonema
costatum) [Acc
No AAL85928]
Predicted protein
(P. tricornutum
CCAP 1055/1)
[Acc No
EEC44907]
Predicted protein
(P. tricornutum
CCAP 1055/1)
[Acc No
ACI65096]
Predicted protein
(P. tricornutum
CCAP 1055/1)
[Acc No
ACI65096]
MS (Malate
synthase)
GHD
(Glutamate
dehydrogena
se)
PFK
(Phosphofru
ctokinase)
Myo-inositol
dehydrogena
se
estExt_fgenesh1_
pm.C_chr_60036
estExt_fgenesh1_
pm.C_chr_40020
estExt_fgenesh1_
pg.C_chr_40325
fgenesh1_pg.C_c
hr_11a000089
chr_6:122194
3-1224104 (-)
chr_4:611707-
613514 (+)
chr_4:872285-
873762 (+)
chr_11a:25596
7-257166 (+)
76
50
60
48
5e-139
2e-136
2e-148
6e-71
Malate synthase
(P. tricornutum
CCAP 1055/1)
[Acc No
EEC48418]
Glutamate
dehydrogenase
(E. siliculosus)
[Acc No
CBN74525]
Pyrophosphate
dependent
phosphofructokin
ase (P.
tricornutum
CCAP 1055/1)
[Acc No
EEC43866]
Myo-inositol 2-
dehydrogenase
(P. tricornutum
CCAP 1055/1)
[Acc No
EEC48611]

GOX
(Glycolate
oxidase)
Ppc
(Phosphoeno
lpyruvate
carboxylase)
CPSase
[Carbamoyl-
phosphate
synthetase]
Magnesium
chelatase
fgenesh1_pm.C_c
hr_4000047
ans_1_jgi|JGI_CB
PC1849.fwd
estExt_fgenesh1_pg.C_chr_100347
e_gw1.5.65.1
chr_4:152685
7-1528121 (+)
chr_5:200957-
204623 (+)
chr_10:98799
5-993296 (+)
5:899513-
901943 (-)
61
52
77
53
2e-118
0.0
0.0
0.0
Glycolate
oxidase (P.
tricornutum
CCAP 1055/1)
[Acc No
EEC45433]
Putative
phosphoenolpyru
vate carboxylase
(P. tricornutum)
[Acc No
BAK09353]
Predicted protein
(P. tricornutum)
[Acc No
EEC44721]
Magnesium
chelatase
(Micromonas
sp.)[Acc No
ACO63234]
P. tricornutum NiR
e_gw1.9.59.1
9:733205-
734937 (+)
55
1e-144
Nitrite reductase
(B. natans)[Acc
No AAP79144]

AMT
AMT
CPSase
[Carbamoyl-
phosphate
synthetase]
Phosphofruc
tokinase
Myo-inositol
dehydrogena
se
Glycolate
oxidase
estExt_Genewise
estExt_Phatr1_ua
_kg.C_chr_20001
4
1.C_chr_100026
estExt_gwp_gw1.
C_chr_310042
fgenesh1_pm.C_c
hr_29000010
gw1.11.151.1
estExt_gwp_gw1.
C_chr_180099
10:106019-108553 (-) 20:321187-323255 (-) chr_31:96119-101909 (-)
29:317766-
319147 (+)
11:65497-
66659 (+)
18:377331-
379740 (-)
74
60
77
67
82
61
8e-163
5e-155
0.0
5e-91
1e-156
1e-92
Ammonium
transporter amt2a
(C.
fusiformis)[Acc
No AAV70490]
Ammonium
transporter (T.
pseudonana)
[Acc No
EED94828]
Carbamoyl-
phosphate
synthetase (T.
pseudonana)
[Acc No
EED92873]
Phosphofructokin
ase (T.
pseudonana)[Acc
No EED95817]
Predicted protein
(T.
pseudonana)[Acc
No EED95667]
Glycolate
oxidase (E.
Annexin
Delta-
aminolevulin
ic acid
estExt_fgenesh1_
pg.C_chr_30386
estExt_fgenesh1_
pm.C_chr_20027
3:1007276-
1008506 (+)
2:828982-
830423 (+)
46
87
2e-66
1e-159
siliculosus)[Acc
No CBN75171]
Annexin (T.
pseudonana)[Acc
No EED95377]
ALA dehydratase
(O. sinensis)[Acc
No CAC36186]
Fragilariopsis
cylindrus
Phosphofruc
tokinase
Glycolate
oxidase
Delta-amino
levulinic
acid
dehydratase
gw1.1.993.1
e_gw1.3.96.1
e_gw1.131.1.1
1:1772187-
1773629(-)
3:1307081-
1308466 (+)
131:14435-
15644 (+)
83
57
88
8e-112
2e-120
5e-165
Phosphofructose
kinase (P.
tricornutum)[Acc
No EEC46626]
Glycolate
oxidase (P.
tricornutum)[Acc
No EEC45433]
ALA dehydratase
(O. sinensis)[Acc
No CAC36186]
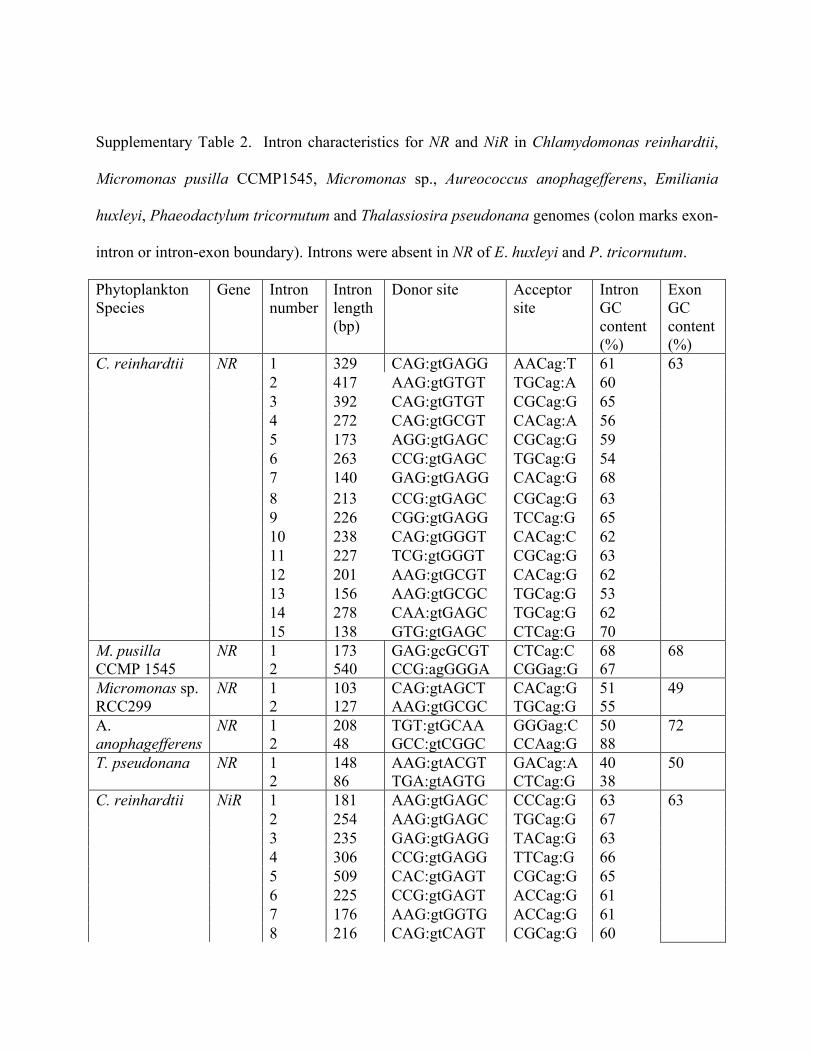
Supplementary Table 2. Intron characteristics for NR and NiR in Chlamydomonas reinhardtii,
Micromonas pusilla CCMP1545, Micromonas sp., Aureococcus anophagefferens, Emiliania
huxleyi, Phaeodactylum tricornutum and Thalassiosira pseudonana genomes (colon marks exon-
intron or intron-exon boundary). Introns were absent in NR of E. huxleyi and P. tricornutum.
Phytoplankton Species
Gene Intron number
Intron length (bp)
Donor site Acceptor site
Intron GC content (%)
Exon GC content (%)
C. reinhardtii NR 1 329 CAG:gtGAGG AACag:T 61 2 417 AAG:gtGTGT TGCag:A 60 3 392 CAG:gtGTGT CGCag:G 65 4 272 CAG:gtGCGT CACag:A 56 5 173 AGG:gtGAGC CGCag:G 59 6 263 CCG:gtGAGC TGCag:G 54 7 140 GAG:gtGAGG CACag:G 68 8 213 CCG:gtGAGC CGCag:G 63 9 226 CGG:gtGAGG TCCag:G 65 10 238 CAG:gtGGGT CACag:C 62 11 227 TCG:gtGGGT CGCag:G 63 12 201 AAG:gtGCGT CACag:G 62 13 156 AAG:gtGCGC TGCag:G 53 14 278 CAA:gtGAGC TGCag:G 62 15 138 GTG:gtGAGC CTCag:G 70
63
M. pusilla CCMP 1545
NR 1 2
173 540
GAG:gcGCGT CCG:agGGGA
CTCag:C CGGag:G
68 67
68
Micromonas sp. RCC299
NR
1 2
103 127
CAG:gtAGCT AAG:gtGCGC
CACag:G TGCag:G
51 55
49
A. anophagefferens
NR
1 2
208 48
TGT:gtGCAA GCC:gtCGGC
GGGag:C CCAag:G
50 88
72
T. pseudonana NR 1 2
148 86
AAG:gtACGT TGA:gtAGTG
GACag:A CTCag:G
40 38
50
C. reinhardtii NiR 1 181 AAG:gtGAGC CCCag:G 63 2 254 AAG:gtGAGC TGCag:G 67 3 235 GAG:gtGAGG TACag:G 63 4 306 CCG:gtGAGG TTCag:G 66 5 509 CAC:gtGAGT CGCag:G 65 6 225 CCG:gtGAGT ACCag:G 61 7 176 AAG:gtGGTG ACCag:G 61 8 216 CAG:gtCAGT CGCag:G 60
63

9 343 CAG:gtGTGT TGCag:G 55 M. pusilla CCMP1545
NiR 1 209 CGG:gtGCGT CTCag:T 62 66
Micromonas sp. RCC299
NiR 1 2 3 4
121 109 121 93
ACG:gtAAGC GTG:gtAAGG AAG:gtATAC CGG:gtACGC
CGCag:A ATCag:G CACag:G AACag:A
52 42 41 43
50
A. anophagefferens
NiR 1 2
172 90
GCG:gtCAGT CGC:gcGGCG
GACag:G GCCgc:C
67 68
71
E. huxleyi NiR 1 2 3
71 69 71
ATG:gtGGGA CTC:gtCGAG CAG:gtCTAT
CATag:G AAAag:A GCCag:G
61 72 62
71
P. tricornutum NiR 1 122 ACG:gtGCGT TTTag:A 42 51 T. pseudonana NiR 1
2 113 81
ACG:gtACGT ATG:gtAAGG
TGCag:A TGCag:C
37 41
48
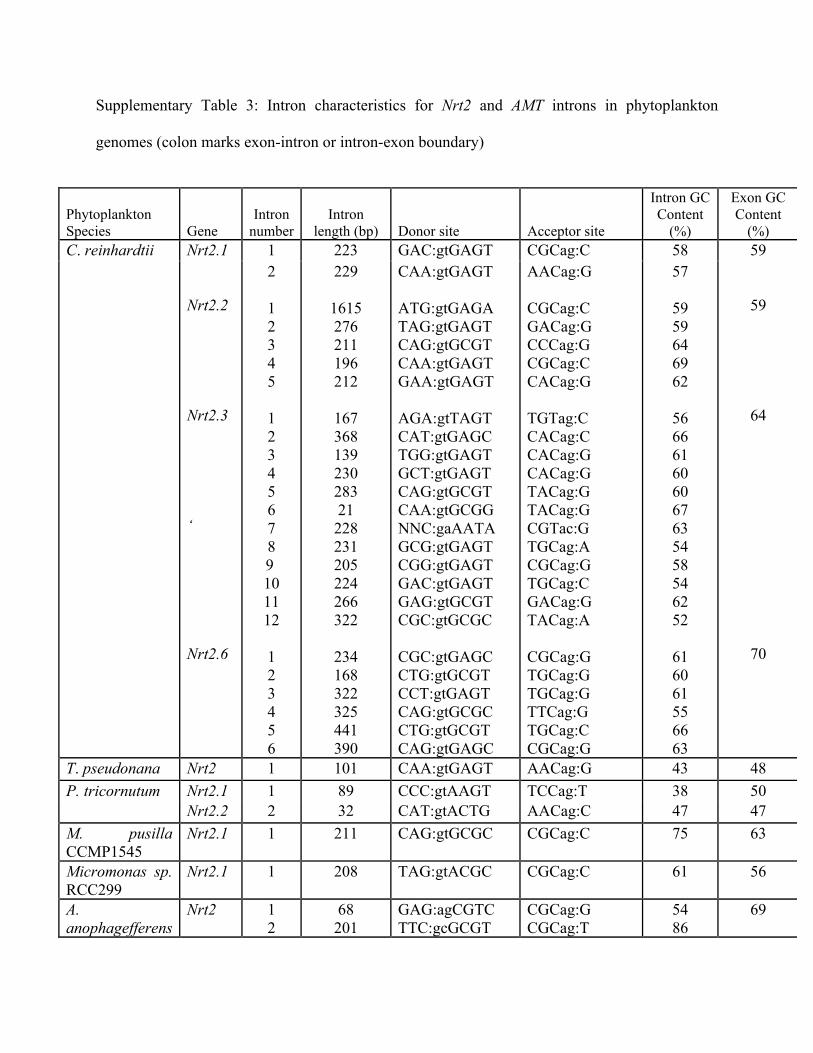
Supplementary Table 3: Intron characteristics for Nrt2 and AMT introns in phytoplankton
genomes (colon marks exon-intron or intron-exon boundary)
Phytoplankton Species Gene
Intron number
Intron length (bp) Donor site Acceptor site
Intron GC Content
(%)
Exon GC Content
(%) C. reinhardtii 1 223 GAC:gtGAGT CGCag:C 58
Nrt2.1 Nrt2.2 Nrt2.3 ‘ Nrt2.6
2 1 2 3 4 5 1 2 3 4 5 6 7 8
9 10 11 12
1 2 3 4 5 6
229
1615 276 211 196 212
167 368 139 230 283 21 228 231 205 224 266 322
234 168 322 325 441 390
CAA:gtGAGT ATG:gtGAGA TAG:gtGAGT CAG:gtGCGT CAA:gtGAGT GAA:gtGAGT AGA:gtTAGT CAT:gtGAGC TGG:gtGAGT GCT:gtGAGT CAG:gtGCGT CAA:gtGCGG NNC:gaAATA GCG:gtGAGT CGG:gtGAGT GAC:gtGAGT GAG:gtGCGT CGC:gtGCGC CGC:gtGAGC CTG:gtGCGT CCT:gtGAGT CAG:gtGCGC CTG:gtGCGT CAG:gtGAGC
AACag:G CGCag:C GACag:G CCCag:G CGCag:C CACag:G TGTag:C CACag:C CACag:G CACag:G TACag:G TACag:G CGTac:G TGCag:A CGCag:G TGCag:C GACag:G TACag:A CGCag:G TGCag:G TGCag:G TTCag:G TGCag:C CGCag:G
57
59 59 64 69 62
56 66 61 60 60 67 63 54 58 54 62 52
61 60 61 55 66 63
59
59
64
70
T. pseudonana Nrt2 1 101 CAA:gtGAGT AACag:G 43 48 P. tricornutum Nrt2.1 1 89 CCC:gtAAGT TCCag:T 38 50 Nrt2.2 2 32 CAT:gtACTG AACag:C 47 47 M. pusilla CCMP1545
Nrt2.1 1 211 CAG:gtGCGC CGCag:C 75 63
Micromonas sp. RCC299
Nrt2.1 1 208 TAG:gtACGC CGCag:C 61 56
A. anophagefferens
Nrt2 1 2
68 201
GAG:agCGTC TTC:gcGCGT
CGCag:G CGCag:T
54 86
69

E. huxleyi Nrt2 1 2 3 4 5 6
112 199 86 61 75 167
CCT:gtGCGC GTG:gtGCGC ATC:gtGCGC GCG:gtGCGC CTC:gtTGGC CAA:gtACGA
CTCag:G CGCag:G TGCag:G CACag:G TGCag:A CAAag:G
84 84 78 79 57 67
65
C. reinhardtii AMT1-1
1 131 CAA:gtGAGA TGCag:G 58 58
2 127 AAG:gtGCGT TGCag:G 55 3 177 GAG:gtGGGT GTCag:G 64 4 1274 AAT:gtTCGA CGCag:G 59 AMT3 5 170 GCG:gtACGT TGCag:T 59 AMT4 1 84 CTG:gtGAGT TGCag:C 67 64 1 227 CAG:gtAGGA TGCag:G 56 62 AMT7 2 329 CAG:gtGTGT TGCag:G 58 AMT8 1 249 TAG:gtGAGT TGCag:G 60 64 1 158 GCT:gtGAGT TGCag:C 63 66 2 243 CAG:gtGCGC CACag:C 70
AMT4 1 174 CGG:gtGCGC CACag:C 60 70 M. pusilla CCMP 1545 AMT5 1 54 GGC:tcCGCG CGAga:T 74 62 Micromonas sp. RCC 299
AMT 1 323 CGA:gtAAGT CGCag:T 64 65
E. huxleyi AMT1 1 76 GAG:gtGCGC CTCag:A 61 68 2 91 TCC:gtGAAG TCCag:T 63 3 124 CGA:gtTCCT AGCag:G 64 4 137 GCG:gtGGCC CGCag:C 65 5 71 AGC:gtCGGA TTCag:G 65 6 128 CCG:gtTTTC GCCag:G 62 7 72 CGG:gtTCGT CGCag:G 71 8 90 GAG:gtGCAG TGCag:G 62 AMT2 1 76 ATG:gtGCGC CCAag:G 75 64 2 87 CTG:gtGCGC GACag:G 75 3 143 AAA:gtGACC CGCag:C 69 4 101 CGC:gtTTGC GCGag:G 62 5 67 ACG:gtGTTC CGCag:T 64 6 72 GGG:gtCGCG CATag:G 67 7 171 TCG:gtCAGC TGCag:G 68 8 112 AAG:gtATGC CGCag:G 69 AMT3 1 99 CCA:gtGAGT TCCag:A 58 67 2 92 GGC:ggCTGG TTTag:G 68 3 73 CCG:gtGCCG TCCag:G 68

AMT4 1 454 GTG:gtTGAG GGCag:G 65 66 2 1341 TCG:gtGCAG CCCag:G 60 AMT5 1 76 AAG:gcATGC GTCag:G 75 66 2 96 TCG:gtGCCA CGCag:G 81 3 224 CAA:gtGAGA CCCag:G 61 4 143 TGG:gtGCGC CGCag:G 76 AMT6 1 99 CCA:gtGAGT TCCag:A 79 67 2 94 ACG:gcGGCT TTTag:G 59 3 73 CCG:gtGCCG TCCag:G 68 AMT7 1 55 CTC:gtGGCG TCCag:T 56 67 2 96 TCG:gtGCCA CGCag:G 81 3 226 CAA:gtGAGA CCCag:G 60 4 143 TGG:gtGCGC CGCag:G 77 AMT8 1 74 GAG:gtCCGC CGCag:A 80 65 2 69 CTG:gtGTCC GTTag:G 75 3 174 ACT:ggCGCG CGCag:G 72 4 79 CTG:gtGCCC CGCag:G 80 5 68 AAC:gtGCGC CGCag:A 79 6 221 CCT:aaCCCT CTCct:A 55 7 65 TCG:gtCCGC CGCag:G 69 AMT9 1 234 GCG:gtCGGC CGTag:C 74 66 AMT10 1 76 CAA:ggCATG TGTca:G 75 67 2 262 TCG:gtGCCA AGTag:A 75 3 143 TGG:gtGCGC CGCag:G 77 AMT11 1 60 GGT:gtGCTC CCTag:G 60 65 2 105 GAG:gtAGGC CTCag:G 66 3 181 CAA:gtCGAC TTCag:G 65 AMT12 1 145 CAG:gtGGCC TCCag:G 70 71 2 144 TGG:gtGCGC CGCag:G 78 AMT13 1 108 CAG:gcGCCC CGCag:T 83 67 2 86 CAG:gtTCGC CTCag:G 79 3 98 CCT:gtGCGC CGCag:A 78 4 86 GGG:gtGGCT TGCag:G 60

5 92 ACC:gtCAAC GCTag:G 63 6 154 ACG:gtGCGC GCTag:G 75 7 188 AAG:gcGCCG TACag:G 59 8 158 CAG:gtGGTC TGCag:A 58 9 36 CCT:gtGCGG CGCag:A 75 AMT14 1 86 NNN:ccCCCG TTCag:G 75 64 2 43 CCG:gtGGAC GCCag:G 77 3 78 GAG:gtTCGC GATag:G 65 4 28 AGC:ttCTGC TGGcc:C 57 AMT15 1 136 CAC:gtCGCA TGCag:G 74 64 2 155 AAG:gtGACA GCCag:G 69 3 136 AAG:gtCTCG CGCag:A 73 4 123 GCG:gtGCGC CTTag:G 70 5 82 ACG:gtGCAT CTCag:G 66 6 141 GGG:gtCCTT TTTag:G 73 7 43 CCG:gtGGAC GCCag:G 77 8 84 GAG:gtTCGC GATag:G 63 9 28 TAG:ctTCTG ATGgc:C 57 AMT16 1 89 GAC:gtAATC CCGag:G 66 69 2 245 GCT:gtACCC ATTag:G 60 3 87 AAC:gtGCCG GCCag:G 71 4 56 GAG:gtGCGT CGCag:G 61 5 75 GGG:gtGCGC CGCag:G 64 6 169 GGA:gtGGCG GATag:G 71 7 81 CCG:gtGCCG CGCag:G 60 8 415 GCG:gtGCGC AGCag:G 74 9 208 GGC:gtCTCC ATTag:G 65 10 151 AAG:ggCCGT TCAag:G 59 11 58 TTC:gtCGAC TGTag:G 52 12 69 GAC:gtGGTC ACTag:A 61 13 78 TAC:gtCCGC GGTac:G 71 AMT17 1 221 CTG:gtGCGC GTCag:G 64 70 2 86 CGG:gcGCCG TGTag:G 83 3 378 CGA:gtGAGC GGCag:G 56 4 221 CTG:gtGTGG CTCag:G 70 5 100 GAG:gtCGAC CTCag:G 64 6 151 GCG:gtGGCT GCTag:G 71 AMT18 1 144 TGG:gtGCGC CGCag:G 78 68

AMT19 1 114 CCG:gtGCCG TCCag:G 73 64 2 158 AGA:gtTAGA GCGag:C 64 3 142 TTT:gtGGCG ACCag:G 65 AMT20 1 16 CTC:gtGGCG GTCag:G 63 66 2 96 TCG:gtGCCA CGCag:G 81 3 224 CAA:gtGAGA CCCag:G 61 AMT21 1 273 CAA:gtGAGA GGCag:G 59 67 2 131 CTG:gtCTGC CTCag:G 66 3 100 GAG:gtCGAC CTCag:G 64
4 94 AAA:gtACCC CGCag:A 72
A. anophagefferens
AMT2 AMT3 AMT4 AMT6 AMT9
1 2 1 1 1 1
41 195
199
57
93
237
CGC:gtCGAT CCT:gtCAGG CGC:gtACGC TCG:gtCGCG CGG:gtGCGC GCC:tgCCAC
CGTag:G CCCag:G TCCag:G GCAag:G CGCag:G GCGac:G
63 53
50
84
72
59
68
73
76
69
72
P. tricornutum AMT 1 83 TAA:gtAAAG TTCag:G 47 51 2 84 ACG:gtAAGA TTCag:A 42 3 78 GCG:gtAAGT TCCag:A 38 AMT 1 312 ACG:gtAAGT TGCag:A 47 50 2 410 GCG:gtACGT TACag:G 44 T. pseudonana AMT2 1 105 TTG:gtGAGG ACCag:G 48 47 2 91 CAA:gtAAGA TTCag:T 43 3 87 TTG:gtACGT TTAag:G 37 AMT3 1 103 GTG:gtGAGT TGCag:C 41 47 AMT6 1 108 GGG:gtGAGT TGTag:G 46 47 2 96 CAG:gtGAGT TCCag:C 48 3 84 TCG:gtAAGT TATag:T 40

Supplementary Table 4: Introns along with splice-site pattern in partial NR gene fragments
retrieved in clone libraries from marine environments. B1…, B2…, B3… labels are diatom-like
genes from Monterey Bay (Bhadury and Ward, 2009); TBF… labels are diatom-like genes from
Tampa Bay (Adhitya et al., 2007); GS… labels are chlorophyte-like genes from Monterey Bay
(Song, in prep) [colon marks exon-intron or intron-exon boundary]
Environmental
sequence name
Intron
length
(bp)
Intron
start
position
(bp from
the
partial 5ʹ′
end)
Length of
DNA
amplicon
Intron
GC
content
(%)
Exon
GC
content
(%)
Donor site Acceptor
site
Diatom-like NR genes
B1NR1,
B1NR3,
B1NR5,
B1NR7,
B1NR9,
B1NR13,
B1NR19,
B2NR19,
B2NR21,
B3NR4,
B3NR6,
B3NR20,
B3NR33,
B3NR34
112
298
502
33.9 55 GTG:gtGAGT AACag:G
B1NR2,
B1NR4
100 48 497 65 59 TAT:gtCGAA AGCag:A
B1NR15 95 298 485 36.8 55 GTG:gtGAGT AACag:G
B2NR10 108 298 498 36.1 54 GTG:gtGAGT AACag:G
B2NR18 89 298 477 39.3 54 GTG:gtGAGT CACag:G
B3NR21 109 298 499 34.9 54 GTG:gtGAGT AACag:G
TBF1r5e_d4L 132 120 522 39 52 ACG:gtACGT CACag:G
TBF1r5e_e5L,
TBF1r5e_a7L
134 120 524 40 52 ACG:gtACGT CACag:G
TBF1r5w_f4L 88 333 462 36 50 GAG:gtGAGT CACag:G
TBF1r5w_f5L 91 329 477 37 51 GAG:gtGAGT CACag:G
TBF1r7w_g4L 91 333 481 36 51 GAG:gtGAGT CACag:G
TBF1r7w_d5L,
TBF1r7w_e3L
96 333 486 32 48 GAG:gtAAGT AACag:G
TBF1r9e_e3L 143 120 533 50 48 GAG:gtACGT TGTag:G
Chlorophyte-like NR genes GS21NR1A3 69 328 522 56.5 61 GGG:gtACGT CTAAG:c GS51NR2A10 98 191 524 65.3 64 ACG:gtGCAC GGCAG:g GS51NR2B2 98 191 522 66.3 64 ACG:gtGCAC GGCAG:g GS21NR1B10 109 267 537 69.7 65 ACG:gtGCGC GGCAG:g GS51NR2D6 126 216 552 37.3 58 CAT:gtGAGT TTCAG:g GS51NR2A9 63 201 603 58.7 63 GCG:gtGAAC TGCAG:g GS21NR2A1, GS21NR2C1, GS51NR2D1, GS21NR2A5, GS51NR2D3, GS51NR2D7, GS51NR2D10, GS51NR2D11
63, 63, 69
201, 383, 588
782 58.7, 55.6, 56.5
59 GCG:gtGAAC TAC:gtTCGC GGG:gtAAGA
TGCAG:g CCAAG:g CTAAG:c
GS21NR2A4 63, 63, 69
201, 383, 588
782 57.1, 55.6, 56.5
59 GCG:gtGAAC AAC:gtTCGC GGG:gTAAGA
TGCAG:g CCAAG:g CTAAG:c
GS21NR2B2 63, 63, 69
201, 383, 588
782 58.7, 55.6, 55.1
59 GCG:gtGAAC TAC:gtTCGC GGG:gtAAGA
TGCAG:g CCAAG:g CTAAA:c
GS21NR2B7 63, 63, 69
201, 383, 588
782 58.7, 54, 56.5
60 GCG:gtGAAC TAC:gtTCGC GGG:gtAAGA
TGCAG:g CCAAG:g CTAAG:c
GS51NR2D5 63, 63,
201, 383,
782 58.7, 55.6,
59 GCG:gtGAAC TAC:gtTCGC
TGCAG:g CCAAG:g

69 588 58 GGG:gtAAGA CTAAG:c GS51NR2A7 63,
63, 69
201, 383, 588
782 58.7, 54, 56.5
60 GCG:gtGAAC TAC:gtTCGC GGG:gtAAGA
TGCAG:g CCAAG:c CTAAG:c
GS51NR2A3, GS51NR2B5
110, 57
292, 623
849
55.5, 70.2
64
CTG:gtAAAG CCC:gtGTTG
CACAG:c CGCAG:c

Supplementary Table 5. Characteristics of introns in Nrt2 gene fragments from Onslow Bay Sequence name Intron
length (bp)
Intron start position (bp from the partial 5ʹ′ end)
Length of DNA amplicon
Donor site Acceptor site
Intron GC content (%)
Exon GC content (%)
NT_OSB27SJ_A4 42 bp 153 bp 746 bp AGA:gtATCT CGGAG:a 59.5 50
NT_OSB27BJ_A4 41 bp 153 bp 716 bp AGA:gtATCT CCGAG:a 58.5 50
NT_OSB27BJ_F11 116 bp 152 bp 630 bp AAG:gtTTTC CGGAG:c 57 56
NT_OSB27BJ_B10 77 bp 261 bp 772 bp AGG:gtAAGA CTCAG:g 48 61

Supplementary Table 6: Intron number, length and GC content in key metabolic genes from T.
pseudonana (Tp), F. cylindrus (Fc), P. tricornutum (Pt), M. pusilla CCMP1545 (Mp), E. huxleyi
(Eh) and A. anophagefferens (Aa) genome
Metabolic gene Number of Introns
Intron length (in bp)
Intron GC Content (%)
Exon GC Content (%)
Glutamate dehydrogenase (Tp)
1 77 42 49
Malate synthase (Tp)
1 2 3 4
42 112 148 108
50 42 41 40
48
Phosphofructokinase (Tp) Phosphofructokinase (Fc) Phosphofructokinase (Pt) Phosphofructokinase (Aa)
1 1 2 3 1 1
174 104 119 86 191 162
41 32 32 28 43 65
48 46 57 71
Xeazanthin epoxidase (Tp)
1 2 3
100 45 74
40 60 42
48
Myo-inositol dehydrogenase (Tp) Myo-inositol dehydrogenase (Pt) Myo-inositol dehydrogenase (Eh)
1 2 1 1 2 3 4 5 6
84 81 122 341 269 612 69 672 62
40 37 48 70 59 68 55 66 77
48 53 68
Glycolate oxidase (Tp) Glycolate oxidase (Fc) Glycolate oxidase (Pt) Glycolate oxidase (Mp)
1 1 1 1 2
68 45 101 254 144
44 40 44 64 78
47 43 51 70
Phosphoenolpyruvate carboxylase (Tp)
1 2 3
111 87 100
43 48 55
49

Phosphoenolpyruvate carboxylase (Fc) Phosphoenolpyruvate carboxylase (Eh)
4 5 6 7 1 2 1 2 3 4 5 6 7 8 9 10
51 103 94 64 173 128 68 190 252 1825 250 404 196 152 76 308
43 42 39 42 29 38 74 68 60 68 70 61 63 54 66 62
39 70
Annexin (Tp) Annexin (Pt)
1 2 1
252 78 82
38 41 47
52 48
Ubiquitine protein ligase (Tp) Ubiquitine protein ligase (Fc) Ubiquitine protein ligase (Eh)
1 1 2 1 2 3 4
118 218 222 37 286 117 60
41 34 32 62 62 79 72
49 36 68
Carbamoyl-phosphate synthetase (Tp) Carbamoyl-phosphate synthetase (Pt) Carbamoyl-phosphate synthetase (Eh)
1 2 3 4 1 2 1 2 3 4 5 6 7 8
116 77 75 81 92 84 316 245 71 174 68 164 306 86
44 39 36 42 55 39 80 78 77 70 56 71 68 74
48 52 67

Carbamoyl-phosphate synthetase (Aa)
9 10 11 12 13 14 1 2
71 29 100 114 37 47 196 45
62 48 71 72 57 70 66 84
72
Delta-aminolevulinic acid dehydratase (Pt) Delta-aminolevulinic aciddehydratase (Fc) Delta-aminolevulinic acid dehydratase (Mp) Delta-aminolevulinic acid dehydratase (Eh)
1 2 1 1 2 1 2 3 4 5 6
80 70 130 124 77 73 196 72 54 137 88
45 34 28 41 34 75 75 75 78 76 81
49 44 51 68
Magnesium chelatase (Tp) Magnesium chelatase (Pt) Magnesium chelatase (Aa) Magnesium chelatase (Eh)
1 2 1 1 1
78 115 79 89 113
45 42 35 80 85
48 52 68 66