intu properties plc (registration number · pdf fileduring the period, we acquired madrid...
TRANSCRIPT

INTU PROPERTIES PLC (Registration number UK3685527)ISIN Code: GB0006834344 JSE Code: ITU
Press Release
INTERIM REPORT FOR THE SIX MONTHS ENDED 30 JUNE 2017
David Fischel, intu Chief Executive, commented:
"intu has performed robustly over the six month period in a UK retail environment which continues to be challenging.Retail brands are being selective in their expansion, looking at established locations such as our 17 prime shoppingcentres which are attracting high footfall through their differentiated offering and compelling customer experience.
The resilience of the tenant market in our centres is shown by our 103 lettings in the period at 7 per cent aboveprevious passing rents, including brands such as Next, River Island, Hugo Boss, Gant, Paul Smith, Victoria's Secretand Tesla. Also our tenants continue to invest in upsizing and upgrading their units which has resulted in maintainedhigh occupancy.
Our GBP679 million UK development programme is progressing on schedule with the GBP180 million intu Watford extensionon target to open in Autumn 2018. We expect to start shortly on the GBP71 million intu Lakeside leisure extension whichis over 90 per cent let to tenants including Nickelodeon, Hollywood Bowl and multiple restaurants.
Our Spanish business continues to perform well and intu now owns three of the country's top ten shopping centres.During the period, we acquired Madrid Xanadú for EUR530 million, a centre which has strong leisure attractions includingan indoor ski slope, with an aquarium and Nickelodeon theme park attraction under construction.
We have a clear strategy to deliver long-term value to shareholders and, with cash and available facilities amountingto GBP920 million, we have significant flexibility to pursue opportunities as they arise in the UK and Spain."
Investor presentation
A presentation to analysts and investors will take place at UBS, 5 Broadgate, London EC2 at 09.30BST on 27 July2017. The presentation will also be available to international analysts and investors through a live audio call andwebcast. The presentation and a copy of this announcement will be available on the Group's website intugroup.co.uk.
Enquiries
intu properties plcDavid Fischel Chief Executive +44 (0)20 7960 1207Matthew Roberts Chief Financial Officer +44 (0)20 7960 1353Adrian Croft Head of Investor Relations +44 (0)20 7960 1212Public relationsUK: Justin Griffiths, Powerscourt +44 (0)20 7250 1446SA: Frédéric Cornet, Instinctif Partners +27 (0)11 447 3030
About intu
intu is the UK's leading owner, manager and developer of prime regional shopping centres with a growing presence in Spain. We are passionate about creating uniquely compelling experiences, in centre and online, that attract customers, delivering enhancedfootfall, dwell time and loyalty. This helps our retailers flourish, driving occupancy and income growth.
We own many of the UK's largest and most popular retail destinations, with super-regional centres such as intu Trafford Centre andintu Lakeside and vibrant city centre locations from Newcastle to Watford.
We are focused on four strategic objectives: optimising the performance of our assets to deliver attractive long-term total propertyreturns, progressing our UK development pipeline to add value to our portfolio, leveraging the strength of our brand and seizing theopportunity in Spain to create a business of scale.
We are committed to our local communities, our centres support over 120,000 jobs representing about 4 per cent of the total UKretail workforce, and to operating with environmental responsibility.
Our success creates value for our retailers, investors and the communities we serve.
Presentation of information
We account for our interests in joint ventures using the equity method as required by IFRS 11 Joint Arrangements. This means thatthe income statement and the balance sheet include single lines for the Group's total share of post-tax profit and the netinvestment in joint ventures respectively.
Management review and monitor performance as well as determine the strategy of the business primarily on a proportionatelyconsolidated basis. This includes the Group's share of joint ventures on an individual line-by-line basis rather than a post-tax profitor net investment basis. The figures and commentary presented are consistent with our management approach as we believe thisprovides a more meaningful analysis of the Group's performance. The other information section provides reconciliations of theincome statement and balance sheet between the two bases.

See financial review for more details on the presentation of information and alternative performance measures used.
This press release contains "forward-looking statements" regarding the belief or current expectations of intu properties plc, its Directors and other members of its senior management about intu properties plc's businesses, financial performance and results of operations.
These forward-looking statements are not guarantees of future performance. Rather, they are based on current views and assumptions and involve known and unknown risks, uncertainties and other factors, many of which are outside the control of intu properties plc and are difficult to predict, that may cause actual results, performance or developments to differ materially from any future results, performance or developments expressed or implied by the forward-looking statements. These forward-looking statements speak only as at the date of this press release. Except as required by applicable law, intu properties plc makes no representation or warranty in relation to them and expressly disclaims any obligation to update or revise any forward-looking statements contained herein to reflect any change in intu properties plc's expectations with regard thereto or any change in events, conditions or circumstances on which any such statement is based.
Any information contained in this press release on the price at which shares or other securities in intu properties plc have been bought or sold in the past, or on the yield on such shares or other securities, should not be relied upon as a guide to future performance.
HIGHLIGHTS OF THE FIRST SIX MONTHS OF 2017Operating highlights
Optimising asset performanceWe aim to deliver attractive long-term total property returns from strong, stable income streams- after increases of 1.8 per cent in 2015 and 3.6 per cent in 2016, like-for-like net rental income decreased by 1.5 per cent in the period, against a strong comparative of 7.5 per cent increase for the first half of 2016; guidance of second half recovery to deliver unchanged outcome for 2017- signed 103 long-term leases (80 in the UK and 23 in Spain) delivering GBP18 million of annual rent at an average of 7 per cent above previous passing rent and in line with valuers' assumptions- occupancy stable at 95.9 per cent (December 2016: 96.0 per cent)- footfall decreased by 0.5 per cent (2016: +1.3 per cent) outperforming the national ShopperTrak retail average which fell by 2.7 per cent in the period- like-for-like property values improved slightly in the period, increasing by 0.2 per cent, broadly in line with the IPD monthly retail index of 0.6 per cent (2016: intu +0.0 per cent; IPD down 4.7 per cent)
Delivering UK developmentsBy extending and enhancing our existing locations we aim to deliver superior returns- capital expenditure of GBP99 million in the period including GBP40 million on the GBP180 million extension of intu Watford which is on target to open in Autumn 2018- intend to commence two further developments in 2017 – the GBP71 million Nickelodeon-anchored leisure scheme at intu Lakeside and the GBP74 million extension and enclosure of Barton Square at intu Trafford Centre- signed The Light cinema to anchor the intu Broadmarsh redevelopment and expect to commit to this GBP89 million project later in 2017- near-term committed and pipeline of projects through to the end of 2020 of GBP679 million
Making the brand countWe leverage the strength of our brand to create compelling experiences for our customers- net promoter score, our measure of customer service, running consistently high at around 70- intu Experiences, our dedicated promotions business, generated income of GBP8 million in the period, which is in line with the first half of 2016 (GBP21 million annually, equivalent to the rental income of our eighth largest centre)- intu.co.uk, our online shopping platform providing strong editorial content, has seen an 80 per cent year-on-year increase in visits to our shop pages offering products from 470 retailers- on target to deliver our 2020 environmental objectives ahead of time, including intensity reduction in carbon emissions of 47 per cent since 2010 against our 2020 target of 50 per cent
Seizing the growth opportunity in SpainOur strategy is to create a business of scale through acquisitions and development projects- acquired Madrid Xanadú, one of Spain's top 10 shopping centres in March 2017, for an agreed price of EUR530 million, and announced formation of a joint venture with TH Real Estate for them to take ownership of 50 per cent- completed a EUR8 million project at intu Asturias developing a previously under-utilised space. The redevelopment opened successfully in July 2017- signed 23 leases, including nine for the recently completed development at intu Asturias. New lettings of existing units were 14 per cent above the previous passing rent- occupancy remained strong in our three centres at 98 per cent, with footfall and retailer sales both up by 1 per cent- increases in the market value of existing centres with intu Asturias up 4 per cent and Puerto Venecia, Zaragoza up 3 per cent- strong interest from prospective tenants for the intu Costa del Sol development and progressing discussions with lenders for development finance for the project
Financial strength
Robust capital structure provides capacity to deliver our objectives from a range of funding sources. Since the half year, we haverefinanced a GBP488 million loan on intu Merry Hill, raised additional finance of GBP250 million on intu Trafford Centre and imminentlyexpect to complete the disposal of 50 per cent of Madrid Xanadú. On a pro forma basis, taking into account the above transactions:- cash and available facilities of GBP920 million (31 December 2016: GBP922 million)- weighted average debt maturity of 7.1 years, with minimal refinancing until 2021- substantial headroom on our debt covenants. By way of example, a 25 per cent fall in capital values and 10 per cent fall in income would only require an equity cure of GBP10 million
With 100 per cent ownership of assets valued at GBP6.7 billion and high quality income streams, we intend to continue the process of
recycling capital from existing assets to help finance our investment programme.
Guidance for full year
Our guidance for full year like-for-like net rental income is around 0 per cent, at the bottom end of the previously announced rangeof 0 to 2 per cent. As previously stated, the precise outcome will be dependent on the timing of letting some of the larger units.These units, predominantly the former BHS units, are now all in advanced legals but closure of these transactions is slightly behindour original targets with longer term growth prospects undiminished.
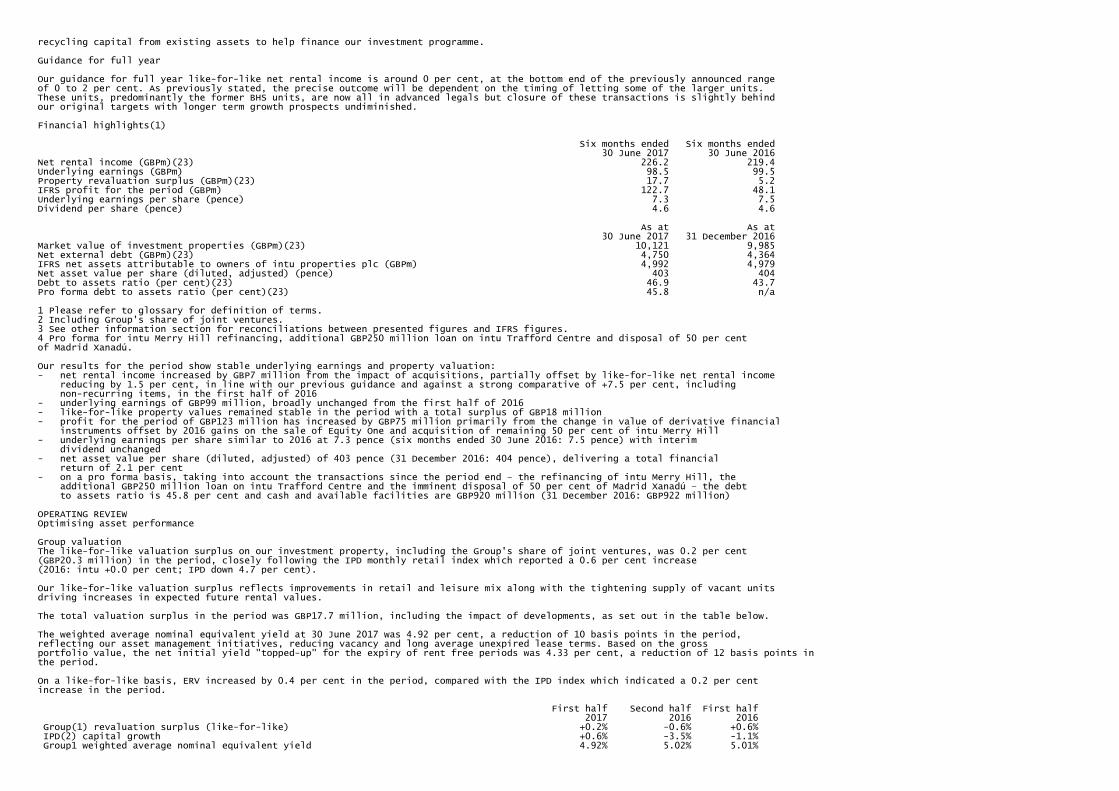
Financial highlights(1)
Six months ended Six months ended 30 June 2017 30 June 2016Net rental income (GBPm)(23) 226.2 219.4Underlying earnings (GBPm) 98.5 99.5Property revaluation surplus (GBPm)(23) 17.7 5.2IFRS profit for the period (GBPm) 122.7 48.1Underlying earnings per share (pence) 7.3 7.5Dividend per share (pence) 4.6 4.6 As at As at 30 June 2017 31 December 2016Market value of investment properties (GBPm)(23) 10,121 9,985Net external debt (GBPm)(23) 4,750 4,364IFRS net assets attributable to owners of intu properties plc (GBPm) 4,992 4,979Net asset value per share (diluted, adjusted) (pence) 403 404Debt to assets ratio (per cent)(23) 46.9 43.7Pro forma debt to assets ratio (per cent)(23) 45.8 n/a
1 Please refer to glossary for definition of terms.2 Including Group's share of joint ventures.3 See other information section for reconciliations between presented figures and IFRS figures.4 Pro forma for intu Merry Hill refinancing, additional GBP250 million loan on intu Trafford Centre and disposal of 50 per cent of Madrid Xanadú.
Our results for the period show stable underlying earnings and property valuation:- net rental income increased by GBP7 million from the impact of acquisitions, partially offset by like-for-like net rental income reducing by 1.5 per cent, in line with our previous guidance and against a strong comparative of +7.5 per cent, including non-recurring items, in the first half of 2016- underlying earnings of GBP99 million, broadly unchanged from the first half of 2016- like-for-like property values remained stable in the period with a total surplus of GBP18 million- profit for the period of GBP123 million has increased by GBP75 million primarily from the change in value of derivative financial instruments offset by 2016 gains on the sale of Equity One and acquisition of remaining 50 per cent of intu Merry Hill- underlying earnings per share similar to 2016 at 7.3 pence (six months ended 30 June 2016: 7.5 pence) with interim dividend unchanged- net asset value per share (diluted, adjusted) of 403 pence (31 December 2016: 404 pence), delivering a total financial return of 2.1 per cent- on a pro forma basis, taking into account the transactions since the period end – the refinancing of intu Merry Hill, the additional GBP250 million loan on intu Trafford Centre and the imminent disposal of 50 per cent of Madrid Xanadú – the debt to assets ratio is 45.8 per cent and cash and available facilities are GBP920 million (31 December 2016: GBP922 million)
OPERATING REVIEWOptimising asset performance
Group valuationThe like-for-like valuation surplus on our investment property, including the Group's share of joint ventures, was 0.2 per cent(GBP20.3 million) in the period, closely following the IPD monthly retail index which reported a 0.6 per cent increase(2016: intu +0.0 per cent; IPD down 4.7 per cent).
Our like-for-like valuation surplus reflects improvements in retail and leisure mix along with the tightening supply of vacant unitsdriving increases in expected future rental values.
The total valuation surplus in the period was GBP17.7 million, including the impact of developments, as set out in the table below.
The weighted average nominal equivalent yield at 30 June 2017 was 4.92 per cent, a reduction of 10 basis points in the period,reflecting our asset management initiatives, reducing vacancy and long average unexpired lease terms. Based on the grossportfolio value, the net initial yield "topped-up" for the expiry of rent free periods was 4.33 per cent, a reduction of 12 basis points inthe period.
On a like-for-like basis, ERV increased by 0.4 per cent in the period, compared with the IPD index which indicated a 0.2 per centincrease in the period.
First half Second half First half 2017 2016 2016 Group(1) revaluation surplus (like-for-like) +0.2% -0.6% +0.6% IPD(2) capital growth +0.6% -3.5% -1.1% Group1 weighted average nominal equivalent yield 4.92% 5.02% 5.01%

Change in Group nominal equivalent yield -10bp +1bp -13bp IPD(2) equivalent yield shift -7bp +25bp +4bp Group(1) "topped-up" net initial yield (EPRA) 4.33% 4.45% 4.49% Group(1) change in like-for-like ERV +0.4% +0.1% -0.1% IPD(2) change in rental value index +0.2% +0.3% +0.5%
1 Including Group's share of joint ventures.2 IPD monthly index, retail.
The table below shows the main components of the Group's GBP17.7 million overall valuation surplus:
Market value Like-for-like 30 June 31 December Surplus/ Surplus/ 2017 2016 (deficit) (deficit) GBPm GBPm GBPm %intu Lakeside 1,395.0 1,375.0 10.4 1Intu Chapelfield 305.1 296.3 9.5 3intu Trafford Centre 2,324.0 2,312.0 9.4 –intu Potteries 162.5 169.0 (8.0) (5)intu Braehead 533.1 546.2 (12.0) (2)Other UK like-for-like 4,845.7 4,802.0 0.5 –Total UK like-for-like 9,565.4 9,500.5 9.8 –Spain like-for-like 353.2 331.0 10.5 3Redevelopments 202.2 153.2 (3.6) n/aInvestment and development property including Group's share of joint ventures 10,120.8 9,984.7 16.7 n/aAcquisition: Madrid Xanadú (asset held for sale) 462.8 – 1.0 n/aTotal 10,583.6 9,984.7 17.7 n/a
- intu Lakeside: completion of new leases and renewals on expiry adds certainty to the income streams going forward as well as providing evidence for growth in future rental levels- intu Chapelfield: strong investment demand for prime centres with limited vacant units and strong tenant mix- intu Trafford Centre: new lettings continue to drive forward rental tone- intu Potteries: pressure on long-term rental values has impacted the centre's value- intu Braehead: continuation of the less buoyant occupier and investment market in Scotland has resulted in a reduction in value of this centre- Spain: limited vacant space and strong operating metrics increase the rental value potential of intu Asturias and Puerto Venecia, Zaragoza (see below – seizing the growth opportunity in Spain – for further details)
Group like-for-like net rental income
Like-for-like net rental income was 1.5 per cent lower than the same period in 2016 due to non-recurring rental items in the first halfof 2016 not repeating and the impact of the closure of BHS which was fully income producing in the first half of 2016, partially offsetby rental growth from new lettings and rent reviews, analysed as follows:
First half First half 2017 2016 % %Rent reviews, improved letting and turnover income +2.5% +2.3%Capital investment +0.5% +0.9%Vacancy impact -0.2% +1.9%Units closed for redevelopment -2.1% –Other letting activity (e.g. bad debt; surrender premiums) -2.2% +2.4%Total like-for-like net rental income -1.5% +7.5%
Our guidance for full year like-for-like net rental income is around 0 per cent, at the bottom end of the previously announced rangeof 0 to 2 per cent. As previously stated, the precise outcome will be dependent on the timing of letting some of the larger units.These units, predominantly the former BHS units, are now in advanced legals but closure of these transactions is slightly behindour original targets with longer term growth prospects undiminished. We expect the reletting of the former BHS units to increasethe rents on these units by around 15 per cent in aggregate.
UK operating metrics First half Full year First half 2017 2016 2016Occupancy 95.9% 96.0% 96.1%- of which, occupied by tenants trading in administration 0.3% 0.5% 1.3%Leasing activity - number, new rent 80, GBP17m 187, GBP35m 82, GBP16m- new rent relative to previous passing 7% above 4% above 7% aboveFootfall -0.5% +1.3% +1.3%Retailer sales (like-for-like centres) -2.1% +0.2% +0.2%Rent to estimated sales (exc. anchors and major space users) 12.4% 12.2% 12.5%
Occupancy is 95.9 per cent, in line with 31 December 2016 and 30 June 2016. Five UK centres now have occupancy of 98 percent or above.
We agreed 80 new long-term leases in the period, amounting to GBP17 million new annual rent, at an average of 7 per cent above
previous passing rent (like-for-like units) and in line with valuers' assumptions. Retailers continue to focus on increasing their spacein prime, high footfall retail destinations. Significant activity in the period includes:- key fashion retailers upsizing to optimise their offering and configuration, including Next and River Island at intu Merry Hill- aspirational and international brands continuing to recognise the attraction of destination shopping centres, with Hugo Boss and Guess joining the line up at intu Metrocentre, Tesla and Victoria's Secret at intu Milton Keynes, Tag Heuer opening its first store in the West Midlands at intu Merry Hill and Paul Smith opening its first Manchester store at Manchester Arndale- traditional retail park tenants introducing smaller format stores in our prime high footfall locations. This includes Decathlon at intu Uxbridge, taking part of the former BHS unit, and Sharps Bedrooms at intu Lakeside, intu Eldon Square and intu Broadmarsh
84 new shops opened or refitted in our UK centres in the first half of 2017, around 3 per cent of our 2,800 units. Tenants haveinvested around GBP41 million in these stores, a significant demonstration of their commitment to our centres.
We settled 117 rent reviews in the period for new rents totalling GBP27 million, an average uplift of 8 per cent on the previous rents.
Footfall was 0.5 per cent lower than the same period in 2016. The closure of the Sainsbury's unit for redevelopment at intu MerryHill and the short-term impact on our Manchester centres following the terrorist attack in the city have impacted the period.Excluding these, other centres were 0.4 per cent ahead of 2016. This is ahead of the ShopperTrak measure of UK national retailfootfall which is down by 2.7 per cent for the same period.
Estimated retailer sales in our centres were down 2.1 per cent in the period. The ratio of rents to estimated sales for standard unitsremained stable in the period at 12.4 per cent.
The difference between annual property income (see glossary) of GBP490 million and ERV of GBP569 million represents GBP38 million fromvacant units and reversion of GBP41 million, 8 per cent, from rent reviews and lease expiry. Of the 8 per cent reversion, 1 per cent isonly realisable on expiry of leases with over 10 years remaining (e.g. anchor units), leaving 7 per cent realisable from other leaseexpiries and rent reviews.
The weighted average unexpired lease term is 7.3 years (31 December 2016: 7.7 years). 89 per cent of our top 40 tenants, over 50per cent of the rent roll, have a below average risk profile according to Experian Delphi bands, illustrating the quality and longevityof our income streams.
Delivering UK developments
In the period we spent GBP99 million on capital expenditure. This included GBP40 million on intu Watford, GBP32 million on the acquisitionof additional properties (all currently income generating) as part of site assembly for future projects, GBP6 million on planning andenabling works for developments and GBP21 million on active asset management projects, including the new Travelodge hotel at intuLakeside and the Next flagship store at intu Metrocentre.
Looking ahead, we are progressing our near-term pipeline of GBP679 million through to the end of 2020. This, along with a furtherGBP1.3 billion of opportunities over the next 10 years provides a robust platform for organic growth delivering value-enhancing returns.
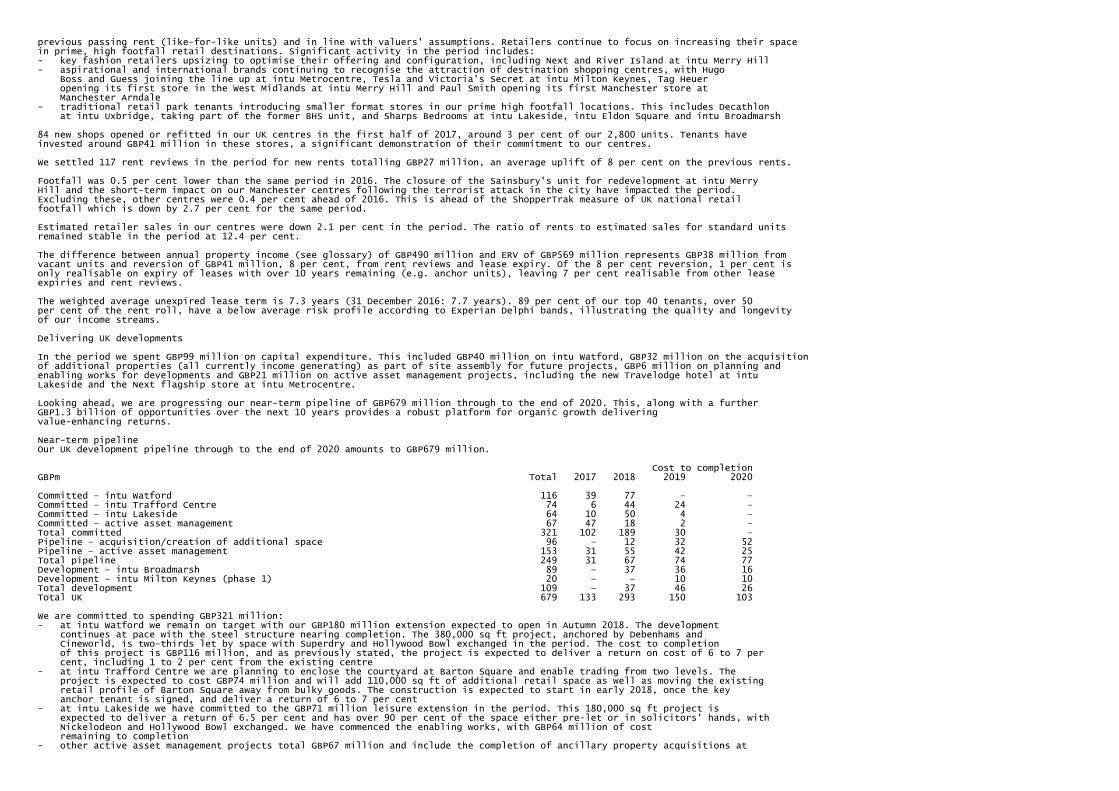
Near-term pipelineOur UK development pipeline through to the end of 2020 amounts to GBP679 million.
Cost to completionGBPm Total 2017 2018 2019 2020 Committed – intu Watford 116 39 77 – –Committed – intu Trafford Centre 74 6 44 24 –Committed – intu Lakeside 64 10 50 4 –Committed – active asset management 67 47 18 2 –Total committed 321 102 189 30 –Pipeline – acquisition/creation of additional space 96 – 12 32 52Pipeline – active asset management 153 31 55 42 25Total pipeline 249 31 67 74 77Development – intu Broadmarsh 89 – 37 36 16Development – intu Milton Keynes (phase 1) 20 – – 10 10Total development 109 – 37 46 26Total UK 679 133 293 150 103
We are committed to spending GBP321 million:- at intu Watford we remain on target with our GBP180 million extension expected to open in Autumn 2018. The development continues at pace with the steel structure nearing completion. The 380,000 sq ft project, anchored by Debenhams and Cineworld, is two-thirds let by space with Superdry and Hollywood Bowl exchanged in the period. The cost to completion of this project is GBP116 million, and as previously stated, the project is expected to deliver a return on cost of 6 to 7 per cent, including 1 to 2 per cent from the existing centre- at intu Trafford Centre we are planning to enclose the courtyard at Barton Square and enable trading from two levels. The project is expected to cost GBP74 million and will add 110,000 sq ft of additional retail space as well as moving the existing retail profile of Barton Square away from bulky goods. The construction is expected to start in early 2018, once the key anchor tenant is signed, and deliver a return of 6 to 7 per cent- at intu Lakeside we have committed to the GBP71 million leisure extension in the period. This 180,000 sq ft project is expected to deliver a return of 6.5 per cent and has over 90 per cent of the space either pre-let or in solicitors' hands, with Nickelodeon and Hollywood Bowl exchanged. We have commenced the enabling works, with GBP64 million of cost remaining to completion- other active asset management projects total GBP67 million and include the completion of ancillary property acquisitions at

intu Merry Hill, the Halle Place restaurant redevelopment at Manchester Arndale and the creation of flagship stores for Next at intu Metrocentre and intu Merry Hill. These projects are expected to deliver returns of between 6 and 10 per cent
Our pipeline of planned projects amounts to GBP249 million:- extending the space of existing centres by developing non-income producing areas and acquiring certain adjacent properties is expected to cost GBP96 million. This includes the leisure extension at intu Merry Hill which forms part of our strategy for repositioning the centre. This project is expected to have similar returns to the leisure extension at intu Lakeside- other active asset management projects at the feasibility stage amount to GBP153 million and are across all centres. We have the flexibility to start these projects when we have the required level of pre-lets and expect them to deliver similar returns to those that we have committed to
Extensions and redevelopments to which we have not yet committed are expected to cost GBP109 million. The majority of this relatesto the redevelopment of intu Broadmarsh which is expected to cost GBP89 million and deliver a stabilised initial yield of around 7 percent. In the period, we have signed The Light cinema to anchor the scheme and we would expect to have the required level of pre-lets and completed detailed design to enable us to commit to this by the end of the year. The remaining GBP20 million is thecommencement of phase one of the redevelopment of space at intu Milton Keynes, the planning approval of which has now beenreinstated after the successful outcome of a public inquiry.
Future opportunitiesBeyond 2020, we continue to work on securing the required planning approvals and tenant demand to start GBP1.3 billion of projectswhich we would expect to deliver stabilised initial yields of around 7 per cent. We have the required planning approvals forextensions to intu Lakeside, intu Victoria Centre, intu Braehead and intu Milton Keynes and are at earlier stages of the approvalprocess for the extension at Cribbs Causeway.
FundingWe will fund our near-term pipeline from cash and available facilities and from recycling capital to deliver superior returns. Proforma cash and available facilities at 30 June 2017 were GBP920 million. Further recycling potential lies in the introduction of partnersinto some of our centres, although this would have a short-term impact on earnings through the development phase.
In addition, we expect to raise finance on near-term projects, such as the intu Watford extension, as they complete to fund futureopportunities.
Making the brand count
As the role of a shopping centre operator becomes ever more specialised, the steps we have taken following the rebranding havepositioned us well to ensure our centres remain relevant for both customers and retailers. To ensure the highest quality and theability to deliver initiatives quickly, it is important that we control and manage all our space directly.
The first step of this was to bring all staff in-house and ensure we deliver the best customer service. In addition, we took control ofall our commercialisation within the malls, through intu Experiences, to control the quality and quantity of our mall, promotional andmedia activity. Finally, we embraced the multichannel world of retail introducing a transactional website through intu Digital.
Overall, our scale, expertise and insight along with our in-house teams ensure we offer the best customer service and experiencein an ever evolving multichannel world.
Customer serviceOur focus on putting the customer first is embedded in our culture, with our net promoter score, a measure of customer service,running consistently high at around 70. Pleasingly, the range of scores across centres is narrowing as we are able to roll-out bestpractices across the portfolio.
intu ExperiencesCuration of the customer experience is a key element of our role in managing shopping centres. Having an in-house teamdelivering nationwide immersive brand partnerships, mall commercialisation and advertising is crucial in ensuring everything meetsour quality standards and is complementary to the asset strategy for each centre.
An example of this end to end control is through the large format digital screens we are introducing to centres, providing newincome streams. We own all these screens and in many instances produce the content in an area of growth for us.
Similarly, choosing the brands we work with promotionally is important in delivering the right messages. Through the Easterholidays we furthered our collaboration with Nick Jr., Nickelodeon's pre-school television channel, adding augmented realityfunctionality to our in-centre app to deliver a new family experience to our customers.
We can also focus on innovations and are working with Virgin StartUp on 'Foodpreneur', a competition to find aspiring foodentrepreneurs, and we have launched intu Accelerate, looking for innovative ideas in the retail and leisure market through a 10week incubation programme.
intu DigitalThe attraction of our digital offering through our premium content publisher and shopping platform, intu.co.uk, saw an increase ofover 50 per cent in online sales for retailers in the first six months of 2017.
We recorded an increase in website visits in the period of 2 per cent on the previous year. Visits to centre specific pages showingthe likes of opening times are reducing as search engines provide more of this basic information. However, we are seeing year-on-year growth of over 80 per cent in visits to our shopping platform which offers product comparison from 470 retailers. Key to thisgrowth is our online marketing to the 2.5 million individuals on our active marketing database and over one million social mediaaudience.

Commitment to the communityWe are performing strongly against our 2020 environmental targets, set against a 2010 base line, with a 47 per cent intensityreduction in carbon emissions (target 50 per cent), 100 per cent of waste diverted from landfill of which 74 per cent is recycled(targets 99 per cent and 75 per cent respectively) and a 14 per cent water intensity reduction (target 10 per cent).
Our people are crucial to what we do and in 2017 we have achieved the internationally recognised accreditation Investors inPeople gold standard across all intu branded centres. This highly regarded achievement defines what it takes to lead, support andmanage people well for sustainable results.
Seizing the growth opportunity in Spain
Our Spanish strategy is to create a business of scale through acquisitions and our pipeline of development projects. Concentratingon the top 10 key catchments, we aim to establish a market leading position in the country through ownership and management ofprime shopping resorts. We own and manage three of Spain's top 10 shopping centres and have four development sites with themost advanced project being intu Costa del Sol, near Málaga.
AcquisitionIn March 2017, we acquired Madrid Xanadú, one of Spain's top 10 shopping centres, for an agreed price of EUR530 million. Thecentre has many of the key retailers, including El Corte Ingles, all of the Inditex fascias, Primark and Apple, along with a strongleisure offering of Spain's only indoor ski slope, cinema, bowling and soon to open aquarium and Nickelodeon theme park. Footfallis 13 million, with a potential catchment of four million people living within a 30 minute drive time. There is good reversionarypotential over the medium term, with further growth opportunity from key asset management initiatives which will enhance thecentre's status as a truly regional retail and leisure resort, drawing visitors from a wider catchment.
Further, in May 2017, we announced the formation of a joint venture with TH Real Estate for them to take ownership of 50 per centof Madrid Xanadú based on the original acquisition price. This is expected to complete imminently.
Operational performanceThe occupancy of our Spanish centres is 98 per cent, with Puerto Venecia and Madrid Xanadú both 98 per cent and intu Asturias97 per cent.
We agreed 23 new long-term lettings in the period, amounting to over EUR1 million new annual rent, at an average of 14 per centabove previous passing rent (like-for-like units) and ahead of valuers' assumptions. New names to our centres included Quiz, Levisand Pandora.
In the period we have completed a redevelopment of a previously underutilised area at intu Asturias to introduce a supermarketand new retail units which has opened with one unit remaining to be let. The development has impacted footfall and sales for thecentre in the first six months of the year as the work continued, but this has picked up strongly since opening. Excluding thisimpact, footfall and sales increased in aggregate by around 1 per cent at the other two centres.
We have increased the value of the centres owned throughout the period with our share of Puerto Venecia, Zaragoza, valued atEUR256 million, an increase of 3 per cent, and our share of intu Asturias increased by 4 per cent, to EUR146 million. The investment market in Spain remains strong with continued demand for quality shopping centres.
Near-term pipeline
Cost to completionGBPm Total 2017 2018 2019 2020Committed 4 3 – 1 –Pipeline 40 5 5 15 15intu Costa del Sol 470 – 98 186 186Total 514 8 103 202 201
We are committed to spend GBP4 million, mainly at intu Asturias, and have a pipeline of proposed projects of GBP40 million through tothe end of 2020. These are across all three centres and focus on enhancing the resort content of each centre.
Our plan for intu Costa del Sol, near Málaga, is to develop a shopping resort of around 230,000 sq. m. to target the three millionresidents and 10 million annual tourists to the region. We have received the required planning approval from the local(Torremolinos) town hall and the final approval from the regional government could be received by the end of the year. We havestrong interest from potential tenants and would anticipate being on site in the second half of 2018.
The total cost of the development is expected to be around EUR750 million, including the EUR82 million already incurred by intu, anddeliver a stabilised initial yield of around 7 per cent. We have previously included this project on the basis of introducing a partnerto the project at an early stage, however our current plan is to develop alone and fund through bank and other finance, introducinga partner at a later stage.
Future opportunitiesWe continue to develop plans at the three other sites in Valencia, Palma and Vigo, with intu Valencia being the most likely to followintu Costa del Sol.
TOP PROPERTIES Annual Headline Market Size Number property rent ABC value (sq. ft. 000) Ownership of stores income ITZA customers Key storesSuper-regional centresintu Trafford GBP2,324m 1,973 100% 228 GBP94.6m GBP435 66% Debenhams, Topshop, Selfridges,Centre John Lewis, Next, Apple, Ted
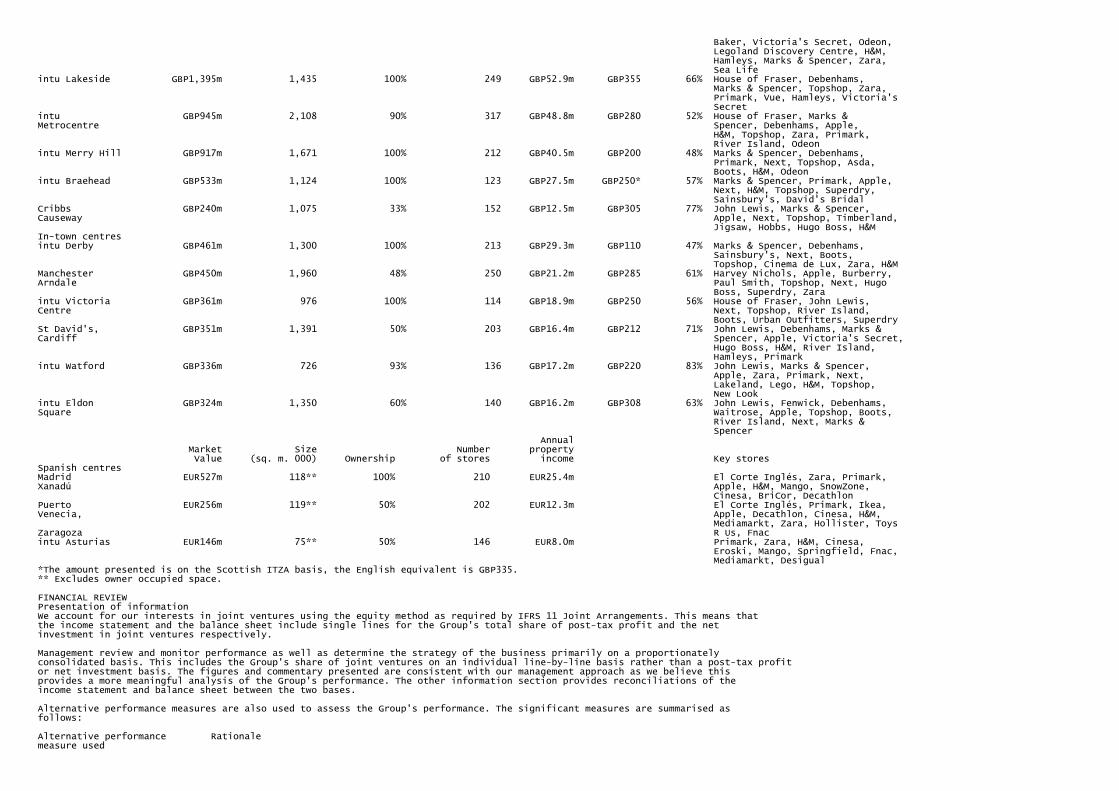
Baker, Victoria's Secret, Odeon, Legoland Discovery Centre, H&M, Hamleys, Marks & Spencer, Zara, Sea Lifeintu Lakeside GBP1,395m 1,435 100% 249 GBP52.9m GBP355 66% House of Fraser, Debenhams, Marks & Spencer, Topshop, Zara, Primark, Vue, Hamleys, Victoria's Secretintu GBP945m 2,108 90% 317 GBP48.8m GBP280 52% House of Fraser, Marks &Metrocentre Spencer, Debenhams, Apple, H&M, Topshop, Zara, Primark, River Island, Odeonintu Merry Hill GBP917m 1,671 100% 212 GBP40.5m GBP200 48% Marks & Spencer, Debenhams, Primark, Next, Topshop, Asda, Boots, H&M, Odeonintu Braehead GBP533m 1,124 100% 123 GBP27.5m GBP250* 57% Marks & Spencer, Primark, Apple, Next, H&M, Topshop, Superdry, Sainsbury's, David's BridalCribbs GBP240m 1,075 33% 152 GBP12.5m GBP305 77% John Lewis, Marks & Spencer,Causeway Apple, Next, Topshop, Timberland, Jigsaw, Hobbs, Hugo Boss, H&MIn-town centresintu Derby GBP461m 1,300 100% 213 GBP29.3m GBP110 47% Marks & Spencer, Debenhams, Sainsbury's, Next, Boots, Topshop, Cinema de Lux, Zara, H&MManchester GBP450m 1,960 48% 250 GBP21.2m GBP285 61% Harvey Nichols, Apple, Burberry,Arndale Paul Smith, Topshop, Next, Hugo Boss, Superdry, Zaraintu Victoria GBP361m 976 100% 114 GBP18.9m GBP250 56% House of Fraser, John Lewis,Centre Next, Topshop, River Island, Boots, Urban Outfitters, SuperdrySt David's, GBP351m 1,391 50% 203 GBP16.4m GBP212 71% John Lewis, Debenhams, Marks &Cardiff Spencer, Apple, Victoria's Secret, Hugo Boss, H&M, River Island, Hamleys, Primarkintu Watford GBP336m 726 93% 136 GBP17.2m GBP220 83% John Lewis, Marks & Spencer, Apple, Zara, Primark, Next, Lakeland, Lego, H&M, Topshop, New Lookintu Eldon GBP324m 1,350 60% 140 GBP16.2m GBP308 63% John Lewis, Fenwick, Debenhams,Square Waitrose, Apple, Topshop, Boots, River Island, Next, Marks & Spencer Annual Market Size Number property Value (sq. m. 000) Ownership of stores income Key storesSpanish centresMadrid EUR527m 118** 100% 210 EUR25.4m El Corte Inglés, Zara, Primark,Xanadú Apple, H&M, Mango, SnowZone, Cinesa, BriCor, DecathlonPuerto EUR256m 119** 50% 202 EUR12.3m El Corte Inglés, Primark, Ikea,Venecia, Apple, Decathlon, Cinesa, H&M, Mediamarkt, Zara, Hollister, ToysZaragoza R Us, Fnacintu Asturias EUR146m 75** 50% 146 EUR8.0m Primark, Zara, H&M, Cinesa, Eroski, Mango, Springfield, Fnac, Mediamarkt, Desigual*The amount presented is on the Scottish ITZA basis, the English equivalent is GBP335.** Excludes owner occupied space.
FINANCIAL REVIEWPresentation of informationWe account for our interests in joint ventures using the equity method as required by IFRS 11 Joint Arrangements. This means thatthe income statement and the balance sheet include single lines for the Group's total share of post-tax profit and the netinvestment in joint ventures respectively.
Management review and monitor performance as well as determine the strategy of the business primarily on a proportionatelyconsolidated basis. This includes the Group's share of joint ventures on an individual line-by-line basis rather than a post-tax profitor net investment basis. The figures and commentary presented are consistent with our management approach as we believe thisprovides a more meaningful analysis of the Group's performance. The other information section provides reconciliations of theincome statement and balance sheet between the two bases.
Alternative performance measures are also used to assess the Group's performance. The significant measures are summarised asfollows:
Alternative performance Rationalemeasure used

Like-for-like amounts Like-for-like amounts are presented as they indicate operating performance as distinct from the impact of acquisitions or disposals. In respect of property, the like-for-like measure relates to property which has been owned throughout both periods without significant capital expenditure in either period, so that income can be compared on a like-for-like basis. For the purposes of comparison of capital values, this will also include assets owned at the previous reporting period end but not throughout the prior period. Further analysis is presented in the other information section and in the operating review.
Net asset value ('NAV') NAV (diluted, adjusted) is presented as it is considered to be a key measure of the Group's(diluted, adjusted) performance. The key difference from EPRA NAV, an industry standard comparable measure, is the exclusion of interest rate swaps not currently used for economic hedges of debt as, in our view, this better allows management to review and monitor the Group's performance. A reconciliation of NAV (diluted, adjusted) to NAV attributable to owners of intu properties plc as well as EPRA NAV is provided in note 13(a).
Underlying earnings Underlying earnings is presented as it is considered to be a key measure of the Group's recurring income performance and an indication of the extent to which dividend payments are supported by underlying operations. It excludes property and derivative valuation movements, exceptional items and related tax. The key difference from EPRA earnings, an industry standard comparable measure, relates to adjustments in respect of exceptional items where EPRA is prescriptive about the adjustments that can be made. A reconciliation of underlying earnings to profit for the period attributable to owners of intu properties plc as well as EPRA earnings is provided in note 12(c). The underlying profit statement is also presented in full in the other information section.
Overview
Underlying earnings of GBP98.5 million is marginally down from GBP99.5 million in the first half of 2016. This reflects the reduction in like-for-like net rental income in the period, partially offset by the net impact of recent acquisitions and disposals. Underlying earnings per share of 7.3 pence, a decrease of 3 per cent on the same period in 2016.
Profit for the period attributable to owners of intu properties plc of GBP127.1 million has increased by GBP75.6 million, impacted by thechange in fair value of financial instruments, a surplus of GBP18.7 million (six months ended 30 June 2016: a charge of GBP130.6million), as well as a surplus on property valuations of GBP17.7 million (six months ended 30 June 2016: surplus of GBP5.2 million),partially offset by 2016 gains of GBP74.1 million on the sale of Equity One and GBP34.8 million on the acquisition of the remaining 50 percent of intu Merry Hill.
Net asset value per share of 403 pence is broadly unchanged from 31 December 2016, which when taking account of the dividendpaid in the period of 9.4 pence delivers a total financial return for the six months ended 30 June 2017 of 2.1 per cent.
In March we continued to increase our presence in Spain and strengthen our super prime portfolio, acquiring 100 per cent ofMadrid Xanadú for GBP453.5 million (EUR516.8 million). As part of this we arranged a EUR265 million loan facility, with a 2022 maturity. In May we announced the formation of a joint venture with TH Real Estate for them to take ownership of 50 per cent of MadridXanadú based on the original acquisition price. This transaction is expected to complete imminently. As a result, in accordancewith IFRS, the net assets of Madrid Xanadú have been classified as held for sale in the balance sheet.
Our financing metrics remain strong mainly due to our continued refinancing activity. In the period, we issued and refinanced GBP366million of debt, including the refinancing of intu Milton Keynes in February and financing of the acquisition of Madrid Xanadú inMarch. Our debt to assets ratio of 46.9 per cent (31 December 2016: 43.7 per cent) remains below our target maximum level of 50per cent. Our interest cover ratio of 1.93x has decreased slightly in the year (31 December 2016: 1.97x) with satisfactory headroomabove our target minimum level of 1.60x. At 30 June 2017 we had cash and available facilities of GBP566.9 million which havereduced in the period due to the acquisition of Madrid Xanadú (31 December 2016: GBP922.3 million).
Since the period end we have completed the refinancing of intu Merry Hill with a GBP488 million loan, have secured an additionalGBP250 million facility on intu Trafford Centre and imminently expect to complete the disposal of 50 per cent of Madrid Xanadú. On a pro forma basis, we have a debt to assets ratio of 45.8 per cent and cash and available facilities of GBP920 million.
Income statement Six months ended 30 June 2017 2016 Group Group Share of including including joint share of joint share of joint Group ventures ventures ventures GBPm GBPm GBPm GBPmUnderlying earnings 98.5 – 98.5 99.5Adjusted for:Revaluation of investment and development property 9.2 8.5 17.7 5.2Gain on acquisition of businesses – – – 34.8Loss on disposal of subsidiaries (0.9) – (0.9) –(Loss)/gain on sale of other investments – (0.3) (0.3) 74.1Administration expenses – exceptional (1.7) – (1.7) (1.3)Exceptional finance costs (12.2) – (12.2) (12.4)Change in fair value of financial instruments 18.1 0.6 18.7 (130.6)Tax on the above (0.3) 1.5 1.2 (16.7)Share of joint ventures' items 9.9 (9.9) – –Share of associates' items 4.0 – 4.0 (2.4)Non-controlling interests in respect of the above 2.5 (0.4) 2.1 1.3

Profit for the period attributable to owners ofintu properties plc 127.1 – 127.1 51.5Underlying earnings per share (pence) 7.3p n/a 7.3p 7.5p
Underlying earnings of GBP98.5 million is broadly unchanged from GBP99.5 million in the first half of 2016, the key movements of whichare shown in the chart below. Underlying earnings per share of 7.3 pence, a decrease of 3 per cent on the same period in 2016.
Underlying earnings (GBPm)H1 2016 99.5Net rental income: like-for-like -3.3Net rental income: acquisitions/disposal + 10.1Net finance costs -5.7Administration costs -2.3Other +0.2H1 2017 98.5
Net rental income increased GBP6.8 million primarily due to the acquisition of Madrid Xanadú in March 2017 and the acquisition of theremaining 50 per cent of intu Merry Hill in June 2016, partially offset by the impact of the disposal of intu Bromley in December2016 and the slight reduction in like-for-like net rental income in the period.
Like-for-like net rental income decreased by GBP3.3 million, 1.5 per cent, driven by non-recurring rental items in the first half of 2016and the impact of the closure of BHS which was fully income producing in the first half of 2016, partially offset by rental growth fromnew lettings and rent reviews (see operating review).
Net finance costs have increased by GBP5.7 million primarily due to debt relating to the acquisition of Madrid Xanadú in March 2017,the acquisition of the remaining 50 per cent of intu Merry Hill in June 2016 and the GBP375 million convertible bonds issued inNovember 2016.
The profit for the period attributable to owners of intu properties plc is GBP127.1 million, an increase on the GBP51.5 million reported for the six months ended 30 June 2016. This was primarily due to the change in fair value of financial instruments, a surplus of GBP18.7 million (six months ended 30 June 2016: a charge of GBP130.6 million), as well as a surplus on property valuations of GBP17.7 million (six months ended 30 June 2016: surplus of GBP5.2 million), partially offset by 2016 gains of GBP74.1 million on the sale of Equity One and GBP34.8 million on the acquisition of the remaining 50 per cent of intu Merry Hill.
Our investment in joint ventures contributed GBP18.4 million to the profit of the Group (six months ended 30 June 2016: GBP17.6 million)including GBP8.5 million to underlying earnings (six months ended 30 June 2016: GBP12.1 million) and a gain on property valuations ofGBP8.5 million (six months ended 30 June 2016: GBP8.8 million).
As detailed in the table below, our net rental income margin has reduced to 88 per cent primarily due to higher void costs from theclosure of the former BHS units. Property operating expenses largely comprise car park operating costs and the Group'scontribution to shopping centre marketing programmes. Our ratio of total costs to income, as calculated in accordance with EPRAguidelines, remains low at 15.0 per cent (see other information section).
Six months Six months ended ended 30 June 30 June 2017 2016 GBPm GBPmGross rental income 268.5 258.8Head rent payable (10.2) (13.0) 258.3 245.8Net service charge expense and void rates (14.5) (11.0)Bad debt and lease incentive write-offs (1.4) (1.0)Property operating expense (16.2) (14.4)Net rental income 226.2 219.4Net rental income margin 87.6% 89.3%EPRA cost ratio (excluding direct vacancy costs) 15.0% 14.1%
Balance sheet
30 June 31 December 2017 2016 Group Group Group Share of including including balance joint share of joint share of joint sheet ventures ventures ventures GBPm GBPm GBPm GBPmInvestment and development property 9,322.5 746.2 10,068.7 9,944.5Investment in joint ventures 603.1 (603.1) – –Investment in associates and other investments 86.6 – 86.6 80.7Net external debt (4,605.7) (144.4) (4,750.1) (4,364.1)Derivative financial instruments (351.8) (1.9) (353.7) (380.0)Assets and associated liabilities classified as held for sale 230.7 – 230.7 –Other assets and liabilities (230.2) 6.1 (224.1) (234.7)

Net assets 5,055.2 2.9 5,058.1 5,046.4Non-controlling interest (63.2) (2.9) (66.1) (67.6)Attributable to shareholders 4,992.0 – 4,992.0 4,978.8Fair value of derivative financial instruments 351.8 1.9 353.7 380.0Other adjustments 79.2 (1.9) 77.3 76.3Effect of dilution 2.6 – 2.6 2.6Net assets (diluted, adjusted) 5,425.6 – 5,425.6 5,437.7NAV per share (diluted, adjusted) (pence) 403p – 403p 404p
The Group's net assets attributable to shareholders are GBP4,992.0 million, an increase from GBP4,978.8 million at 31 December 2016,while net assets (diluted, adjusted) are GBP5,425.6 million, a decrease from GBP5,437.7 million at 31 December 2016.
Net asset value per share (pence)31 Dec 2016 404Underlying earnings +7Dividend paid -9Exceptional costs -1Valuation surplus +1Foreign exchange movement +130 Jun 2017 403
NAV per share (diluted, adjusted) at 30 June 2017 decreased from 31 December 2016 to 403 pence with the key movementsshown in the chart above. This was driven principally by underlying earnings in the period of 7.3 pence, offset by the final dividendfor 2016 of 9.4 pence paid in the period.
Investment and development property has increased by GBP124.2 million primarily due to capital expenditure of GBP108.6 million, and asurplus on revaluation of GBP17.7 million. The acquisition of Madrid Xanadú in March has been subsequently classified as an assetheld for sale and therefore does not impact this movement.
Our net investment in joint ventures is GBP603.1 million at 30 June 2017 (31 December 2016: GBP587.6 million), which includes theGroup's share of net assets, on an equity accounted basis, of GBP375.1 million (31 December 2016: GBP355.4 million) and loans to jointventures of GBP228.0 million (31 December 2016: GBP232.2 million). The increase in net investment in joint ventures primarily reflectsthe Group's share of their profit in the period.
Investments in associates and other investments of GBP86.6 million primarily represent our interests in India, which comprises a 32per cent interest in Prozone (GBP48.7 million), a shopping centre developer listed on the Indian stock market, and a direct interest inEmpire (GBP21.0 million), owner and operator of a shopping centre in Aurangabad. See notes 16 and 17 for further details.
Net external debt of GBP4,750.1 million has increased by GBP386.0 million primarily from funding our acquisition of Madrid Xanadú andcapital expenditure in the period. Cash including the Group's share of joint ventures has reduced by GBP2.7 million to GBP288.9 millionand gross debt has increased by GBP383.3 million to GBP5,039.0 million.
Derivative financial instruments comprise the fair value of the Group's interest rate swaps. The net liability at 30 June 2017 isGBP353.7 million, a decrease of GBP26.3 million in the period, with the UK 10-year bond yield increasing marginally from 1.24 per cent to1.26 per cent. Cash payments in the year totalled GBP21 million, GBP12 million of which has been classified as an exceptional financecost as it relates to payments in respect of unallocated interest rate swaps. The balance of the payments has been included asunderlying finance costs as it relates to ongoing interest rate swaps used to hedge debt.
As previously detailed, we have a number of interest rate swaps, entered into some years ago, which are unallocated due to achange in lenders' practice. At 30 June 2017 these interest rate swaps have a market value liability of GBP239.6 million (31 December2016: GBP253.2 million). It is estimated that we will be required to make cash payments on these interest rate swaps of GBP13 million inthe second half of 2017, GBP28 million in 2018, reducing to below GBP18 million per annum in 2021.
Assets and associated liabilities classified as held for sale of GBP230.7 million relate to Madrid Xanadú. In May we announced theformation of a joint venture with TH Real Estate for them to take ownership of 50 per cent of Madrid Xanadú based on the originalacquisition price. This transaction is expected to complete imminently. As a result, in accordance with IFRS, the net assets ofMadrid Xanadú have been classified as held for sale in the balance sheet.
The non-controlling interest at 30 June 2017 relates primarily to our partner's 40 per cent stake in intu Metrocentre.
We are exposed to foreign exchange movements on our overseas investments and our policy is to ensure that the net exposure toforeign currency is less than 10 per cent of the Group's net assets attributable to shareholders. At 30 June 2017 the exposure, proforma for the 50 per cent disposal of Madrid Xanadú, is 8 per cent, higher than the 7 per cent at 31 December 2016 due to ourincreased exposure in Spain from the acquisition of Madrid Xanadú.
Cash flow
Six months ended Six months ended 30 June 2017 30 June 2016 GBPm GBPmGroup cash flow as reported Cash flows from operating activities 67.9 73.0Cash flows from investing activities (539.7) (244.8)Cash flows from financing activities 466.9 140.6Foreign currency movements 0.1 1.1Net decrease in Group cash and cash equivalents (4.8) (30.1)

During the six months ended 30 June 2017 cash and cash equivalents decreased by GBP4.8 million.
Cash flows from operating activities of GBP67.9 million are GBP5.1 million lower than 2016, primarily due to the timing of payments.Cash flows from investing activities reflect cash outflows for our acquisition of Madrid Xanadú of GBP446.3 million and capitalexpenditure paid during the period of GBP91.3 million.
Cash flows from financing activities include net debt drawdowns of GBP586.4 million primarily to fund our acquisition of MadridXanadú, partially offset by dividends paid in cash during the period of GBP117.8 million.
Financing
Debt structureWe have carried out significant refinancing activity in recent years which has resulted in diversified sources of funding, includingsecured bonds plus syndicated bank debt secured on individual or pools of assets, with limited or no recourse from the borrowingentities to other Group companies outside of these arrangements. Our corporate-level debt remains limited to the Revolving CreditFacility ('RCF') as well as the GBP375 million and GBP300 million convertible bonds.
During the period we undertook the following financing activities: - agreed a new GBP140 million facility secured against intu Milton Keynes, replacing the previous GBP125 million loan, maturing in 2019 - agreed a EUR265 million facility in connection with the acquisition of Madrid Xanadú, maturing in 2022
Since the period end, we have completed the refinancing of intu Merry Hill with a GBP488 million secured facility, now maturing in2024, and have secured an additional GBP250 million loan on intu Trafford Centre, maturing in 2022. Based on the current shareprice, it is likely the GBP300 million convertible bonds, maturing in 2018, will be repaid in cash. The chart below illustrates that wehave no major refinancing requirement due until 2021.
Debt maturity (GBPm) 2017 82018 3232019 2862020 882021 9212022 7732023 9582024 6022025 272026 282027-2031 1.0752032-2036 261
Debt measures 30 June 31 December 2017 2016Debt to assets 45.8%1 43.7%Interest cover 1.93x 1.97xWeighted average debt maturity 7.1 years(1) 7.1 years2Weighted average cost of gross debt 4.3%(1) 4.3%Proportion of gross debt with interest rate protection 99%(1) 88%Cash and available facilities GBP919.6m(1) GBP922.3m
1 Pro forma for intu Merry Hill refinancing, additional GBP250 million loan on intu Trafford Centre and disposal of 50 per cent of Madrid Xanadú.2 Pro forma for intu Milton Keynes refinancing, completed February 2017.
On a pro forma basis, our debt to assets ratio has increased to 45.8 per cent since 31 December 2016 due to the acquisition ofMadrid Xanadú and remains below our target maximum level of 50 per cent. Our weighted average debt maturity is unchanged at7.1 years and the weighted average cost of gross debt is unchanged at 4.3 per cent (excluding the RCF).
Interest cover of 1.93x has decreased slightly during the period and remains above our target minimum level of 1.60x.
We use interest rate swaps to fix interest obligations, reducing any cash flow volatility caused by changes in interest rates. Theproportion of debt with interest rate protection on a pro forma basis has increased in the period to 99 per cent within our policyrange of between 75 per cent and 100 per cent.
CovenantsFull details of the debt financial covenants are included in the other information section of this report. We are in compliance with allof our covenants and regularly stress test them for changes in capital values and income. A 25 per cent fall in property values anda 10 per cent reduction in income would only require a GBP10 million equity cure.
Capital commitmentsWe have an aggregate commitment to capital projects of GBP325.0 million at 30 June 2017 (31 December 2016: GBP257.0 million).In addition to the committed expenditure, we have an identified uncommitted pipeline of active management projects, majorextensions and developments that may become committed over the next three years (see operating review).
Other information

Tax policy positionLike all Real Estate Investment Trusts ('REIT's), tax on property operating profits is paid at shareholder level to the UKGovernment rather than by the Group. REIT status brings with it the requirement to operate within the rules of the REIT regime(see glossary for further information).
The Group's principle of good governance extends to our responsible approach to tax. We look to minimise the level of taxrisk and at all times seek to comply fully with our regulatory and other tax obligations and to act in a way which upholds intu'sreputation as a responsible corporate citizen by regularly carrying out risk reviews, seeking pre-clearance from HMRC in complexareas and actively engaging in discussions regarding proposed changes in the taxation system that might affect the Group. Itremains important to our stakeholders that our approach to tax is aligned to the long-term values and strategy of the Group. TheChief Financial Officer is the Executive Committee member with executive responsibility for tax matters, with close involvement ofexecutive and senior management.
We pay tax directly on overseas earnings, any UK non-property income under the REIT rules, business rates and transaction taxessuch as stamp duty land tax. In the six months ended 30 June 2017 the total of such payments to tax authorities was GBP13.1 million,of which GBP11.6 million was in the UK and GBP1.5 million in Spain. In addition, we also collect VAT, employment taxes and withholdingtax on dividends for HMRC and the Spanish tax authorities.
DividendsThe Directors are recommending an interim dividend of 4.6 pence per share in line with the 2016 interim dividend. A scrip dividendalternative may be offered. Details of the apportionment between the PID and non-PID elements per share will be confirmed indue course.
MARKET REVIEWUK investment market
Low interest rates and a weakened value of sterling mean that prime shopping centres continue to attract interest from internationalinvestors. Whilst activity was limited in the first half of 2017 as the UK general election took centre stage, good levels of demandremain for quality assets in the UK's liquid and transparent market for large shopping centres.
However, a flight to quality has ensured prime yields remain stable as investors look at the quality and longevity of income streamscoupled with rental growth potential in a market where new supply, by way of development, remains low. Against this, yields onsecondary assets are drifting outwards due to investors perceiving a relatively poor outlook for such assets.
UK consumer market
Uncertainty from the early stages of discussions of the UK's exit from the EU is creating a mixed picture on the state of the UKconsumer. Unemployment continues at record low levels which should in turn drive earnings growth. However, the increase ininflation from the weakening of sterling after the EU referendum vote is causing prices to rise faster than wages at the momentwhich impacts consumers' disposable income. This is reflected in the Asda benchmark index of household income which hasshown a reduction of 2 per cent since December 2016.
Looking further ahead, the Bank of England's forecasts suggest that wage growth will overtake inflation as we go into 2018.
Consumer confidence, as measured by GfK, had remained broadly stable over the majority of the first half of 2017, but hasdropped following the UK general election in June 2017, reflecting negative sentiment about consumers' personal finances andexpectations for the wider economy.
These mixed messages have not had a material effect on non-food retail spending, which remains unchanged against 2016 (BritishRetail Consortium like-for-like non-food retail index).
Occupier market
Retail is one of the UK's most dynamic and flexible industries which has always been able to adapt quickly in fast-changingenvironments. Retailers are facing both economic and structural challenges and the winners will be those with the right stores inthe right places, who align their online and instore strategies and who give customers an experience they cannot get elsewhere.
Economic pressures include the impact on retailers' cost bases from the weakness of sterling, business rates revaluations andincreases in the national living wage. The current squeeze on disposable income from higher inflation may add more pressure.
Structurally, retailers are still evolving in relation to the opportunities and costs of online shopping with those possessing a strongstore network benefitting from click and collect. This enables them to use their existing efficient distribution networks to reducedelivery costs and convert additional sales when the customer is instore.
Considering the challenges that face them, many retailers are looking at fewer stores, but in the best locations offering high footfallfrom a compelling mix of retail, catering and leisure. This demand is spread across all unit sizes with the powerhouse fashionbrands taking larger flagships and introducing their sub-brands, traditional big box retailers refining their offer to smaller shoppingcentre size stores, new international and aspirational lifestyle brands successfully entering the shopping centre market and thecontinued growth in new leisure concepts. Whilst the rapid expansion of food and beverage operators in the last few years isslowing, leisure operators are increasingly looking at shopping centres for their expansion plans.
With our prime portfolio of shopping centres, offering compelling customer experiences and a sophisticated online offer, we arewell positioned to meet the demands of this changing world, including the trend of online retailers taking physical stores, althoughthis is still at an early stage.
Retailer administrations in the period remained at relatively low levels. Jones the Bootmaker (three units), 99p Stores (one unit)and Handmade Burger Co. (four units) entered administration in the period and amount in total to 0.4 per cent of intu's rent roll.

Spanish market
In recent years, the Spanish economy has had significant growth making it one of Europe's fastest growing economies. Forecastssuggest that this is expected to continue in 2017 with its GDP growth expected to be one of the highest of the major Europeaneconomies. For the consumer, unemployment is at its lowest level for several years and consumer confidence at its highest. This inturn benefits retail sales which are further enhanced by record levels of tourists.
The investment market remains strong with continuing investor confidence in Spanish real estate supported by an economy that isgrowing. With the return of bank financing, the weight of money in the market looking to invest in quality assets has continued tostrengthen the market. Due to lack of development in recent years, prime regional shopping centres are a scarce asset class whichis reflected in good demand.
PRINCIPAL RISKS AND UNCERTAINTIESintu's Board has responsibility for establishing the Group's appetite for risk on the balance of potential risks and returns, and hasoverall responsibility for identifying and managing risks. The Board has updated its assessment of the principal risks facing theGroup, including those that would impact the business model, future performance, solvency or liquidity.
Principal risks and uncertainties are identified under five key headings: property market; operations; financing; developments andacquisitions; and brand. These are discussed in detail below. A principal risk is one which has the potential to significantly affectthe Group's strategic objectives, financial position or future performance and includes both internal and external factors. Wemonitor movements in likelihood and severity such that the risks are appropriately mitigated in line with the Group's risk appetite.
The risk profile for the six months ended 30 June 2017 has remained broadly in line with the year ended 31 December 2016 withno significant new risks identified nor substantial changes in existing risks. Uncertainty in the UK economy and real estate marketsfollowing the EU referendum vote last year ('Brexit') has not resulted in any material adverse impacts, although recent UK generalelection results may create some further uncertainty. Following recent events we remain focused on our approach to terrorism andcybersecurity.
Key to strategic objectives: Change in level of risk:1) Optimising asset performance Remained the same 2) Delivering UK developments3) Making the brand count4) Seizing the growth opportunity in Spain
Risk and impact Mitigation 2017 commentaryProperty market Strategic objectives affected: 1,2,3,4Macro-economic - focus on prime and super prime assets together Likelihood of macro-economic weaknessWeakness in the macro- with their upgrading continues to be a risk with politicaleconomic environment - covenant headroom monitored and stress- uncertainty in the UK and Brexitcould undermine rental tested arrangements not yet detailedincome levels and - make representation on key policies, for - like-for-like property values remainingproperty values, reducing example business rates stable in the periodreturn on investment and - large-scale national marketing events across - substantial covenant headroomcovenant headroom centres to attract footfall - no significant near-term debt maturities - leveraging the strength of the intu brand to and average unexpired term attract and retain aspirational retailers unchanged at 7.1 years - continued geographic diversification by - long-term lease structures with average increasing Spanish presence unexpired term of 7.3 years - Purchase of Madrid Xanadú for EUR516.8mRetail environment - active management of tenant mix including Likelihood and severity of potential impactFailure to react to letting of former BHS units was monitored closely in the first half ofchanges in the retail - regular monitoring of tenant strength and 2017 with intu's strategy continuing toenvironment could diversity deliver solid footfall numbers andundermine intu's ability to - upgrading assets to meet demand, for example, occupancyattract customers and increased leisure offering - signifcant progress on planning andtenants - Tell intu customer feedback programme helps pre-letting of near-term pipeline with a identify changes in customer preferences focus on leisure - work closely with retailers - continuing digital investment to improve - digital strategy that embraces technology and relevance as shopping habits change digital customer engagement. This enables intu - occupancy unchanged at 95.9 per cent to engage in and support multichannel retailing, - footfall continues to be ahead of and to take the opportunities offered by benchmark ecommerce - committed to the GBP71m intu Lakeside leisure extension
Risk and impact Mitigation 2017 commentaryOperations Strategic objectives affected: 1,3Health and safety - strong business process and procedures, Likelihood of potential impact has notAccidents or system including compliance with OHSAS 18001, changed signifcantly during the first half offailure leading to financial supported by regular training and exercises 2017, however severity impacted by newand/or reputational loss - annual audits of operational standards and enforcement structure equipment carried out internally and by external - maintenance of OHSAS 18001 consultants certifcation, demonstrating consistent - culture of visitor, staff and contractor safety health and safety management process - crisis management and business continuity and procedures across the portfolio plans in place and tested - work continuing towards achieving

- retailer liaison and briefings additional accreditations with focus on - appropriate levels of insurance ISO 14001 - staff succession planning and development in - award of the golden status from the place to ensure continued delivery of world Royal Society for the Prevention of class service Accidents - health and safety managers or coordinators in all centresCybersecurity - data and cybersecurity strategies Likelihood has increased with increasedLoss of data and - regular testing programme and cyber scenario reliance on operational and third partyinformation or failure of exercise and benchmarking systems and data, and with the number ofkey systems resulting in - appropriate levels of insurance recent high profile hacks. Severity offinancial and/or - crisis management and business continuity potential impact has reduced by significantreputational loss plans in place and tested development of tools and controls. We - data committee and data protection officer in have experienced attempted cybersecurity place hacks which have not resulted in any data - monitoring of regulatory environment and best loss or major operational impacts. We practice continue to prioritise on the cybersecurity - cybersecurity assessment performed by programme of works external consultancy and full action plan in - ongoing Group-wide cybersecurity place (programme of works) project with investment in tools, - managing of supply chain and service providers consultancy and staff to mitigate impact who hold intu data of threats from evolving cybersecurity landscapeTerrorism - strong business process and procedures, Overall likelihood and severity of potentialTerrorist incident at an supported by regular training and exercises, impact unchanged. In May 2017 weintu centre or another designed to adapt and respond to changes in enacted our operational plan for the periodmajor shopping centre risk levels of increased threat level. The threat levelresulting in loss of - extraordinary pre-planned operational was subsequently reduced to the priorconsumer confidence responses to changes in national threat level threat levelwith consequent impact - annual audits of operational standards and - national threat level remains at Severeon lettings and rental physical protection measures carried out - major scenario exercises nowgrowth internally and by external agencies completed at all five intu managed - culture of visitor, staff and contractor safety super regional shopping centres with - crisis management and business continuity involvement of multiple external plans in place and tested with involvement of agencies multiple external agencies - operating procedures in place for the - retailer liaison and briefings introduction of further security - appropriate levels of insurance measures if required - strong relationships and frequent liaison with police, NaCTSO and other agencies - NaCTSO approved to train staff in counter- terrorism awareness programme - internal head of security appointedRisk and impact Mitigation 2017 commentaryFinancing Strategic objectives affected: 2,4Availability of funds - funding strategy regularly reported to the Board Macro-economic events during 2017, andReduced availability of with current and projected funding position the uncertainty caused by them, mean thefunds could limit liquidity, - effective treasury management aimed at increased risk of reduced availabilityleading to restriction of balancing long debt maturity profile and remains. However, severity of potentialinvesting and operating diversification of sources of finance impact unchanged from 2016. Regularactivities and/or increase - consideration of financing plans including refnancing activity continuing to evidencein funding cost potential for recycling of capital before the availability of funding commitment to transactions and developments - new EUR265m loan facility secured on - strong relationships with lenders, shareholders Madrid Xanadú and partners - introduction of joint venture partner into - focus on prime and super prime assets Madrid Xanadú to complete in the second half of 2017 - GBP140m refinancing of intu Milton Keynes - GBP488m refinancing of intu Merry Hill - GBP250m additional financing on intu Trafford CentreDevelopments and acquisitions Strategic objectives affected: 2,4Developments - Capital Projects Committee reviews detailed Likelihood and severity of potential impactDevelopments fail to appraisals before and monitors progress during have remained unchanged in 2017 as thecreate shareholder value significant projects Group has progressed work on its - fixed price construction contracts for development pipeline developments agreed with clear apportionment - at intu Watford works are on schedule of risk to hit all key milestones - significant levels of pre-lets exchanged prior to - intu Lakeside leisure development scheme development committed - detailed appraisal work and signifcant pre-lets ahead of starting major development projectsAcquisitions - research and third party due diligence Likelihood and severity of potential impactAcquisitions fail to create undertaken for transactions have remained unchangedshareholder value - local partner, advisors and experienced staff in - substantial due diligence process

Spain with specialist market knowledge undertaken before acquisition of - where appropriate, investment risk reduced Madrid Xanadú through financing and joint venture investmentsBrand Strategic objectives affected: 1,2,3,4Integrity of the brand - intellectual property protection Likelihood and severity of potential impactThe integrity of the brand - strong guidelines for use of brand unchanged in the first half of 2017is damaged leading to - strong underlying operational controls and crisis - continuing media interest in intu andfinancial and/or management procedures our commentaries and opinions on thereputational loss - ongoing training programme and reward and business and wider landscape recognition schemes designed to embed brand - ongoing development of brand in Spain values and culture throughout the organisation - net promoter score consistently high at - traditional and digital media monitoring and around 70 for the period analysis - Tell intu and shopper view customer feedback programmes
DIRECTORS' RESPONSIBILITY STATEMENTThe Directors are responsible for preparing the interim report and condensed consolidated set of interim financial statements('interim financial statements'), in accordance with applicable law and regulations. The Directors confirm that, to the best of their knowledge:- the interim financial statements have been prepared in accordance with IAS 34 Interim Financial Reporting, as adopted by the European Union; and- the interim report includes a fair review of the information required by Sections DTR 4.2.7R and DTR 4.2.8R of the Disclosure Guidance and Transparency Rules sourcebook of the United Kingdom's Financial Services Authority.
The operating and financial reviews refer to important events which have taken place in the period.
The principal risks and uncertainties facing the business are referred to in the operating and financial reviews.Related party transactions are set out in note 27 of the interim financial statements.
Details, including biographies, of all current Directors are maintained on the intu properties plc website: intugroup.co.uk.
On behalf of the Board
David FischelChief Executive
Matthew RobertsChief Financial Officer27 July 2017
Independent review report to intu properties plcReport on the condensed consolidated interim financial statements
Our conclusionWe have reviewed intu properties plc's condensed consolidated interim financial statements (the "interim financial statements") inthe interim report of intu properties plc for the 6 month period ended 30 June 2017. Based on our review, nothing has come to ourattention that causes us to believe that the interim financial statements are not prepared, in all material respects, in accordancewith International Accounting Standard 34, 'Interim Financial Reporting', as adopted by the European Union and the DisclosureGuidance and Transparency Rules sourcebook of the United Kingdom's Financial Conduct Authority.
What we have reviewedThe interim financial statements comprise:- the consolidated balance sheet as at 30 June 2017;- the consolidated income statement and consolidated statement of comprehensive income for the period then ended;- the consolidated statement of changes in equity for the period then ended;- the consolidated statement of cash flows for the period then ended; and- the explanatory notes to the interim financial statements.
The interim financial statements included in the interim report have been prepared in accordance with International AccountingStandard 34, 'Interim Financial Reporting', as adopted by the European Union and the Disclosure Guidance and TransparencyRules sourcebook of the United Kingdom's Financial Conduct Authority.
As disclosed in note 1 to the interim financial statements, the financial reporting framework that has been applied in the preparationof the full annual financial statements of the Group is applicable law and International Financial Reporting Standards (IFRSs) asadopted by the European Union.
Responsibilities for the interim financial statements and the review
Our responsibilities and those of the DirectorsThe interim report, including the interim financial statements, is the responsibility of, and has been approved by, the Directors. TheDirectors are responsible for preparing the interim report in accordance with the Disclosure Guidance and Transparency Rulessourcebook of the United Kingdom's Financial Conduct Authority.
Our responsibility is to express a conclusion on the interim financial statements in the interim report based on our review. Thisreport, including the conclusion, has been prepared for and only for the company for the purpose of complying with the DisclosureGuidance and Transparency Rules sourcebook of the United Kingdom's Financial Conduct Authority and for no other purpose. We
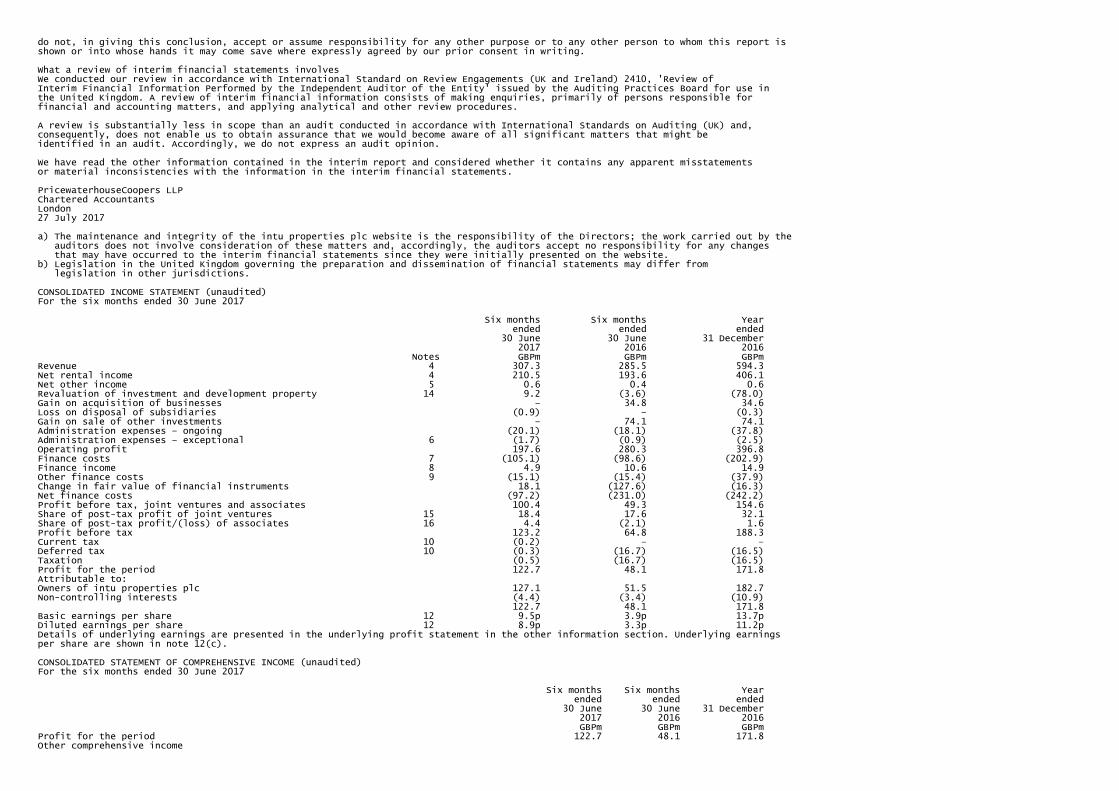
do not, in giving this conclusion, accept or assume responsibility for any other purpose or to any other person to whom this report isshown or into whose hands it may come save where expressly agreed by our prior consent in writing.
What a review of interim financial statements involvesWe conducted our review in accordance with International Standard on Review Engagements (UK and Ireland) 2410, 'Review ofInterim Financial Information Performed by the Independent Auditor of the Entity' issued by the Auditing Practices Board for use inthe United Kingdom. A review of interim financial information consists of making enquiries, primarily of persons responsible forfinancial and accounting matters, and applying analytical and other review procedures.
A review is substantially less in scope than an audit conducted in accordance with International Standards on Auditing (UK) and,consequently, does not enable us to obtain assurance that we would become aware of all significant matters that might beidentified in an audit. Accordingly, we do not express an audit opinion.
We have read the other information contained in the interim report and considered whether it contains any apparent misstatementsor material inconsistencies with the information in the interim financial statements.
PricewaterhouseCoopers LLPChartered AccountantsLondon27 July 2017
a) The maintenance and integrity of the intu properties plc website is the responsibility of the Directors; the work carried out by the auditors does not involve consideration of these matters and, accordingly, the auditors accept no responsibility for any changes that may have occurred to the interim financial statements since they were initially presented on the website.b) Legislation in the United Kingdom governing the preparation and dissemination of financial statements may differ from legislation in other jurisdictions.
CONSOLIDATED INCOME STATEMENT (unaudited)For the six months ended 30 June 2017
Six months Six months Year ended ended ended 30 June 30 June 31 December 2017 2016 2016 Notes GBPm GBPm GBPmRevenue 4 307.3 285.5 594.3Net rental income 4 210.5 193.6 406.1Net other income 5 0.6 0.4 0.6Revaluation of investment and development property 14 9.2 (3.6) (78.0)Gain on acquisition of businesses – 34.8 34.6Loss on disposal of subsidiaries (0.9) – (0.3)Gain on sale of other investments – 74.1 74.1Administration expenses – ongoing (20.1) (18.1) (37.8)Administration expenses – exceptional 6 (1.7) (0.9) (2.5)Operating profit 197.6 280.3 396.8Finance costs 7 (105.1) (98.6) (202.9)Finance income 8 4.9 10.6 14.9Other finance costs 9 (15.1) (15.4) (37.9)Change in fair value of financial instruments 18.1 (127.6) (16.3)Net finance costs (97.2) (231.0) (242.2)Profit before tax, joint ventures and associates 100.4 49.3 154.6Share of post-tax profit of joint ventures 15 18.4 17.6 32.1Share of post-tax profit/(loss) of associates 16 4.4 (2.1) 1.6Profit before tax 123.2 64.8 188.3Current tax 10 (0.2) – –Deferred tax 10 (0.3) (16.7) (16.5)Taxation (0.5) (16.7) (16.5)Profit for the period 122.7 48.1 171.8Attributable to:Owners of intu properties plc 127.1 51.5 182.7Non-controlling interests (4.4) (3.4) (10.9) 122.7 48.1 171.8Basic earnings per share 12 9.5p 3.9p 13.7pDiluted earnings per share 12 8.9p 3.3p 11.2pDetails of underlying earnings are presented in the underlying profit statement in the other information section. Underlying earningsper share are shown in note 12(c).
CONSOLIDATED STATEMENT OF COMPREHENSIVE INCOME (unaudited)For the six months ended 30 June 2017
Six months Six months Year ended ended ended 30 June 30 June 31 December 2017 2016 2016 GBPm GBPm GBPmProfit for the period 122.7 48.1 171.8Other comprehensive income
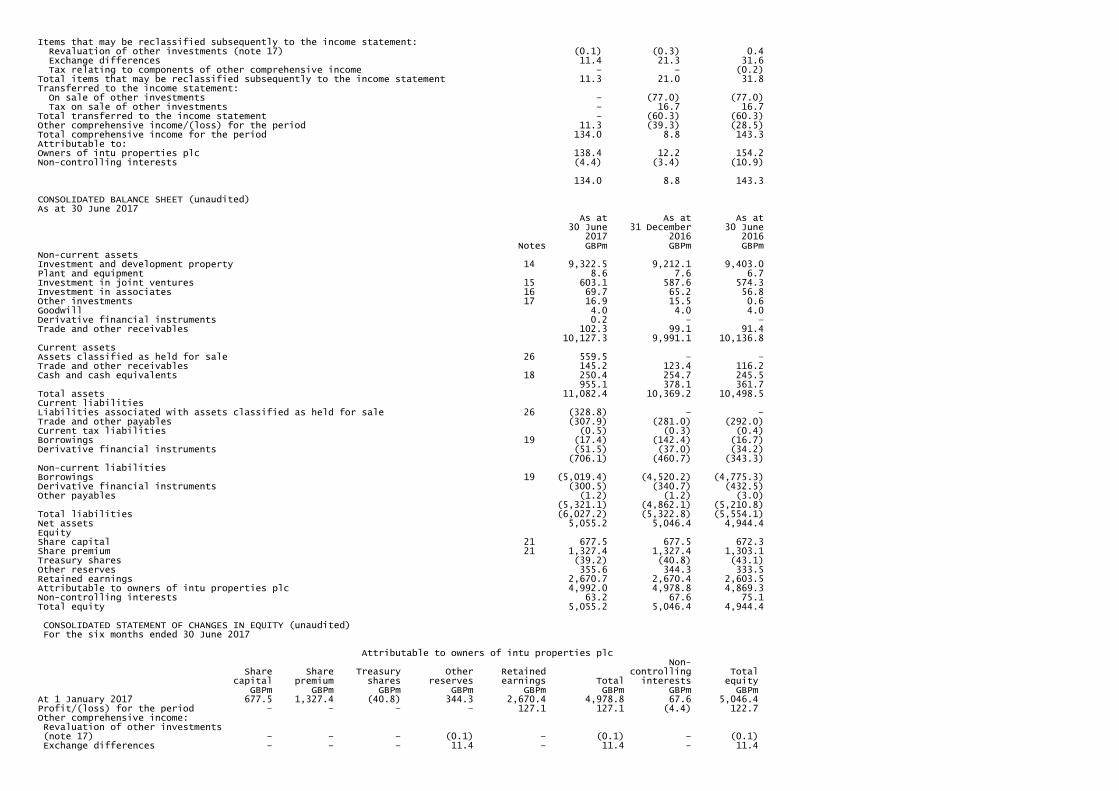
Items that may be reclassified subsequently to the income statement: Revaluation of other investments (note 17) (0.1) (0.3) 0.4 Exchange differences 11.4 21.3 31.6 Tax relating to components of other comprehensive income – – (0.2)Total items that may be reclassified subsequently to the income statement 11.3 21.0 31.8Transferred to the income statement: On sale of other investments – (77.0) (77.0) Tax on sale of other investments – 16.7 16.7Total transferred to the income statement – (60.3) (60.3)Other comprehensive income/(loss) for the period 11.3 (39.3) (28.5)Total comprehensive income for the period 134.0 8.8 143.3Attributable to: Owners of intu properties plc 138.4 12.2 154.2Non-controlling interests (4.4) (3.4) (10.9) 134.0 8.8 143.3
CONSOLIDATED BALANCE SHEET (unaudited)As at 30 June 2017 As at As at As at 30 June 31 December 30 June 2017 2016 2016 Notes GBPm GBPm GBPmNon-current assets Investment and development property 14 9,322.5 9,212.1 9,403.0Plant and equipment 8.6 7.6 6.7Investment in joint ventures 15 603.1 587.6 574.3Investment in associates 16 69.7 65.2 56.8Other investments 17 16.9 15.5 0.6Goodwill 4.0 4.0 4.0Derivative financial instruments 0.2 – –Trade and other receivables 102.3 99.1 91.4 10,127.3 9,991.1 10,136.8Current assets Assets classified as held for sale 26 559.5 – –Trade and other receivables 145.2 123.4 116.2Cash and cash equivalents 18 250.4 254.7 245.5 955.1 378.1 361.7Total assets 11,082.4 10,369.2 10,498.5Current liabilities Liabilities associated with assets classified as held for sale 26 (328.8) – –Trade and other payables (307.9) (281.0) (292.0)Current tax liabilities (0.5) (0.3) (0.4)Borrowings 19 (17.4) (142.4) (16.7)Derivative financial instruments (51.5) (37.0) (34.2) (706.1) (460.7) (343.3)Non-current liabilities Borrowings 19 (5,019.4) (4,520.2) (4,775.3)Derivative financial instruments (300.5) (340.7) (432.5)Other payables (1.2) (1.2) (3.0) (5,321.1) (4,862.1) (5,210.8)Total liabilities (6,027.2) (5,322.8) (5,554.1)Net assets 5,055.2 5,046.4 4,944.4Equity Share capital 21 677.5 677.5 672.3Share premium 21 1,327.4 1,327.4 1,303.1Treasury shares (39.2) (40.8) (43.1)Other reserves 355.6 344.3 333.5Retained earnings 2,670.7 2,670.4 2,603.5Attributable to owners of intu properties plc 4,992.0 4,978.8 4,869.3Non-controlling interests 63.2 67.6 75.1Total equity 5,055.2 5,046.4 4,944.4
CONSOLIDATED STATEMENT OF CHANGES IN EQUITY (unaudited) For the six months ended 30 June 2017
Attributable to owners of intu properties plc Non- Share Share Treasury Other Retained controlling Total capital premium shares reserves earnings Total interests equity GBPm GBPm GBPm GBPm GBPm GBPm GBPm GBPmAt 1 January 2017 677.5 1,327.4 (40.8) 344.3 2,670.4 4,978.8 67.6 5,046.4Profit/(loss) for the period – – – – 127.1 127.1 (4.4) 122.7Other comprehensive income: Revaluation of other investments (note 17) – – – (0.1) – (0.1) – (0.1) Exchange differences – – – 11.4 – 11.4 – 11.4

Total comprehensive income for the period – – – 11.3 127.1 138.4 (4.4) 134.0Dividends (note 11) – – – – (126.2) (126.2) – (126.2)Share-based payments – – – – 2.2 2.2 – 2.2Acquisition of treasury shares – – (1.2) – – (1.2) – (1.2)Disposal of treasury shares – – 2.8 – (2.8) – – – – – 1.6 – (126.8) (125.2) – (125.2)At 30 June 2017 677.5 1,327.4 (39.2) 355.6 2,670.7 4,992.0 63.2 5,055.2
Attributable to owners of intu properties plc Non- Share Share Treasury Other Retained controlling Total capital premium shares reserves earnings Total interests equity GBPm GBPm GBPm GBPm GBPm GBPm GBPm GBPmAt 1 January 2016 672.3 1,303.1 (43.3) 372.8 2,671.5 4,976.4 78.5 5,054.9Profit/(loss) for the year – – – – 182.7 182.7 (10.9) 171.8Other comprehensive income: Revaluation of other investments – – – 0.4 – 0.4 – 0.4 Exchange differences – – – 31.6 – 31.6 – 31.6 Tax relating to components of other comprehensive income (note 10) – – – 16.5 – 16.5 – 16.5 Transferred to income statement on sale of other investments – – – (77.0) – (77.0) – (77.0)Total comprehensive income for the year – – – (28.5) 182.7 154.2 (10.9) 143.3Ordinary shares issued 5.2 24.3 – – – 29.5 – 29.5Dividends (note 11) – – – – (182.5) (182.5) – (182.5)Share-based payments – – – – 1.9 1.9 – 1.9Acquisition of treasury shares – – (0.7) – – (0.7) – (0.7)Disposal of treasury shares – – 3.2 – (3.2) – – – 5.2 24.3 2.5 – (183.8) (151.8) – (151.8)At 31 December 2016 677.5 1,327.4 (40.8) 344.3 2,670.4 4,978.8 67.6 5,046.4
Attributable to owners of intu properties plc Non- Share Share Treasury Other Retained controlling Total capital premium shares reserves earnings Total interests equity GBPm GBPm GBPm GBPm GBPm GBPm GBPm GBPmAt 1 January 2016 672.3 1,303.1 (43.3) 372.8 2,671.5 4,976.4 78.5 5,054.9Profit/(loss) for the period – – – – 51.5 51.5 (3.4) 48.1Other comprehensive income: Revaluation of other investments – – – (0.3) – (0.3) – (0.3) Exchange differences – – – 21.3 – 21.3 – 21.3 Tax relating to components of other comprehensive income (note 10) – – – 16.7 – 16.7 – 16.7 Transferred to income statement on sale of other investments – – – (77.0) – (77.0) – (77.0)Total comprehensive income for the period – – – (39.3) 51.5 12.2 (3.4) 8.8Ordinary shares issued – – – – – – – –Dividends (note 11) – – – – (121.1) (121.1) – (121.1)Share-based payments – – – – 2.4 2.4 – 2.4Acquisition of treasury shares – – (0.6) – – (0.6) – (0.6)Disposal of treasury shares – – 0.8 – (0.8) – – – – – 0.2 – (119.5) (119.3) – (119.3)At 30 June 2016 672.3 1,303.1 (43.1) 333.5 2,603.5 4,869.3 75.1 4,944.4
Six months Six months Year ended ended ended 30 June 30 June 31 December 2017 2016 2016 Notes GBPm GBPm GBPmCash generated from operations 23 180.3 163.0 355.9Interest paid (113.0) (97.6) (233.0)Interest received 1.1 7.4 8.5Taxation (0.5) 0.2 –Cash flows from operating activities 67.9 73.0 131.4Cash flows from investing activities Purchase and development of property, plant and equipment (91.3) (57.0) (120.9)Sale of property 3.4 – –Acquisition of businesses net of cash acquired 25 (446.3) (398.8) (405.5)

Cash transferred to assets classified as held for sale (12.7) – –Sale of other investments – 201.9 201.9Additions of other investments (1.5) – (14.1)Disposal of subsidiaries net of cash sold with business – – 80.5Loan advances to joint ventures 15 (2.3) (0.7) (1.2)Loan repayments by joint ventures 15 10.1 7.5 12.7Distributions from joint ventures 15 0.9 2.3 3.2Cash flows from investing activities (539.7) (244.8) (243.4)Cash flows from financing activities Issue of ordinary shares – 0.1 0.3Acquisition of treasury shares (1.2) (0.6) (0.7)Cash transferred (to)/from restricted accounts (0.5) 0.2 (0.8)Borrowings drawn 596.6 588.2 962.9Borrowings repaid (10.2) (333.8) (720.4)Equity dividends paid (117.8) (113.5) (152.6)Cash flows from financing activities 466.9 140.6 88.7Effects of exchange rate changes on cash and cash equivalents 0.1 1.1 1.4Net decrease in cash and cash equivalents (4.8) (30.1) (21.9)Cash and cash equivalents at beginning of period 18 251.7 273.6 273.6Cash and cash equivalents at end of period 18 246.9 243.5 251.7
NOTES (unaudited)
1 Basis of preparationThe condensed consolidated set of interim financial statements ('interim financial statements') for the six months ended30 June 2017 are unaudited and do not constitute statutory financial statements within the meaning of s434 of the Companies Act2006. The interim financial statements have been prepared in accordance with the Disclosure Guidance and Transparency Rulessourcebook of the Financial Conduct Authority and with IAS 34 as adopted by the European Union.
The comparative information presented for the year ended 31 December 2016 is not the Group's financial statements for that year.Those financial statements have been reported on by the Group's auditors and delivered to the registrar of companies. Theauditors' opinion on those financial statements was unqualified and did not contain an emphasis of matter paragraph or astatement made under Section 498 (2) or (3) of the Companies Act 2006.
The interim financial statements should be read in conjunction with the Group's financial statements for the year ended31 December 2016 which have been prepared in accordance with International Financial Reporting Standards ('IFRS') as adoptedby the European Union.
Use of estimates and assumptionsThe preparation of interim financial statements in conformity with generally accepted accounting principles requires the use ofestimates and assumptions that affect the reported amounts of assets and liabilities at the date of the interim financial statementsand the reported amounts of income and expenses during the reporting period. Although these estimates are based onmanagement's best knowledge of the amount, event or actions, actual results ultimately may differ from those estimates.In preparing the interim financial statements, the areas of significant judgement made by management in applying the Groupaccounting policies and the key sources of estimation uncertainty were the same as those applied to the consolidated financialstatements as at and for the year ended 31 December 2016. In particular, significant judgement is required in the use of estimatesand assumptions in the valuation and accounting for investment and development property and derivative financial instruments.
Going concernThe Group prepares regular forecasts and projections which include sensitivity analysis taking into account a number of downsiderisks to the forecast including reasonably possible changes in trading performance and asset values and assesses the potentialimpact of these on the Group's liquidity position and available resources.
In preparing the most recent projections, factors taken into account include GBP288.9 million of cash (including the Group's share ofcash in joint ventures of GBP38.5 million) and GBP278.0 million of undrawn facilities at 30 June 2017. The Group's weighted averagedebt maturity of 7.1 years and the relatively long-term and stable nature of the cash flows receivable under tenant leases were alsofactored into the forecasts.
After reviewing the most recent projections and the sensitivity analysis, the Directors consider it appropriate to continue to adoptthe going concern basis of accounting in preparing the Group's interim financial statements.
2 Accounting policiesThe accounting policies applied are consistent with those of the Group's statutory financial statements for the year ended31 December 2016 as set out on pages 114 to 117 of the Annual report, as amended when relevant to reflect the adoption of newstandards, amendments and interpretations which became effective in the period. These amendments have not had an impact onthe financial statements.
Taxes on income in interim periods are accrued using tax rates expected to be applicable to total annual earnings.
3 Seasonality and cyclicalityThere is no material seasonality or cyclicality impacting interim financial reporting.
4 Segmental reportingOperating segments are determined based on the strategic and operational management of the Group. The Group is primarily ashopping centre-focused business and has two reportable operating segments being the United Kingdom and Spain. Althoughmanagement review and monitor the performance of the business principally on a centre-by-centre basis, the operating segmentsare consistent with the strategic and operational management of the Group.
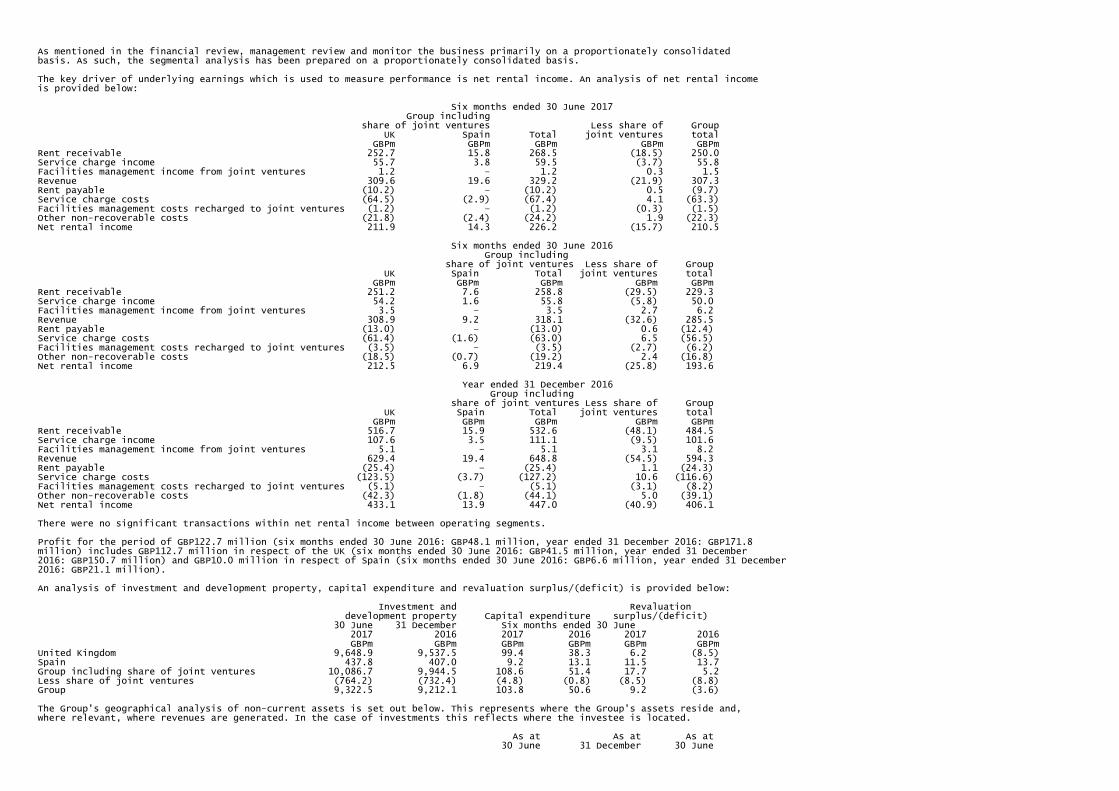
As mentioned in the financial review, management review and monitor the business primarily on a proportionately consolidatedbasis. As such, the segmental analysis has been prepared on a proportionately consolidated basis.
The key driver of underlying earnings which is used to measure performance is net rental income. An analysis of net rental incomeis provided below:
Six months ended 30 June 2017 Group including share of joint ventures Less share of Group UK Spain Total joint ventures total GBPm GBPm GBPm GBPm GBPmRent receivable 252.7 15.8 268.5 (18.5) 250.0Service charge income 55.7 3.8 59.5 (3.7) 55.8Facilities management income from joint ventures 1.2 – 1.2 0.3 1.5Revenue 309.6 19.6 329.2 (21.9) 307.3Rent payable (10.2) – (10.2) 0.5 (9.7)Service charge costs (64.5) (2.9) (67.4) 4.1 (63.3)Facilities management costs recharged to joint ventures (1.2) – (1.2) (0.3) (1.5)Other non-recoverable costs (21.8) (2.4) (24.2) 1.9 (22.3)Net rental income 211.9 14.3 226.2 (15.7) 210.5
Six months ended 30 June 2016 Group including share of joint ventures Less share of Group UK Spain Total joint ventures total GBPm GBPm GBPm GBPm GBPmRent receivable 251.2 7.6 258.8 (29.5) 229.3Service charge income 54.2 1.6 55.8 (5.8) 50.0Facilities management income from joint ventures 3.5 – 3.5 2.7 6.2Revenue 308.9 9.2 318.1 (32.6) 285.5Rent payable (13.0) – (13.0) 0.6 (12.4)Service charge costs (61.4) (1.6) (63.0) 6.5 (56.5)Facilities management costs recharged to joint ventures (3.5) – (3.5) (2.7) (6.2)Other non-recoverable costs (18.5) (0.7) (19.2) 2.4 (16.8)Net rental income 212.5 6.9 219.4 (25.8) 193.6
Year ended 31 December 2016 Group including share of joint ventures Less share of Group UK Spain Total joint ventures total GBPm GBPm GBPm GBPm GBPmRent receivable 516.7 15.9 532.6 (48.1) 484.5Service charge income 107.6 3.5 111.1 (9.5) 101.6Facilities management income from joint ventures 5.1 – 5.1 3.1 8.2Revenue 629.4 19.4 648.8 (54.5) 594.3Rent payable (25.4) – (25.4) 1.1 (24.3)Service charge costs (123.5) (3.7) (127.2) 10.6 (116.6)Facilities management costs recharged to joint ventures (5.1) – (5.1) (3.1) (8.2)Other non-recoverable costs (42.3) (1.8) (44.1) 5.0 (39.1)Net rental income 433.1 13.9 447.0 (40.9) 406.1
There were no significant transactions within net rental income between operating segments.
Profit for the period of GBP122.7 million (six months ended 30 June 2016: GBP48.1 million, year ended 31 December 2016: GBP171.8million) includes GBP112.7 million in respect of the UK (six months ended 30 June 2016: GBP41.5 million, year ended 31 December2016: GBP150.7 million) and GBP10.0 million in respect of Spain (six months ended 30 June 2016: GBP6.6 million, year ended 31 December2016: GBP21.1 million).
An analysis of investment and development property, capital expenditure and revaluation surplus/(deficit) is provided below:
Investment and Revaluation development property Capital expenditure surplus/(deficit) 30 June 31 December Six months ended 30 June 2017 2016 2017 2016 2017 2016 GBPm GBPm GBPm GBPm GBPm GBPmUnited Kingdom 9,648.9 9,537.5 99.4 38.3 6.2 (8.5)Spain 437.8 407.0 9.2 13.1 11.5 13.7Group including share of joint ventures 10,086.7 9,944.5 108.6 51.4 17.7 5.2Less share of joint ventures (764.2) (732.4) (4.8) (0.8) (8.5) (8.8)Group 9,322.5 9,212.1 103.8 50.6 9.2 (3.6)
The Group's geographical analysis of non-current assets is set out below. This represents where the Group's assets reside and,where relevant, where revenues are generated. In the case of investments this reflects where the investee is located.
As at As at As at 30 June 31 December 30 June
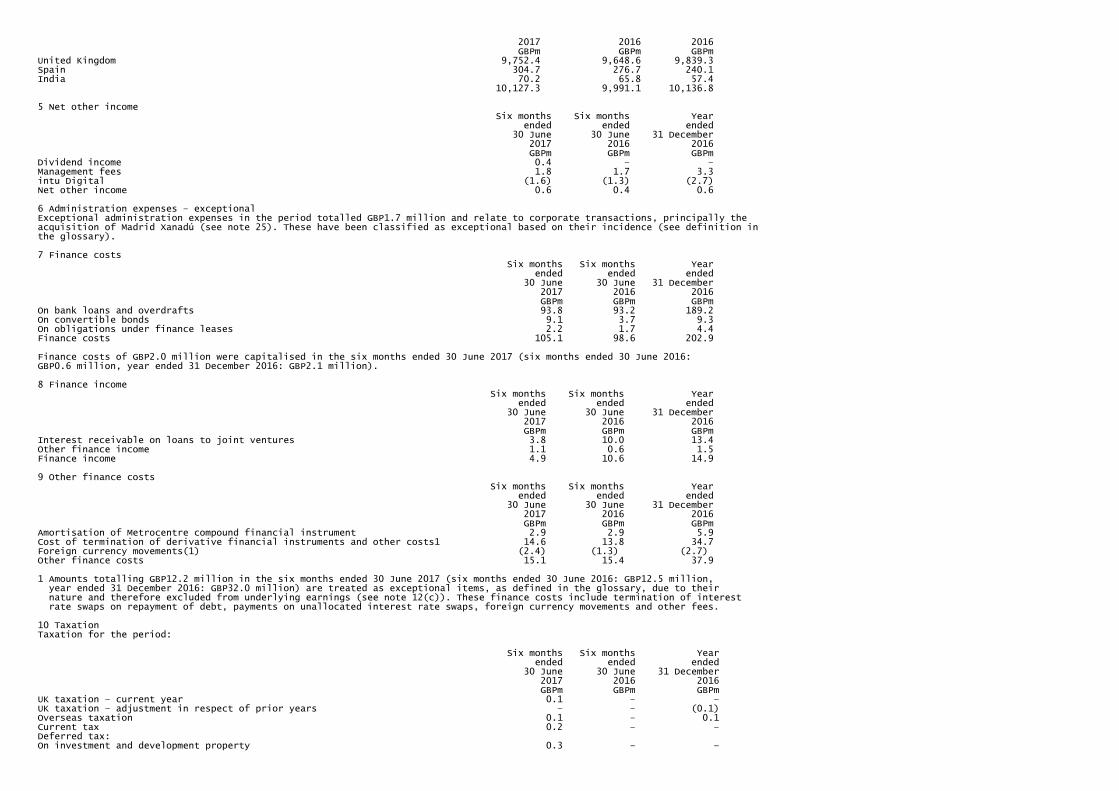
2017 2016 2016 GBPm GBPm GBPmUnited Kingdom 9,752.4 9,648.6 9,839.3Spain 304.7 276.7 240.1India 70.2 65.8 57.4 10,127.3 9,991.1 10,136.8
5 Net other income Six months Six months Year ended ended ended 30 June 30 June 31 December 2017 2016 2016 GBPm GBPm GBPmDividend income 0.4 – –Management fees 1.8 1.7 3.3intu Digital (1.6) (1.3) (2.7)Net other income 0.6 0.4 0.6
6 Administration expenses – exceptionalExceptional administration expenses in the period totalled GBP1.7 million and relate to corporate transactions, principally theacquisition of Madrid Xanadú (see note 25). These have been classified as exceptional based on their incidence (see definition inthe glossary).
7 Finance costs Six months Six months Year ended ended ended 30 June 30 June 31 December 2017 2016 2016 GBPm GBPm GBPmOn bank loans and overdrafts 93.8 93.2 189.2On convertible bonds 9.1 3.7 9.3On obligations under finance leases 2.2 1.7 4.4Finance costs 105.1 98.6 202.9
Finance costs of GBP2.0 million were capitalised in the six months ended 30 June 2017 (six months ended 30 June 2016: GBP0.6 million, year ended 31 December 2016: GBP2.1 million).
8 Finance income Six months Six months Year ended ended ended 30 June 30 June 31 December 2017 2016 2016 GBPm GBPm GBPmInterest receivable on loans to joint ventures 3.8 10.0 13.4Other finance income 1.1 0.6 1.5Finance income 4.9 10.6 14.9
9 Other finance costs Six months Six months Year ended ended ended 30 June 30 June 31 December 2017 2016 2016 GBPm GBPm GBPmAmortisation of Metrocentre compound financial instrument 2.9 2.9 5.9Cost of termination of derivative financial instruments and other costs1 14.6 13.8 34.7Foreign currency movements(1) (2.4) (1.3) (2.7)Other finance costs 15.1 15.4 37.9
1 Amounts totalling GBP12.2 million in the six months ended 30 June 2017 (six months ended 30 June 2016: GBP12.5 million, year ended 31 December 2016: GBP32.0 million) are treated as exceptional items, as defined in the glossary, due to their nature and therefore excluded from underlying earnings (see note 12(c)). These finance costs include termination of interest rate swaps on repayment of debt, payments on unallocated interest rate swaps, foreign currency movements and other fees.
10 TaxationTaxation for the period:
Six months Six months Year ended ended ended 30 June 30 June 31 December 2017 2016 2016 GBPm GBPm GBPmUK taxation – current year 0.1 – –UK taxation – adjustment in respect of prior years – – (0.1)Overseas taxation 0.1 – 0.1Current tax 0.2 – –Deferred tax: On investment and development property 0.3 – –
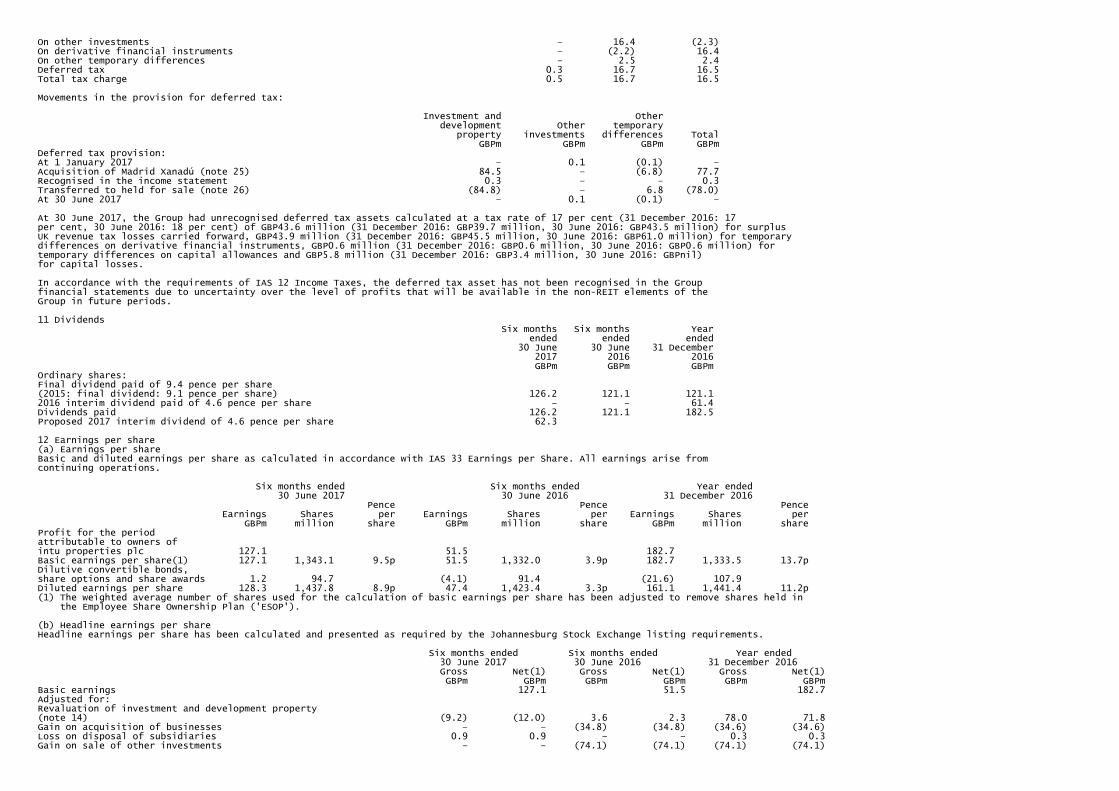
On other investments – 16.4 (2.3)On derivative financial instruments – (2.2) 16.4On other temporary differences – 2.5 2.4Deferred tax 0.3 16.7 16.5Total tax charge 0.5 16.7 16.5
Movements in the provision for deferred tax:
Investment and Other development Other temporary property investments differences Total GBPm GBPm GBPm GBPmDeferred tax provision: At 1 January 2017 – 0.1 (0.1) –Acquisition of Madrid Xanadú (note 25) 84.5 – (6.8) 77.7Recognised in the income statement 0.3 – – 0.3Transferred to held for sale (note 26) (84.8) – 6.8 (78.0)At 30 June 2017 – 0.1 (0.1) –
At 30 June 2017, the Group had unrecognised deferred tax assets calculated at a tax rate of 17 per cent (31 December 2016: 17per cent, 30 June 2016: 18 per cent) of GBP43.6 million (31 December 2016: GBP39.7 million, 30 June 2016: GBP43.5 million) for surplusUK revenue tax losses carried forward, GBP43.9 million (31 December 2016: GBP45.5 million, 30 June 2016: GBP61.0 million) for temporarydifferences on derivative financial instruments, GBP0.6 million (31 December 2016: GBP0.6 million, 30 June 2016: GBP0.6 million) fortemporary differences on capital allowances and GBP5.8 million (31 December 2016: GBP3.4 million, 30 June 2016: GBPnil) for capital losses.
In accordance with the requirements of IAS 12 Income Taxes, the deferred tax asset has not been recognised in the Groupfinancial statements due to uncertainty over the level of profits that will be available in the non-REIT elements of the Group in future periods.
11 Dividends Six months Six months Year ended ended ended 30 June 30 June 31 December 2017 2016 2016 GBPm GBPm GBPmOrdinary shares: Final dividend paid of 9.4 pence per share (2015: final dividend: 9.1 pence per share) 126.2 121.1 121.12016 interim dividend paid of 4.6 pence per share – – 61.4Dividends paid 126.2 121.1 182.5Proposed 2017 interim dividend of 4.6 pence per share 62.3
12 Earnings per share(a) Earnings per shareBasic and diluted earnings per share as calculated in accordance with IAS 33 Earnings per Share. All earnings arise fromcontinuing operations.
Six months ended Six months ended Year ended 30 June 2017 30 June 2016 31 December 2016 Pence Pence Pence Earnings Shares per Earnings Shares per Earnings Shares per GBPm million share GBPm million share GBPm million shareProfit for the periodattributable to owners ofintu properties plc 127.1 51.5 182.7Basic earnings per share(1) 127.1 1,343.1 9.5p 51.5 1,332.0 3.9p 182.7 1,333.5 13.7pDilutive convertible bonds,share options and share awards 1.2 94.7 (4.1) 91.4 (21.6) 107.9Diluted earnings per share 128.3 1,437.8 8.9p 47.4 1,423.4 3.3p 161.1 1,441.4 11.2p(1) The weighted average number of shares used for the calculation of basic earnings per share has been adjusted to remove shares held in the Employee Share Ownership Plan ('ESOP').
(b) Headline earnings per shareHeadline earnings per share has been calculated and presented as required by the Johannesburg Stock Exchange listing requirements.
Six months ended Six months ended Year ended 30 June 2017 30 June 2016 31 December 2016 Gross Net(1) Gross Net(1) Gross Net(1) GBPm GBPm GBPm GBPm GBPm GBPmBasic earnings 127.1 51.5 182.7Adjusted for: Revaluation of investment and development property (note 14) (9.2) (12.0) 3.6 2.3 78.0 71.8Gain on acquisition of businesses – – (34.8) (34.8) (34.6) (34.6)Loss on disposal of subsidiaries 0.9 0.9 – – 0.3 0.3Gain on sale of other investments – – (74.1) (74.1) (74.1) (74.1)

Share of joint ventures' items (8.2) (8.2) (8.8) (8.8) (14.2) (14.2)Share of associates' items (4.0) (4.0) 2.4 2.4 (1.1) (1.1)Headline earnings/(loss) 103.8 (61.5) 130.8Dilution(2) 1.2 (4.1) (21.6)Diluted headline earnings/(loss) 105.0 (65.6) 109.2Weighted average number of shares 1,343.1 1,332.0 1,333.5Dilution2 94.7 91.4 107.9Diluted weighted average number of shares 1,437.8 1,423.4 1,441.4Headline earnings/(loss) per share (pence) 7.7p (4.6)p 9.8pDiluted headline earnings/(loss) per share (pence) 7.3p (4.6)p 7.6p
1 Net of tax and non-controlling interests.2 The dilution impact is required to be included as calculated in note 12(a) even where this is not dilutive for headline earnings per share.
(c) Underlying earnings per shareUnderlying earnings per share is a non-GAAP measure but has been included as it is considered to be a key measure of theGroup's recurring performance and an indication of the extent to which dividend payments are supported by underlying operations(see underlying profit statement in the other information section). Underlying earnings is defined as an alternative performancemeasure in the financial review.
Six months ended Six months ended Year ended 30 June 2017 30 June 2016 31 December 2016 Pence Pence Pence Earnings Shares per Earnings Shares per Earnings Shares per GBPm million share GBPm million share GBPm million shareBasic earnings per share (note 12a) 127.1 1,343.1 9.5p 51.5 1,332.0 3.9p 182.7 1,333.5 13.7pAdjusted for:Revaluation of investment anddevelopment property (note 14) (9.2) (0.7)p 3.6 0.3p 78.0 5.9pGain on acquisition of businesses – – (34.8) (2.6)p (34.6) (2.6)pLoss on disposal of subsidiaries 0.9 0.1p – – 0.3 –Gain on sale of other investments – – (74.1) (5.6)p (74.1) (5.6)pAdministration expenses – exceptional (note 6) 1.7 0.1p 0.9 0.1p 2.5 0.2pExceptional finance costs (note 9) 12.2 0.9p 12.5 0.9p 32.0 2.4pChange in fair value of financial instruments (18.1) (1.4)p 127.6 9.5p 16.3 1.2pTax on the above 0.3 – 16.7 1.3p 16.5 1.3pShare of joint ventures' items (9.9) (0.7)p (5.5) (0.4)p (12.3) (0.9)pShare of associates' items (4.0) (0.3)p 2.4 0.2p (1.1) (0.1)pNon-controlling interests in respect of the above (2.5) (0.2)p (1.3) (0.1)p (6.2) (0.5)pUnderlying earnings per share 98.5 1,343.1 7.3p 99.5 1,332.0 7.5p 200.0 1,333.5 15.0pDilutive convertible bonds, share options and share awards 1.2 94.7 3.7 91.4 9.3 107.9Underlying, diluted earnings per share 99.7 1,437.8 6.9p 103.2 1,423.4 7.3p 209.3 1,441.4 14.5p
A reconciliation from underlying earnings per share to EPRA earnings per share is provided below: Six months ended Six months ended Year ended 30 June 2017 30 June 2016 31 December 2016 Pence Pence Pence Earnings Shares per Earnings Shares per Earnings Shares per GBPm million share GBPm million share GBPm million shareUnderlying earnings per share 98.5 1,343.1 7.3p 99.5 1,332.0 7.5p 200.0 1,333.5 15.0pAdjusted for: Other exceptional items (2.0) (0.1)p – – (6.5) (0.5)pOther exceptional tax – – (0.3) – (0.2) –Share of joint ventures' items – – (0.4) – (0.4) –EPRA earnings per share 96.5 1,343.1 7.2p 98.8 1,332.0 7.5p 192.9 1,333.5 14.5p
13 Net assets per share(a) NAV per share (diluted, adjusted)NAV per share (diluted, adjusted) is a non-GAAP measure but has been included as it is considered to be a key measure of theGroup's performance. The key difference from EPRA NAV, an industry standard comparable measure, is the exclusion of interestrate swaps not currently used for economic hedges of debt as, in our view, this better allows management to review and monitorthe Group's performance. NAV (diluted, adjusted) is defined as an alternative performance measure in the financial review.
As at 30 June 2017 As at 31 December 2016 As at 30 June 2016 Net NAV per Net NAV per Net NAV per assets Shares share assets Shares share assets Shares share GBPm million (pence) GBPm million (pence) GBPm million (pence)NAV per share attributable toowners of intu properties plc(1) 4,992.0 1,343.4 372p 4,978.8 1,343.0 371p 4,869.3 1,332.1 366pDilutive convertible bonds,share options and awards 2.6 3.1 2.6 3.5 10.9 6.9Diluted NAV per share 4,994.6 1,346.5 371p 4,981.4 1,346.5 370p 4,880.2 1,339.0 364p

Adjusted for:Fair value of derivativefinancial instruments 351.8 26p 377.7 28p 466.7 35pDeferred tax on investmentand development propertyand other investments 0.1 – 0.1 – – –Share of joint ventures'items 7.8 1p 7.2 1p 10.3 1pNon-controlling interestrecoverable balance notrecognised 71.3 5p 71.3 5p 71.3 5pNAV per share (diluted, adjusted) 5,425.6 1,346.5 403p 5,437.7 1,346.5 404p 5,428.5 1,339.0 405p
1 The number of shares used has been adjusted to remove shares held in the ESOP.
A reconciliation from NAV per share (diluted, adjusted) to EPRA NAV per share is provided below: As at 30 June 2017 As at 31 December 2016 As at 30 June 2016 Net NAV per Net NAV per Net NAV per assets Shares share assets Shares share assets Shares share GBPm million (pence) GBPm million (pence) GBPm million (pence)NAV per share (diluted, adjusted) 5,425.6 1,346.5 403p 5,437.7 1,346.5 404p 5,428.5 1,339.0 405pAdjusted for:Swaps not currently used for economic hedges of debt (239.6) (18)p (236.8) (18)p (316.9) (23)pEPRA NAV per share 5,186.0 1,346.5 385p 5,200.9 1,346.5 386p 5,111.6 1,339.0 382p
(b) NNNAV per share (diluted, adjusted)NNNAV per share (diluted, adjusted) is a non-GAAP measure but has been included as it is considered to be an industry standardcomparable measure and is equal to EPRA NNNAV.
As at 30 June 2017 As at 31 December 2016 As at 30 June 2016 Net NAV per Net NAV per Net NAV per assets Shares share assets Shares share assets Shares share GBPm million (pence) GBPm million (pence) GBPm million (pence)NAV per share (diluted,adjusted) 5,425.6 1,346.5 403p 5,437.7 1,346.5 404p 5,428.5 1,339.0 405pFair value of derivativefinancial instruments (351.8) (26)p (377.7) (28)p (466.7) (35)pExcess of fair value of debt over book value (389.9) (29)p (375.0) (28)p (380.4) (28)pDeferred tax on investmentand development propertyand other investments (0.1) – (0.1) – – –Share of joint ventures'items (10.0) (1)p (9.4) (1)p (12.3) (1)pNon-controlling interestsin respect of the above 23.6 2p 23.4 2p 24.1 2pNNNAV per share (diluted,adjusted) 4,697.4 1,346.5 349p 4,698.9 1,346.5 349p 4,593.2 1,339.0 343p
14 Investment and development property GBPmAt 1 January 2017 9,212.1Acquisition of Madrid Xanadú (note 25) 461.4Additions 103.8Disposals (3.4)Surplus on revaluation 9.2Transfer to assets held for sale (note 26) (462.8)Foreign exchange movements 2.2At 30 June 2017 9,322.5
A reconciliation to market value is provided below:
As at As at As at 30 June 31 December 30 June 2017 2016 2016 GBPm GBPm GBPmBalance sheet carrying value of investment and development property 9,322.5 9,212.1 9,403.0Tenant incentives included within trade and other receivables 112.8 109.9 104.1Head leases included within finance leases in borrowings (80.1) (80.2) (89.7)Market value of investment and development property 9,355.2 9,241.8 9,417.4
The fair value of the Group's investment and development property, other than certain development land was determined byindependent external valuers as at 30 June 2017. The valuations are in accordance with the Royal Institution of CharteredSurveyors ('RICS') Valuation – Professional Standards 2014 and were arrived at by reference to market transactions for similarproperties and rent profiles. Fair values for investment properties are calculated using the present value income approach. The

main assumptions underlying the valuations are in relation to rent profile and yields. The valuation methodology is unchanged fromthe prior year and is set out in further detail on page 126 of the 2016 Annual report. In respect of development valuations,deductions are then made for anticipated costs, including an allowance for developer's profit before arriving at a valuation.
The table in the other information section sets out the market value, yield and occupancy of each of the major investmentproperties.
15 Investment in joint venturesThe Group's principal joint ventures own and manage investment and development property.
St David's, Puerto intu Cardiff Venecia Asturias Other Total GBPm GBPm GBPm GBPm GBPmAt 1 January 2017 355.2 119.4 76.0 37.0 587.6Group's share of underlying profit 6.5 0.4 1.0 0.6 8.5Group's share of other net profit/(loss) (1.9) 6.0 6.0 (0.2) 9.9Group's share of profit 4.6 6.4 7.0 0.4 18.4Distributions – – – (0.9) (0.9)Loan advances – – – 2.3 2.3Loan repayments (10.1) – – – (10.1)Foreign exchange movements – 3.5 2.3 – 5.8At 30 June 2017 349.7 129.3 85.3 38.8 603.1Represented by: Loans to joint ventures 88.3 98.0 34.9 6.8 228.0Group's share of net assets 261.4 31.3 50.4 32.0 375.1
intu St David's, Puerto intu Merry Hill Cardiff Venecia Asturias Other Total GBPm GBPm GBPm GBPm GBPm GBPmAt 1 January 2016 447.0 368.5 85.9 53.4 37.1 991.9Group's share of underlying profit 3.3 7.2 – 0.6 1.0 12.1Group's share of other net profit/(loss) (4.3) (1.0) 4.8 6.7 (0.7) 5.5Group's share of profit/(loss) (1.0) 6.2 4.8 7.3 0.3 17.6Distributions (1.0) – – – (1.3) (2.3)Loan advances – – – – 0.7 0.7Loan repayments – (7.5) – – – (7.5)Disposal of joint venture interest (445.0) – – – – (445.0)Foreign exchange movements – – 11.2 7.2 0.5 18.9At 30 June 2016 – 367.2 101.9 67.9 37.3 574.3Represented by: Loans to joint ventures – 103.5 92.8 33.1 3.5 232.9Group's share of net assets – 263.7 9.1 34.8 33.8 341.4
intu St David's, Puerto intu Merry Hill Cardiff Venecia Asturias Other Total GBPm GBPm GBPm GBPm GBPm GBPmAt 1 January 2016 447.0 368.5 85.9 53.4 37.1 991.9Group's share of underlying profit 3.3 13.7 0.7 0.8 1.3 19.8Group's share of other net profit/(loss) (4.3) (14.3) 19.4 12.9 (1.4) 12.3Group's share of profit/(loss) (1.0) (0.6) 20.1 13.7 (0.1) 32.1Distributions (1.0) – – – (2.2) (3.2)Loan advances – – – – 1.2 1.2Loan repayments – (12.7) – – – (12.7)Disposal of joint venture interest (445.0) – – – – (445.0)Foreign exchange movements – – 13.4 8.9 1.0 23.3At 31 December 2016 – 355.2 119.4 76.0 37.0 587.6Represented by: Loans to joint ventures – 98.4 95.3 33.9 4.6 232.2Group's share of net assets – 256.8 24.1 42.1 32.4 355.4
16 Investment in associates GBPmAt 1 January 2017 65.2Share of profit of associates 4.4Foreign exchange movements 0.1 At 30 June 2017 69.7
Investment in associates comprises a 32.4 per cent holding in the ordinary shares of Prozone Intu Properties Limited ('Prozone')and a 26.8 per cent holding in the ordinary shares of Empire Mall Private Limited ('Empire'). Both companies are incorporated in India.
As required by IAS 28 Investments in Associates and Joint Ventures, the equity method of accounting is applied in accounting forthe Group's investment in Prozone and Empire. The results of Prozone and Empire for the year to 31 March have been used as 30June information is not available in time for these interim financial statements. Those results are adjusted to be in line with theGroup's accounting policies and include the most recent property valuations, determined as at 31 March 2017, by independentprofessionally qualified external valuers in line with the valuation methodology described in note 14.
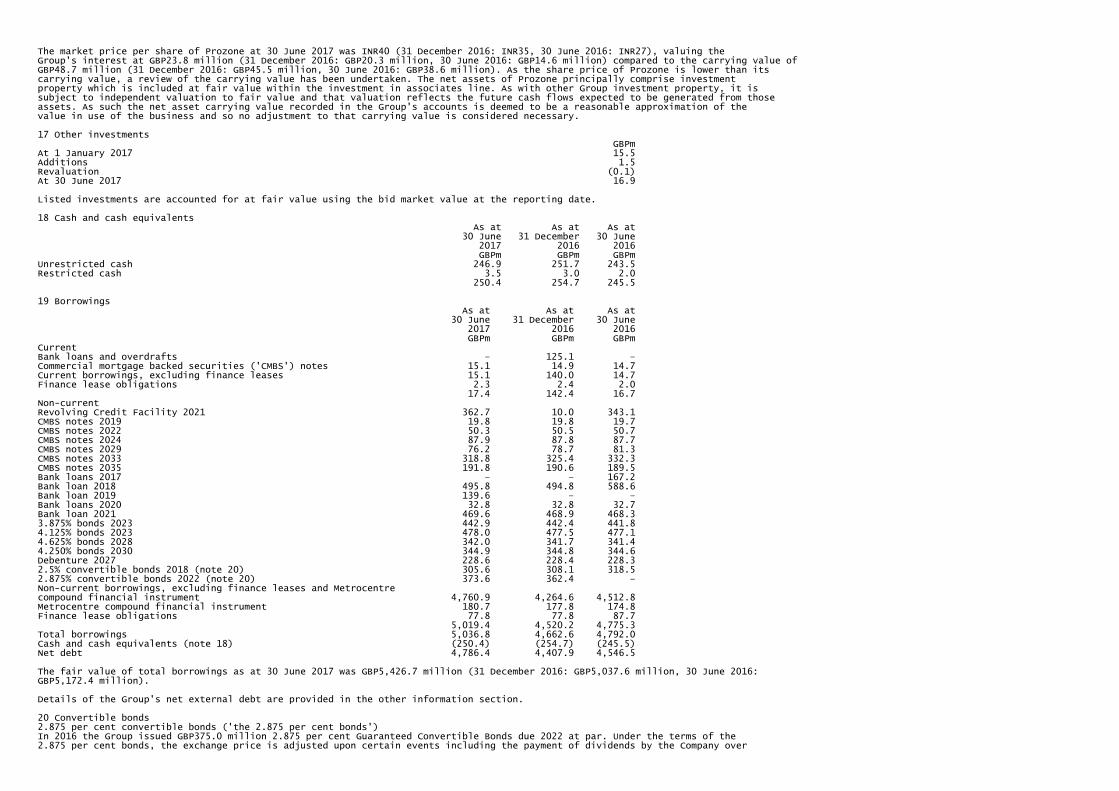
The market price per share of Prozone at 30 June 2017 was INR40 (31 December 2016: INR35, 30 June 2016: INR27), valuing theGroup's interest at GBP23.8 million (31 December 2016: GBP20.3 million, 30 June 2016: GBP14.6 million) compared to the carrying value ofGBP48.7 million (31 December 2016: GBP45.5 million, 30 June 2016: GBP38.6 million). As the share price of Prozone is lower than itscarrying value, a review of the carrying value has been undertaken. The net assets of Prozone principally comprise investmentproperty which is included at fair value within the investment in associates line. As with other Group investment property, it issubject to independent valuation to fair value and that valuation reflects the future cash flows expected to be generated from thoseassets. As such the net asset carrying value recorded in the Group's accounts is deemed to be a reasonable approximation of thevalue in use of the business and so no adjustment to that carrying value is considered necessary.
17 Other investments GBPmAt 1 January 2017 15.5Additions 1.5Revaluation (0.1)At 30 June 2017 16.9
Listed investments are accounted for at fair value using the bid market value at the reporting date.
18 Cash and cash equivalents As at As at As at 30 June 31 December 30 June 2017 2016 2016 GBPm GBPm GBPmUnrestricted cash 246.9 251.7 243.5Restricted cash 3.5 3.0 2.0 250.4 254.7 245.5
19 Borrowings As at As at As at 30 June 31 December 30 June 2017 2016 2016 GBPm GBPm GBPmCurrentBank loans and overdrafts – 125.1 –Commercial mortgage backed securities ('CMBS') notes 15.1 14.9 14.7Current borrowings, excluding finance leases 15.1 140.0 14.7Finance lease obligations 2.3 2.4 2.0 17.4 142.4 16.7Non-current Revolving Credit Facility 2021 362.7 10.0 343.1CMBS notes 2019 19.8 19.8 19.7CMBS notes 2022 50.3 50.5 50.7CMBS notes 2024 87.9 87.8 87.7CMBS notes 2029 76.2 78.7 81.3CMBS notes 2033 318.8 325.4 332.3CMBS notes 2035 191.8 190.6 189.5Bank loans 2017 – – 167.2Bank loan 2018 495.8 494.8 588.6Bank loan 2019 139.6 – –Bank loans 2020 32.8 32.8 32.7Bank loan 2021 469.6 468.9 468.33.875% bonds 2023 442.9 442.4 441.84.125% bonds 2023 478.0 477.5 477.14.625% bonds 2028 342.0 341.7 341.44.250% bonds 2030 344.9 344.8 344.6Debenture 2027 228.6 228.4 228.32.5% convertible bonds 2018 (note 20) 305.6 308.1 318.52.875% convertible bonds 2022 (note 20) 373.6 362.4 –Non-current borrowings, excluding finance leases and Metrocentre compound financial instrument 4,760.9 4,264.6 4,512.8Metrocentre compound financial instrument 180.7 177.8 174.8Finance lease obligations 77.8 77.8 87.7 5,019.4 4,520.2 4,775.3Total borrowings 5,036.8 4,662.6 4,792.0Cash and cash equivalents (note 18) (250.4) (254.7) (245.5)Net debt 4,786.4 4,407.9 4,546.5
The fair value of total borrowings as at 30 June 2017 was GBP5,426.7 million (31 December 2016: GBP5,037.6 million, 30 June 2016:GBP5,172.4 million).
Details of the Group's net external debt are provided in the other information section.
20 Convertible bonds2.875 per cent convertible bonds ('the 2.875 per cent bonds')In 2016 the Group issued GBP375.0 million 2.875 per cent Guaranteed Convertible Bonds due 2022 at par. Under the terms of the2.875 per cent bonds, the exchange price is adjusted upon certain events including the payment of dividends by the Company over
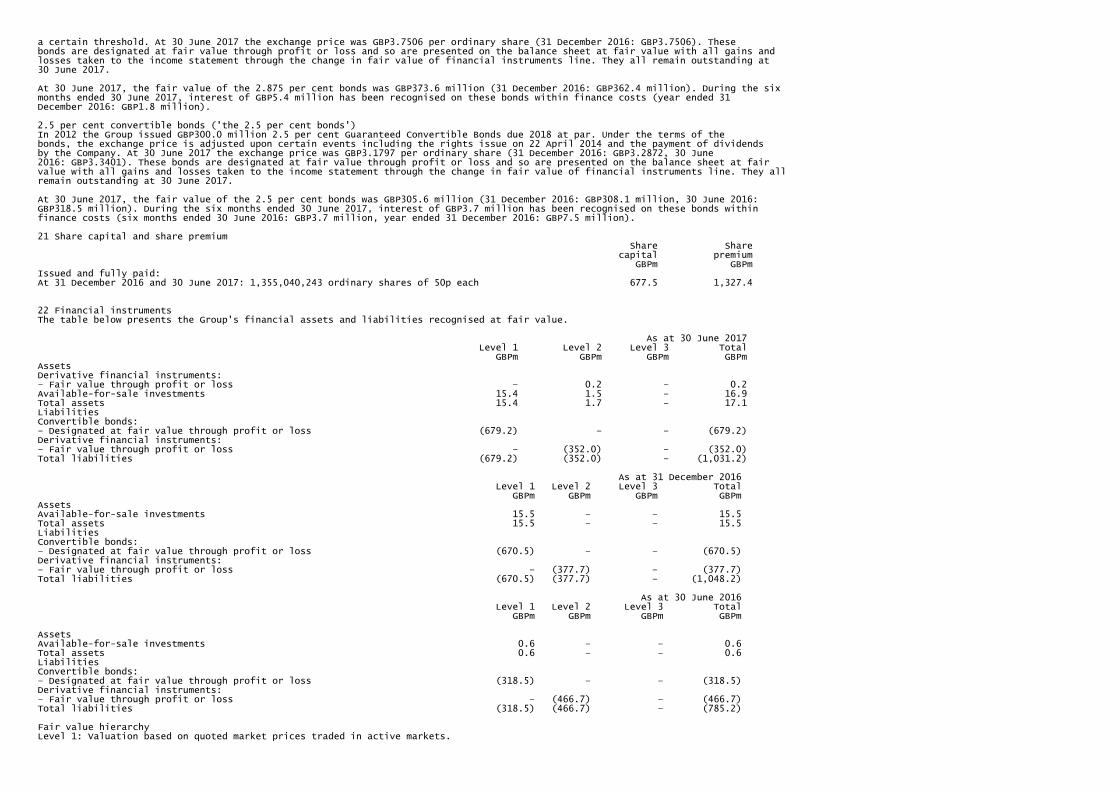
a certain threshold. At 30 June 2017 the exchange price was GBP3.7506 per ordinary share (31 December 2016: GBP3.7506). Thesebonds are designated at fair value through profit or loss and so are presented on the balance sheet at fair value with all gains andlosses taken to the income statement through the change in fair value of financial instruments line. They all remain outstanding at30 June 2017.
At 30 June 2017, the fair value of the 2.875 per cent bonds was GBP373.6 million (31 December 2016: GBP362.4 million). During the sixmonths ended 30 June 2017, interest of GBP5.4 million has been recognised on these bonds within finance costs (year ended 31December 2016: GBP1.8 million).
2.5 per cent convertible bonds ('the 2.5 per cent bonds')In 2012 the Group issued GBP300.0 million 2.5 per cent Guaranteed Convertible Bonds due 2018 at par. Under the terms of thebonds, the exchange price is adjusted upon certain events including the rights issue on 22 April 2014 and the payment of dividendsby the Company. At 30 June 2017 the exchange price was GBP3.1797 per ordinary share (31 December 2016: GBP3.2872, 30 June2016: GBP3.3401). These bonds are designated at fair value through profit or loss and so are presented on the balance sheet at fairvalue with all gains and losses taken to the income statement through the change in fair value of financial instruments line. They allremain outstanding at 30 June 2017.
At 30 June 2017, the fair value of the 2.5 per cent bonds was GBP305.6 million (31 December 2016: GBP308.1 million, 30 June 2016:GBP318.5 million). During the six months ended 30 June 2017, interest of GBP3.7 million has been recognised on these bonds withinfinance costs (six months ended 30 June 2016: GBP3.7 million, year ended 31 December 2016: GBP7.5 million).
21 Share capital and share premium Share Share capital premium GBPm GBPmIssued and fully paid:At 31 December 2016 and 30 June 2017: 1,355,040,243 ordinary shares of 50p each 677.5 1,327.4
22 Financial instrumentsThe table below presents the Group's financial assets and liabilities recognised at fair value.
As at 30 June 2017 Level 1 Level 2 Level 3 Total GBPm GBPm GBPm GBPmAssetsDerivative financial instruments:– Fair value through profit or loss – 0.2 – 0.2Available-for-sale investments 15.4 1.5 – 16.9Total assets 15.4 1.7 – 17.1LiabilitiesConvertible bonds:– Designated at fair value through profit or loss (679.2) – – (679.2)Derivative financial instruments: – Fair value through profit or loss – (352.0) – (352.0)Total liabilities (679.2) (352.0) – (1,031.2) As at 31 December 2016 Level 1 Level 2 Level 3 Total GBPm GBPm GBPm GBPmAssets Available-for-sale investments 15.5 – – 15.5Total assets 15.5 – – 15.5Liabilities Convertible bonds: – Designated at fair value through profit or loss (670.5) – – (670.5)Derivative financial instruments: – Fair value through profit or loss – (377.7) – (377.7)Total liabilities (670.5) (377.7) – (1,048.2) As at 30 June 2016 Level 1 Level 2 Level 3 Total GBPm GBPm GBPm GBPm Assets Available-for-sale investments 0.6 – – 0.6Total assets 0.6 – – 0.6Liabilities Convertible bonds: – Designated at fair value through profit or loss (318.5) – – (318.5)Derivative financial instruments: – Fair value through profit or loss – (466.7) – (466.7)Total liabilities (318.5) (466.7) – (785.2)
Fair value hierarchyLevel 1: Valuation based on quoted market prices traded in active markets.
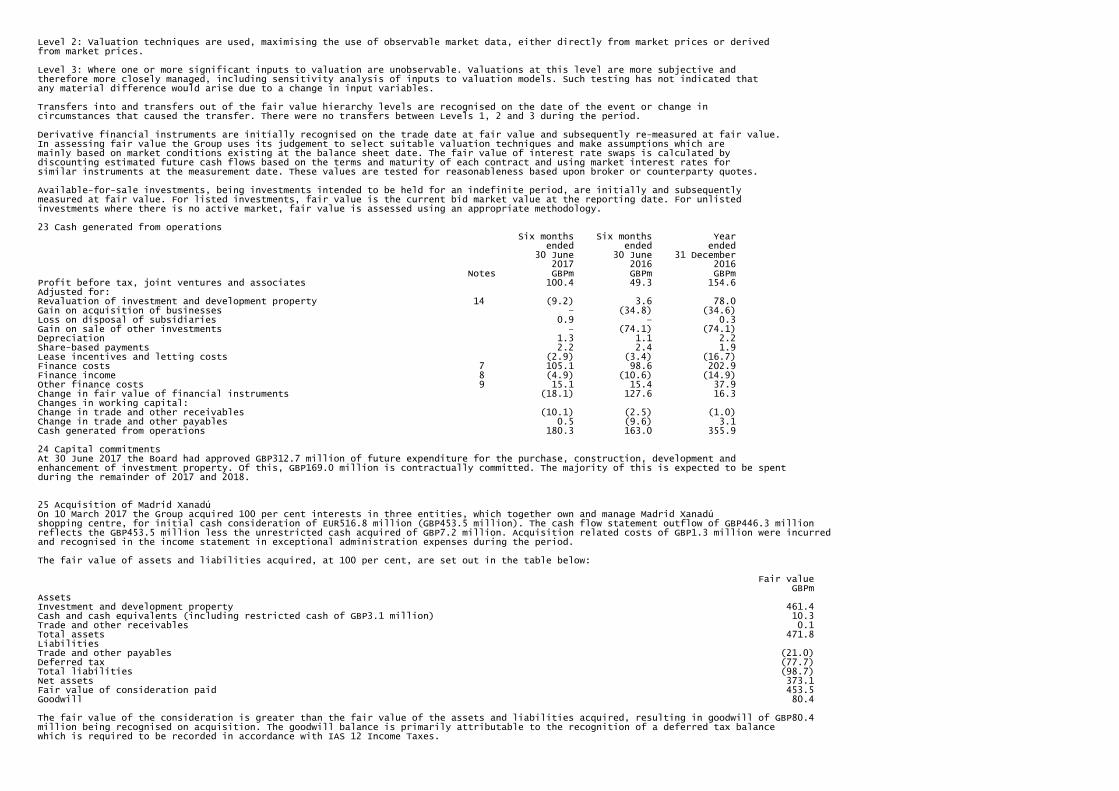
Level 2: Valuation techniques are used, maximising the use of observable market data, either directly from market prices or derivedfrom market prices.
Level 3: Where one or more significant inputs to valuation are unobservable. Valuations at this level are more subjective andtherefore more closely managed, including sensitivity analysis of inputs to valuation models. Such testing has not indicated thatany material difference would arise due to a change in input variables.
Transfers into and transfers out of the fair value hierarchy levels are recognised on the date of the event or change incircumstances that caused the transfer. There were no transfers between Levels 1, 2 and 3 during the period.
Derivative financial instruments are initially recognised on the trade date at fair value and subsequently re-measured at fair value.In assessing fair value the Group uses its judgement to select suitable valuation techniques and make assumptions which aremainly based on market conditions existing at the balance sheet date. The fair value of interest rate swaps is calculated bydiscounting estimated future cash flows based on the terms and maturity of each contract and using market interest rates forsimilar instruments at the measurement date. These values are tested for reasonableness based upon broker or counterparty quotes.
Available-for-sale investments, being investments intended to be held for an indefinite period, are initially and subsequentlymeasured at fair value. For listed investments, fair value is the current bid market value at the reporting date. For unlistedinvestments where there is no active market, fair value is assessed using an appropriate methodology.
23 Cash generated from operations Six months Six months Year ended ended ended 30 June 30 June 31 December 2017 2016 2016 Notes GBPm GBPm GBPmProfit before tax, joint ventures and associates 100.4 49.3 154.6Adjusted for: Revaluation of investment and development property 14 (9.2) 3.6 78.0Gain on acquisition of businesses – (34.8) (34.6)Loss on disposal of subsidiaries 0.9 – 0.3Gain on sale of other investments – (74.1) (74.1)Depreciation 1.3 1.1 2.2Share-based payments 2.2 2.4 1.9Lease incentives and letting costs (2.9) (3.4) (16.7)Finance costs 7 105.1 98.6 202.9Finance income 8 (4.9) (10.6) (14.9)Other finance costs 9 15.1 15.4 37.9Change in fair value of financial instruments (18.1) 127.6 16.3Changes in working capital: Change in trade and other receivables (10.1) (2.5) (1.0)Change in trade and other payables 0.5 (9.6) 3.1Cash generated from operations 180.3 163.0 355.9
24 Capital commitmentsAt 30 June 2017 the Board had approved GBP312.7 million of future expenditure for the purchase, construction, development andenhancement of investment property. Of this, GBP169.0 million is contractually committed. The majority of this is expected to be spentduring the remainder of 2017 and 2018.
25 Acquisition of Madrid XanadúOn 10 March 2017 the Group acquired 100 per cent interests in three entities, which together own and manage Madrid Xanadúshopping centre, for initial cash consideration of EUR516.8 million (GBP453.5 million). The cash flow statement outflow of GBP446.3 millionreflects the GBP453.5 million less the unrestricted cash acquired of GBP7.2 million. Acquisition related costs of GBP1.3 million were incurredand recognised in the income statement in exceptional administration expenses during the period.
The fair value of assets and liabilities acquired, at 100 per cent, are set out in the table below:
Fair value GBPmAssets Investment and development property 461.4Cash and cash equivalents (including restricted cash of GBP3.1 million) 10.3Trade and other receivables 0.1Total assets 471.8Liabilities Trade and other payables (21.0)Deferred tax (77.7)Total liabilities (98.7)Net assets 373.1Fair value of consideration paid 453.5Goodwill 80.4
The fair value of the consideration is greater than the fair value of the assets and liabilities acquired, resulting in goodwill of GBP80.4million being recognised on acquisition. The goodwill balance is primarily attributable to the recognition of a deferred tax balancewhich is required to be recorded in accordance with IAS 12 Income Taxes.
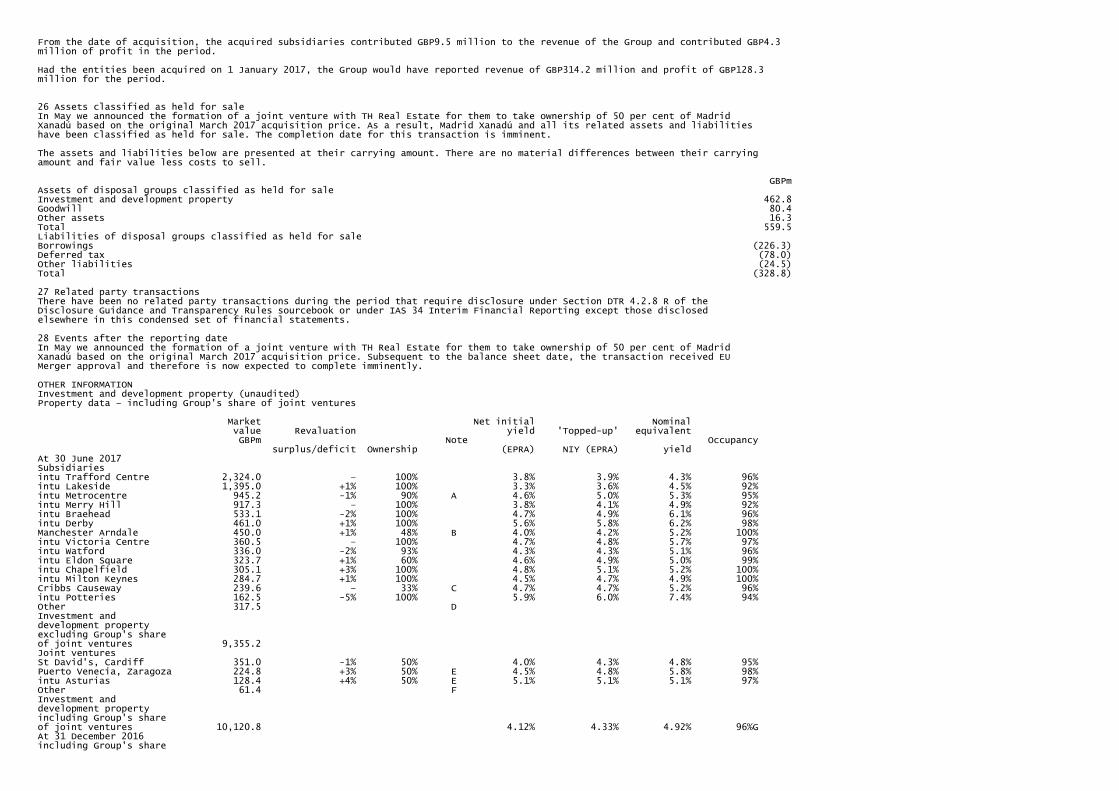
From the date of acquisition, the acquired subsidiaries contributed GBP9.5 million to the revenue of the Group and contributed GBP4.3million of profit in the period.
Had the entities been acquired on 1 January 2017, the Group would have reported revenue of GBP314.2 million and profit of GBP128.3million for the period.
26 Assets classified as held for saleIn May we announced the formation of a joint venture with TH Real Estate for them to take ownership of 50 per cent of MadridXanadú based on the original March 2017 acquisition price. As a result, Madrid Xanadú and all its related assets and liabilitieshave been classified as held for sale. The completion date for this transaction is imminent.
The assets and liabilities below are presented at their carrying amount. There are no material differences between their carryingamount and fair value less costs to sell.
GBPmAssets of disposal groups classified as held for saleInvestment and development property 462.8Goodwill 80.4Other assets 16.3Total 559.5Liabilities of disposal groups classified as held for saleBorrowings (226.3)Deferred tax (78.0)Other liabilities (24.5)Total (328.8)
27 Related party transactionsThere have been no related party transactions during the period that require disclosure under Section DTR 4.2.8 R of theDisclosure Guidance and Transparency Rules sourcebook or under IAS 34 Interim Financial Reporting except those disclosedelsewhere in this condensed set of financial statements.
28 Events after the reporting dateIn May we announced the formation of a joint venture with TH Real Estate for them to take ownership of 50 per cent of MadridXanadú based on the original March 2017 acquisition price. Subsequent to the balance sheet date, the transaction received EUMerger approval and therefore is now expected to complete imminently.
OTHER INFORMATIONInvestment and development property (unaudited)Property data – including Group's share of joint ventures
Market Net initial Nominal value Revaluation yield 'Topped-up' equivalent GBPm Note Occupancy surplus/deficit Ownership (EPRA) NIY (EPRA) yieldAt 30 June 2017Subsidiariesintu Trafford Centre 2,324.0 – 100% 3.8% 3.9% 4.3% 96%intu Lakeside 1,395.0 +1% 100% 3.3% 3.6% 4.5% 92%intu Metrocentre 945.2 -1% 90% A 4.6% 5.0% 5.3% 95%intu Merry Hill 917.3 – 100% 3.8% 4.1% 4.9% 92%intu Braehead 533.1 -2% 100% 4.7% 4.9% 6.1% 96%intu Derby 461.0 +1% 100% 5.6% 5.8% 6.2% 98%Manchester Arndale 450.0 +1% 48% B 4.0% 4.2% 5.2% 100%intu Victoria Centre 360.5 – 100% 4.7% 4.8% 5.7% 97%intu Watford 336.0 -2% 93% 4.3% 4.3% 5.1% 96%intu Eldon Square 323.7 +1% 60% 4.6% 4.9% 5.0% 99%intu Chapelfield 305.1 +3% 100% 4.8% 5.1% 5.2% 100%intu Milton Keynes 284.7 +1% 100% 4.5% 4.7% 4.9% 100%Cribbs Causeway 239.6 – 33% C 4.7% 4.7% 5.2% 96%intu Potteries 162.5 -5% 100% 5.9% 6.0% 7.4% 94%Other 317.5 D Investment and development property excluding Group's share of joint ventures 9,355.2 Joint ventures St David's, Cardiff 351.0 -1% 50% 4.0% 4.3% 4.8% 95%Puerto Venecia, Zaragoza 224.8 +3% 50% E 4.5% 4.8% 5.8% 98%intu Asturias 128.4 +4% 50% E 5.1% 5.1% 5.1% 97%Other 61.4 F Investment anddevelopment propertyincluding Group's shareof joint ventures 10,120.8 4.12% 4.33% 4.92% 96%GAt 31 December 2016including Group's share
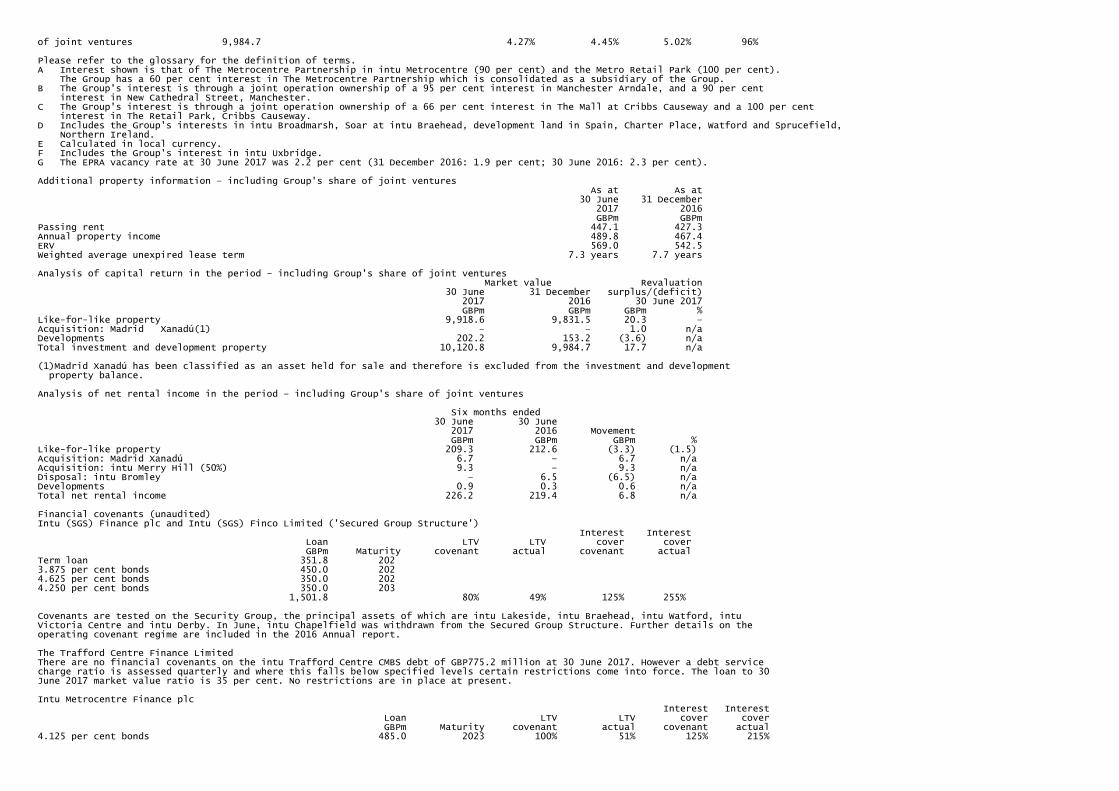
of joint ventures 9,984.7 4.27% 4.45% 5.02% 96%
Please refer to the glossary for the definition of terms.A Interest shown is that of The Metrocentre Partnership in intu Metrocentre (90 per cent) and the Metro Retail Park (100 per cent). The Group has a 60 per cent interest in The Metrocentre Partnership which is consolidated as a subsidiary of the Group.B The Group's interest is through a joint operation ownership of a 95 per cent interest in Manchester Arndale, and a 90 per cent interest in New Cathedral Street, Manchester.C The Group's interest is through a joint operation ownership of a 66 per cent interest in The Mall at Cribbs Causeway and a 100 per cent interest in The Retail Park, Cribbs Causeway.D Includes the Group's interests in intu Broadmarsh, Soar at intu Braehead, development land in Spain, Charter Place, Watford and Sprucefield, Northern Ireland.E Calculated in local currency.F Includes the Group's interest in intu Uxbridge.G The EPRA vacancy rate at 30 June 2017 was 2.2 per cent (31 December 2016: 1.9 per cent; 30 June 2016: 2.3 per cent).
Additional property information – including Group's share of joint ventures As at As at 30 June 31 December 2017 2016 GBPm GBPmPassing rent 447.1 427.3Annual property income 489.8 467.4ERV 569.0 542.5Weighted average unexpired lease term 7.3 years 7.7 years
Analysis of capital return in the period – including Group's share of joint ventures Market value Revaluation 30 June 31 December surplus/(deficit) 2017 2016 30 June 2017 GBPm GBPm GBPm %Like-for-like property 9,918.6 9,831.5 20.3 –Acquisition: Madrid Xanadú(1) – – 1.0 n/aDevelopments 202.2 153.2 (3.6) n/aTotal investment and development property 10,120.8 9,984.7 17.7 n/a
(1)Madrid Xanadú has been classified as an asset held for sale and therefore is excluded from the investment and development property balance.
Analysis of net rental income in the period – including Group's share of joint ventures
Six months ended 30 June 30 June 2017 2016 Movement GBPm GBPm GBPm %Like-for-like property 209.3 212.6 (3.3) (1.5)Acquisition: Madrid Xanadú 6.7 – 6.7 n/aAcquisition: intu Merry Hill (50%) 9.3 – 9.3 n/aDisposal: intu Bromley – 6.5 (6.5) n/aDevelopments 0.9 0.3 0.6 n/aTotal net rental income 226.2 219.4 6.8 n/a
Financial covenants (unaudited)Intu (SGS) Finance plc and Intu (SGS) Finco Limited ('Secured Group Structure') Interest Interest Loan LTV LTV cover cover GBPm Maturity covenant actual covenant actualTerm loan 351.8 2023.875 per cent bonds 450.0 2024.625 per cent bonds 350.0 2024.250 per cent bonds 350.0 203 1,501.8 80% 49% 125% 255%
Covenants are tested on the Security Group, the principal assets of which are intu Lakeside, intu Braehead, intu Watford, intuVictoria Centre and intu Derby. In June, intu Chapelfield was withdrawn from the Secured Group Structure. Further details on theoperating covenant regime are included in the 2016 Annual report.
The Trafford Centre Finance LimitedThere are no financial covenants on the intu Trafford Centre CMBS debt of GBP775.2 million at 30 June 2017. However a debt servicecharge ratio is assessed quarterly and where this falls below specified levels certain restrictions come into force. The loan to 30June 2017 market value ratio is 35 per cent. No restrictions are in place at present.
Intu Metrocentre Finance plc Interest Interest Loan LTV LTV cover cover GBPm Maturity covenant actual covenant actual4.125 per cent bonds 485.0 2023 100% 51% 125% 215%

Further details on the operating covenant regime are included in the 2016 Annual report.
Other asset-specific debt Loan outstanding at Loan to Interest Interest 30 June 2017(1) LTV 30 June 2017 cover cover GBPm Maturity covenant market value(2) covenant actua(l3)intu Merry Hill(4) 500.0 2018 65% 55% 150% 207%intu Milton Keynes 140.5 2019 65% 49% 150% 308%Sprucefield 33.2 2020 65% 50% 150% 329%intu Uxbridge(5) 26.0 2020 70% 54% 125% 215%St David's, Cardiff 122.5 2021 65% 35% 150% 307%Puerto Venecia, Zaragoza(5) EUR112.5 2019 65% 44% 150% 306%intu Asturias(5) EUR60.5 2021 65% 44% 150% 586%Madrid Xanadú EUR262.9 2022 65% 50% 150% 404%
1 The loan values are the actual principal balances outstanding at 30 June 2017, which take into account any principal repayments made up to 30 June 2017. The balance sheet value of the loans includes unamortised fees.2 The loan to 30 June 2017 market value provides an indication of the impact the 30 June 2017 property valuations could have on the LTV covenants. The actual timing and manner of testing LTV covenants varies and is loan specific.3 Based on latest certified figures, calculated in accordance with loan agreements, which have submission dates between 30 June 2017 and 31 July 2017. The calculations are loan specific and include a variety of historic, forecast and in certain instances a combined historic and forecast basis.4 Since the period end, we have refinanced the intu Merry Hill loan, with the loan now maturing in 2024.5 Debt shown is consistent with the Group's economic interest.
Intu Debenture plc Capital Capital Interest Interest Loan cover cover cover cover GBPm Maturity covenant actual covenant actual 231.4 2027 150% 250% 100% 118%
The debenture is currently secured on a number of the Group's properties including intu Potteries, intu Eldon Square, intuBroadmarsh and Soar at intu Braehead.
Should the capital cover or interest cover test be breached, Intu Debenture plc (the 'Issuer') has three months from the date ofdelivery of the valuation or the latest certificate to the Trustees to make good any deficiencies. The Issuer may withdraw propertysecured on the debenture by paying a sum of money or through the substitution of alternative property provided that the capitalcover and interest cover tests are satisfied immediately following the substitution.
Financial covenants on corporate facilities Interest Interest Borrowings/ Borrowings/ Net worth Net worth cover cover net worth net worth covenant actual covenant actual covenant actualGBP600m facility, maturing in 2021* GBP1,200.0m GBP2,463.9 120% 205% 125% 60%GBP375m due in 2022 2.875 per cent convertible bonds** n/a n/a n/a n/a 175% 16%GBP300m due in 2018 2.5 per cent convertible bonds** n/a n/a n/a n/a 175% 16%
* Tested on the Borrower Group which excludes, at the Group's election, certain subsidiaries with asset-specific finance. The facility is secured on the Group's investments in Manchester Arndale and Cribbs Causeway.** Tested on the Group excluding, at the Group's election, the borrowings of certain subsidiaries with asset-specific finance.
Interest rate swapsThe table below sets out the nominal amount and average rate of hedging, excluding lenders' margins, in place under current andforward starting swap contracts. Nominal amount Average rate GBPm %In effect on or after:1 year 2,076.8 2.512 years 1,726.8 2.625 years 679.3 5.0410 years 672.2 5.0415 years 610.6 5.0020 years 116.7 5.67
Group including share of joint ventures (unaudited)
This section presents the financial information of the Group including the share of joint ventures on a line-by-line basis. It alsoincludes reconciliations between the information presented in the financial statements and that including the Group's share of jointventures as used in the operating and financial reviews.
Underlying profit statement Six months Six months Six months ended ended ended Year ended 30 June 30 June 31 December 31 December

2017 2016 2016 2016 GBPm GBPm GBPm GBPmNet rental income 226.2 219.4 227.6 447.0Net other income/(expense) 0.1 (0.3) (0.4) (0.7)Administration expenses (20.6) (18.3) (20.3) (38.6)Underlying operating profit 205.7 200.8 206.9 407.7Finance costs (107.5) (101.4) (107.1) (208.5)Finance income 1.1 0.7 0.8 1.5Other finance costs (2.9) (2.9) (3.0) (5.9)Underlying net finance costs (109.3) (103.6) (109.3) (212.9)Underlying profit before tax and associates 96.4 97.2 97.6 194.8Tax on underlying profit (0.2) (0.1) 0.1 –Share of underlying profit of associates 0.4 0.3 0.2 0.5Remove amounts attributable to non-controlling interests 1.9 2.1 2.6 4.7Underlying earnings 98.5 99.5 100.5 200.0Underlying earnings per share (pence) 7.3p 7.5p 7.5p 15.0pWeighted average number of shares (million) 1,343.1 1,332.0 1,334.8 1,333.5
Underlying profit for the six months ended 30 June 2017 Group Group Share of including underlying joint share of joint profit ventures ventures GBPm GBPm GBPmRent receivable 250.0 18.5 268.5Service charge income 55.8 3.7 59.5Facilities management income from joint ventures 1.5 (0.3) 1.2Revenue 307.3 21.9 329.2Net rental income 210.5 15.7 226.2Net other income 0.6 (0.5) 0.1Administration expenses (20.1) (0.5) (20.6)Underlying operating profit 191.0 14.7 205.7Finance costs (105.1) (2.4) (107.5)Finance income 4.9 (3.8) 1.1Other finance costs (2.9) – (2.9)Underlying net finance costs (103.1) (6.2) (109.3)Underlying profit before tax, joint ventures and associates 87.9 8.5 96.4Tax on underlying profit (0.2) – (0.2)Share of underlying profit of joint ventures 8.5 (8.5) –Share of underlying profit of associates 0.4 – 0.4Remove amounts attributable to non-controlling interests 1.9 – 1.9Underlying earnings 98.5 – 98.5
Consolidated income statement for the six months ended 30 June 2017 Group Group Share of including income joint share of joint statement ventures ventures GBPm GBPm GBPmRevenue 307.3 21.9 329.2Net rental income 210.5 15.7 226.2Net other income 0.6 (0.5) 0.1Revaluation of investment and development property 9.2 8.5 17.7Loss on disposal of subsidiaries (0.9) – (0.9)Loss on sale of other investments – (0.3) (0.3)Administration expenses – ongoing (20.1) (0.5) (20.6)Administration expenses – exceptional (1.7) – (1.7)Operating profit 197.6 22.9 220.5Finance costs (105.1) (2.4) (107.5)Finance income 4.9 (3.8) 1.1Other finance costs (15.1) – (15.1)Change in fair value of financial instruments 18.1 0.6 18.7Net finance costs (97.2) (5.6) (102.8)Profit before tax, joint ventures and associates 100.4 17.3 117.7Share of post-tax profit of joint ventures 18.4 (18.4) –Share of post-tax profit of associates 4.4 – 4.4Profit before tax 123.2 (1.1) 122.1Current tax (0.2) – (0.2)Deferred tax (0.3) 1.5 1.2Taxation (0.5) 1.5 1.0Profit for the period 122.7 0.4 123.1Non-controlling interests 4.4 (0.4) 4.0Profit for the period attributable to owners of intu properties plc 127.1 – 127.1
Balance sheet as at 30 June 2017 Group Group Share of including

balance joint share of joint sheet ventures ventures GBPm GBPm GBPmAssets Investment and development property 9,322.5 764.2 10,086.7Investment in joint ventures 603.1 (603.1) –Cash and cash equivalents 250.4 38.5 288.9Assets classified as held for sale 559.5 – 559.5Other assets 346.9 15.4 362.3Total assets 11,082.4 215.0 11,297.4Liabilities Borrowings (5,036.8) (182.9) (5,219.7)Derivative financial instruments (352.0) (2.2) (354.2)Liabilities associated with assets classified as held for sale (328.8) – (328.8)Other liabilities (309.6) (27.0) (336.6)Total liabilities (6,027.2) (212.1) (6,239.3)Net assets 5,055.2 2.9 5,058.1Non-controlling interests (63.2) (2.9) (66.1)Net assets attributable to owners of intu properties plc 4,992.0 – 4,992.0 Investment and development property 30 June 31 December 30 June 2017 2016 2016 GBPm GBPm GBPmBalance sheet carrying value of investment and development property 10,086.7 9,944.5 10,121.7Tenant incentives included within trade and other receivables 122.4 120.4 115.0Head leases included within finance leases in borrowings (88.3) (80.2) (89.7)Market value of investment and development property 10,120.8 9,984.7 10,147.0 Net external debt 30 June 31 December 30 June 2017 2016 2016 GBPm GBPm GBPmTotal borrowings 5,036.8 4,662.6 4,792.0Cash and cash equivalents (250.4) (254.7) (245.5)Net debt 4,786.4 4,407.9 4,546.5Metrocentre compound financial instrument (180.7) (177.8) (174.8)Net external debt – before Group's share of joint ventures 4,605.7 4,230.1 4,371.7Add share of borrowing of joint ventures 182.9 170.9 156.1Less share of cash of joint ventures (38.5) (36.9) (20.6)Net external debt – including Group's share of joint ventures 4,750.1 4,364.1 4,507.2Analysed as: Debt including Group's share of joint ventures 5,039.0 4,655.7 4,773.3Cash including Group's share of joint ventures (288.9) (291.6) (266.1)Net external debt – including Group's share of joint ventures 4,750.1 4,364.1 4,507.2 Debt to assets ratio 30 June 31 December 30 June 2017 2016 2016 GBPm GBPm GBPmMarket value of investment and development property 10,120.8 9,984.7 10,147.0Net external debt (4,750.1) (4,364.1) (4,507.2)Debt to assets ratio 46.9% 43.7% 44.4% EPRA summaryThe EPRA Best Practice Recommendations identify six key performance measures, including the EPRA cost ratios. The measuresare deemed to be of importance for investors in property companies and aim to encourage more consistent and widespreaddisclosure. The Group is supportive of this initiative but continues to disclose additional measures throughout this interim reportwhich it believes are more appropriate to the Group's current circumstances.
In 2016, the Group retained its EPRA Gold Award for exceptional compliance with the EPRA Best Practice Recommendations.
The EPRA measures are summarised below:
30 June 30 June 31 December 2017 2016 2016 Notes GBPm GBPm GBPmEPRA cost ratio (including direct vacancy costs)(1) 19.4% 17.3% 18.6%EPRA cost ratio (excluding direct vacancy costs)(1) 15.0% 14.1% 15.0%EPRA earnings 12(c) 96.5m 98.8m 192.9m- per share 12(c) 7.2p 7.5p 14.5pEPRA NAV 13(a) 5,186.0m 5,111.6m 5,200.9m- per share 13(a) 385p 382p 386pEPRA NNNAV 13(b) 4,697.4m 4,593.2m 4,698.9m- per share 13(b) 349p 343p 349pEPRA net initial yield (2) 4.1% 4.3% 4.3%EPRA 'topped-up' NIY (2) 4.3% 4.5% 4.5%

EPRA vacancy rate(1) 2.2% 2.3% 1.9%
1 As presented below.2 See other information, investment and development property.
Details of the Group's performance against the EPRA Best Practice Recommendations on Sustainability Reporting can be foundin full in the 2016 corporate responsibility report. In 2016, the Group retained its Gold EPRA Sustainability Best PracticeRecommendations award.
EPRA cost ratios Six months Six months Year ended ended ended 30 June 30 June 31 December 2017 2016 2016 GBPm GBPm GBPmAdministration expenses – ongoing 20.6 18.3 38.6Net service charge costs 7.9 7.2 16.1Other non-recoverable costs 24.2 19.2 44.1Remove: service charge costs recovered through rents (3.2) (2.5) (5.6)EPRA costs – including direct vacancy costs 49.5 42.2 93.2Direct vacancy costs (11.3) (7.8) (18.0)EPRA costs – excluding direct vacancy costs 38.2 34.4 75.2Rent receivable 268.5 258.8 532.6Rent payable (10.2) (13.0) (25.4)Gross rental income less ground rent payable 258.3 245.8 507.2Remove: service charge costs recovered through rents (3.2) (2.5) (5.6)Gross rental income 255.1 243.3 501.6EPRA cost ratio – including direct vacancy costs 19.4% 17.3% 18.6%EPRA cost ratio – excluding direct vacancy costs 15.0% 14.1% 15.0%
EPRA vacancy rate 30 June 31 December 30 June 2017 2016 2016 % % %intu Trafford Centre 2.3 0.8 0.4intu Lakeside 2.4 3.4 3.8intu Metrocentre 4.4 2.8 4.9intu Merry Hill 1.9 1.7 2.3intu Braehead 2.5 2.4 2.9Madrid Xanadú 1.6 n/a n/aintu Derby 1.7 0.5 0.5Manchester Arndale 0.3 1.1 0.4intu Victoria Centre 1.8 3.3 0.4intu Watford 2.2 0.2 3.6intu Eldon Square 0.4 0.6 1.1intu Chapelfield – 1.5 2.5intu Milton Keynes – – –Cribbs Causeway 1.9 3.3 4.8intu Potteries 4.5 3.4 2.6intu Bromley n/a n/a 3.0St David's, Cardiff 4.6 4.2 3.5Puerto Venecia, Zaragoza 1.8 3.2 5.1intu Asturias 2.5 0.9 0.6 2.2 1.9 2.3 GLOSSARYABC1 customersProportion of customers within UK social groups A, B and C1, defined as members of households whose chief earner's occupation isprofessional, higher or intermediate management, or supervisory.
Annual property incomeThe Group's share of passing rent plus the independent external valuers' estimate of annual excess turnover rent and sundry income suchas that from car parks and mall commercialisation.
CACIProvide market research on intu's customers and UK wide location analysis.
Debt to assets ratioNet external debt divided by the market value of investment and development property.
Diluted figuresReported amounts adjusted to include the effects of dilutive potential shares issuable under convertible bonds and employeeincentive arrangements.
Earnings per shareProfit for the period attributable to owners of intu properties plc divided by the weighted average number of shares in issue during theperiod.

EPRAEuropean Public Real Estate Association, the publisher of Best Practice Recommendations intended to make financial statementsof public real estate companies in Europe clearer, more transparent and comparable.
ERV (estimated rental value)The independent external valuers' estimate of the Group's share of the current annual market rent of all lettable space after expiry ofconcessionary periods net of any non-recoverable charges but before bad debt provisions.
Exceptional itemsItems that in the Directors' view are required to be separately disclosed by virtue of their size, nature or incidence. Underlying earningsis considered to be a key measure in understanding the Group's financial performance, and excludes exceptional items.
Headline rent ITZAAnnual contracted rent per square foot after expiry of concessionary periods in terms of Zone A.
Interest coverUnderlying operating profit divided by the net finance cost excluding the change in fair value of financial instruments, exceptionalfinance costs and amortisation of the Metrocentre compound financial instrument.
Interest rate swapA derivative financial instrument enabling parties to exchange interest rate obligations for a predetermined period. These areused by the Group to convert floating rate debt to fixed rates.
IPDInvestment Property Databank Limited, producer of an independent benchmark of property returns.
Like-for-like propertyInvestment property which has been owned throughout both periods without significant capital expenditure in either period, sothat income can be compared on a like-for-like basis. For the purposes of comparison of capital values, this will also includeassets owned at the previous reporting period end but not throughout the prior period.
Long-term leaseA lease with a term certain of at least five years.
LTV (loan to value)The ratio of attributable debt to the market value of an investment property.
NAV per share (diluted, adjusted)NAV per share calculated on a diluted basis and adjusted to remove the fair value of derivatives (net of tax), goodwill resulting fromthe recognition of deferred tax liabilities, and deferred tax on investment and development property and other investments.
Net asset value ('NAV') per shareNet assets attributable to owners of intu properties plc divided by the number of ordinary shares in issue at the period end.
Net external debtNet debt after removing the Metrocentre compound financial instrument.
Net initial yield (EPRA)Annualised net rent on investment property (after deduction of revenue costs such as head rent, running void, servicecharge after shortfalls, empty rates and merchant association contribution) expressed as a percentage of the gross marketvalue before deduction of theoretical acquisition costs, consistent with EPRA's net initial yield, and as provided by the Group'sindependent external valuers.
Net rental incomeThe Group's share of net rents receivable as shown in the income statement, having taken due account of non-recoverablecosts, bad debt provisions and adjustments to comply with IFRS including those regarding tenant lease incentives.
NNNAV per share (diluted, adjusted)NAV per share (diluted, adjusted) adjusted to include the fair values of derivatives, borrowings and deferred taxes.
Nominal equivalent yieldEffective annual yield to a purchaser from an asset at market value before taking account of notional acquisition costs assuming rentis receivable annually in arrears, reflecting ERV but disregarding potential changes in market rents, as determined by the Group'sindependent external valuers.
OccupancyThe passing rent of let and under offer units expressed as a percentage of the passing rent of let and under offer units plusERV of un-let units, excluding development and recently completed properties. Units let to tenants in administration and stilltrading are treated as let and those no longer trading are treated as un-let.
Passing rentThe Group's share of contracted annual rents receivable at the balance sheet date. This takes no account of accountingadjustments made in respect of rent free periods or tenant incentives, the reclassification of certain lease payments asfinance charges or any irrecoverable costs and expenses, and does not include excess turnover rent, additional rent inrespect of unsettled rent reviews or sundry income such as from car parks etc. Contracted annual rents in respect oftenants in administration are excluded.

PMAProperty Market Analysis LLP, a producer of property market research and forecasting.
Property Income Distribution ('PID')A dividend, generally subject to UK withholding tax at the basic rate of income tax, that a UK REIT is required to pay to itsshareholders from its qualifying rental profits. Certain classes of shareholder may qualify to receive a PID gross,shareholders should refer to intugroup.co.uk for further information. The Group can also pay non-PID dividends which arenot subject to UK withholding tax.
Real Estate Investment Trust ('REIT')REITs are internationally recognised property investment vehicles which have now been introduced in many countries around theworld. Each country has its own rules, but the broad intention of REITs is to encourage investment in domestic property by removing taxdistortions for investors.
In the UK, REITs must meet certain ongoing rules and regulations, including the requirement to distribute at least 90 per cent ofqualifying rental profits to shareholders. Withholding tax of 20 per cent is deducted from these Property Income Distributions (seedefinition). Profits from a REIT's non-property business remain subject to normal corporation tax. The Group elected for REITstatus in the UK with effect from 1 January 2007.
Scrip Dividend SchemeThe Group offers shareholders the opportunity to participate in the Scrip Dividend Scheme. This enables participating shareholdersto receive shares instead of cash when a Scrip Alternative is offered for a particular dividend.
Short-term leaseA lease with a term certain of less than five years.
SOCIMIThe Spanish equivalent of a Real Estate Investment Trust.
Tenant (or lease) incentivesAny incentives offered to occupiers to enter into a lease. Typically incentives are in the form of an initial rent free periodand/or a cash contribution to fit out the premises. Under IFRS the value of incentives granted to tenants is amortisedthrough the income statement on a straight-line basis over the lease term.
Topped-up NIY (EPRA)Net initial yield ('NIY') adjusted for the expiration of rent free periods and other unexpired lease incentives.
Total financial returnThe change in NAV per share (diluted, adjusted) plus dividends per share paid in the period expressed as a percentage ofopening NAV per share (diluted, adjusted).
Total property returnThe change in capital value, less any capital expenditure incurred, plus net income in the year expressed as a percentage of the capitalemployed (opening capital value plus capital expenditure incurred) in the year as calculated by IPD.
Underlying earnings per share ('EPS')Earnings per share adjusted to exclude valuation movements, exceptional items and related tax.
Underlying figuresAmounts described as underlying exclude valuation movements, exceptional items and related tax.
Vacancy rate (EPRA)The ERV of vacant space divided by total ERV.
Yield shiftA movement (usually expressed in basis points) in the yield of a property asset.
DIVIDENDSThe Directors of intu properties plc have announced an interim dividend per ordinary share (ISIN GB0006834344) of 4.6pence (2016: 4.6 pence) payable on 21 November 2017 (see salient dates below). An announcement confirming whether ascrip dividend alternative will be offered will be made on 10 October 2017.
The dividend may be partly paid as a Property Income Distribution ('PID') and partly paid as a non-PID. The PID elementwill be subject to deduction of a 20 per cent withholding tax unless exemptions apply (please refer to the PID special notebelow). Any non-PID element will be treated as an ordinary UK company dividend. For South African shareholders, anynon-PID cash dividends may be subject to deduction of South African Dividends Tax at 20 per cent.
Shareholders will be advised of the PID/non-PID split no later than Tuesday 10 October 2017.
Dates
The following are the salient dates for the payment of the interim dividend:
Monday, 9 October 2017 Sterling/Rand exchange rate struck.Tuesday, 10 October 2017 Sterling/Rand exchange rate and dividend amount in SA currency announced.Wednesday, 18 October 2017 Ordinary shares listed ex-dividend on the Johannesburg Stock Exchange.

Thursday, 19 October 2017 Ordinary shares listed ex-dividend on the London Stock Exchange.Friday, 20 October 2017 Record date for interim dividend in London and Johannesburg.Friday, 20 October 2017 UK shareholders only: Last date for receipt of Tax Exemption Declaration forms to permit dividends to be paid gross.Tuesday, 21 November 2017 Dividend payment day for shareholders
Note: If a scrip dividend alternative were to be offered, the deadline for submission of valid election forms will be 20 October 2017 for shareholders on theSouth African register and 27 October 2017 for shareholders on the UK register.
South African shareholders should note that, in accordance with the requirements of Strate, the last day to trade cum-dividend will be Tuesday, 17 October 2017 and that no dematerialisation or rematerialisation of shares will be possible fromWednesday, 18 October to Friday, 20 October 2017 inclusive. No transfers between the UK and South African registersmay take place from Tuesday, 10 October to Friday, 20 October 2017 inclusive.
PID SPECIAL NOTE:
UK shareholders:
For those who are eligible for exemption from the 20 per cent withholding tax and have not previously registered forexemption, an HM Revenue & Customs ('HMRC') Tax Exemption Declaration is available for download from the'Investors' section of the intu properties plc website (intugroup.co.uk), or on request to our UK registrars, Capita AssetServices. Validly completed forms must be received by Capita Asset Services no later than the Record Date, Friday 20October 2017; otherwise the dividend will be paid after deduction of tax.
South African and other non-UK shareholders:
South African shareholders may apply to HMRC after payment of the dividend for a refund of the difference between the 20per cent withholding tax and the UK/South African double taxation treaty rate of 15 per cent. Other non-UK shareholdersmay be able to make similar claims for a refund of UK withholding tax deducted. Refund application forms for all non-UKshareholders are available for download from the 'Investors' section of the intu properties plc website (intugroup.co.uk), oron request to our South African registrars, Terbium Financial Services, or HMRC. UK withholding tax refunds are notclaimable from intu properties plc, the South African Revenue Service ('SARS') or other national authorities, only from theUK's HMRC.
Additional information on PIDs can be found at intugroup.co.uk/en/investors/shareholders-information/real-estate-investment-trust/.
The above does not constitute advice and shareholders should seek their own professional guidance. intu properties plcdoes not accept liability for any loss suffered arising from reliance on the above.
27 JULY 2017
SponsorMerrill Lynch South Africa (Pty) Limited