influence of tissue anisotropy on the distribution of ...cinc.org/archives/2008/pdf/0489.pdf ·...
TRANSCRIPT
Influence of Tissue Anisotropy on the
Distribution of Defibrillation Fields
SA Seitz, G Seemann, O Dossel
Institute of Biomedical Engineering, Universitat Karlsruhe (TH), Karlsruhe, Germany
Abstract
The development of new devices used for defibrillation
and cardioversion is often supported by numerical simu-
lations of the induced electric potentials and current dis-
tributions. The commonly used tools incorporate isotropic
models of the tissue properties present in the human torso.
A comparative study was conducted to characterize the in-
fluence of anisotropic compared to isotropic tissue model-
ing. Defibrillation shocks with amplitudes of 1000 V and
2000 V were simulated and a set of varying conductivity
values and anisotropy ratios was examined.
The inclusion of tissue anisotropy produced significantly
smaller values for current density compared to isotropic
calculations especially in the myocardial tissue.
1. Introduction
In clinical practice defibrillators are a widely used tech-
nique to bring fibrillating hearts back to normal sinus
rhythm. By applying high energetic electrical shocks to the
myocardium, the reentrant electrical activation can be ter-
minated. The necessary currents are injected through elec-
trodes placed on the patient’s torso in various locations.
Recently, new defibrillators or electrode positions have
been evaluated by means of computer simulations. The ef-
ficacy of the defibrillation concerning the electrode place-
ment and design can be examined by numerically calcu-
lating the generated electric fields and induced currents
in torso and myocardial tissue. Yoon et al. showed that
an isotropic representation does not completely cover the
realistically occuring current flows and potential distribu-
tions [1]. The findings of Eason et al. [2] support this the-
ory. The larger conduction along the skeletal muscle fibers
that are oriented mainly parallel to the body surface leads
the applied currents away from the intended trans-thoracic
direction. This may cause wrong assumptions about the
effectively induced current distribution in the myocard by
the examined defibrillation system. The goal of this work
is to determine the influence of tissue anisotropy on the
field distribution and current densities.
2. Methods
A wide range of software packages has been developed
to numerically calculate the field distribution in the human
body caused by electrodes on the body surface with volt-
age pulses. The frequencies used for defibrillation and car-
dioversion are in the low kilohertz range. The signals ex-
amined here can be regarded as electro-quasistatic. This
allows the use of Poisson’s equation (1) with conductivity
tensor σ, potential distribution Φ and the current density J.
J = σE = σ(−gradΦ) (1)
The finite element method is used to implement the sys-
tem matrix of this equation describing the anisotropic elec-
trical properties of the tissue. The numerical computing
package PETSc is than used to iteratively calculate the in-
verse of the system matrix [3]. The sparse system matrices
were preconditioned using Jacobi’s method, which pro-
duced input for the GMRES (Generalized minimal resid-
ual method) solver. The electrical potentials at the elec-
trodes were integrated into the system as boundary con-
ditions. All computations to determine the defibrillation
effects were done on a subset of the Visible Human dataset
[4] with a resolution of 2 millimeters. It is completely
segmented in the region of interest and identifies 23 tissue
types and additionally provides fiber orientation informa-
tion for skeletal and myocardial muscles [5].
A literature survey on electrical properties of tissue re-
sulted in varying information regarding the conductivity
parallel and perpendicular to the fibers in skeletal and my-
ocardial muscles (see Table 1). Rush et al. [6] determined
an anisotropy ratio of 1:15.33 in skeletal muscles while
Burger et al. [7] measured only 1:2.76. To examine the
effects of anisotropy the results were compared with sim-
ulations based on an isotropic setup.
The isotropic conductivities were derived from the
anistropic ones under the following assumption: The par-
allel and perpendicular conductivity σl and σt form an el-
lipsoid of volume A. The tensor of isotropic conductivities
can be interpreted as a sphere with radius rb. In order to
achieve the same global conductivity, the sphere needs to
ISSN 0276−6574 489 Computers in Cardiology 2008;35:489−492.
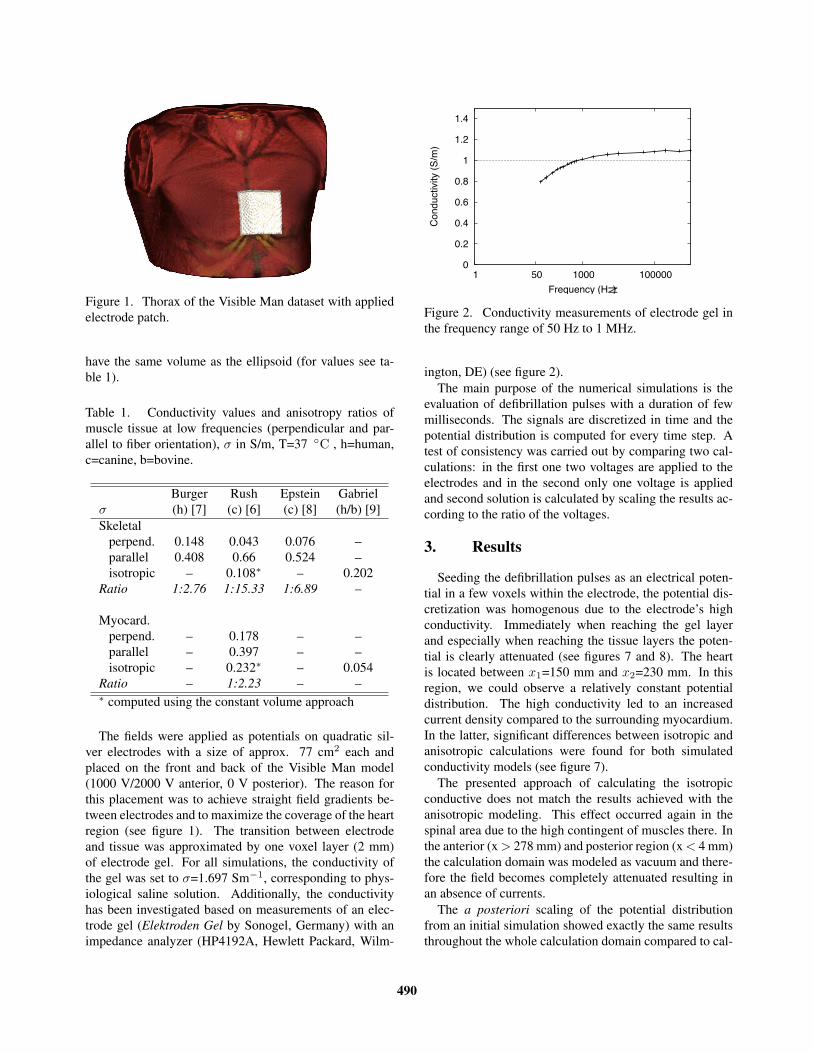
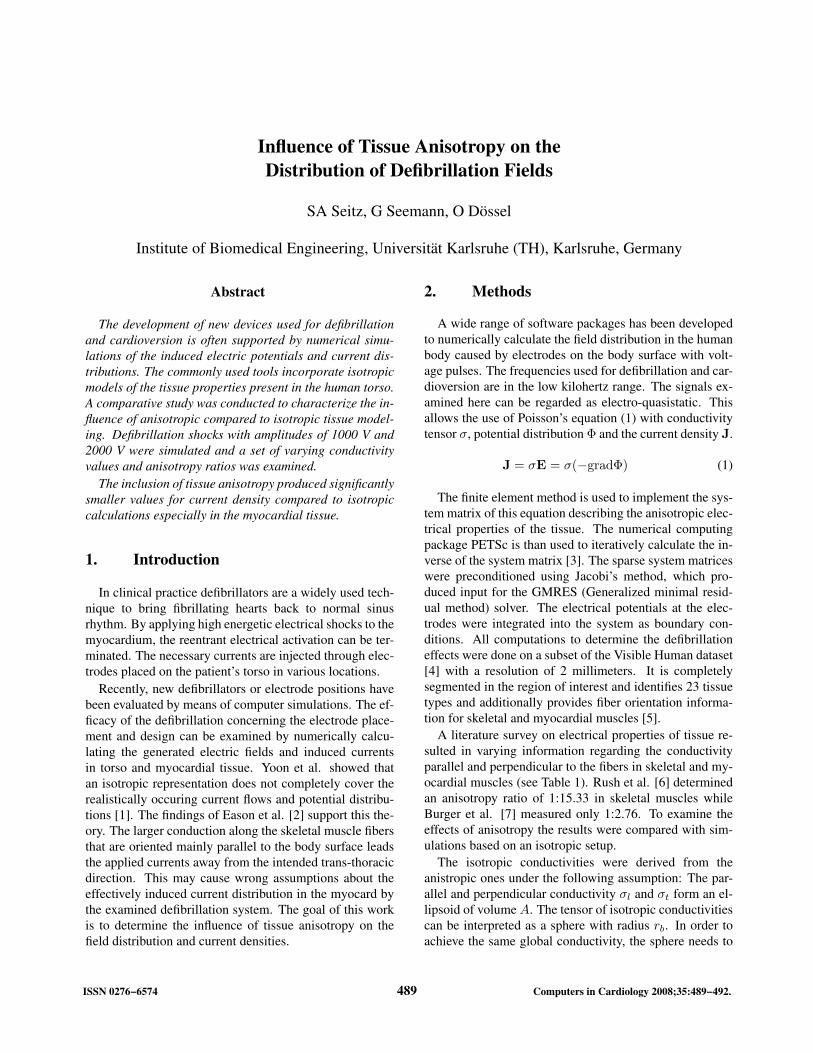
Figure 1. Thorax of the Visible Man dataset with applied
electrode patch.
have the same volume as the ellipsoid (for values see ta-
ble 1).
Table 1. Conductivity values and anisotropy ratios of
muscle tissue at low frequencies (perpendicular and par-
allel to fiber orientation), σ in S/m, T=37 ◦C , h=human,
c=canine, b=bovine.
Burger Rush Epstein Gabriel
σ (h) [7] (c) [6] (c) [8] (h/b) [9]
Skeletal
perpend. 0.148 0.043 0.076 –
parallel 0.408 0.66 0.524 –
isotropic – 0.108∗ – 0.202
Ratio 1:2.76 1:15.33 1:6.89 –
Myocard.
perpend. – 0.178 – –
parallel – 0.397 – –
isotropic – 0.232∗ – 0.054
Ratio – 1:2.23 – –∗ computed using the constant volume approach
The fields were applied as potentials on quadratic sil-
ver electrodes with a size of approx. 77 cm2 each and
placed on the front and back of the Visible Man model
(1000 V/2000 V anterior, 0 V posterior). The reason for
this placement was to achieve straight field gradients be-
tween electrodes and to maximize the coverage of the heart
region (see figure 1). The transition between electrode
and tissue was approximated by one voxel layer (2 mm)
of electrode gel. For all simulations, the conductivity of
the gel was set to σ=1.697 Sm−1, corresponding to phys-
iological saline solution. Additionally, the conductivity
has been investigated based on measurements of an elec-
trode gel (Elektroden Gel by Sonogel, Germany) with an
impedance analyzer (HP4192A, Hewlett Packard, Wilm-
0
0.2
0.4
0.6
0.8
1
1.2
1.4
1 50 1000 100000
Conductivity (
S/m
)
Frequency (Hz)
Figure 2. Conductivity measurements of electrode gel in
the frequency range of 50 Hz to 1 MHz.
ington, DE) (see figure 2).
The main purpose of the numerical simulations is the
evaluation of defibrillation pulses with a duration of few
milliseconds. The signals are discretized in time and the
potential distribution is computed for every time step. A
test of consistency was carried out by comparing two cal-
culations: in the first one two voltages are applied to the
electrodes and in the second only one voltage is applied
and second solution is calculated by scaling the results ac-
cording to the ratio of the voltages.
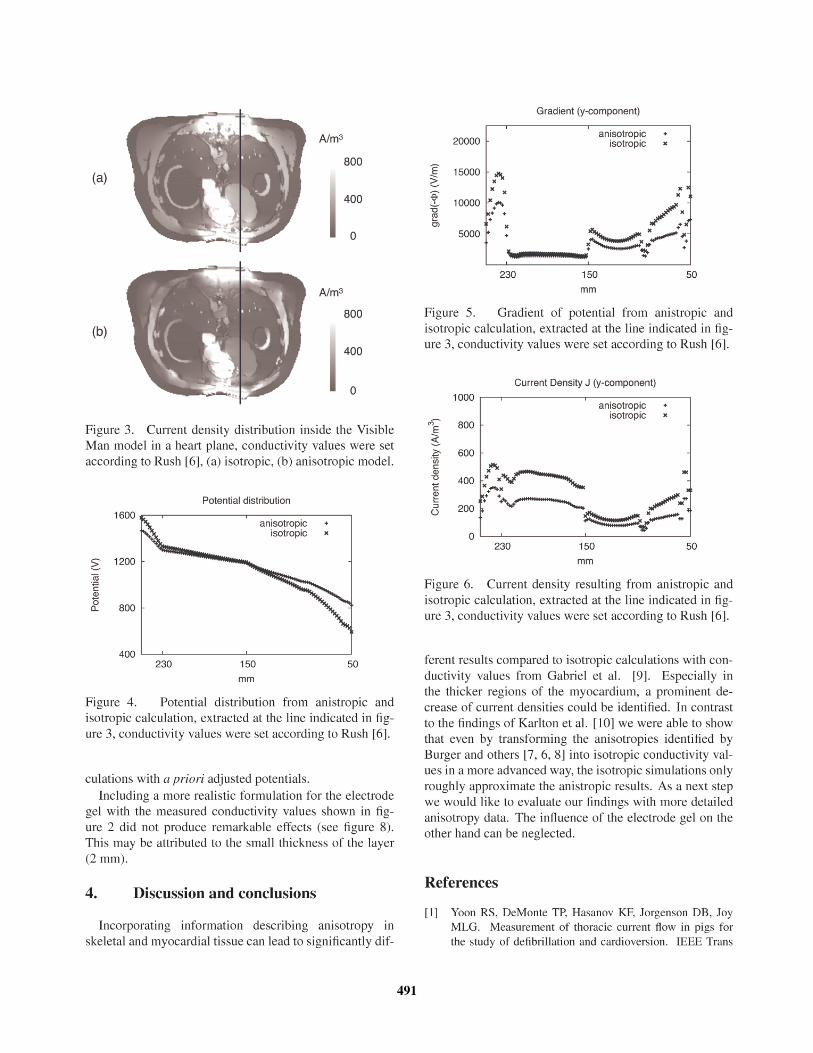
3. Results
Seeding the defibrillation pulses as an electrical poten-
tial in a few voxels within the electrode, the potential dis-
cretization was homogenous due to the electrode’s high
conductivity. Immediately when reaching the gel layer
and especially when reaching the tissue layers the poten-
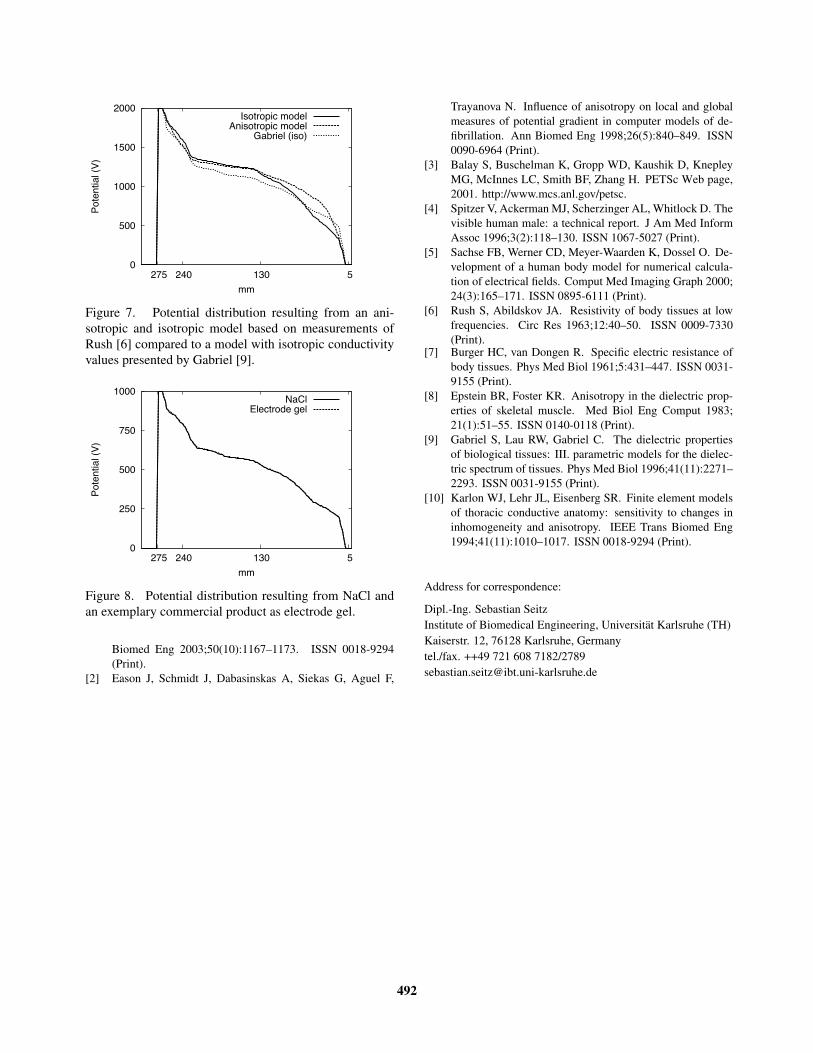
tial is clearly attenuated (see figures 7 and 8). The heart
is located between x1=150 mm and x2=230 mm. In this
region, we could observe a relatively constant potential
distribution. The high conductivity led to an increased
current density compared to the surrounding myocardium.
In the latter, significant differences between isotropic and
anisotropic calculations were found for both simulated
conductivity models (see figure 7).
The presented approach of calculating the isotropic
conductive does not match the results achieved with the
anisotropic modeling. This effect occurred again in the
spinal area due to the high contingent of muscles there. In
the anterior (x > 278 mm) and posterior region (x < 4 mm)
the calculation domain was modeled as vacuum and there-
fore the field becomes completely attenuated resulting in
an absence of currents.
The a posteriori scaling of the potential distribution
from an initial simulation showed exactly the same results
throughout the whole calculation domain compared to cal-
490
491
0
500
1000
1500
2000
5 130 240 275
Pote
ntial (V
)
mm
Isotropic modelAnisotropic model
Gabriel (iso)
Figure 7. Potential distribution resulting from an ani-
sotropic and isotropic model based on measurements of
Rush [6] compared to a model with isotropic conductivity
values presented by Gabriel [9].
0
250
500
750
1000
5 130 240 275
Pote
ntial (V
)
mm
NaClElectrode gel
Figure 8. Potential distribution resulting from NaCl and
an exemplary commercial product as electrode gel.
Biomed Eng 2003;50(10):1167–1173. ISSN 0018-9294
(Print).
[2] Eason J, Schmidt J, Dabasinskas A, Siekas G, Aguel F,
Trayanova N. Influence of anisotropy on local and global
measures of potential gradient in computer models of de-
fibrillation. Ann Biomed Eng 1998;26(5):840–849. ISSN
0090-6964 (Print).
[3] Balay S, Buschelman K, Gropp WD, Kaushik D, Knepley
MG, McInnes LC, Smith BF, Zhang H. PETSc Web page,
2001. http://www.mcs.anl.gov/petsc.
[4] Spitzer V, Ackerman MJ, Scherzinger AL, Whitlock D. The
visible human male: a technical report. J Am Med Inform
Assoc 1996;3(2):118–130. ISSN 1067-5027 (Print).
[5] Sachse FB, Werner CD, Meyer-Waarden K, Dossel O. De-
velopment of a human body model for numerical calcula-
tion of electrical fields. Comput Med Imaging Graph 2000;
24(3):165–171. ISSN 0895-6111 (Print).
[6] Rush S, Abildskov JA. Resistivity of body tissues at low
frequencies. Circ Res 1963;12:40–50. ISSN 0009-7330
(Print).[7] Burger HC, van Dongen R. Specific electric resistance of
body tissues. Phys Med Biol 1961;5:431–447. ISSN 0031-
9155 (Print).
[8] Epstein BR, Foster KR. Anisotropy in the dielectric prop-
erties of skeletal muscle. Med Biol Eng Comput 1983;
21(1):51–55. ISSN 0140-0118 (Print).
[9] Gabriel S, Lau RW, Gabriel C. The dielectric properties
of biological tissues: III. parametric models for the dielec-
tric spectrum of tissues. Phys Med Biol 1996;41(11):2271–
2293. ISSN 0031-9155 (Print).
[10] Karlon WJ, Lehr JL, Eisenberg SR. Finite element models
of thoracic conductive anatomy: sensitivity to changes in
inhomogeneity and anisotropy. IEEE Trans Biomed Eng
1994;41(11):1010–1017. ISSN 0018-9294 (Print).
Address for correspondence:
Dipl.-Ing. Sebastian Seitz
Institute of Biomedical Engineering, Universitat Karlsruhe (TH)
Kaiserstr. 12, 76128 Karlsruhe, Germany
tel./fax. ++49 721 608 7182/2789
492