inverclyde profile - glasgow centre for population health€¦ · gourock east, greenock west and...
TRANSCRIPT

Inverclyde Profile

Acknowledgements
Thanks to those who kindly provided data and/or helped with the interpretation:Judith Brown (Scottish Observatory for Work and Health, University of Glasgow), Anna Cameron (Labour Market Statistics,Scottish Government), Jan Cassels (Scottish Health Survey, Scottish Government), Louise Flanagan (NHS Health Scotland),Julie Kidd (ISD Scotland), Stuart King (Scottish Crime & Justice Survey, Scottish Government), Nicolas Krzyzanowski (ScottishHousehold Survey, Scottish Government), Rebecca Landy (Scottish Health Survey, Scottish Government), Will Linden (ViolenceReduction Unit, Strathclyde Police), Carole Morris (ISD Scotland), David McLaren (Scottish House Condition Survey, ScottishGovernment), Carol McLeod (formally Violence Reduction Unit, Strathclyde Police), Denise Patrick (Labour Market Statistics,Scottish Government), the PsyCIS Steering Group (Mental Health Services, NHS GG&C), Julie Ramsey (Scottish HealthSurvey, Scottish Government), David Scott (ISD Scotland), Martin Taulbut (NHS Health Scotland), Gordon Thomson (ISDScotland), Elaine Tod (NHS Health Scotland), Susan Walker (Housing and Household Surveys, The Scottish Government),National Records for Scotland.
We would like to also thank the steering group for their invaluable input during the project: Doug Adams (Head of Planning and Performance, Mental Health, NHS GG&C), Trevor Lakey (Health Improvement &Inequalities Manager, NHS GG&C), Moira Connolly (Principal Medical Officer for Mental Health, Scottish Government,consultant psychiatrist NHS GG&C), John Parks (Lead Research Nurse PsyCIS Team, NHS GG&C Mental Health Services),Judith Brown (Research Associate (Public Health), University of Glasgow), Catherine Chiang (Consultant in Public HealthMedicine, NHS GG&C), Jane Parkinson (Public Health Adviser, NHS Health Scotland), Ken O’Neil (Clinical Director, SouthSector Glasgow City CHP, NHS GG&C), Neil Quinn (Senior Lecturer, School of Applied Social Sciences, University ofStrathclyde), David McCrae (Head of Mental Health, North East Sector Glasgow City CHP, NHS GG&C), Fiona McNeill (Headof Mental Health, Renfrewshire CHP, NHS GG&C), Michael Sibley (ISD Scotland), Frances Paton (Renfrewshire & InverclydePrimary Health Care NHS Trust), Simon Reilly (Social Work, East Dunbartonshire Council), Clive Travers (Head of MentalHealth, North East Sector Glasgow City CHP, NHS GG&C).
Finally, thanks to the following people in GCPH for all their help with the report: Carol Frame, Rebecca Lenagh-Snow, Fiona McKie and Carol Tannahill.
Cite this report as: Shipton D and Whyte B. Mental Health in Focus: a profile of mental health and wellbeing in Greater Glasgow& Clyde. Glasgow: Glasgow Centre for Population Health, 2011. www.GCPH.co.uk/mentalhealthprofiles
This profile is part of a wider project describing the mental health and wellbeing of Greater Glasgowand Clyde (GG&C) and its sub-regions, compiled by the Glasgow Centre of Population Health (GCPH).The purpose is to support those working in GG&C to find solutions relevant to the region. As part of thiswe hope the information within will stimulate debate around our aspirations for mental wellbeing inGG&C and how best to achieve them.
Fifty-one separate adult indicators of mental health within 14 domains were used to describe the mentalhealth and wellbeing in GG&C (Table Inv.1). The indicators were based on the national mental healthand wellbeing indicators1, which were commissioned by the Scottish Government’s National Programmefor Improving Mental Health and Wellbeing. For this report the set of national indicators wereaugmented with additionally relevant local and national data, allowing smaller geographies to bedescribed. Of the 51 indicators, 26 were available for the local authorities and nine for the smallerlocalities (intermediate zones).
Introduction
High level mental health outcomes
Contextual factors
Individual Community Structural
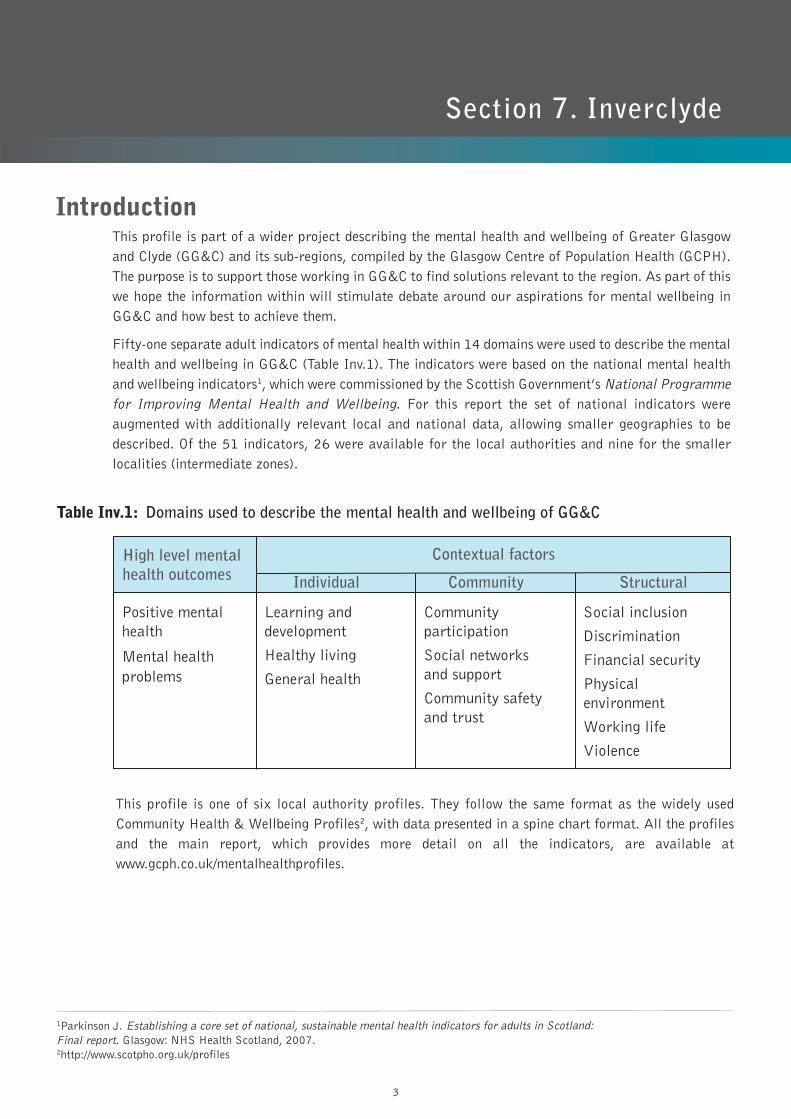
Positive mentalhealth
Mental healthproblems
Learning anddevelopment
Healthy living
General health
Communityparticipation
Social networksand support
Community safetyand trust
Social inclusion
Discrimination
Financial security
Physicalenvironment
Working life
Violence
Table Inv.1: Domains used to describe the mental health and wellbeing of GG&C
1Parkinson J. Establishing a core set of national, sustainable mental health indicators for adults in Scotland: Final report. Glasgow: NHS Health Scotland, 2007.2http://www.scotpho.org.uk/profiles
Section 7. Inverclyde
This profile is one of six local authority profiles. They follow the same format as the widely usedCommunity Health & Wellbeing Profiles2, with data presented in a spine chart format. All the profilesand the main report, which provides more detail on all the indicators, are available atwww.gcph.co.uk/mentalhealthprofiles.
3
Geographical coverage
This profile contains information for Inverclyde and the intermediate zones within the local authority.Intermediate zones are small geographical areas with approximately 2000 – 6000 residents (Table Inv.2)6 .
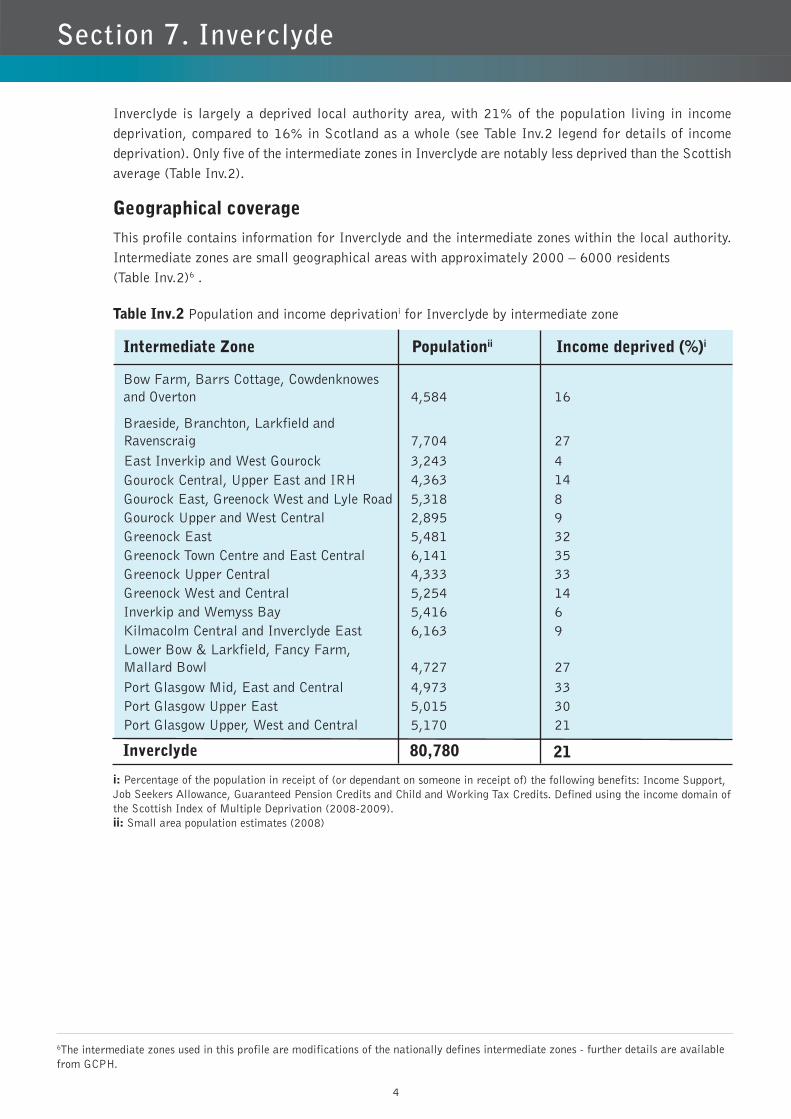
Bow Farm, Barrs Cottage, Cowdenknowesand Overton 4,584 16
Braeside, Branchton, Larkfield and Ravenscraig 7,704 27East Inverkip and West Gourock 3,243 4Gourock Central, Upper East and IRH 4,363 14Gourock East, Greenock West and Lyle Road 5,318 8Gourock Upper and West Central 2,895 9Greenock East 5,481 32Greenock Town Centre and East Central 6,141 35Greenock Upper Central 4,333 33Greenock West and Central 5,254 14Inverkip and Wemyss Bay 5,416 6Kilmacolm Central and Inverclyde East 6,163 9Lower Bow & Larkfield, Fancy Farm, Mallard Bowl 4,727 27Port Glasgow Mid, East and Central 4,973 33Port Glasgow Upper East 5,015 30Port Glasgow Upper, West and Central 5,170 21
Intermediate Zone Populationii Income deprived (%)i
Table Inv.2 Population and income deprivationi for Inverclyde by intermediate zone
Inverclyde 80,780 21
Inverclyde is largely a deprived local authority area, with 21% of the population living in incomedeprivation, compared to 16% in Scotland as a whole (see Table Inv.2 legend for details of incomedeprivation). Only five of the intermediate zones in Inverclyde are notably less deprived than the Scottishaverage (Table Inv.2).
i: Percentage of the population in receipt of (or dependant on someone in receipt of) the following benefits: Income Support,Job Seekers Allowance, Guaranteed Pension Credits and Child and Working Tax Credits. Defined using the income domain ofthe Scottish Index of Multiple Deprivation (2008-2009).ii: Small area population estimates (2008)
6The intermediate zones used in this profile are modifications of the nationally defines intermediate zones - further details are availablefrom GCPH.
Section 7. Inverclyde
4

Section 7. Inverclyde
Understanding Spine Charts
The data are presented in spine charts with separate charts for Inverclyde and the 16 intermediatezones. The intermediate zone spine charts are available at www.gcph.co.uk/mentalhealthprofiles.
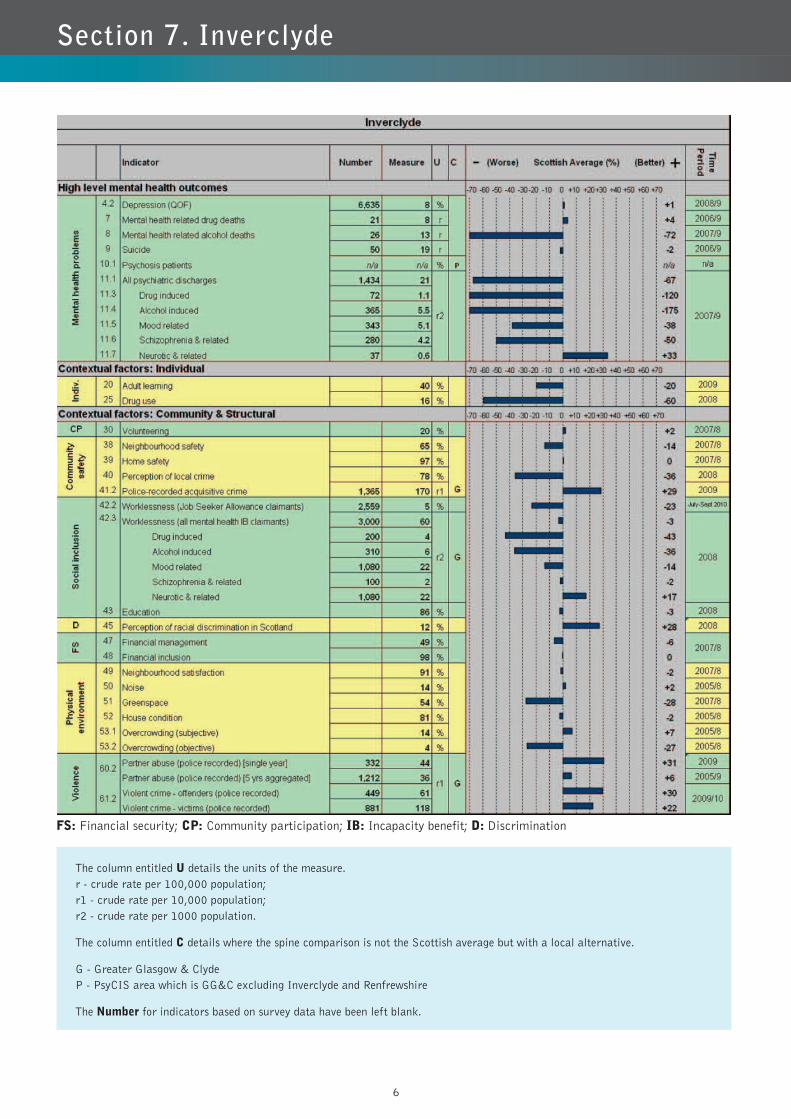
The information for each indicator is presented in the columns entitled ‘Number’ and ‘Measure’.For example, for Depression (QOF) (indicator 4.2) 6,635 individuals were on the primary caredepression register, representing 8% of the population.
The estimate relative to the Scottish population is represented by the horizontal bars. Barsextending to the left represent indicators where the estimate for Inverclyde is worse than theScottish average and bars extending to the right represent indicators where it is better. Forexample, the percentage of the population on the depression register is 1% lower (better) inInverclyde than the Scottish average. The bar charts show a maximum of +/-70% difference withthe Scottish average, to maintain a reasonable scale on the chart. The actual difference is shownnumerically to the right of the bar chart.
Scotland was used as a comparison population consistent with other profiles (e.g. CommunityHealth and Wellbeing Profiles, ScotPHO). Comparison estimates for GG&C can be found inSection 8.
587
Notes and caveatsWhen interpreting the profiles the following points should be considered:
Some of the small area geographies (i.e. neighbourhoods and intermediate zones) have smallpopulations which can produce unstable estimates especially for the indicators with rare outcomes,such as deaths. Estimates with unexpected large deviations from the Scottish average should beinterpreted with caution.
The magnitude by which an indicator deviates (i.e. better or worse) from the Scottish average reflectsnot only how the geographical area differs from Scotland as a whole, but also the variation within theindicator. For example, home safety varies very little, the lowest local authority estimates for thepercentage ‘who feel safe in their own home alone at night’ is 96% and the highest is 98%.
The relevance of the observed difference between populations can only be guided by statisticalsignificance not defined by it. For very large samples, such as population-level data, very smalldifferences will reach statistical significance but may have little relevance. Similarly, for the indicatorsbased on small survey samples large differences can fail to reach statistical significance but cannonetheless be informative, especially if conforming to a trend. For this reason, statistical significancelevels are not presented in the spine charts but are available for local authorities in Section 8.
•
•
•
Section 7. Inverclyde
The column entitled U details the units of the measure.r - crude rate per 100,000 population;r1 - crude rate per 10,000 population;r2 - crude rate per 1000 population.
The column entitled C details where the spine comparison is not the Scottish average but with a local alternative.
G - Greater Glasgow & ClydeP - PsyCIS area which is GG&C excluding Inverclyde and Renfrewshire
The Number for indicators based on survey data have been left blank.
FS: Financial security; CP: Community participation; IB: Incapacity benefit; D: Discrimination
6

InterpretationAcross most indicators, Inverclyde performed less well than the Scottish average, with estimates inInverclyde notably better than the Scottish average in only six of the 26 local authority indicators.
Section 7. Inverclyde
Alcohol- and drug-related indicatorsThe alcohol- and drug-related measures fared consistently less well in Inverclyde compared to Scotland,suggesting that drugs and alcohol pose particular problems for the local authority area. The mentalhealth related alcohol deaths in Inverclyde were 72% higher than the Scottish average (13 versus 7.6per 100,000) – one of the highest rates among the local authorities in GG&C. Alcohol- and drug-relatedpsychiatric admissions were 175% and 120% higher, respectively, than the Scottish average. Illicit druguse was 60% higher than the Scottish average. Drug-related incapacity benefit claims were high at 43%above the Scottish average and alcohol-related claims were 36% above the Scottish average. These highlevels of drug- and alcohol-related IB claims contrast with the relatively low number of total psychiatricincapacity claimants in the local authority (only 3% higher than the Scottish average).
However, in contrast, the level of mental health related drug deaths in Inverclyde was comparable tothe Scottish average (7.9 v 8.2 per 100,000). The discordance between drug-related deaths and otherdrug-related indicators was not seen in the other local authorities in the region and could possibly pointto differences in how drug-related services are provided in Inverclyde.
AnxietyIn contrast to the other high level mental health outcomes the psychiatric admissions for neurotic andrelated conditions (largely anxiety) were lower (better) than the Scottish average. This was seen acrossGG&C, and contrasts with the high levels of anxiety detected in GG&C7. These data suggest that theculture for treating anxiety in a hospital setting within GG&C is different to that in Scotland as a whole.
7 The anxiety indicator is not available for geographies smaller than GG&C.8 Police-recorded crime data is not available for Scotland as a whole.
Contextual indicators
CrimeIn Inverclyde, perceptions of local crime were 36% higher than the Scottish average (an estimated 78%of Inverclyde adults reported that crime was ‘very or fairly common in their area’ compared to 57% inScotland). This contrasted with the relatively low level of both acquisitive crime (170 in Inverclydeversus 238 per 10,000 in GG&C8 ) and offenders and victims of violent crime (30% and 22% lower inInverclyde compared to GG&C). It should be noted that these crime indicators are based on crimesreported by the police, which are likely to be a significant under-estimate of real crime levels.
7
Section 7. Inverclyde
Within Inverclyde(Available at www.gcph.co.uk/mentalhealthprofiles)
Across the intermediate zones in Inverclyde, a picture of polarised communities is presented. Of the 16intermediate zones, five performed substantially less well on the majority of the available mental healthindicators (Greenock East, Greenock Town Centre & East Central, Greenock Upper Central, Lower Bow& Larkfield & Fancy Farm & Mallard Bowl, and lastly Port Glasgow Mid East & Central). Conversely,five intermediate zones performed substantially better on all or most of the available mental healthindicators (Gourock East, Greenock West & Lyle Road, Gourock Upper & West Central, Inverkip &Wemyss Bay, Kilmacolm Central & Inverclyde East, and lastly, East Inverkip & West Gourock).
The remaining six intermediate zones presented a mixed picture: some indicators were better and somewere worse than the Scottish average. The mental health profiles of the intermediate zones in Inverclydegenerally reflected their deprivation profile (Table Inv.2).
It should be noted that only nine of the 51 indicators were available for intermediate zones.
90.9% of Inverclyde is from an ethnic minority, Census data, 2001
Racial discrimination
In Inverclyde, perceived discrimination (the estimated percentage of the population who perceive racialdiscrimination to be a big problem in Scotland) was 28% lower (better) than in Scotland as a whole,and was the lowest level of all the local authorities in GG&C, although the confidence intervals werewide (see Section 8 for more details). This may reflect lower levels of discrimination, different attitudesto discrimination in Inverclyde, or may be related to the ethnic mix of the local authority. Perceptionsof racial discrimination will be harder to capture in populations with little ethnic diversity9.
8
9
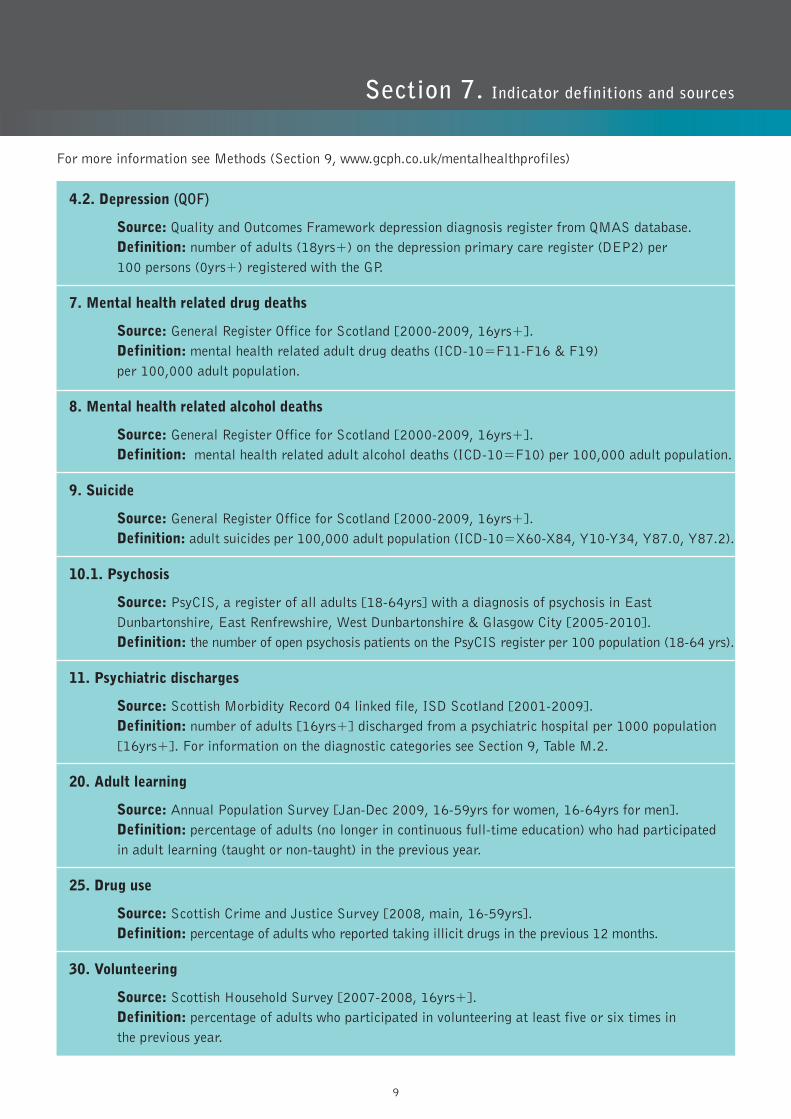
For more information see Methods (Section 9, www.gcph.co.uk/mentalhealthprofiles)
4.2. Depression (QOF)
Source: Quality and Outcomes Framework depression diagnosis register from QMAS database. Definition: number of adults (18yrs+) on the depression primary care register (DEP2) per 100 persons (0yrs+) registered with the GP.
7. Mental health related drug deaths
Source: General Register Office for Scotland [2000-2009, 16yrs+]. Definition: mental health related adult drug deaths (ICD-10=F11-F16 & F19) per 100,000 adult population.
8. Mental health related alcohol deaths
Source: General Register Office for Scotland [2000-2009, 16yrs+]. Definition: mental health related adult alcohol deaths (ICD-10=F10) per 100,000 adult population.
9. Suicide
Source: General Register Office for Scotland [2000-2009, 16yrs+]. Definition: adult suicides per 100,000 adult population (ICD-10=X60-X84, Y10-Y34, Y87.0, Y87.2).
10.1. Psychosis
Source: PsyCIS, a register of all adults [18-64yrs] with a diagnosis of psychosis in East Dunbartonshire, East Renfrewshire, West Dunbartonshire & Glasgow City [2005-2010]. Definition: the number of open psychosis patients on the PsyCIS register per 100 population (18-64 yrs).
11. Psychiatric discharges
Source: Scottish Morbidity Record 04 linked file, ISD Scotland [2001-2009].Definition: number of adults [16yrs+] discharged from a psychiatric hospital per 1000 population [16yrs+]. For information on the diagnostic categories see Section 9, Table M.2.
20. Adult learning
Source: Annual Population Survey [Jan-Dec 2009, 16-59yrs for women, 16-64yrs for men]. Definition: percentage of adults (no longer in continuous full-time education) who had participated in adult learning (taught or non-taught) in the previous year.
25. Drug use
Source: Scottish Crime and Justice Survey [2008, main, 16-59yrs]. Definition: percentage of adults who reported taking illicit drugs in the previous 12 months.
30. Volunteering
Source: Scottish Household Survey [2007-2008, 16yrs+]. Definition: percentage of adults who participated in volunteering at least five or six times in the previous year.
Section 3.
Section 7. Indicator definitions and sources
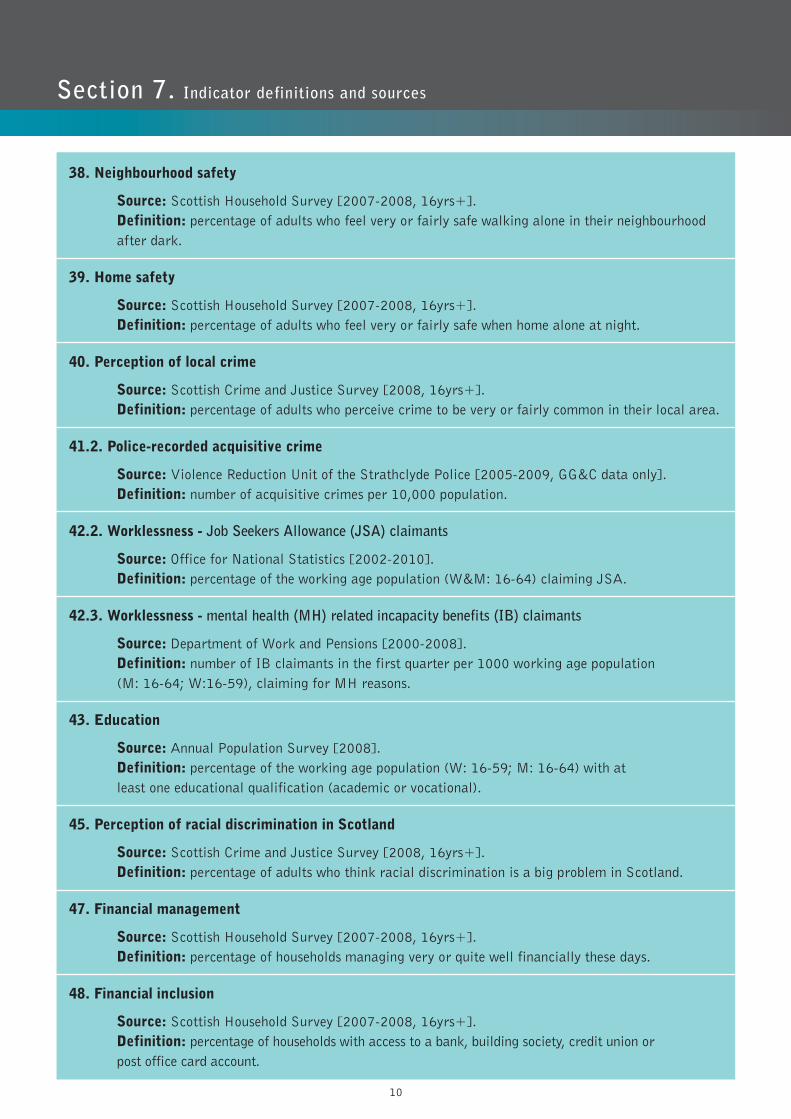
38. Neighbourhood safety
Source: Scottish Household Survey [2007-2008, 16yrs+]. Definition: percentage of adults who feel very or fairly safe walking alone in their neighbourhood after dark.
39. Home safety
Source: Scottish Household Survey [2007-2008, 16yrs+]. Definition: percentage of adults who feel very or fairly safe when home alone at night.
40. Perception of local crime
Source: Scottish Crime and Justice Survey [2008, 16yrs+]. Definition: percentage of adults who perceive crime to be very or fairly common in their local area.
41.2. Police-recorded acquisitive crime
Source: Violence Reduction Unit of the Strathclyde Police [2005-2009, GG&C data only].Definition: number of acquisitive crimes per 10,000 population.
42.2. Worklessness - Job Seekers Allowance (JSA) claimants
Source: Office for National Statistics [2002-2010]. Definition: percentage of the working age population (W&M: 16-64) claiming JSA.
42.3. Worklessness - mental health (MH) related incapacity benefits (IB) claimants
Source: Department of Work and Pensions [2000-2008]. Definition: number of IB claimants in the first quarter per 1000 working age population (M: 16-64; W:16-59), claiming for MH reasons.
43. Education
Source: Annual Population Survey [2008]. Definition: percentage of the working age population (W: 16-59; M: 16-64) with at least one educational qualification (academic or vocational).
45. Perception of racial discrimination in Scotland
Source: Scottish Crime and Justice Survey [2008, 16yrs+]. Definition: percentage of adults who think racial discrimination is a big problem in Scotland.
47. Financial management
Source: Scottish Household Survey [2007-2008, 16yrs+]. Definition: percentage of households managing very or quite well financially these days.
48. Financial inclusion
Source: Scottish Household Survey [2007-2008, 16yrs+]. Definition: percentage of households with access to a bank, building society, credit union or post office card account.
Section 7. Indicator definitions and sources
10
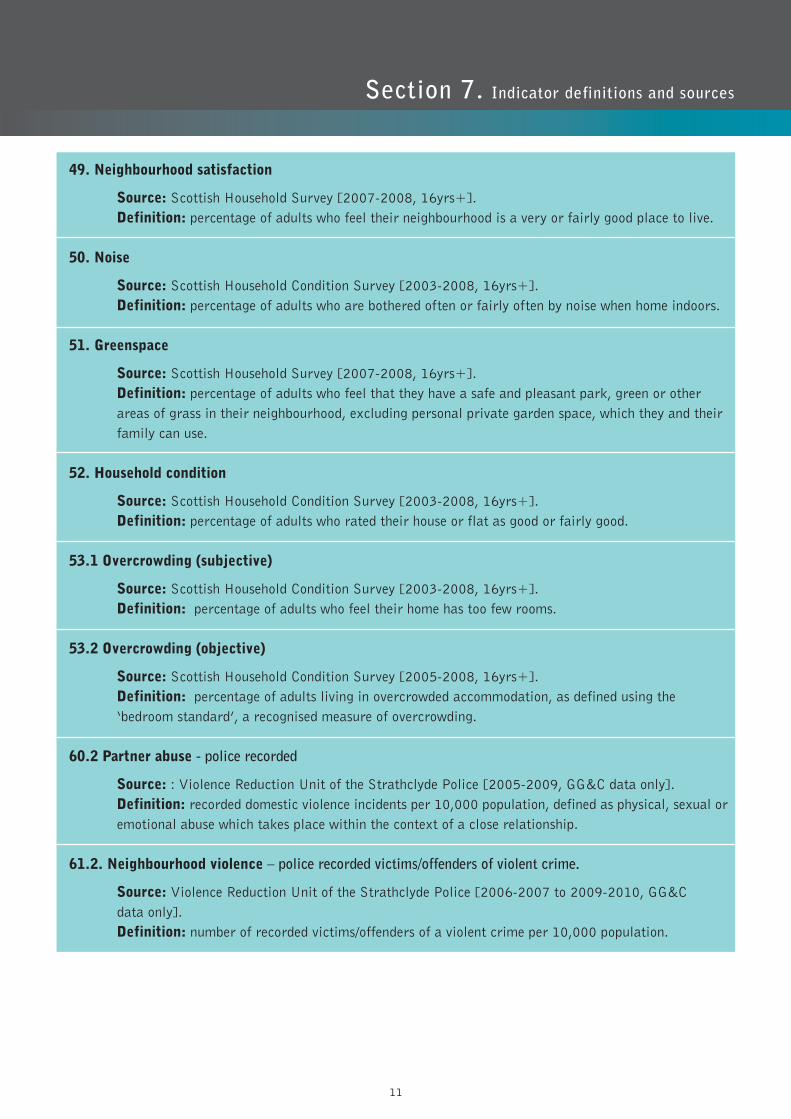
49. Neighbourhood satisfaction
Source: Scottish Household Survey [2007-2008, 16yrs+]. Definition: percentage of adults who feel their neighbourhood is a very or fairly good place to live.
50. Noise
Source: Scottish Household Condition Survey [2003-2008, 16yrs+]. Definition: percentage of adults who are bothered often or fairly often by noise when home indoors.
51. Greenspace
Source: Scottish Household Survey [2007-2008, 16yrs+]. Definition: percentage of adults who feel that they have a safe and pleasant park, green or other areas of grass in their neighbourhood, excluding personal private garden space, which they and their family can use.
52. Household condition
Source: Scottish Household Condition Survey [2003-2008, 16yrs+]. Definition: percentage of adults who rated their house or flat as good or fairly good.
53.1 Overcrowding (subjective)
Source: Scottish Household Condition Survey [2003-2008, 16yrs+]. Definition: percentage of adults who feel their home has too few rooms.
53.2 Overcrowding (objective)
Source: Scottish Household Condition Survey [2005-2008, 16yrs+]. Definition: percentage of adults living in overcrowded accommodation, as defined using the ‘bedroom standard’, a recognised measure of overcrowding.
60.2 Partner abuse - police recorded
Source: : Violence Reduction Unit of the Strathclyde Police [2005-2009, GG&C data only]. Definition: recorded domestic violence incidents per 10,000 population, defined as physical, sexual oremotional abuse which takes place within the context of a close relationship.
61.2. Neighbourhood violence – police recorded victims/offenders of violent crime.
Source: Violence Reduction Unit of the Strathclyde Police [2006-2007 to 2009-2010, GG&C data only]. Definition: number of recorded victims/offenders of a violent crime per 10,000 population.
Section 3.
Section 7. Indicator definitions and sources
11

A profile of mental health and wellbeing in Greater Glasgow & ClydeMental Health in Focus:
Glasgow Centre for Population Health 1st Floor, House 694 Elmbank Street Glasgow G2 4DL
Tel: 0141 287 6959Email: [email protected]/mentalhealthprofiles