inverse estimation of local slamming loads on a jacket
TRANSCRIPT

Ying Tu1
Department of Civil and
Environmental Engineering,
Norwegian University of Science
and Technology,
Trondheim 7491, Norway
e-mail: [email protected]
Thorvald C. GrindstadKongsberg Digital AS,
Trondheim 7040, Norway
Michael MuskulusDepartment of Civil and Environmental
Engineering,
Norwegian University of Science
and Technology,
Trondheim 7491, Norway
Inverse Estimation of LocalSlamming Loads on a JacketStructureSlamming loads from plunging breaking waves feature a high impulsive force and a veryshort duration. It is difficult to measure these loads directly in experiments due to thedynamics of the structures. In this study, inverse approaches are investigated to estimatethe local slamming loads on a jacket structure using hammer test and wave test data froma model scale experiment. First, a state-of-the-art approach is considered. It uses twodeconvolution techniques to first determine the impulse response functions and then toreconstruct the wave impact forces. Second, an easier applicable approach is proposed.It uses linear regression with the ordinary least square technique for the force estimation.The results calculated with these two approaches are highly identical. The linear regres-sion approach can be extended to account for the loads transferred among different loca-tions. This leads to lower and theoretically more accurate estimation of the loadscompared to the previous two approaches. For the investigated case, the total impulsedue to the wave is 22% lower. The estimated forces by the extended approach have aresolution at the millisecond level, which provides detailed information on the shape ofthe forces. The approach is an important tool for statistical investigations into the localslamming forces, and further on for the development of a reliable engineering model ofthe forces. [DOI: 10.1115/1.4037175]
1 Introduction
The offshore support structures used in the wind industry areexposed to plunging breaking waves at some sites, which leads toslamming loads [1,2]. Slamming loads feature a relatively smalldissipating area, a very high local pressure, a high impulsive load,and a very short duration. Slamming loads have been identified,for example, for a 2 MW wind turbine mounted on a monopile atthe Blyth wind farm off the coast of UK based on on-site measure-ment data [3]. Slamming loads can affect the performance andfatigue life of the substructures for offshore wind turbines, such asmonopiles and jackets. These loads should be considered in thedesign of offshore wind turbines, if the site is likely to be exposedto plunging breaking waves, as recommended by various stand-ards and guidelines [4–6].
Theoretical analyses, numerical simulations, small-scale modeltests, and full-scale field measurements are usually used to estimatethe slamming loads. Theoretical analyses are based on the vonKarman or Wagner theory [7,8]. Numerical simulations commonlyuse computational fluid dynamics [1,9]. However, due to thestrong nonlinearities of breaking waves, it is difficult to estimateslamming loads accurately by using theoretical analyses only.Computational fluid dynamics simulations can predict slammingloads, but this is still difficult and very time consuming, since itinvolves complex two-phase flow and fluid–structure interactionproblems, and requires a very small time step to accurately resolvethe impact peaks that occur in a very short period of time.
Model tests and field measurements are more accurateapproaches to predict slamming loads. To date, several modeltests of slamming loads on vertical or inclined slender cylindricalstructures have been conducted [10–12]. An on-site measurementwith respect to slamming loads has also been performed for amonopile wind turbine at the Blyth wind farm [3]. These experi-mental studies were performed with cylindrical structures, which
can be useful for the design of monopiles. Truss structures, suchas jackets, are also a promising support structure concept for off-shore wind turbines, especially in intermediate water. Because ofthe presence of several legs and braces, the waves approachingthe hind legs and braces are affected by the presence of the frontones. This results in a more complicated slamming scenario thanthat of the monopiles. Nevertheless, investigations into the slam-ming forces on jacket structures are still limited in number todate. The WaveSlam project2 was initiated to bridge this knowl-edge gap. Using a 1:8 model of a jacket structure, the project isthe first experimental study at this scale and for this kind of struc-tures. This study is based on the experimental data from thisproject.
Given the raw experimental or field measurement data, it is stilla challenge to obtain the slamming forces from them. In the experi-ments or field measurements, the slamming forces were not meas-ured directly. Instead, they usually have to be estimated from theresponse forces measured at the structure. In addition, the waveslam typically happens at a millisecond time span, which increasesthe difficulty to inversely estimate the slamming loads. For verticaland inclined piles, Choi et al. [13] treated the measured force as acombination of the net slamming force and a force which is theamplified component due to the structure’s vibration. A low-passfilter and empirical mode decomposition were employed to removethe dynamic amplification due to the structure’s vibration in orderto estimate the slamming forces. However, this approach did nottake the geometry of the structure into consideration. For a simplestructure such as a pile, the empirical mode decomposition methodmight be applicable, and we should be cautious when applying it tocomplex structures such as jackets.
The inverse estimation of slamming loads on jacket structurescan be conducted using various methods. Rausa et al. [14] studiedthe breaking wave forces acting on the front braces of the Wave-Slam jacket. The slamming loads were assumed to be uniformloads with a triangular force time history acting along the bracesin a finite element model. The results from the finite elementmodel were matched by the experimental data to obtain the peak
1Corresponding author.Contributed by the Ocean, Offshore, and Arctic Engineering Division of ASME
for publication in the JOURNAL OF OFFSHORE MECHANICS AND ARCTIC ENGINEERING.Manuscript received March 17, 2017; final manuscript received June 22, 2017;published online August 8, 2017. Assoc. Editor: Xi-Ying Zhang. 2http://hydralab.eu/research–results/ta-projects/project/19/; December 2016.
Journal of Offshore Mechanics and Arctic Engineering DECEMBER 2017, Vol. 139 / 061601-1Copyright VC 2017 by ASME
Downloaded From: https://offshoremechanics.asmedigitalcollection.asme.org/ on 08/25/2017 Terms of Use: http://www.asme.org/about-asme/terms-of-use

forces. Tu et al. [15] estimated the local slamming loads on thebraces by using an optimization-based deconvolution method,which used the linearity of the structure. Both studies found outthat the waves did not impact everywhere along the braces at thesame time. There were four investigated locations on the two frontbraces considered in these studies. The response force at one loca-tion was not only caused by the wave impact at the same location,but also by the impacts from other locations. Therefore, the loadstransferred among the locations were considered. However, themethods used in these studies are only able to calculate the peakforces based on further assumptions (e.g., triangular force timehistory model) or the impulses of the loads. The time series of theforces, which are necessary for a detailed force analysis, were notresolved. Therefore, more advanced methods are still required toobtain the force time series.
A state-of-the-art approach for this problem is to first find outthe relationship between the input force and the output responseof the structure. For a linear system, the relationship is usuallyrepresented by an impulse response function. Then, this relation-ship is used together with the measured response to reconstructthe target input force. This approach is first introduced in thisstudy. Then, an easier applicable approach based on linear regres-sion is proposed, the results of which are compared with those ofthe state-of-the-art approach. The linear regression approach isthen further extended for more accurate estimation of the forces,considering the loads transferred among different locations on thebraces. The same model-scale data set from the WaveSlam projectare used for testing these three approaches that are proposed fromdifferent perspectives.
The article starts with an introduction of the used experimentaldata. Then, three approaches are proposed to estimate the slam-ming forces. The results calculated from the approaches areshown and compared. Some aspects regarding the method uncer-tainties are also discussed.
2 Experiment and Data
The WaveSlam project was conducted by a consortium headedby the University of Stavanger (UiS) and the Norwegian Univer-sity of Science and Technology (NTNU) in 2012–2013. Theexperiment was run in 2013 in the Large Wave Flume at CoastalResearch Centre (Forschungszentrum K€uste, FZK, Hannover,Germany). The jacket structure is similar to the one designed byReinertsen Engineering for the Thornton bank wind farm [16],and the model is 1:8 scale. Detailed information about the experi-ment can be found in the data storage report [17].
The setup of the experiment is illustrated in Fig. 1. The waveflume is approximately 300 m long, 5 m wide, and 7 m deep. Thewaves were generated by the wave board at one end of the flume,went over a slope, and then reached the jacket on a platform. Dur-ing the wave test, the water depth at the jacket ranged from 1.8 mto 2.0 m to simulate a water depth of approximately 16 m. Thelegs and braces of the jacket were 0.14 m in diameter.
A global coordinate system is defined as following: the origin ispositioned at the middle position of the wave board (x¼ 0), at thebottom of the channel (z¼ 0), and at the south side of the flume,namely the right side when following the flow (y¼ 0). The x-axisis positive in the wave direction. The z-axis is positive upward.The y-axis forms a right hand system with the other axes.
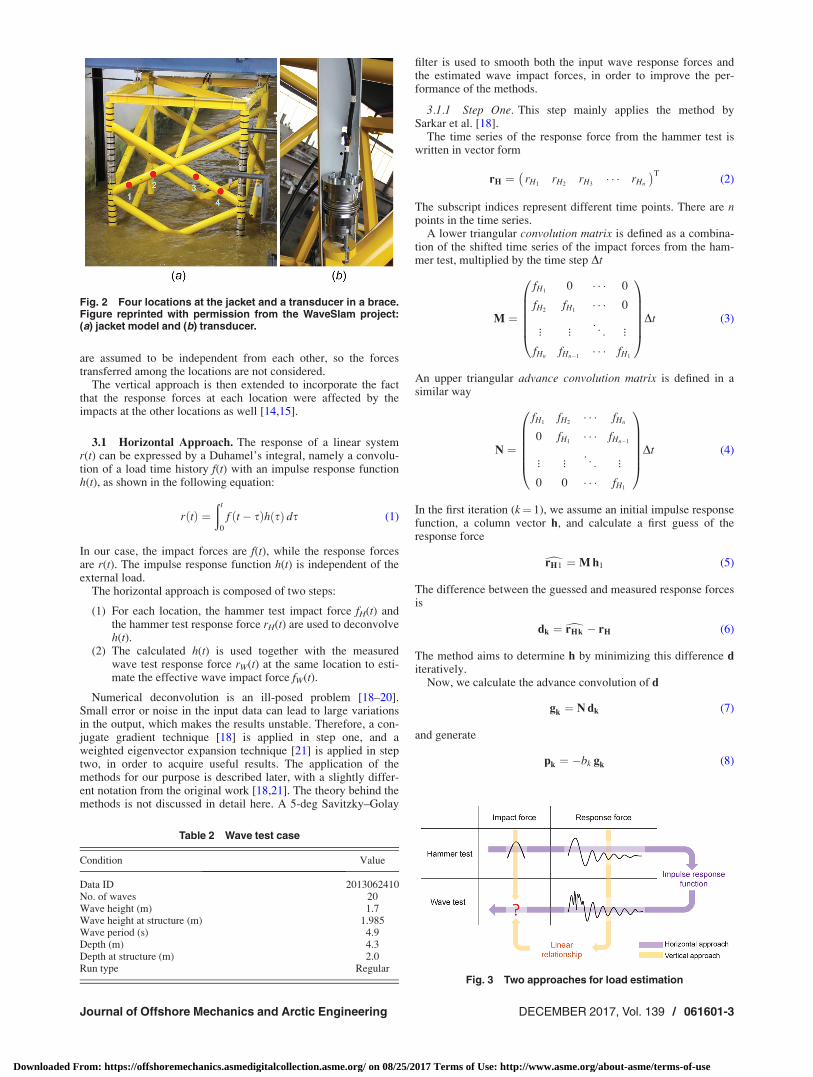
Four locations at the front braces of the jacket model, which areexposed to the plunging breakers during the wave test, are investi-gated in this study. The locations are defined in Table 1 and illus-trated in Fig. 2(a). Four local force transducers (see Fig. 2(b))were installed in the braces at these locations and are named aftertheir locations, respectively. The sampling frequency of the trans-ducers is 10 kHz. The measurements of the transducers used inthis study are in the global x-direction, namely the wave direction.
The experimental data from a hammer test and from a wave testare both used for investigation. In both tests, the local forces weremeasured by the transducers.
In the hammer test, the jacket model was located in 2 m deepwater as in the investigated wave test case. The hammer hit eachof the four locations twice in the wave direction (global x-direction),thus leading to four test cases with two subcases in each of them.The hammer test cases are numbered according to the impactlocations, and the subcases according to the impact order. Forexample, hammer case 1.2 corresponds to the second hammerimpact at location 1. In addition to the local forces measured bythe four transducers mentioned previously, the forces exerted bythe hammer to the structure were recorded by a system in thehammer with a sampling frequency of 9600 Hz.
The properties of the investigated wave case are shown in Table2. The values given here are all in model-scale. The 16th wave inthis case is used to demonstrate the methods in this study. It is oneof the waves neither at the beginning nor at the end of the test runand has good data quality.
3 Methods
In the hammer test, the impact forces exerted by the hammerand the local response forces at the four locations were recorded.From the wave test, the local response forces at the same locationswere also measured. Now, the problem is to estimate the impactforces exerted by the breaking waves on the braces, namely toestimate the local slamming forces using these available data.
Due to the limitation of the experimental data, four assumptionsare made in order to solve the problem:
(1) The jacket model has the same properties in the hammertest and in the wave test. The eigenfrequencies of the struc-ture do not change due to the existence of the waves.
(2) The wave forces on the braces occur only on the four inves-tigated locations. The real wave impact forces along thewhole braces are represented by effective impact forces atthese locations. In this study, the effective forces are esti-mated instead of the real impact forces.
(3) The loads transferred from other parts of the structure (out-side of the investigated braces) are neglected.
(4) The reconstructed impact forces are in the wave direction.
These assumptions may lead to some uncertainties in theresults. These uncertainties will be discussed in Sec. 4.5.
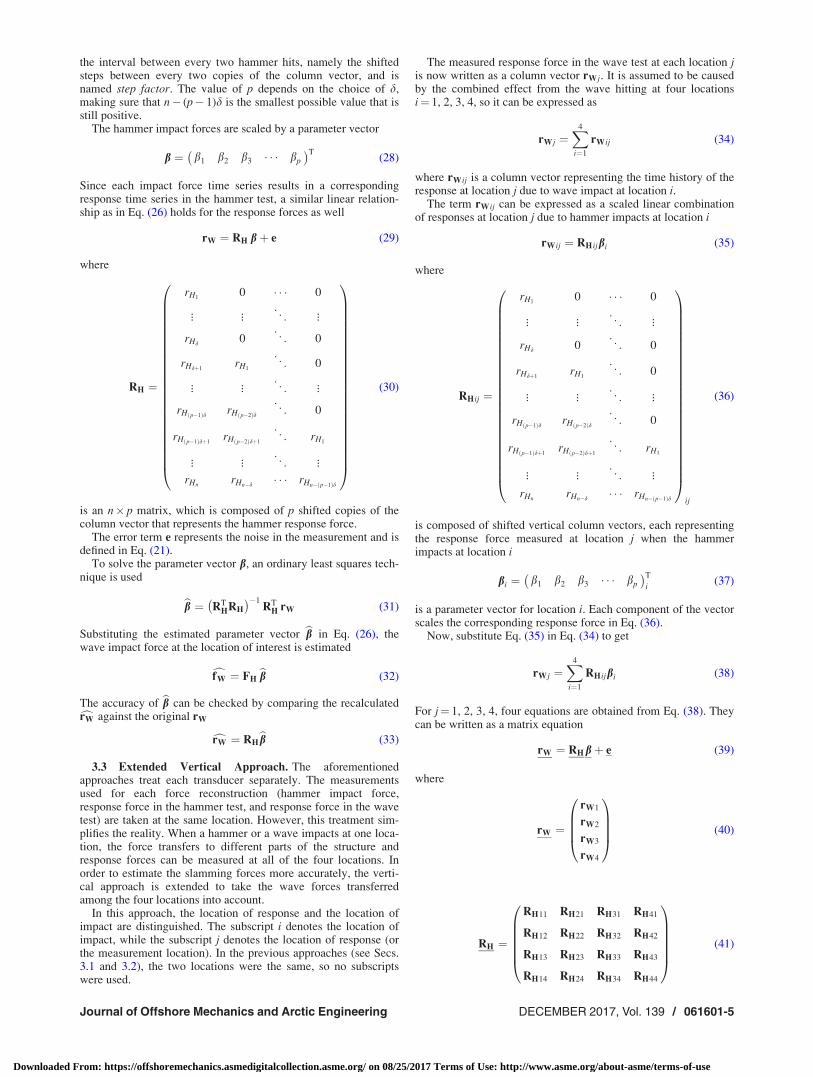
Since the braces of the jacket model exhibits a linear behavioras shown in a previous study [15], two linear approaches are firstproposed to estimate the wave impact forces. The approaches areillustrated in Fig. 3. In the “horizontal approach,” the data sets areused horizontally in pairs. In the “vertical approach,” the data setsare used vertically in pairs. In both approaches, the transducers
Fig. 1 Experimental setup and global coordinates
Table 1 Definition of the investigated locations in the globalcoordinates
Location x (m) y (m) z (m)
1 198.37 3.310 5.2512 198.37 2.888 5.4723 198.37 2.172 5.4724 198.37 1.750 5.251
061601-2 / Vol. 139, DECEMBER 2017 Transactions of the ASME
Downloaded From: https://offshoremechanics.asmedigitalcollection.asme.org/ on 08/25/2017 Terms of Use: http://www.asme.org/about-asme/terms-of-use
are assumed to be independent from each other, so the forcestransferred among the locations are not considered.
The vertical approach is then extended to incorporate the factthat the response forces at each location were affected by theimpacts at the other locations as well [14,15].
3.1 Horizontal Approach. The response of a linear systemr(t) can be expressed by a Duhamel’s integral, namely a convolu-tion of a load time history f(t) with an impulse response functionh(t), as shown in the following equation:
r tð Þ ¼ðt
0
f t� sð Þh sð Þ ds (1)
In our case, the impact forces are f(t), while the response forcesare r(t). The impulse response function h(t) is independent of theexternal load.
The horizontal approach is composed of two steps:
(1) For each location, the hammer test impact force fH(t) andthe hammer test response force rH(t) are used to deconvolveh(t).
(2) The calculated h(t) is used together with the measuredwave test response force rW(t) at the same location to esti-mate the effective wave impact force fW(t).
Numerical deconvolution is an ill-posed problem [18–20].Small error or noise in the input data can lead to large variationsin the output, which makes the results unstable. Therefore, a con-jugate gradient technique [18] is applied in step one, and aweighted eigenvector expansion technique [21] is applied in steptwo, in order to acquire useful results. The application of themethods for our purpose is described later, with a slightly differ-ent notation from the original work [18,21]. The theory behind themethods is not discussed in detail here. A 5-deg Savitzky–Golay
filter is used to smooth both the input wave response forces andthe estimated wave impact forces, in order to improve the per-formance of the methods.
3.1.1 Step One. This step mainly applies the method bySarkar et al. [18].
The time series of the response force from the hammer test iswritten in vector form
rH ¼ rH1rH2
rH3� � � rHn
� �T(2)
The subscript indices represent different time points. There are npoints in the time series.
A lower triangular convolution matrix is defined as a combina-tion of the shifted time series of the impact forces from the ham-mer test, multiplied by the time step Dt
M ¼
fH10 � � � 0
fH2fH1
� � � 0
� � . ..
�
fHnfHn�1
� � � fH1
0BBBBB@
1CCCCCADt (3)
An upper triangular advance convolution matrix is defined in asimilar way
N ¼
fH1fH2
� � � fHn
0 fH1� � � fHn�1
� � . ..
�
0 0 � � � fH1
0BBBBB@
1CCCCCADt (4)
In the first iteration (k¼ 1), we assume an initial impulse responsefunction, a column vector h, and calculate a first guess of theresponse force
drH1 ¼M h1 (5)
The difference between the guessed and measured response forcesis
dk ¼drHk � rH (6)
The method aims to determine h by minimizing this difference diteratively.
Now, we calculate the advance convolution of d
gk ¼ N dk (7)
and generate
pk ¼ �bk gk (8)
Fig. 2 Four locations at the jacket and a transducer in a brace.Figure reprinted with permission from the WaveSlam project:(a) jacket model and (b) transducer.
Table 2 Wave test case
Condition Value
Data ID 2013062410No. of waves 20Wave height (m) 1.7Wave height at structure (m) 1.985Wave period (s) 4.9Depth (m) 4.3Depth at structure (m) 2.0Run type Regular
Fig. 3 Two approaches for load estimation
Journal of Offshore Mechanics and Arctic Engineering DECEMBER 2017, Vol. 139 / 061601-3
Downloaded From: https://offshoremechanics.asmedigitalcollection.asme.org/ on 08/25/2017 Terms of Use: http://www.asme.org/about-asme/terms-of-use

where
bk ¼1
kgkk2
(9)
The norm of gk is defined as
kgkk ¼ffiffiffiffiffiffiffiffiffiffiffiffigk
Tgk
p(10)
Convolution of pk leads to
qk ¼M pk (11)
According to the conjugate gradient method, a new h and a new dare calculated for the next iteration
hkþ1 ¼ hk þ ak pk (12)
dkþ1 ¼ dk þ ak qk (13)
where
ak ¼1
kqkk2
(14)
Equations (7)–(14) are repeated in the next iterations, butEq. (8) is replaced by Eq. (15), and it is used after Eq. (14)
pkþ1 ¼ pk � bkþ1 N dkþ1 (15)
The iterations stop when the maximum of the absolute differencebetween the calculated and measured response forces is smallerthan a fraction of the maximum response force in the time series
maxfjdjg � a maxfrHg (16)
where a is defined as a stopping factor. By adjusting a, theimpulse response function can be estimated, while the influence ofthe noise is controlled.
3.1.2 Step Two. This step mainly applies the method byEkstrom and Rhoads [21].
For the wave case, Eq. (1) is written as
rW ¼ K fW þ e (17)
where the time series of the wave impact force in vector form is
fW ¼ fW1fW2
fW3� � � fWn
� �T(18)
the response force time series in vector form is
rW ¼ rW1rW2
rW3� � � rWn
� �T(19)
and a lower triangular kernel matrix is defined as
K ¼
h1 0 � � � 0
h2 h1 � � � 0
� � . ..
�
hn hn�1 � � � h1
0BBB@
1CCCADt (20)
and an error term due to the noise in the measurement is
e ¼ e1 e2 e3 � � � en
� �T(21)
We assume the errors to be randomly, independently distributedaround zero.
Transpose and flip the matrix K upside down
KT ¼
0 � � � 0 h1
0 � � � h1 h2
� ...
� �
h1 � � � hn�1 hn
0BBB@
1CCCADt (22)
The flipping operation is marked by an overline for the matrix inthe equation.
Then, the eigenvalues and eigenvectors of KT are calculated.The eigenvalues ki and the corresponding eigenvectors vi areordered as
k1 > k2 > � � � > kn (23)
The wave impact force at the location of interest is calculated as
cfW ¼Xn
i¼1
Wi1
kirT
Wvi vi (24)
where vi is flipped upside down from vi. Note that for this esti-mate, the error term e has been replaced by its (assumed) mean ofzero. A weighting scheme is used in Eq. (24) to discriminate theterms with lower absolute eigenvalues
Wi ¼jkijjkij þ e
(25)
as these terms would result in numerical instabilities. Here, e is anadjustable constant called weighting factor.
3.2 Vertical Approach. The vertical approach uses the linearregression (least square) technique. Similar to the horizontalapproach, it also reconstructs the wave impact force at each inves-tigated location, by using the hammer impact force, the hammerresponse force, and the wave response force at the same location.
For each investigated location, the wave impact force is imag-ined as a result of the hammer hitting this location with differentamplitudes many times in a row. Therefore, the wave impact forcecan be expressed as a linear combination of the hammer impactforces, in matrix notation
fW ¼ FH b (26)
where
FH ¼
fH10 � � � 0
� � . ..
�
fHd 0 . ..
0
fHdþ1fH1
. ..
0
� � . ..
�
fH p�1ð Þd fH p�2ð Þd. .
.0
fH p�1ð Þdþ1fH p�2ð Þdþ1
. ..
fH1
� � . ..
�
fHnfHn�d � � � fHn� p�1ð Þd
0BBBBBBBBBBBBBBBBBBBBBBBBBB@
1CCCCCCCCCCCCCCCCCCCCCCCCCCA
(27)
is an n� p matrix, which is composed of p shifted copies of thecolumn vector that represents the hammer impact force. The sym-bol p denotes the total number of imaginary hammer hits, namelythe number of copies of the column vector. The symbol d denotes
061601-4 / Vol. 139, DECEMBER 2017 Transactions of the ASME
Downloaded From: https://offshoremechanics.asmedigitalcollection.asme.org/ on 08/25/2017 Terms of Use: http://www.asme.org/about-asme/terms-of-use
the interval between every two hammer hits, namely the shiftedsteps between every two copies of the column vector, and isnamed step factor. The value of p depends on the choice of d,making sure that n� (p� 1)d is the smallest possible value that isstill positive.
The hammer impact forces are scaled by a parameter vector
b ¼ b1 b2 b3 � � � bp
� �T(28)
Since each impact force time series results in a correspondingresponse time series in the hammer test, a similar linear relation-ship as in Eq. (26) holds for the response forces as well
rW ¼ RH bþ e (29)
where
RH ¼
rH10 � � � 0
� � . ..
�
rHd 0 . ..
0
rHdþ1rH1
. ..
0
� � . ..
�
rH p�1ð Þd rH p�2ð Þd. .
.0
rH p�1ð Þdþ1rH p�2ð Þdþ1
. ..
rH1
� � . ..
�
rHnrHn�d � � � rHn� p�1ð Þd
0BBBBBBBBBBBBBBBBBBBBBBB@
1CCCCCCCCCCCCCCCCCCCCCCCA
(30)
is an n� p matrix, which is composed of p shifted copies of thecolumn vector that represents the hammer response force.
The error term e represents the noise in the measurement and isdefined in Eq. (21).
To solve the parameter vector b, an ordinary least squares tech-nique is used
bb ¼ RTHRH
� ��1RT
H rW (31)
Substituting the estimated parameter vector bb in Eq. (26), thewave impact force at the location of interest is estimated
cfW ¼ FHbb (32)
The accuracy of bb can be checked by comparing the recalculatedcrW against the original rW
crW ¼ RHbb (33)
3.3 Extended Vertical Approach. The aforementionedapproaches treat each transducer separately. The measurementsused for each force reconstruction (hammer impact force,response force in the hammer test, and response force in the wavetest) are taken at the same location. However, this treatment sim-plifies the reality. When a hammer or a wave impacts at one loca-tion, the force transfers to different parts of the structure andresponse forces can be measured at all of the four locations. Inorder to estimate the slamming forces more accurately, the verti-cal approach is extended to take the wave forces transferredamong the four locations into account.
In this approach, the location of response and the location ofimpact are distinguished. The subscript i denotes the location ofimpact, while the subscript j denotes the location of response (orthe measurement location). In the previous approaches (see Secs.3.1 and 3.2), the two locations were the same, so no subscriptswere used.
The measured response force in the wave test at each location jis now written as a column vector rWj. It is assumed to be causedby the combined effect from the wave hitting at four locationsi¼ 1, 2, 3, 4, so it can be expressed as
rWj ¼X4
i¼1
rWij (34)
where rWij is a column vector representing the time history of theresponse at location j due to wave impact at location i.
The term rWij can be expressed as a scaled linear combinationof responses at location j due to hammer impacts at location i
rWij ¼ RHijbi (35)
where
RHij ¼
rH10 � � � 0
� � . ..
�
rHd 0 . ..
0
rHdþ1rH1
. ..
0
� � . ..
�
rH p�1ð Þd rH p�2ð Þd. .
.0
rH p�1ð Þdþ1rH p�2ð Þdþ1
. ..
rH1
� � . ..
�
rHnrHn�d � � � rHn� p�1ð Þd
0BBBBBBBBBBBBBBBBBBBBBBBB@
1CCCCCCCCCCCCCCCCCCCCCCCCA
ij
(36)
is composed of shifted vertical column vectors, each representingthe response force measured at location j when the hammerimpacts at location i
bi ¼ b1 b2 b3 � � � bp
� �T
i(37)
is a parameter vector for location i. Each component of the vectorscales the corresponding response force in Eq. (36).
Now, substitute Eq. (35) in Eq. (34) to get
rWj ¼X4
i¼1
RHijbi (38)
For j¼ 1, 2, 3, 4, four equations are obtained from Eq. (38). Theycan be written as a matrix equation
rW ¼ RHbþ e (39)
where
rW ¼
rW1
rW2
rW3
rW4
0BBB@
1CCCA (40)
RH ¼
RH11 RH21 RH31 RH41
RH12 RH22 RH32 RH42
RH13 RH23 RH33 RH43
RH14 RH24 RH34 RH44
0BBBBB@
1CCCCCA (41)
Journal of Offshore Mechanics and Arctic Engineering DECEMBER 2017, Vol. 139 / 061601-5
Downloaded From: https://offshoremechanics.asmedigitalcollection.asme.org/ on 08/25/2017 Terms of Use: http://www.asme.org/about-asme/terms-of-use

b ¼
b1
b2
b3
b4
0BBBB@
1CCCCA (42)
The term e is added to represent the error that exists in the experi-mental data. It can be written as
e ¼
e1
e2
e3
e4
0BB@
1CCA (43)
where each component is an error vector for the respective mea-surement location j and can be expressed as Eq. (21).
The parameter vector b can be estimated by using least squareregression
bb ¼ RHTRH
� ��1
RHT rW (44)
and the parameter vectors for the four locations, bb i (i¼ 1, 2, 3, 4),are therefore obtained as the components of bb.
The wave impact force at each location can then be estimatedby
cfW i ¼ FHibbi (45)
where
FHi ¼
fH10 � � � 0
� � . ..
�
fHd 0 . ..
0
fHdþ1fH1
. ..
0
� � . ..
�
fH p�1ð Þd fH p�2ð Þd. .
.0
fH p�1ð Þdþ1fH p�2ð Þdþ1
. ..
fH1
� � . ..
�
fHnfHn�d � � � fHn� p�1ð Þd
0BBBBBBBBBBBBBBBBBBBBBBBBBB@
1CCCCCCCCCCCCCCCCCCCCCCCCCCA
i
(46)
is composed of shifted vertical column vectors, each representingthe impact force time series, when the hammer hits location i.
To check the accuracy of the parameter, vectors bbi; crW j can becalculated as in Eq. (47) and compared to the original rWj
crW j ¼X4
i¼1
RHijbb i (47)
4 Results and Discussion
In this section, the application of the approaches is demon-strated with experimental data. The results from the proposedapproaches are illustrated and compared. The uncertainties of theresults are discussed.
The measured response forces from the wave test originallyinclude both a quasi-static contribution and a slamming contribu-tion. Therefore, a polynomial fitting method is used to eliminatethe quasi-static part [15]. The resulting slamming part, as shownin Fig. 4, is used as an input to the approaches. The length of theinput and output time series is always 0.15 s, although the figures
later in this section use shorter time intervals for better graphicalillustration. Note that the response forces are not completelyaligned. Indeed, previous research found that the waves do not hitthe structure at exactly the same time in all locations [14]. Even ifthe wave board was generating ideal waves, the waves changeslightly when running over a long slope with friction involved,and differences among response forces are therefore expected.
4.1 Results From Horizontal Approach. At the first step,the impulse response functions are estimated from the hammertest data. As an example, Fig. 5 illustrates the input hammerimpact force f(t), the response force r(t), and the estimatedimpulse response function h(t) using hammer test case 1.1. UsingEq. (1), f(t) and the estimated h(t) are convolved to get theresponse force again. The recalculated rcal(t) demonstrates a per-fect match with the original r(t), which means h(t) is reliablyestimated.
The choice of the stopping factor a is important in the estima-tion of h(t). As shown in Fig. 6, a smaller a resolves more fluctua-tions in h(t), because more noise and errors from the input signalare included. A larger a, however, leads to a poor match of rcal(t)and r(t), which means less accuracy in h(t). For a¼ 0.5, the firstpeak of rcal(t) is 27% lower than that of r(t), while the differenceis only 0.44% for a¼ 0.05 and 4.2% for a¼ 0.1.
For our hammer test cases, a is selected between 0.05 and 0.1,according to the level of noise in the input data, to achieve a rea-sonable estimation of h(t).
For all hammer test cases, the impulse response functions h(t)are estimated. The h(t) for each location is calculated as an aver-age of two subcases at the same location, as shown in Fig. 7.
Fig. 4 Input wave response forces
Fig. 5 Input and output time series for hammer case 1.1
061601-6 / Vol. 139, DECEMBER 2017 Transactions of the ASME
Downloaded From: https://offshoremechanics.asmedigitalcollection.asme.org/ on 08/25/2017 Terms of Use: http://www.asme.org/about-asme/terms-of-use

Fig. 6 Estimated impulse response function (left) and originaland calculated responses (right) using different stopping fac-tors. Exemplary result using hammer test case 1.1: (a) a 5 0.05,(b) a 5 0.1, and (c) a 5 0.5.
Fig. 7 Estimated impulse response functions at the four locations: (a) location 1, (b) location2, (c) location 3, and (d) location 4
Fig. 8 Estimated impact force (left) and original and calculatedresponses (right) using different weighting factors. Exemplaryresult using hammer test case 1.1 and wave test response forceat location 1: (a) e 5 0.001, (b) e 5 0.01, and (c) e 5 0.1.
Journal of Offshore Mechanics and Arctic Engineering DECEMBER 2017, Vol. 139 / 061601-7
Downloaded From: https://offshoremechanics.asmedigitalcollection.asme.org/ on 08/25/2017 Terms of Use: http://www.asme.org/about-asme/terms-of-use

At the second step, the estimated impulse response functionsh(t) are used together with the wave response forces from Fig. 4 tocalculate the wave impact forces. The choice of the weighting fac-tor e is crucial for this step. In order to illustrate the effect of theweighting factor, the hammer test case 1.1 is used again. Thistime, h(t) and r(t) are knowns, and f(t) is calculated using differente. Then, the recalculated rcal(t) is again compared to the originalr(t). As shown in Fig. 8, a too large e leads to underestimation ofthe f(t) and a poor match of rcal(t) and r(t). For e¼ 0.1, the peak ofrcal(t) is 11% lower than that of r(t), while the difference is only0.16% for e¼ 0.001 and 1.3% for e¼ 0.01. A too small e, on theother hand, leads to a higher risk of numerical instability. For ourwave case, e¼ 0.001 is selected to ensure sufficient accuracy ofthe estimation while suppressing the numerical instability.
The estimated wave impact forces at the four locations usingthe horizontal approach are shown in Fig. 9. Slight instability stillexists at the beginning and at the end (not shown in the figure) ofthe time series, but it has no significant effect on the result of ourinterest. The relatively large fluctuations in the estimated forcearound 0.06–0.1 s for location 4 are most probably due to numeri-cal issues. As discussed previously, the value of the weighting fac-tor e was chosen to estimate the peak force well, not the forceswhere the signal level is much lower. Larger values of e reducethe fluctuations in this part of the signal (not shown).
4.2 Results From Vertical Approach. For each location, theaveraged impact forces and the averaged response forces from thesubcases in the same hammer test case are used together with theresponse forces from the wave test to resolve the wave impactforces.
The choice of the step factor d influences the accuracy of theresult, as shown in Fig. 10. If d is too large, the calculatedresponse force does not match the response force from the wavetest very well, and the estimated wave impact force has a lowerresolution. Using d¼ 5, which seems to provide sufficient accu-racy, the wave impact forces are calculated with the verticalapproach and illustrated in Fig. 11.
4.3 Comparison of the Results From Horizontal and Verti-cal Approaches. The results from the horizontal approach andthe vertical approach are compared with each other in this section.The wave impact force time series are first plotted, as shown inFig. 12. From the figures, the estimated time series are in accord-ance with each other in general.
The peak forces (maximum forces in the time series) are com-pared in Table 3. The differences are calculated using the horizon-tal approach as a reference. The differences between the peakforces from the two approaches are small. The maximum differ-ence 3.03% appears at location 4.
The impact forces are then integrated over the time intervalfrom 0.001 s to 0.1 s, to calculate the impulses. The length of theinterval is selected to sufficiently cover the impact process whileavoiding the numerically instable regions. The calculatedimpulses from the two approaches are compared in Table 4. Thedifferences are again calculated using the horizontal approach as areference. Similarly, the differences between the impulses fromthe two approaches are small. The maximum difference 0.55%appears at location 1.
According to the comparisons mentioned previously, the resultsfrom the two approaches are highly consistent with each other.This enhances the confidence in the results. The horizontal
Fig. 9 Estimated wave impact forces from horizontal approach
Fig. 10 Original and calculated responses for wave test (left)and estimated wave impact force (right) using different step fac-tors: (a) d 5 2, (b) d 5 5, and (c) d 5 15
Fig. 11 Estimated wave impact forces from vertical approach
061601-8 / Vol. 139, DECEMBER 2017 Transactions of the ASME
Downloaded From: https://offshoremechanics.asmedigitalcollection.asme.org/ on 08/25/2017 Terms of Use: http://www.asme.org/about-asme/terms-of-use

approach is state of the art and able to resolve impulse responsefunctions. However, it involves two steps and two adjustable fac-tors. The vertical approach, in contrast, involves only one adjusta-ble factor. So it is relatively easier to use.
4.4 Results From Extended Vertical Approach. Now thatwe compared the results from the horizontal and verticalapproaches, and confirmed that the results are reasonable, the ver-tical approach can be readily extended, as explained in Sec. 3.3, totake the loads transferred among the four locations into account.
A similar parameter check as for the vertical approach is con-ducted, and the same value of the step factor, d¼ 5, is used.
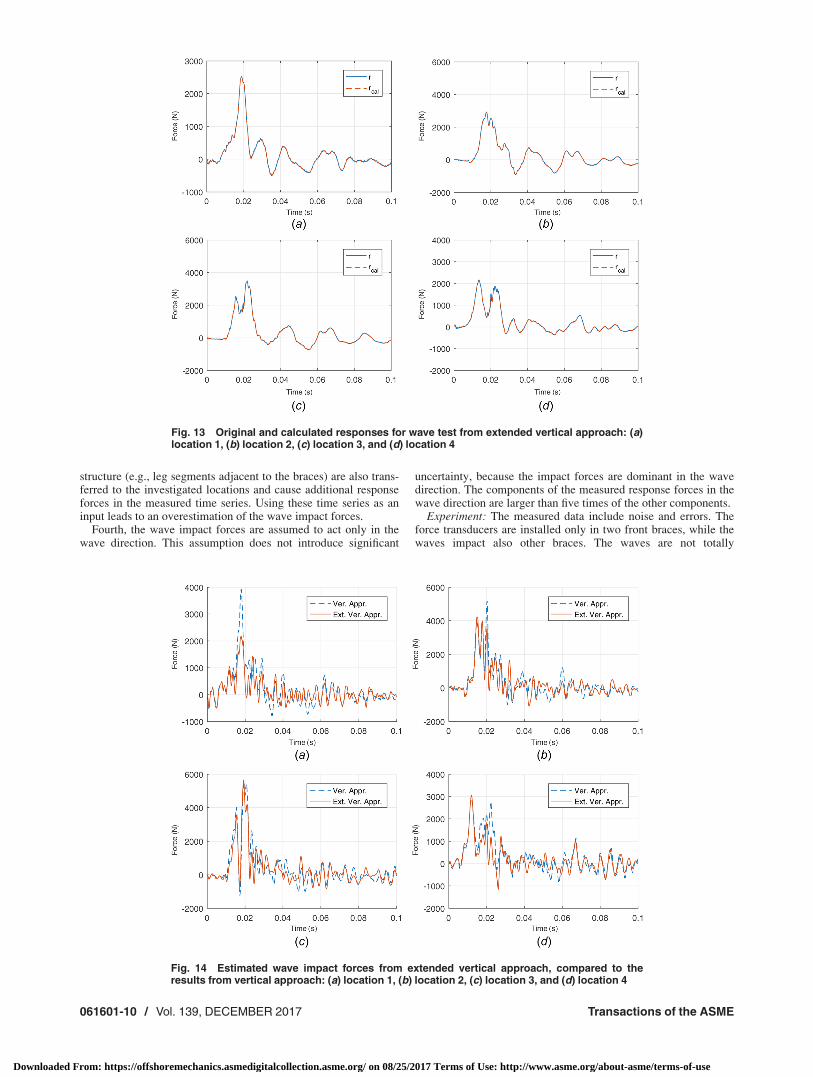
The calculated response forces are compared with the originalones in Fig. 13. The force time series at the four locations allmatch quite well, which ensures the accuracy of the estimatedparameter vectors.
Using the same parameter vectors, the wave impact forces werecalculated and are shown in Fig. 14. Compared to the results ofthe vertical approach, the forces reconstructed by using theextended vertical approach exhibit a similar trend in time, but thevalues are different.
The peak forces and impulses from the vertical approach andthe extended vertical approach are compared in Fig. 15. The val-ues estimated by the extended vertical approach are in generallower than the ones estimated by the vertical approach, except atlocations 3 and 4, where the peak forces estimated by theextended vertical approach are slightly higher. The total impulseexerted by the wave is estimated 22% lower by using the extended
approach. This difference is reasonable, because in the verticalapproach, the wave response forces due to the impacts at fourlocations are used as if they are due to the impacts at one location.The wave impact forces are therefore somewhat overestimated.The extended vertical approach, however, eliminates the doublecounting effect, so the result from it should be more reliable.
4.5 Uncertainties. Despite the seemly promising results,some uncertainties should be taken into consideration in the appli-cation of the approaches. They are mainly related to the followingaspects:
Assumptions: At the beginning of Sec. 3, four assumptions weregiven as the basis of the proposed approaches. First, the eigenfre-quencies of the structure are assumed not to change due to theexistence of the waves. In fact, no significant changes of theeigenfrequencies due to the waves are observed from the experi-mental data. The first peaks in the spectra of the response forcesmeasured in the hammer test and in the wave test seem to belocated at the same frequencies. So the uncertainty introduced bythe first assumption is negligible.
Second, the wave forces on the braces are assumed to act onlyon the four investigated locations. This assumption leads to alower resolution of the wave impact forces, since the forces areonly resolved at four locations instead of the whole braces.
Third, the wave loads transferred from other parts of the struc-ture, which are outside of the investigated braces, are assumed tobe negligible. This assumption is an important contributor to theresult uncertainties, since the wave loads at other parts of the
Fig. 12 Comparison of wave impact forces between horizontal and vertical approaches: (a)location 1, (b) location 2, (c) location 3, and (d) location 4
Table 3 Peak force comparison between horizontal and verti-cal approaches
Loc. 1 Loc. 2 Loc. 3 Loc. 4
Hor. appr. (N) 3917 5177 5563 2976Ver. appr. (N) 3930 5177 5558 2885Diff. 0.32% 0.00% �0.09% �3.03%
Table 4 Impulse comparison between horizontal and verticalapproaches
Loc. 1 Loc. 2 Loc. 3 Loc. 4
Hor. appr. (Ns) 19.70 29.35 37.12 28.23Ver. appr. (Ns) 19.60 29.46 37.03 28.29Diff. �0.55% 0.38% �0.25% 0.22%
Journal of Offshore Mechanics and Arctic Engineering DECEMBER 2017, Vol. 139 / 061601-9
Downloaded From: https://offshoremechanics.asmedigitalcollection.asme.org/ on 08/25/2017 Terms of Use: http://www.asme.org/about-asme/terms-of-use
structure (e.g., leg segments adjacent to the braces) are also trans-ferred to the investigated locations and cause additional responseforces in the measured time series. Using these time series as aninput leads to an overestimation of the wave impact forces.
Fourth, the wave impact forces are assumed to act only in thewave direction. This assumption does not introduce significant
uncertainty, because the impact forces are dominant in the wavedirection. The components of the measured response forces in thewave direction are larger than five times of the other components.
Experiment: The measured data include noise and errors. Theforce transducers are installed only in two front braces, while thewaves impact also other braces. The waves are not totally
Fig. 13 Original and calculated responses for wave test from extended vertical approach: (a)location 1, (b) location 2, (c) location 3, and (d) location 4
Fig. 14 Estimated wave impact forces from extended vertical approach, compared to theresults from vertical approach: (a) location 1, (b) location 2, (c) location 3, and (d) location 4
061601-10 / Vol. 139, DECEMBER 2017 Transactions of the ASME
Downloaded From: https://offshoremechanics.asmedigitalcollection.asme.org/ on 08/25/2017 Terms of Use: http://www.asme.org/about-asme/terms-of-use

absorbed at the end of the wave flume, so reflected waves mayinfluence the wave impacts somewhat in reality.
Data Processing: The measured data need to be calibrated andsmoothed. The choice of the starting points of the time seriesinvolves some subjective decisions. The resampling of the ham-mer impact forces due to the different sampling frequencies alsointroduces some minor errors. The method to eliminate the quasi-static contribution from the response forces in the wave test is notperfect.
Factor Selection: Three numerical factors (stopping factor a,weighting factor e and step factor d) are involved in the appliedapproaches. They are carefully tested and selected to achieve thebest performance of the methods. Nevertheless, the selection isstill partly subjective.
The uncertainties caused by the data processing and the factorselection can be minimized by using improved techniques. How-ever, the uncertainties caused by the assumptions and the experi-ment are due to the limitations of the experiment itself and hard todecrease. They should be carefully taken into account, when theestimated wave impact forces are used.
5 Conclusions
Three inverse approaches are presented to estimate the localslamming forces on a jacket structure from hammer test and wavetest data. The horizontal approach uses two state-of-the-art decon-volution techniques in two steps. The impulse response functionsare first determined using the impact forces and response forcesfrom the hammer test. Then, the functions are used together with
the response forces from the wave test to reconstruct the waveimpact forces. The vertical approach is based on linear regression.A linear relationship is set up between the response forces fromthe hammer test and from the wave test. The same relationship isapplied to the impact forces to get the result. This is conceptuallyeasier and numerically more stable.
To improve the accuracy, the data extracted from the two sub-cases at the same location in each hammer test case are averaged.The numerical factors in the methods are carefully tested andselected.
The estimated wave impact forces from the two approaches areconsistent with each other. The maximum difference of the peakforces is only 3.03%, and the maximum difference of the impulsesis 0.55%, considering the four investigated locations and theexemplary case. There is no significant overestimation or underes-timation from any of the approaches. By cross-checking the esti-mated wave impact forces, it is shown that both approachesfunction as expected and deliver results with high confidence,given suitable inputs.
The vertical approach was further extended to take the loadstransferred between the transducers into account. Compared to thevertical approach, the extended approach leads to lower and theo-retically more accurate estimation of the peak forces and impulsesin general. The total impulse due to the wave is estimated to be22% lower by the extended vertical approach than by the verticalapproach.
The uncertainties of the method arise from the assumptions, theexperimental limitations, the processing of the data, and the selec-tion of the numerical factors. The uncertainties related to the for-mer two aspects are difficult to reduce, so it is necessary toquantify them in future work.
Compared to the other methods used for slamming load estima-tion based on the WaveSlam data [14,15], the proposedapproaches can reconstruct the detailed time series of the localslamming forces rather than a single number, such as impulse orpeak force only. The information regarding the shape of the forcesin the millisecond time span is provided. The approaches are alldata driven, so no finite element models of the structure areneeded.
It is worth noticing that the vertical approach is more robustand easier to use compared to the standard horizontal approach.Furthermore, it has the possibility to be extended for more accu-rate estimation of the forces. In principle, using more transducerson the braces when applying the extended vertical approach canlead to higher spatial resolution of the wave impact forces. How-ever, this is usually limited by the experimental facilities in prac-tice. Data from the transducers on the legs might also be used toreduce the uncertainties of the approach, but this should be donerather carefully, because other uncertainties might be introduced.The extended vertical approach can also be combined with finiteelement analysis or structural-mode analysis to consider the cross-influence between the transducers more theoretically, especiallywhen the number of load transducers is limited. The verticalapproach can be adjusted and applied to total force reconstruction.The details of this will be presented elsewhere.
This study provides a useful tool for further statistical investiga-tions into the local slamming forces, and these investigations willbe fundamental for developing a reliable force model of the slam-ming loads on jacket structures. Since the focus of this study is toverify the approaches, the result from only one wave is shown. Inorder to understand the properties of the slamming forces better,statistical analysis for more waves under different conditions issuggested.
Acknowledgment
This work has been supported by the European Community’sSeventh Framework Programme.
Lars Einar Stieng and Zhengshun Cheng are gratefullyacknowledged for their precious suggestions to this study.
Fig. 15 Comparison of the results from vertical approach andextended vertical approach: (a) peak force and (b) impulse
Journal of Offshore Mechanics and Arctic Engineering DECEMBER 2017, Vol. 139 / 061601-11
Downloaded From: https://offshoremechanics.asmedigitalcollection.asme.org/ on 08/25/2017 Terms of Use: http://www.asme.org/about-asme/terms-of-use

Funding Data
� The integrating Activity HYDRALAB IV within the Trans-national Access Activities, Contract No. 261520.
� NOWITECH FME (Research Council of Norway, ContractNo. 193823).
References[1] Chella, M. A., Tørum, A., and Myrhaug, D., 2012, “An Overview of Wave
Impact Forces on Offshore Wind Turbine Substructures,” Energy Procedia, 20,pp. 217–226.
[2] Tu, Y., Cheng, Z., and Muskulus, M., 2017, “A Review of Slamming LoadApplication to Offshore Wind Turbines From an Integrated Perspective,”Energy Procedia, accepted.
[3] Hallowell, S., Myers, A. T., and Arwade, S. R., 2016, “Variability of BreakingWave Characteristics and Impact Loads on Offshore Wind Turbines Supportedby Monopiles,” Wind Energy, 19(2), pp. 301–312.
[4] IEC, 2009, “Wind Turbines—Part 3: Design Requirements for Offshore WindTurbines,” 1.0 ed., International Electrotechnical Commission, Geneva, Swit-zerland, Standard No. IEC 61400-3:2009.
[5] DNV, 2014, “Offshore Standard: Design of Offshore Wind Turbine Structures,”Det Norske Veritas, Akershus, Norway, Standard No. DNV-OS-J101.
[6] GL Renewables Certification, 2012, “Guideline for the Certification of OffshoreWind Turbines,” GL Renewables Certification, Hamburg, Germany.
[7] Faltinsen, O., 1993, Sea Loads on Ships and Offshore Structures, CambridgeUniversity Press, Cambridge, UK, Chap. 9.
[8] Ridley, J. A., 1982, “A Study of Some Theoretical Aspects of Slamming,”National Maritime Institute, London, Technical Report No. NMI-R-158.
[9] Perlin, M., Choi, W., and Tian, Z., 2013, “Breaking Waves in Deep and Inter-mediate Waters,” Annu. Rev. Fluid Mech., 45(1), pp. 115–145.
[10] Wienke, J., and Oumeraci, H., 2005, “Breaking Wave Impact Force on a Verti-cal and Inclined Slender Pile—Theoretical and Large-Scale Model Inves-tigation,” Coastal Eng., 52(5), pp. 435–462.
[11] Irschik, K., Sparboom, U., and Oumeraci, H., 2005, “Breaking Wave Loads ona Slender Pile in Shallow Water,” Coastal Engineering 2004, Vol. 1, WorldScientific, Hackensack, NJ, pp. 568–580.
[12] Bredmose, H., Slabiak, P., Sahlberg-Nielsen, L., and Schl€utter, F., 2013,“Dynamic Excitation of Monopiles by Steep and Breaking Waves: Experimen-tal and Numerical Study,” ASME Paper No. OMAE2013-10948.
[13] Choi, S.-J., Lee, K.-H., and Gudmestad, O. T., 2015, “The Effect of DynamicAmplification Due to a Structure’s Vibration on Breaking Wave Impact,”Ocean Eng., 96, pp. 8–20.
[14] Rausa, I. E., Muskulus, M., Arntsen, Ø. A., and Wasjø, K., 2015,“Characterization of Wave Slamming Forces for a Truss Structure Within theFramework of the WaveSlam Project,” Energy Procedia, 80, pp. 276–283.
[15] Tu, Y., Muskulus, M., and Arntsen, Ø. A., 2015, “Experimental Analysis ofSlamming Load Characteristics for Truss Structures in Offshore WindApplications,” J. Ocean Wind Energy, 2(3), pp. 138–145.
[16] Tørum, A., 2011, “Wave Slamming Forces on Truss Structures in ShallowWater, Version 2011-10-03,” Norwegian University of Science and Technol-ogy, Trondheim, Norway.
[17] Arntsen, Ø., Obhrai, C., and Gudmestad, O., 2013, “Data Storage Report: WaveSlamming Forces on Truss Structures in Shallow Water,” WaveSlam (HylV-FZK-05), Norwegian University of Science and Technology, Trondheim, Norway.
[18] Sarkar, T. K., Tseng, F. I., Rao, S. M., Dianat, S. A., and Hollmann, B. Z.,1985, “Deconvolution of Impulse Response From Time-Limited Input and Out-put: Theory and Experiment,” IEEE Trans. Instrum. Meas., 34(4), pp. 541–546.
[19] Jacquelin, E., Bennani, A., and Hamelin, P., 2003, “Force Reconstruction: Analysisand Regularization of a Deconvolution Problem,” J. Sound Vib., 265(1), pp. 81–107.
[20] Sanchez, J., and Benaroya, H., 2014, “Review of Force ReconstructionTechniques,” J. Sound Vib., 333(14), pp. 2999–3018.
[21] Ekstrom, M. P., and Rhoads, R. L., 1974, “On the Application of EigenvectorExpansions to Numerical Deconvolution,” J. Comput. Phys., 14(4), pp. 319–340.
061601-12 / Vol. 139, DECEMBER 2017 Transactions of the ASME
Downloaded From: https://offshoremechanics.asmedigitalcollection.asme.org/ on 08/25/2017 Terms of Use: http://www.asme.org/about-asme/terms-of-use