inversion of continuous data over europe : a pseudo-data analysis. c. carouge and p. peylin ; p....
Post on 22-Dec-2015
214 views
TRANSCRIPT

Inversion of continuous data over Europe : a pseudo-data
analysis.
C. Carouge and
P. Peylin ; P. Bousquet ; P. Ciais ; P. Rayner Laboratoire des Sciences du Climat et de l’Environnement
Acknowledgement : all experimentalists from Aerocarb project
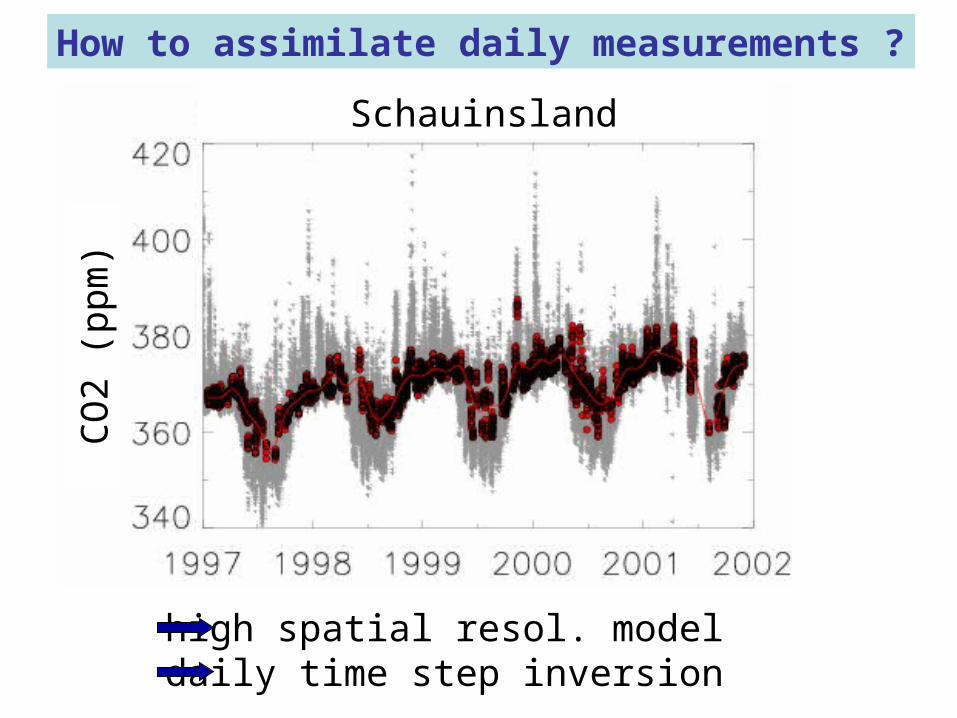
high spatial resol. modeldaily time step inversion
How to assimilate daily measurements ?
SchauinslandC
O2
(ppm
)
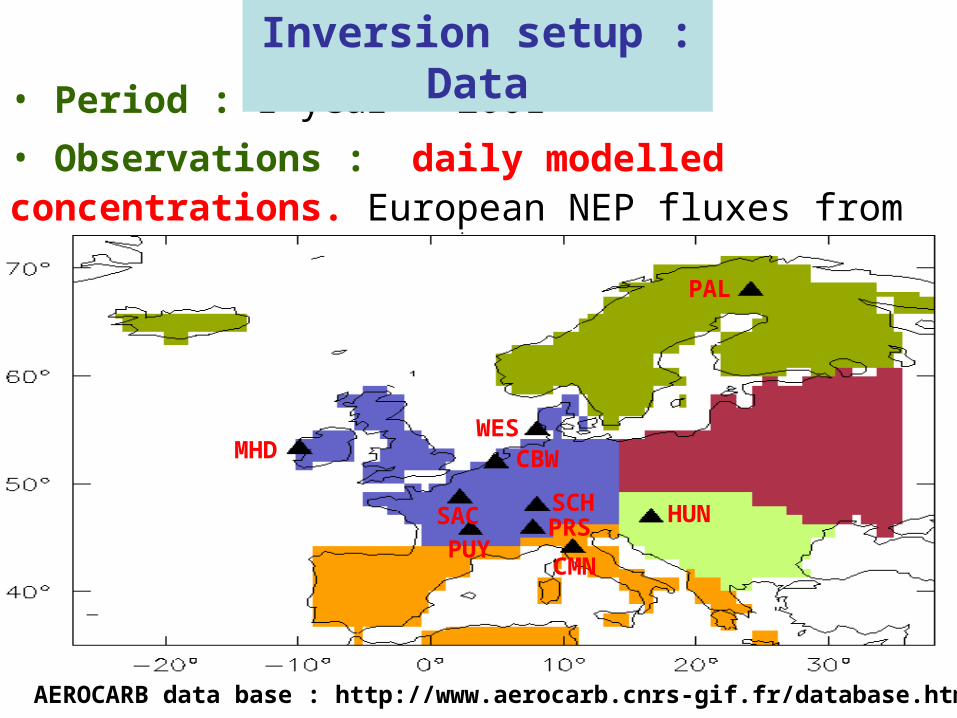
• Period : 1 year = 2001
• Observations : daily modelled concentrations. European NEP fluxes from ORCHIDEE. 10 European stations
Inversion setup : Data
MHD
SAC
PUYPRSSCH
CBWWES
PAL
HUN
CMN
AEROCARB data base : http://www.aerocarb.cnrs-gif.fr/database.html

Transport model : LMDZ, zoom over Europe
• Nudged on ECMWF winds• 192 x 146 and 19 vertical levels - 0.5 x 0.5 degrees in the zoom - 4 x 4 degrees at the lowest resolution
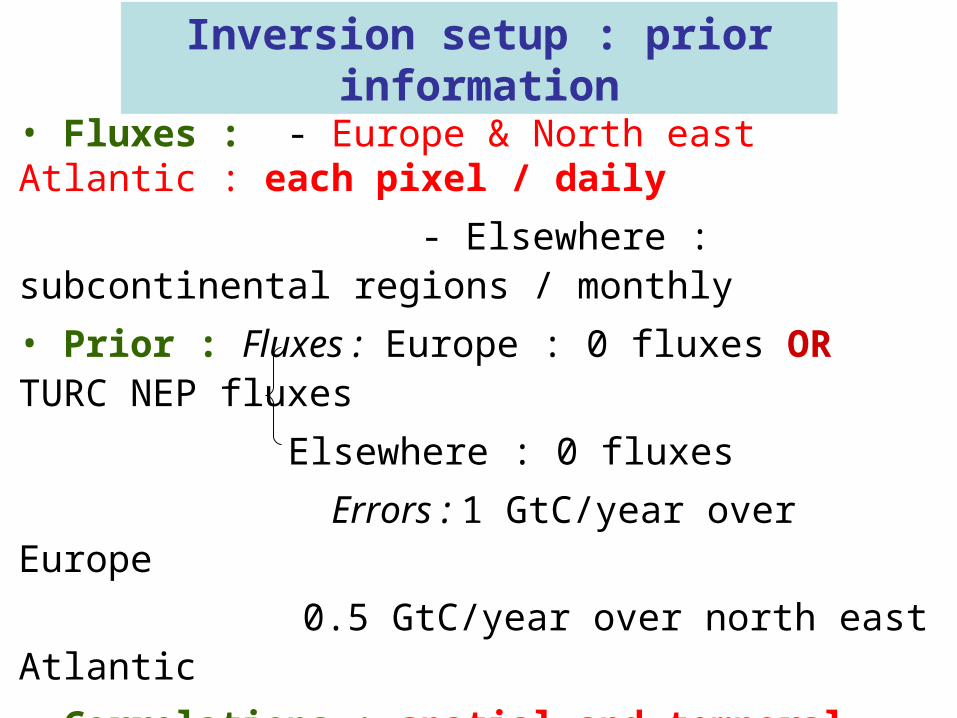
• Fluxes : - Europe & North east Atlantic : each pixel / daily
- Elsewhere : subcontinental regions / monthly
• Prior : Fluxes : Europe : 0 fluxes OR TURC NEP fluxes
Elsewhere : 0 fluxes
Errors : 1 GtC/year over Europe
0.5 GtC/year over north east Atlantic
• Correlations : spatial and temporal correlations between European / N.Atlantic pixels
Inversion setup : prior information
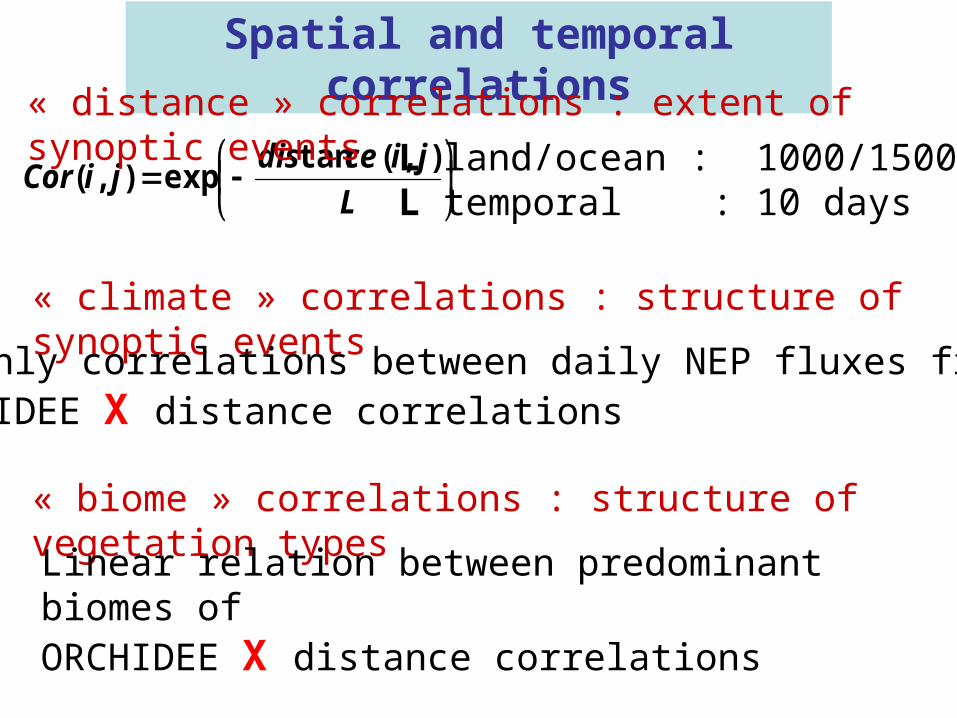
Spatial and temporal correlations
L
jicedisjiCor
),( tan exp),(
« distance » correlations : extent of synoptic events
L land/ocean : 1000/1500 kmL temporal : 10 days
« climate » correlations : structure of synoptic events
Monthly correlations between daily NEP fluxes from ORCHIDEE X distance correlations
« biome » correlations : structure of vegetation types
Linear relation between predominant biomes of ORCHIDEE X distance correlations

Distance
Illustration of correlations
Climate x distance(November) Biomes x distance

Technical aspects :
• Synthesis inversion to get posterior errors :
Sequential approach with overlap : 11 * 2 months inversions
Still 7000*60 unknowns covariance matrix of ~ 400,000 x 400,000 !!
• Use “retro-plume approach” (~ adjoint) to get daily response functions for all pixels
Huge memory size problems !

PSEUDO DATA :
Perfect transport

Annual error reduction maps :
Distance correlations
Climate correlations
0 10 20 30 percentage

2001 2001.52001.25 20022001.75
2001.252001 2001.752001.5 2002
PRS
SAC
correlation prior/poste : 0.69 / 0.79
correlation prior/poste : 0.69 / 0.53
Prior(with TURC) posterior
ORCHIDEE(Truth)
0
4
8
-4
-6
0
4
gC/m
²/da
ygC
/m²/
day
Pixel resolution
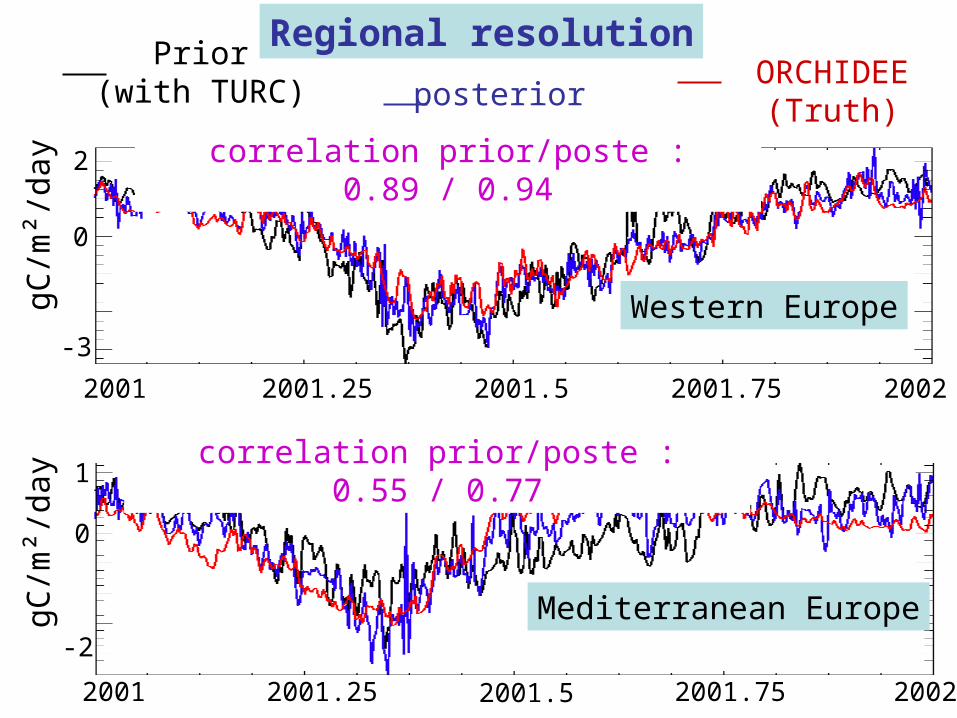
Mediterranean Europe
Western Europe
Prior(with TURC) posterior
ORCHIDEE(Truth)
2001 2001.52001.25 20022001.75
2001 2001.52001.25 20022001.75
2
0
1
-3
-2
0
gC/m
²/da
ygC
/m²/
day
Regional resolution
correlation prior/poste : 0.89 / 0.94
correlation prior/poste : 0.55 / 0.77
0.5
0.1
0.32.4
2.8
2.0
1.6
1.4
1.00.2
0.4
0.6
0.8 1.8 Norm
alised standard dev.re
sidu
al c
orre
latio
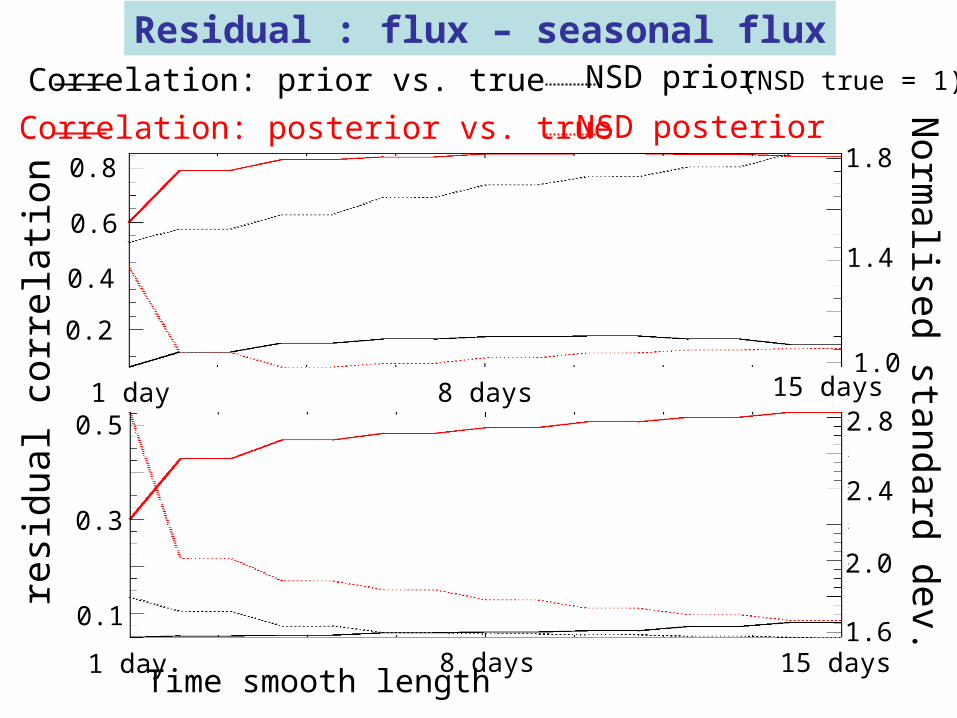
nCorrelation: prior vs. true
Correlation: posterior vs. true
NSD prior
NSD posterior
(NSD true = 1)
1 day 8 days 15 days
1 day 8 days 15 days
Time smooth length
Residual : flux – seasonal flux

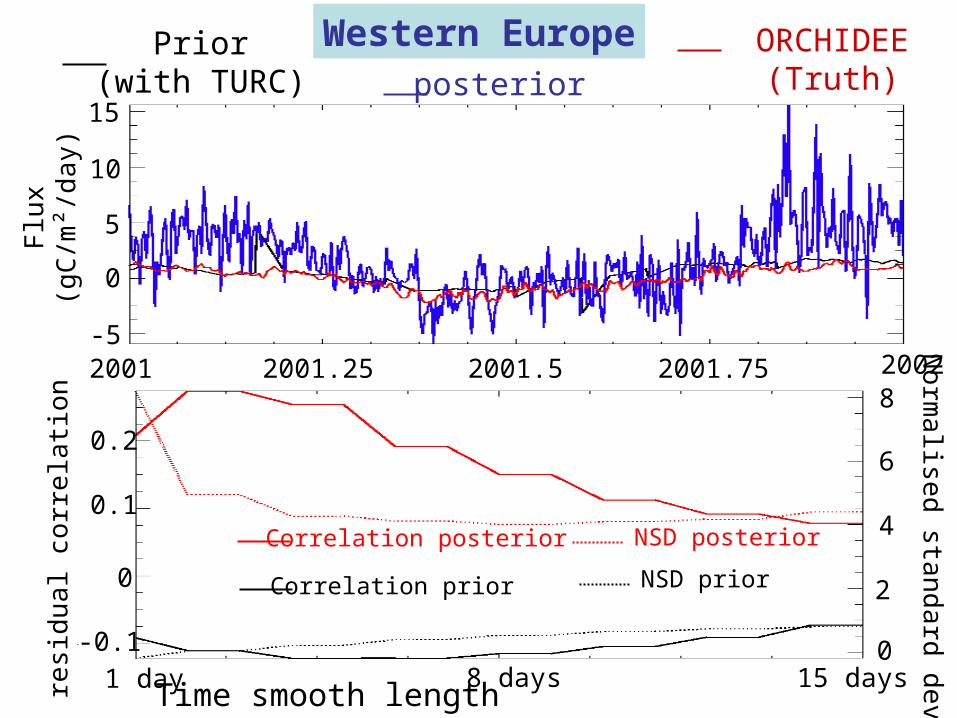
PSEUDO DATA :
Non-perfect transport

Western Europe
0
2
-2
2.5
-4
0.6
1.5
0.4
0.2
3.5
No
rma
lised sta
nd
ard de
v.re
sid
ual c
orr
ela
tion
2001 2001.52001.25 20022001.75
Flu
x(g
C/m
²/d
ay)
Correlation posterior
Correlation prior NSD prior
NSD posterior
Prior(with TURC) posterior
ORCHIDEE(Truth)
1 day 8 days 15 daysTime smooth length
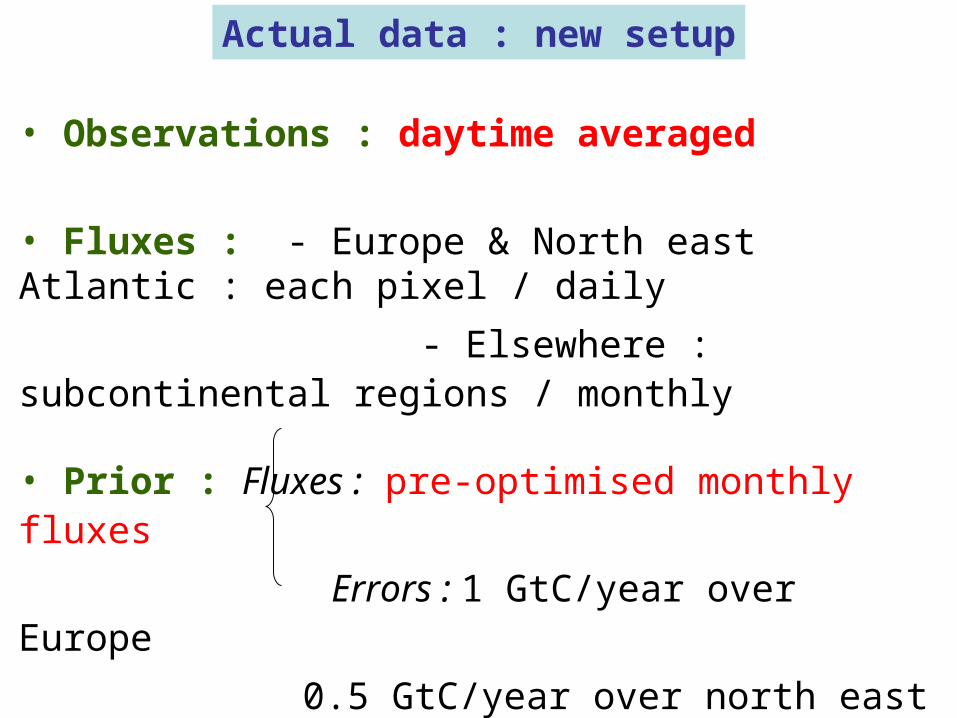
Actual data : new setup
• Observations : daytime averaged
• Fluxes : - Europe & North east Atlantic : each pixel / daily
- Elsewhere : subcontinental regions / monthly
• Prior : Fluxes : pre-optimised monthly fluxes
Errors : 1 GtC/year over Europe
0.5 GtC/year over north east Atlantic
tiny on other regions
No
rma
lised sta
nd
ard de
v.re
sid
ual c
orr
ela
tion
2001 2001.52001.25 20022001.75
Flu
x(g
C/m
²/d
ay)
Prior(with TURC)
ORCHIDEE(Truth)
1 day 8 days 15 daysTime smooth length
Western Europeposterior
15
10
5
0
-5
0.2
0.1
0
-0.1 0
2
4
6
8
Correlation posterior
Correlation prior NSD prior
NSD posterior

Fit to observations
440
400
360
360
370
380
2001 2001.52001.25 20022001.75
2001 2001.52001.25 20022001.75
CO
2 (
ppm
)
prior Obs.posterior
CBW
CMN

Conclusions …
• 1 year of pixel inversion is technically possible
• only W. Europe can be really resolved with current network
• Transport uncertainties are critical
… and Perspectives
• data selection
•

May
November
Flux correction : posterior - prior
-250 -160 -70 20 110 200(gC / m2 / month)
First inversion Updated inversion

AEROCARB data base : http://www.aerocarb.cnrs-gif.fr/database.html
Continuous sites
Continuous European measurement sites

Technical aspects :
• Synthesis inversion to get posterior errors :
Sequential approach with overlap : 11 * 2 months inversions
Still 7000*60 unknowns covariance matrix of ~ 400,000 x 400,000 !!
• Use “retro-plume approach” (~ adjoint) to get daily response functions for all pixels
Huge memory size problems !
• Two steps inversion : - 1st : standard monthly Fluxes + Globalview data- 2nd : daily fluxes using the 1st step estimated fluxes..

Retro-plume approach :
Day 1 Day 4
Station Zotino (Russia) October 2001
Longitude Longitude
Lat
itu
de
Lat
itu
de

Taylor diagram
Residual correlation
Total Europe / Western Europe TP: TURC fluxes
1: no correlation
2: prior 0 / distance
3: prior 0 / climate x distance
4/5/6: prior Turc / distance
7: prior Turc / climate x distance
8: prior Turc / climate
30 0.5 1 1.5 2 2.5
3
0
0.5
1
1.5
2
2.5
Normalised standard deviation
No
rma
lise
d st
an
dar
d d
evi
atio
n
TRUTH