invest malaysia 2013 - tenaga nasional fileinvest malaysia 2013 “asean‟s multinational...
TRANSCRIPT
INVEST MALAYSIA 2013 “ASEAN‟S MULTINATIONAL MARKETPLACE”
Shangri-La Hotel, Kuala Lumpur (13-14th June 2013)
Prepared by:
Investor Relations & Management Reporting Department [email protected]
GROUP FINANCE DIVISION
PART ONE
2
INVEST MALAYSIA 2013
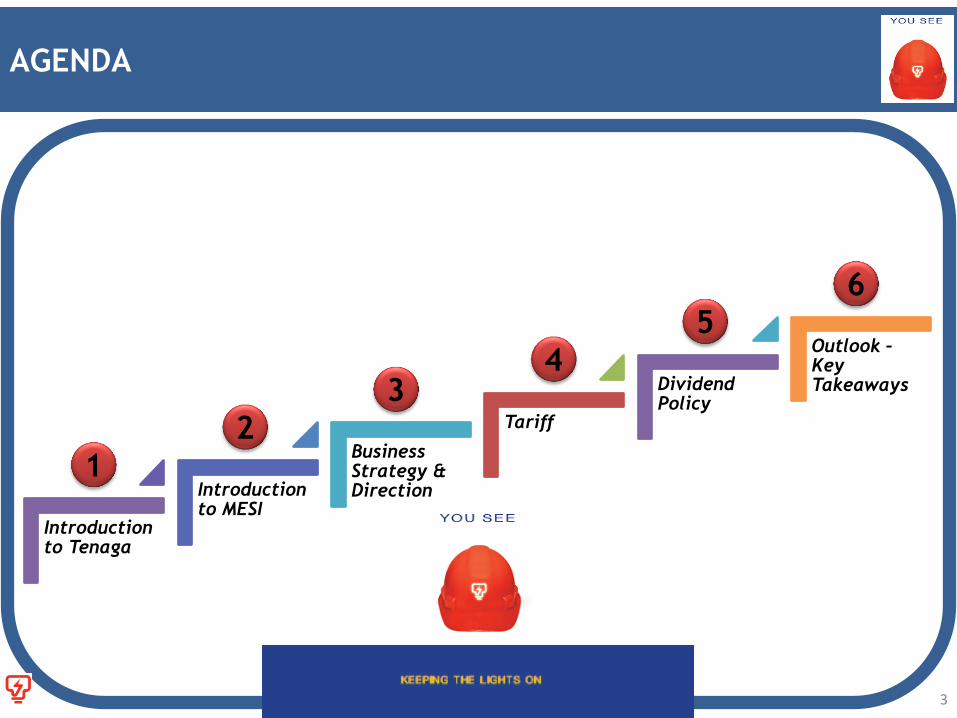
Introduction to Tenaga
Introduction to MESI
Business Strategy & Direction
Tariff
Dividend Policy
Outlook – Key Takeaways
3
AGENDA
1
2
3 4
5
6

INTRODUCTION TO TENAGA 1
4
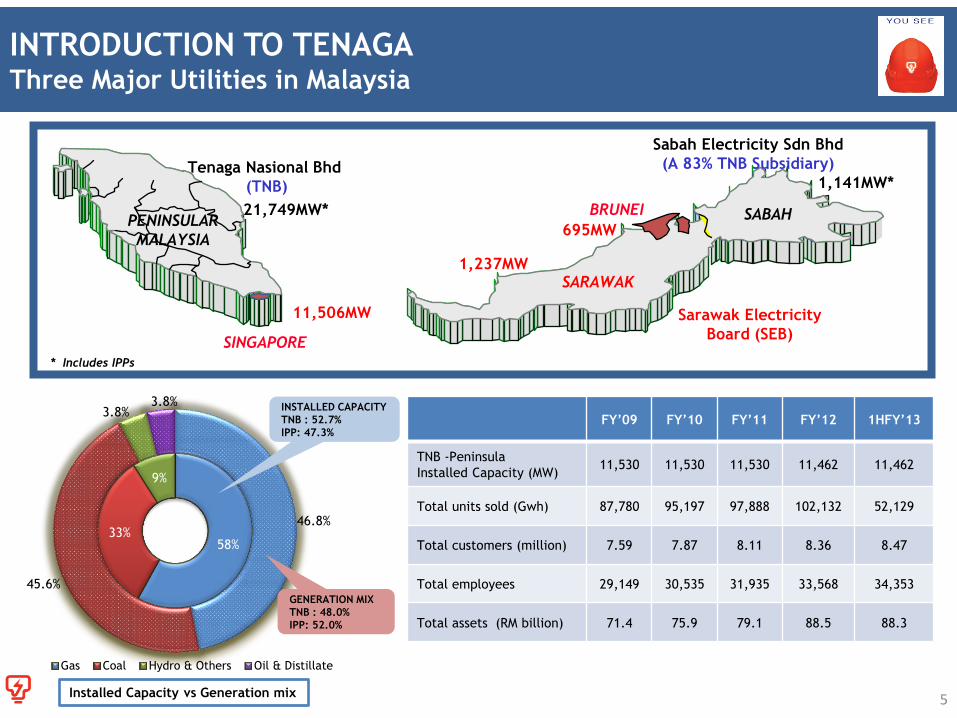
INTRODUCTION TO TENAGA Three Major Utilities in Malaysia
5
PENINSULAR
MALAYSIA
SARAWAK
SABAH
Sabah Electricity Sdn Bhd
(A 83% TNB Subsidiary)
Sarawak Electricity
Board (SEB)
Tenaga Nasional Bhd
(TNB)
SINGAPORE
BRUNEI 21,749MW*
1,237MW
1,141MW*
695MW
11,506MW
* Includes IPPs
58% 33%
9%
46.8%
45.6%
3.8% 3.8%
Gas Coal Hydro & Others Oil & Distillate
Installed Capacity vs Generation mix
INSTALLED CAPACITY
TNB : 52.7%
IPP: 47.3%
GENERATION MIX
TNB : 48.0%
IPP: 52.0%
FY‟09 FY‟10 FY‟11 FY‟12 1HFY‟13
TNB -Peninsula
Installed Capacity (MW) 11,530 11,530 11,530 11,462 11,462
Total units sold (Gwh) 87,780 95,197 97,888 102,132 52,129
Total customers (million) 7.59 7.87 8.11 8.36 8.47
Total employees 29,149 30,535 31,935 33,568 34,353
Total assets (RM billion) 71.4 75.9 79.1 88.5 88.3
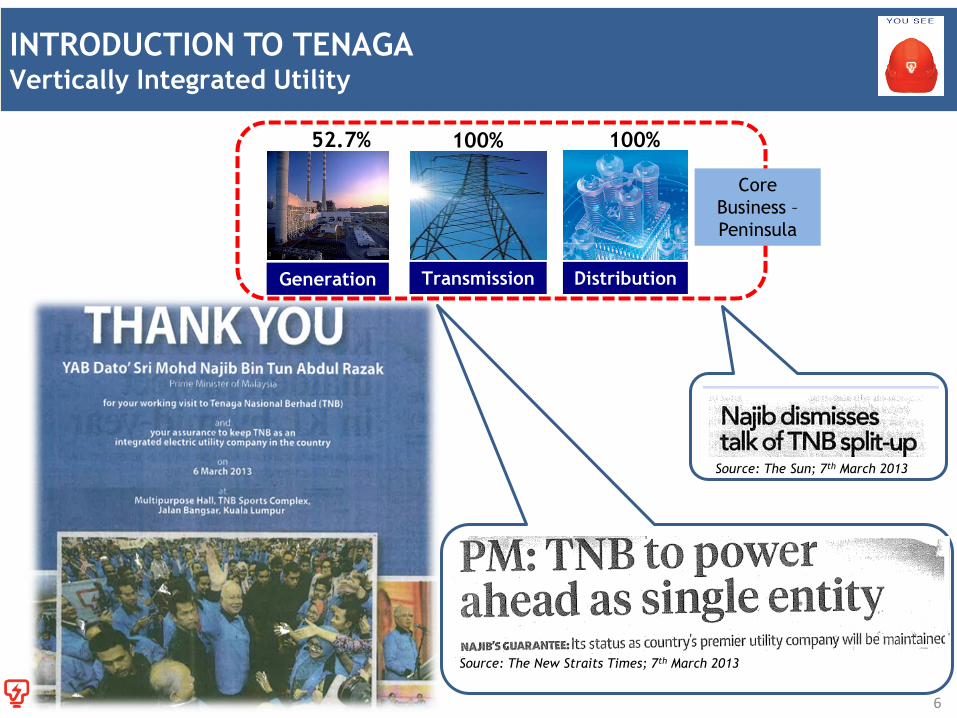
INTRODUCTION TO TENAGA Vertically Integrated Utility
Generation Distribution Transmission
Core
Business –
Peninsula
100% 100% 52.7%
Source: The Sun; 7th March 2013
Source: The New Straits Times; 7th March 2013
6
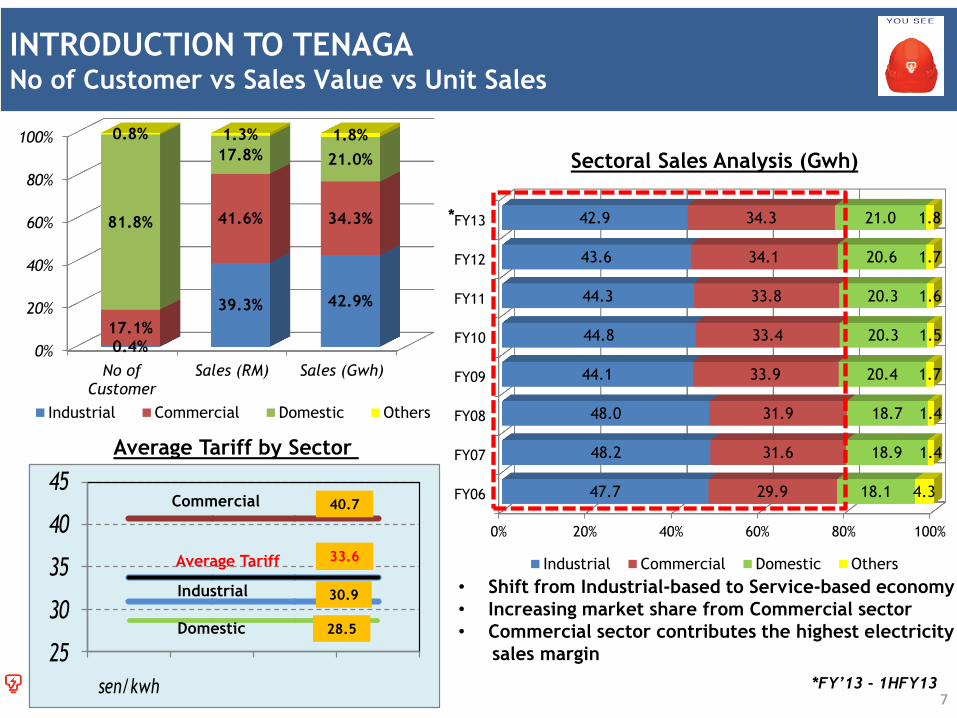
0%
20%
40%
60%
80%
100%
No ofCustomer
Sales (RM) Sales (Gwh)
0.4%
39.3% 42.9%
17.1%
41.6% 34.3% 81.8%
17.8% 21.0%
0.8% 1.3% 1.8%
Industrial Commercial Domestic Others
25
30
35
40
45
sen/kwh
INTRODUCTION TO TENAGA No of Customer vs Sales Value vs Unit Sales
*FY’13 - 1HFY13
Average Tariff by Sector
30.9
33.6
40.7
28.5
Industrial
Average Tariff
Commercial
Domestic
7
0% 20% 40% 60% 80% 100%
FY06
FY07
FY08
FY09
FY10
FY11
FY12
FY13
47.7
48.2
48.0
44.1
44.8
44.3
43.6
42.9
29.9
31.6
31.9
33.9
33.4
33.8
34.1
34.3
18.1
18.9
18.7
20.4
20.3
20.3
20.6
21.0
4.3
1.4
1.4
1.7
1.5
1.6
1.7
1.8
Industrial Commercial Domestic Others
Sectoral Sales Analysis (Gwh)
• Shift from Industrial-based to Service-based economy
• Increasing market share from Commercial sector
• Commercial sector contributes the highest electricity
sales margin
*
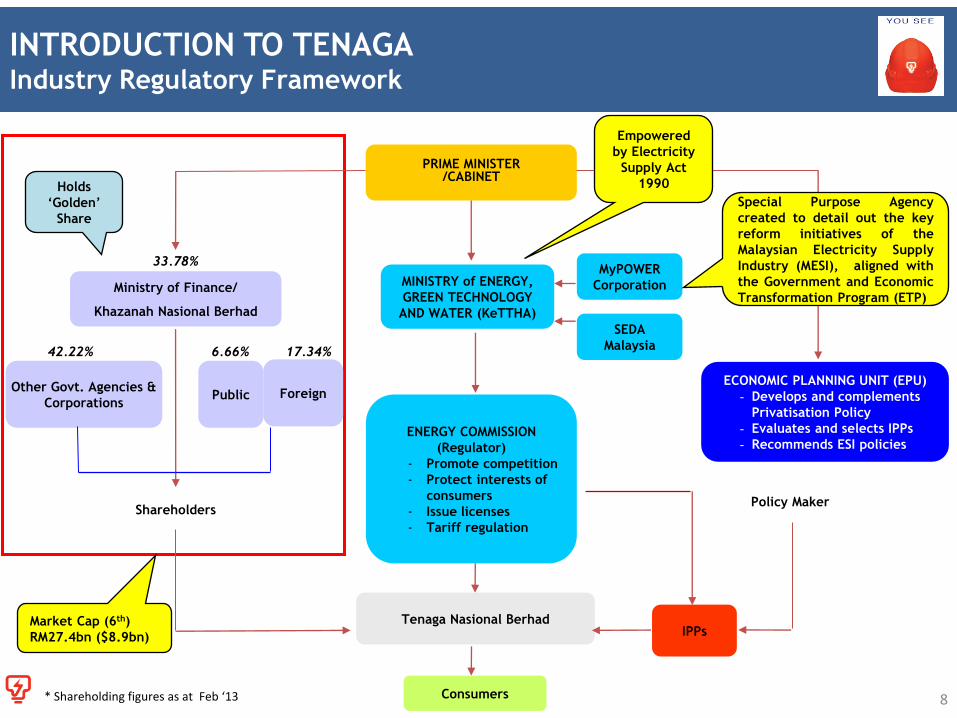
INTRODUCTION TO TENAGA Industry Regulatory Framework
PRIME MINISTER /CABINET
MINISTRY of ENERGY,
GREEN TECHNOLOGY
AND WATER (KeTTHA)
ENERGY COMMISSION
(Regulator)
- Promote competition
- Protect interests of
consumers
- Issue licenses
- Tariff regulation
Tenaga Nasional Berhad
ECONOMIC PLANNING UNIT (EPU)
- Develops and complements
Privatisation Policy
- Evaluates and selects IPPs
- Recommends ESI policies
Ministry of Finance/
Khazanah Nasional Berhad
Shareholders Policy Maker
Other Govt. Agencies &
Corporations Public
Empowered
by Electricity
Supply Act
1990 Holds
„Golden‟
Share
IPPs
Consumers
33.78%
42.22%
Foreign
6.66% 17.34%
* Shareholding figures as at Feb ‘13
MyPOWER
Corporation
SEDA
Malaysia
8
Special Purpose Agency
created to detail out the key
reform initiatives of the
Malaysian Electricity Supply
Industry (MESI), aligned with
the Government and Economic
Transformation Program (ETP)
Market Cap (6th)
RM27.4bn ($8.9bn)
INTRODUCTION TO
MALAYSIAN ELECTRICITY
SUPPLY INDUSTRY (MESI)
2
9
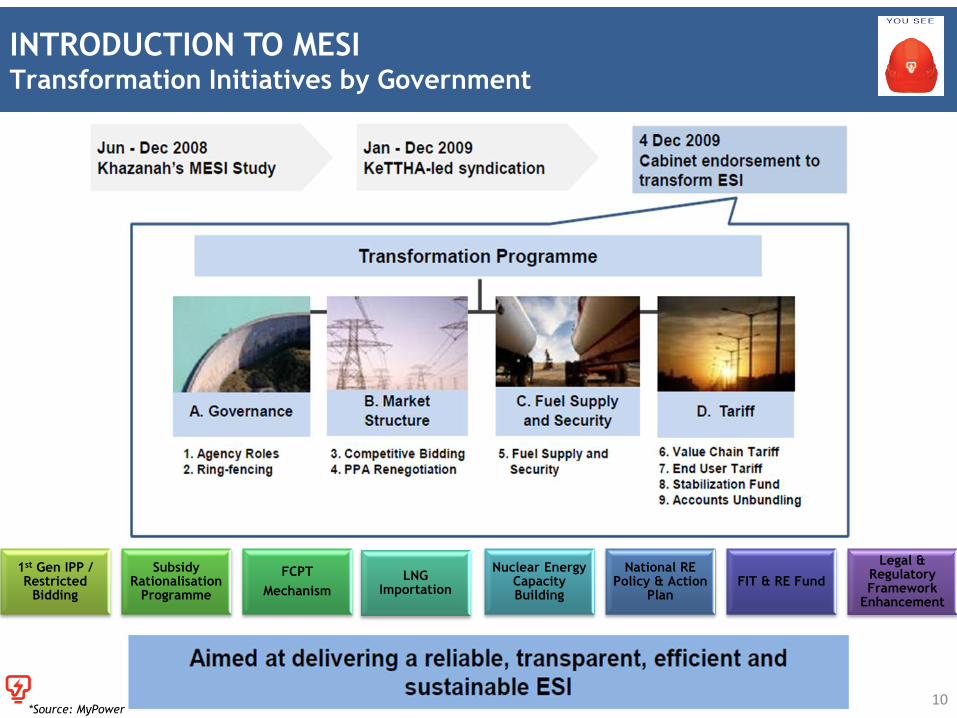
INTRODUCTION TO MESI Transformation Initiatives by Government
1st Gen IPP / Restricted
Bidding
Subsidy Rationalisation
Programme
FCPT
Mechanism LNG
Importation
Nuclear Energy Capacity Building
National RE Policy & Action
Plan FIT & RE Fund
Legal & Regulatory Framework
Enhancement
10 *Source: MyPower
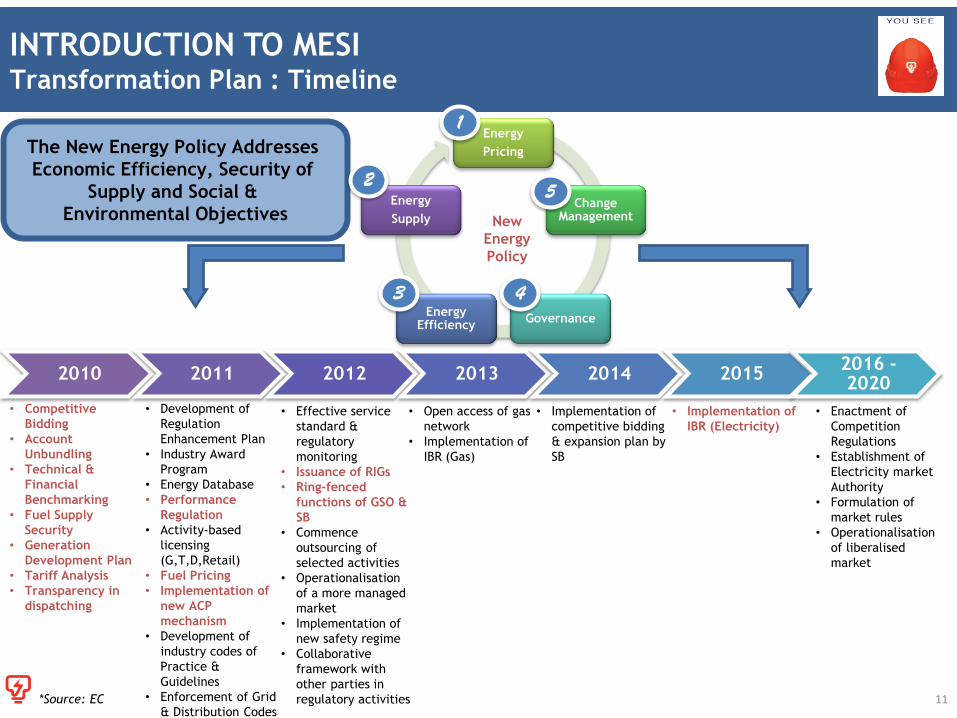
INTRODUCTION TO MESI Transformation Plan : Timeline
2010 2011 2012 2013 2014 2015 2016 - 2020
*Source: EC 11
• Competitive
Bidding
• Account
Unbundling
• Technical &
Financial
Benchmarking
• Fuel Supply
Security
• Generation
Development Plan
• Tariff Analysis
• Transparency in
dispatching
• Development of
Regulation
Enhancement Plan
• Industry Award
Program
• Energy Database
• Performance
Regulation
• Activity-based
licensing
(G,T,D,Retail)
• Fuel Pricing
• Implementation of
new ACP
mechanism
• Development of
industry codes of
Practice &
Guidelines
• Enforcement of Grid
& Distribution Codes
• Effective service
standard &
regulatory
monitoring
• Issuance of RIGs
• Ring-fenced
functions of GSO &
SB
• Commence
outsourcing of
selected activities
• Operationalisation
of a more managed
market
• Implementation of
new safety regime
• Collaborative
framework with
other parties in
regulatory activities
• Open access of gas
network
• Implementation of
IBR (Gas)
• Implementation of
competitive bidding
& expansion plan by
SB
• Implementation of
IBR (Electricity)
• Enactment of
Competition
Regulations
• Establishment of
Electricity market
Authority
• Formulation of
market rules
• Operationalisation
of liberalised
market
Energy
Pricing
Change Management
Governance Energy
Efficiency
Energy
Supply New
Energy
Policy
The New Energy Policy Addresses
Economic Efficiency, Security of
Supply and Social &
Environmental Objectives
1
2
3 4
5
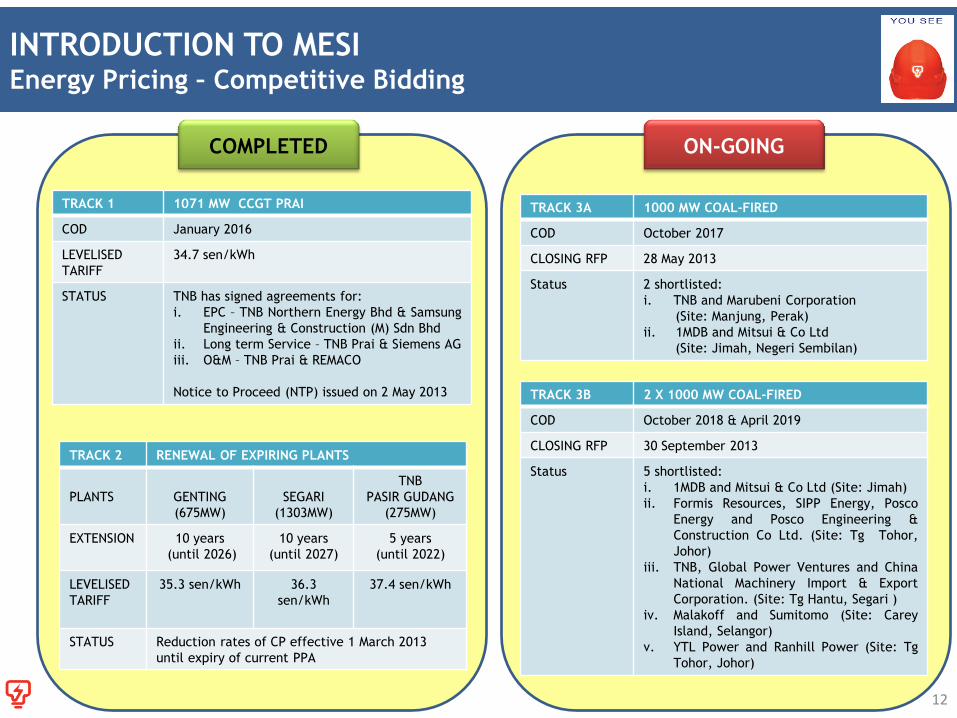
INTRODUCTION TO MESI Energy Pricing – Competitive Bidding
12
COMPLETED
TRACK 1 1071 MW CCGT PRAI
COD January 2016
LEVELISED
TARIFF
34.7 sen/kWh
STATUS TNB has signed agreements for:
i. EPC – TNB Northern Energy Bhd & Samsung
Engineering & Construction (M) Sdn Bhd
ii. Long term Service – TNB Prai & Siemens AG
iii. O&M – TNB Prai & REMACO
Notice to Proceed (NTP) issued on 2 May 2013
TRACK 2 RENEWAL OF EXPIRING PLANTS
PLANTS
GENTING
(675MW)
SEGARI
(1303MW)
TNB
PASIR GUDANG
(275MW)
EXTENSION 10 years
(until 2026)
10 years
(until 2027)
5 years
(until 2022)
LEVELISED
TARIFF
35.3 sen/kWh 36.3
sen/kWh
37.4 sen/kWh
STATUS Reduction rates of CP effective 1 March 2013
until expiry of current PPA
ON-GOING
TRACK 3A 1000 MW COAL-FIRED
COD October 2017
CLOSING RFP 28 May 2013
Status 2 shortlisted:
i. TNB and Marubeni Corporation
(Site: Manjung, Perak)
ii. 1MDB and Mitsui & Co Ltd
(Site: Jimah, Negeri Sembilan)
TRACK 3B 2 X 1000 MW COAL-FIRED
COD October 2018 & April 2019
CLOSING RFP 30 September 2013
Status 5 shortlisted:
i. 1MDB and Mitsui & Co Ltd (Site: Jimah)
ii. Formis Resources, SIPP Energy, Posco
Energy and Posco Engineering &
Construction Co Ltd. (Site: Tg Tohor,
Johor)
iii. TNB, Global Power Ventures and China
National Machinery Import & Export
Corporation. (Site: Tg Hantu, Segari )
iv. Malakoff and Sumitomo (Site: Carey
Island, Selangor)
v. YTL Power and Ranhill Power (Site: Tg
Tohor, Johor)
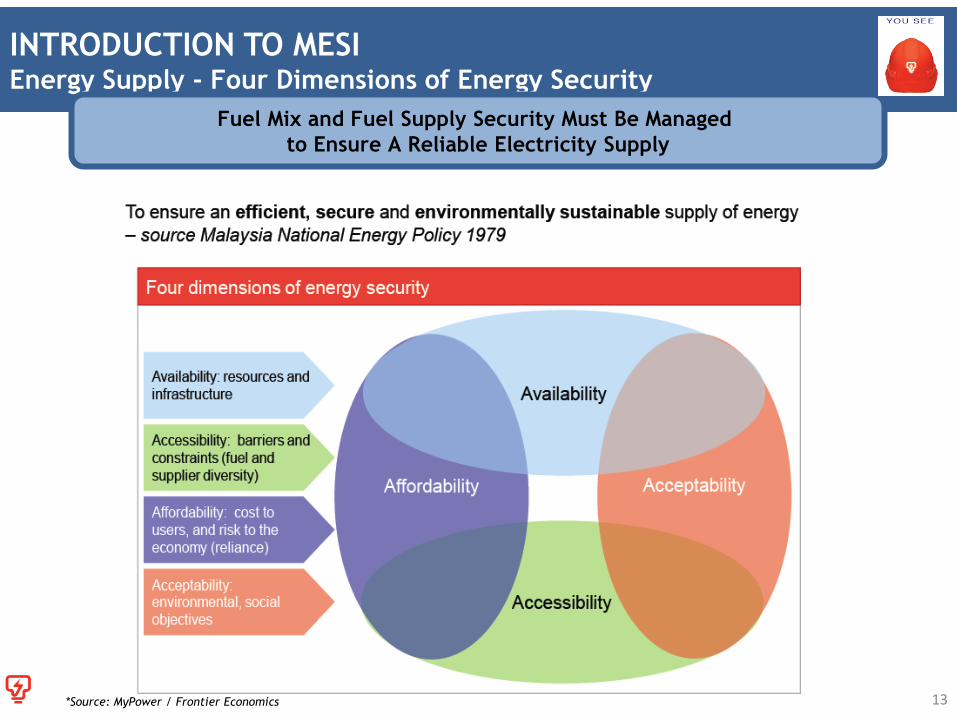
INTRODUCTION TO MESI Energy Supply - Four Dimensions of Energy Security
*Source: MyPower / Frontier Economics
Fuel Mix and Fuel Supply Security Must Be Managed
to Ensure A Reliable Electricity Supply
13
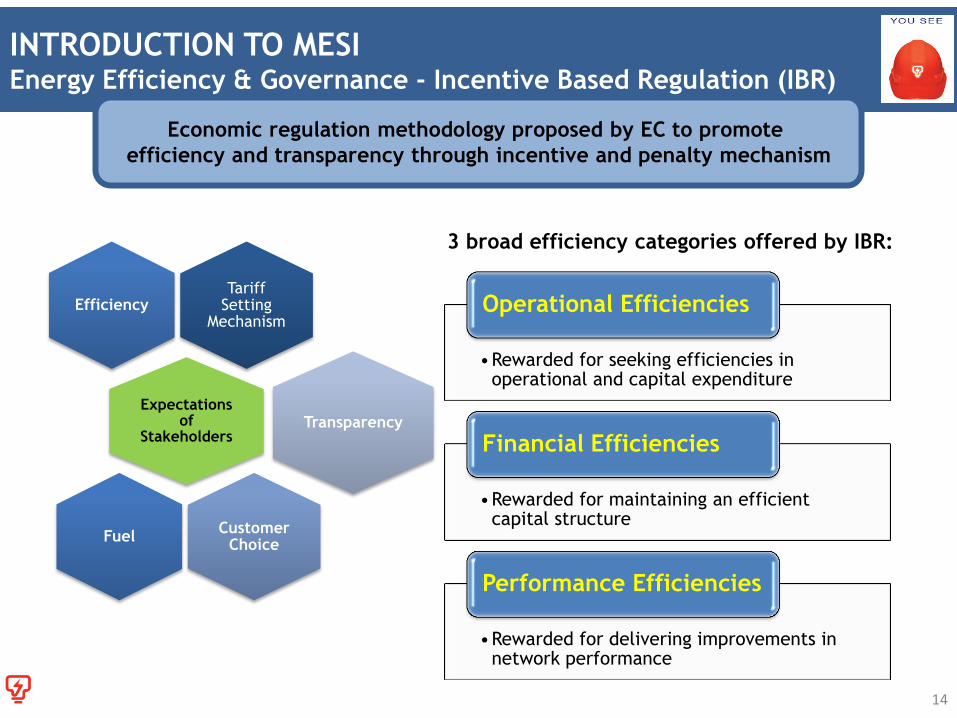
INTRODUCTION TO MESI Energy Efficiency & Governance - Incentive Based Regulation (IBR)
•Rewarded for seeking efficiencies in operational and capital expenditure
Operational Efficiencies
•Rewarded for maintaining an efficient capital structure
Financial Efficiencies
•Rewarded for delivering improvements in network performance
Performance Efficiencies
Economic regulation methodology proposed by EC to promote
efficiency and transparency through incentive and penalty mechanism
3 broad efficiency categories offered by IBR:
14
Tariff Setting
Mechanism Efficiency
Expectations of
Stakeholders Transparency
Customer Choice
Fuel
IB
R
The Economic Regulatory Framework for Regulating TNB
The Tariff Setting Mechanism and Principles for Tariff Design
Incentive Mechanisms to Promote Efficiency and Service Standards
The Process of Tariff Reviews
Creation of Regulatory Accounts and Its Annual Review Process
11 Regulatory Implementation Guidelines (RIGS) were Developed for IBR Implementation
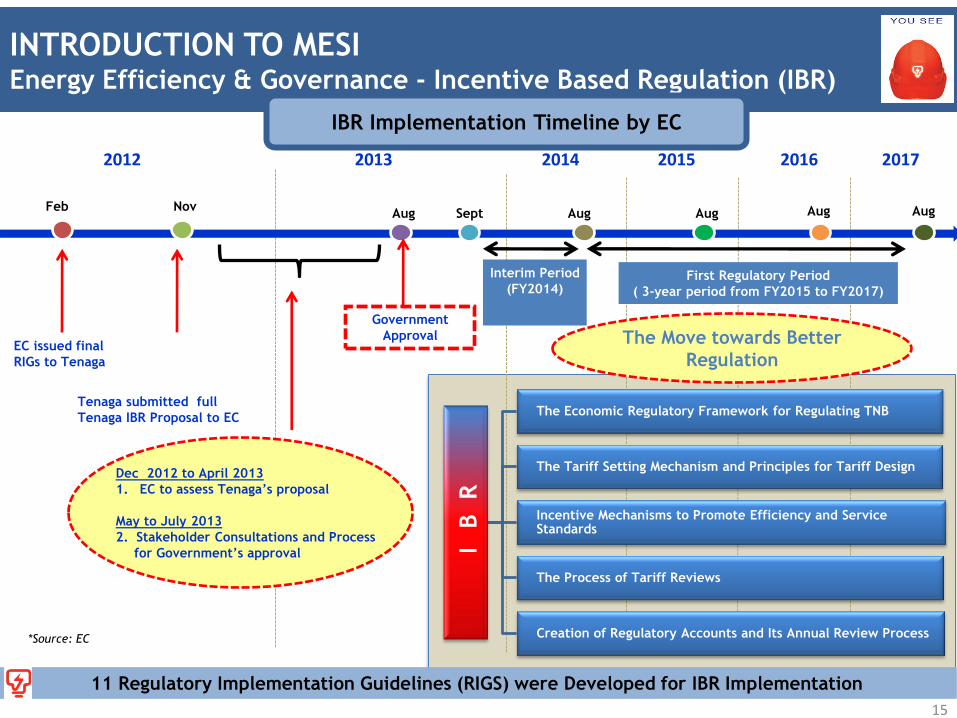
INTRODUCTION TO MESI Energy Efficiency & Governance - Incentive Based Regulation (IBR)
2012 2013 2014 2015 2016 2017
Feb
EC issued final
RIGs to Tenaga
Tenaga submitted full
Tenaga IBR Proposal to EC
Nov Aug Sept
Government
Approval
Dec 2012 to April 2013
1. EC to assess Tenaga‟s proposal
May to July 2013
2. Stakeholder Consultations and Process
for Government‟s approval
Aug
Interim Period
(FY2014)
Aug Aug Aug
First Regulatory Period
( 3-year period from FY2015 to FY2017)
IBR Implementation Timeline by EC
15
*Source: EC
The Move towards Better
Regulation

BUSINESS STRATEGY & DIRECTION 3
16
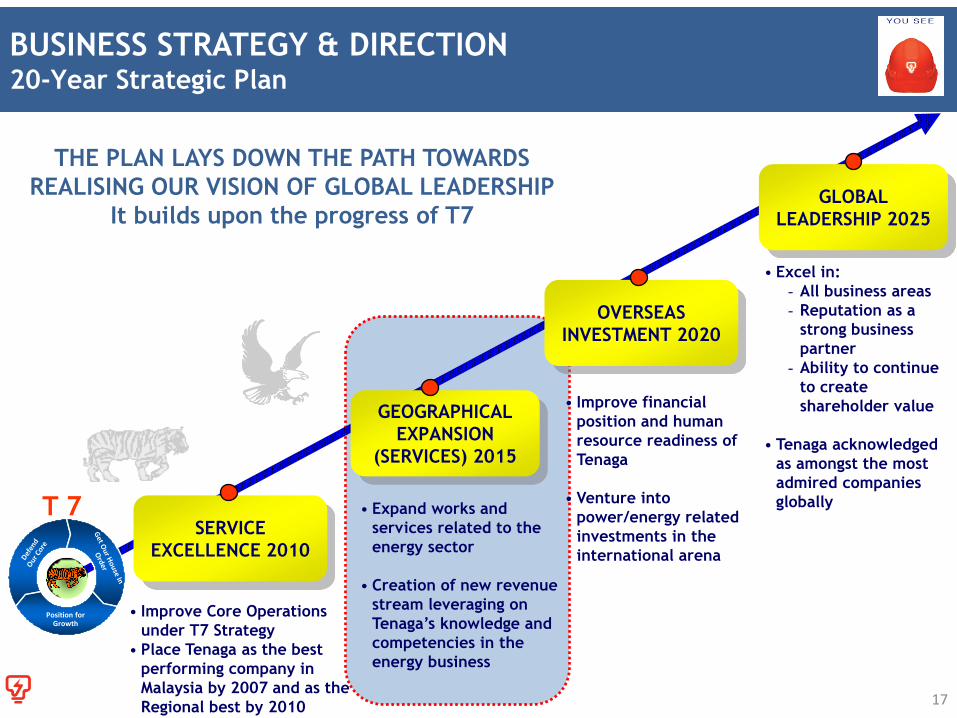
BUSINESS STRATEGY & DIRECTION 20-Year Strategic Plan
GEOGRAPHICAL
EXPANSION
(SERVICES) 2015
OVERSEAS
INVESTMENT 2020
GLOBAL
LEADERSHIP 2025
SERVICE
EXCELLENCE 2010
Position for Growth
T 7
• Improve Core Operations
under T7 Strategy
• Place Tenaga as the best
performing company in
Malaysia by 2007 and as the
Regional best by 2010
• Expand works and
services related to the
energy sector
• Creation of new revenue
stream leveraging on
Tenaga‟s knowledge and
competencies in the
energy business
• Improve financial
position and human
resource readiness of
Tenaga
• Venture into
power/energy related
investments in the
international arena
• Excel in:
- All business areas
- Reputation as a
strong business
partner
- Ability to continue
to create
shareholder value
• Tenaga acknowledged
as amongst the most
admired companies
globally
THE PLAN LAYS DOWN THE PATH TOWARDS
REALISING OUR VISION OF GLOBAL LEADERSHIP
It builds upon the progress of T7
17
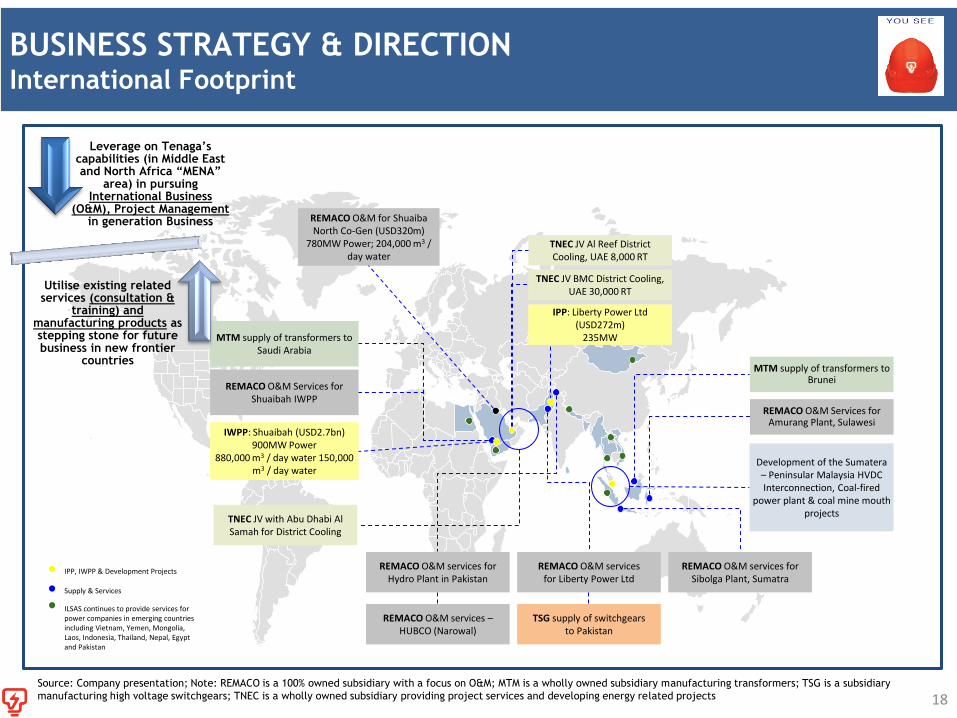
BUSINESS STRATEGY & DIRECTION International Footprint
18
MTM supply of transformers to Saudi Arabia
REMACO O&M Services for Shuaibah IWPP
IWPP: Shuaibah (USD2.7bn) 900MW Power
880,000 m3 / day water 150,000 m3 / day water
TNEC JV Al Reef District Cooling, UAE 8,000 RT
TNEC JV BMC District Cooling, UAE 30,000 RT
IPP: Liberty Power Ltd (USD272m)
235MW
REMACO O&M services for Hydro Plant in Pakistan
REMACO O&M services for Liberty Power Ltd
TSG supply of switchgears to Pakistan
REMACO O&M services –HUBCO (Narowal)
REMACO O&M services for Sibolga Plant, Sumatra
REMACO O&M Services for Amurang Plant, Sulawesi
MTM supply of transformers to Brunei
IPP, IWPP & Development Projects
ILSAS continues to provide services for power companies in emerging countries including Vietnam, Yemen, Mongolia, Laos, Indonesia, Thailand, Nepal, Egypt and Pakistan
Supply & Services
REMACO O&M for Shuaiba North Co-Gen (USD320m)
780MW Power; 204,000 m3 / day water
TNEC JV with Abu Dhabi Al Samah for District Cooling
Development of the Sumatera – Peninsular Malaysia HVDC Interconnection, Coal-fired
power plant & coal mine mouth projects
Source: Company presentation; Note: REMACO is a 100% owned subsidiary with a focus on O&M; MTM is a wholly owned subsidiary manufacturing transformers; TSG is a subsidiary
manufacturing high voltage switchgears; TNEC is a wholly owned subsidiary providing project services and developing energy related projects
Leverage on Tenaga‟s capabilities (in Middle East and North Africa “MENA”
area) in pursuing International Business
(O&M), Project Management in generation Business
Utilise existing related services (consultation &
training) and manufacturing products as stepping stone for future business in new frontier
countries
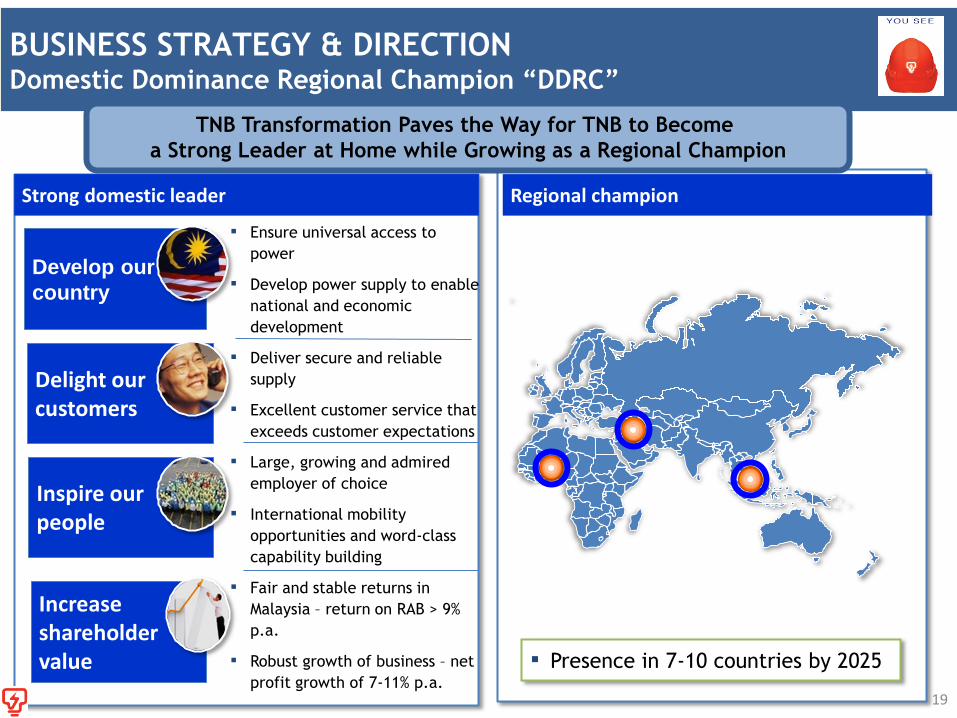
Regional champion
▪ Presence in 7-10 countries by 2025
Strong domestic leader
Inspire our people
Increase shareholder value
Delight our customers
Develop our
country
BUSINESS STRATEGY & DIRECTION Domestic Dominance Regional Champion “DDRC”
TNB Transformation Paves the Way for TNB to Become
a Strong Leader at Home while Growing as a Regional Champion
19
▪ Ensure universal access to
power
▪ Develop power supply to enable
national and economic
development
▪ Deliver secure and reliable
supply
▪ Excellent customer service that
exceeds customer expectations
▪ Large, growing and admired
employer of choice
▪ International mobility
opportunities and word-class
capability building
▪ Fair and stable returns in
Malaysia – return on RAB > 9%
p.a.
▪ Robust growth of business – net
profit growth of 7-11% p.a.
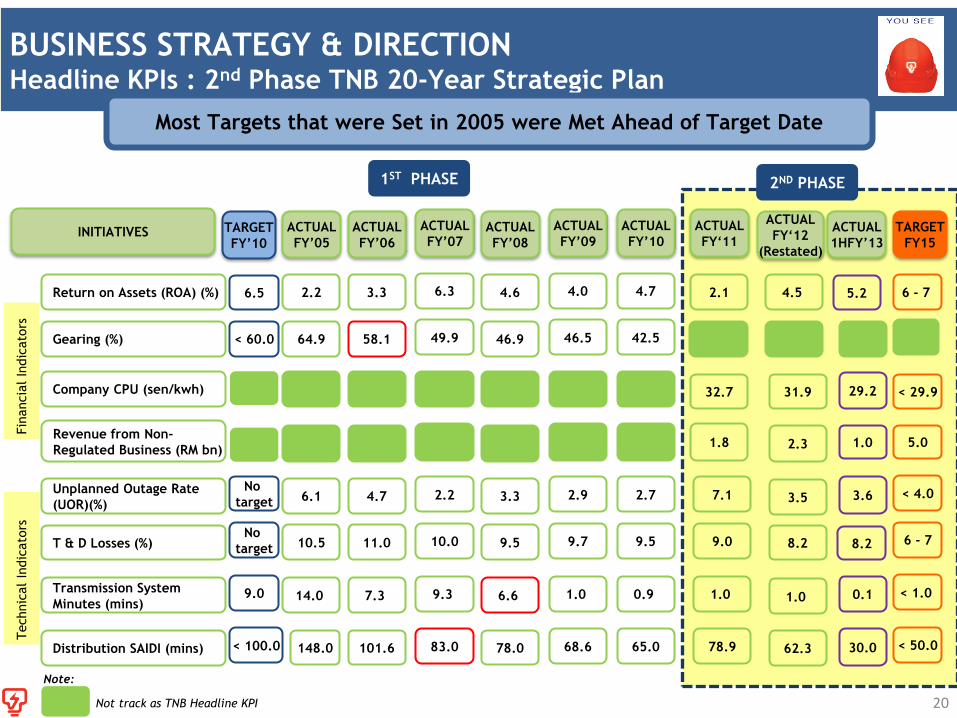
BUSINESS STRATEGY & DIRECTION Headline KPIs : 2nd Phase TNB 20-Year Strategic Plan
20
Return on Assets (ROA) (%) 4.5
Company CPU (sen/kwh) 31.9
Unplanned Outage Rate
(UOR)(%) 3.5
T & D Losses (%) 8.2
Transmission System
Minutes (mins) 1.0
Distribution SAIDI (mins) 62.3
Revenue from Non-
Regulated Business (RM bn) 2.3
INITIATIVES ACTUAL
FY„12
(Restated)
Fin
ancia
l In
dic
ato
rs
Technic
al
Indic
ato
rs
6 - 7
< 29.9
< 4.0
6 - 7
< 1.0
< 50.0
5.0
TARGET
FY15
2.1
32.7
7.1
9.0
1.0
78.9
1.8
ACTUAL
FY„11
5.2
29.2
3.6
30.0
1.0
0.1
8.2
4.7
2.7
9.5
0.9
65.0
ACTUAL
FY‟10
4.0
2.9
9.7
1.0
68.6
ACTUAL
FY‟09
4.6
3.3
9.5
6.6
78.0
ACTUAL
FY‟08
6.3
2.2
10.0
9.3
83.0
ACTUAL
FY‟07
3.3
4.7
11.0
7.3
101.6
ACTUAL
FY‟06
2.2
6.1
10.5
14.0
148.0
ACTUAL
FY‟05
1ST PHASE 2ND PHASE
Most Targets that were Set in 2005 were Met Ahead of Target Date
Gearing (%) 42.5 46.5 46.9 49.9 58.1 64.9
ACTUAL
1HFY‟13
6.5
< 60.0
No
target
No
target
9.0
< 100.0
TARGET
FY‟10
Not track as TNB Headline KPI
Note:
TARIFF 4
21
Commercial
Industrial
Domestic
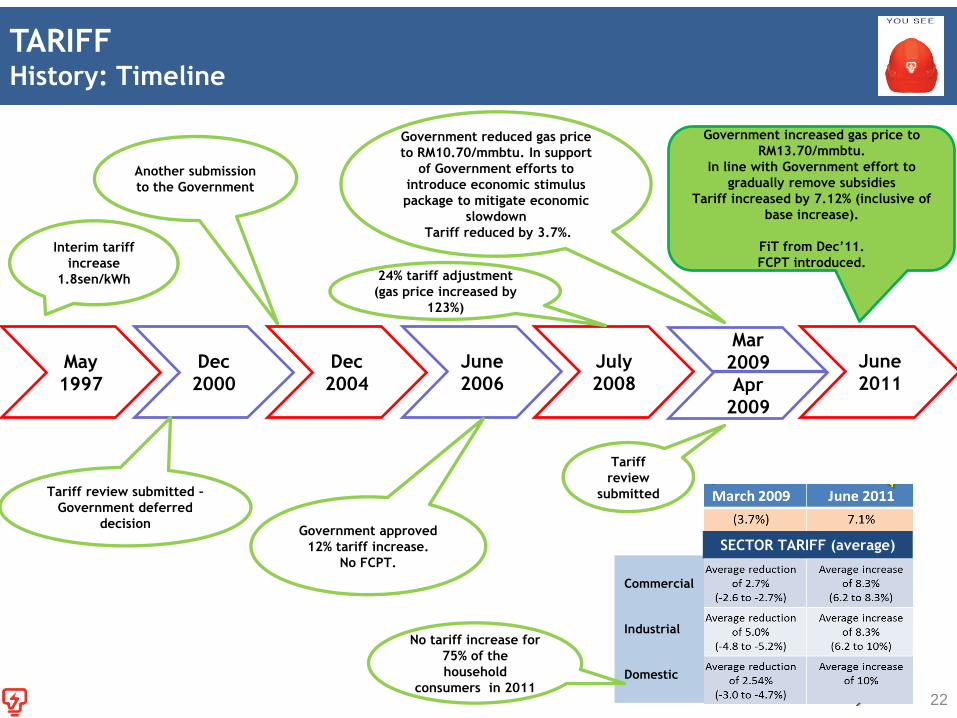
May
1997
Dec
2000
Dec
2004
June
2006
July
2008
June
2011
Interim tariff
increase
1.8sen/kWh
Tariff review submitted –
Government deferred
decision
Another submission
to the Government
Government approved
12% tariff increase.
No FCPT.
24% tariff adjustment
(gas price increased by
123%)
Government reduced gas price
to RM10.70/mmbtu. In support
of Government efforts to
introduce economic stimulus
package to mitigate economic
slowdown
Tariff reduced by 3.7%.
Tariff
review
submitted
Mar
2009
Apr
2009
TARIFF History: Timeline
22
SECTOR TARIFF (average)
Government increased gas price to
RM13.70/mmbtu.
In line with Government effort to
gradually remove subsidies
Tariff increased by 7.12% (inclusive of
base increase).
FiT from Dec‟11.
FCPT introduced.
No tariff increase for
75% of the
household
consumers in 2011
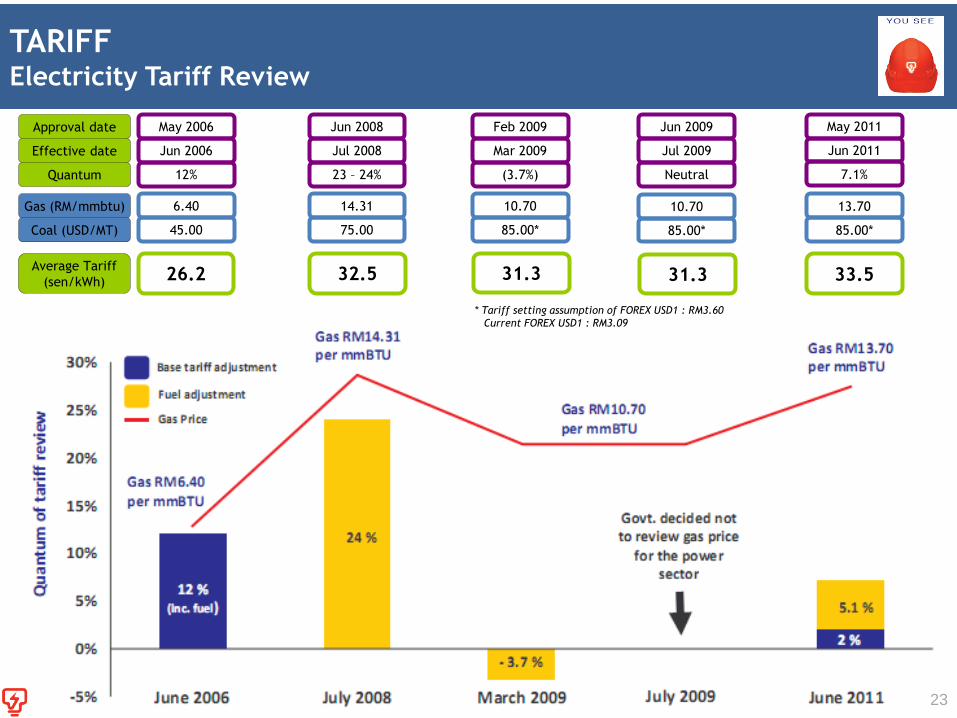
May 2006
Jun 2006
12%
6.40
45.00
Jun 2008
Jul 2008
23 – 24%
14.31
75.00
Feb 2009
Mar 2009
(3.7%)
10.70
85.00*
Jun 2009
Jul 2009
Neutral
10.70
85.00*
Approval date
Effective date
Quantum
Gas (RM/mmbtu)
Coal (USD/MT)
May 2011
Jun 2011
7.1%
13.70
85.00*
26.2 Average Tariff
(sen/kWh) 32.5 31.3 31.3 33.5
TARIFF Electricity Tariff Review
23
* Tariff setting assumption of FOREX USD1 : RM3.60
Current FOREX USD1 : RM3.09
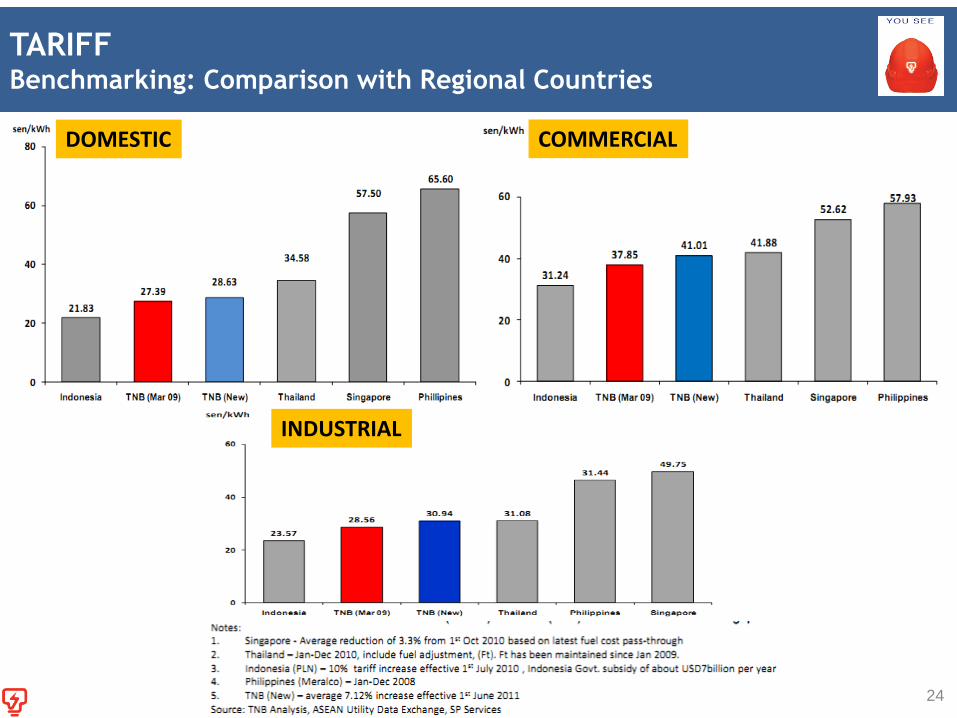
TARIFF Benchmarking: Comparison with Regional Countries
DOMESTIC COMMERCIAL
INDUSTRIAL
24
DIVIDEND 5
25
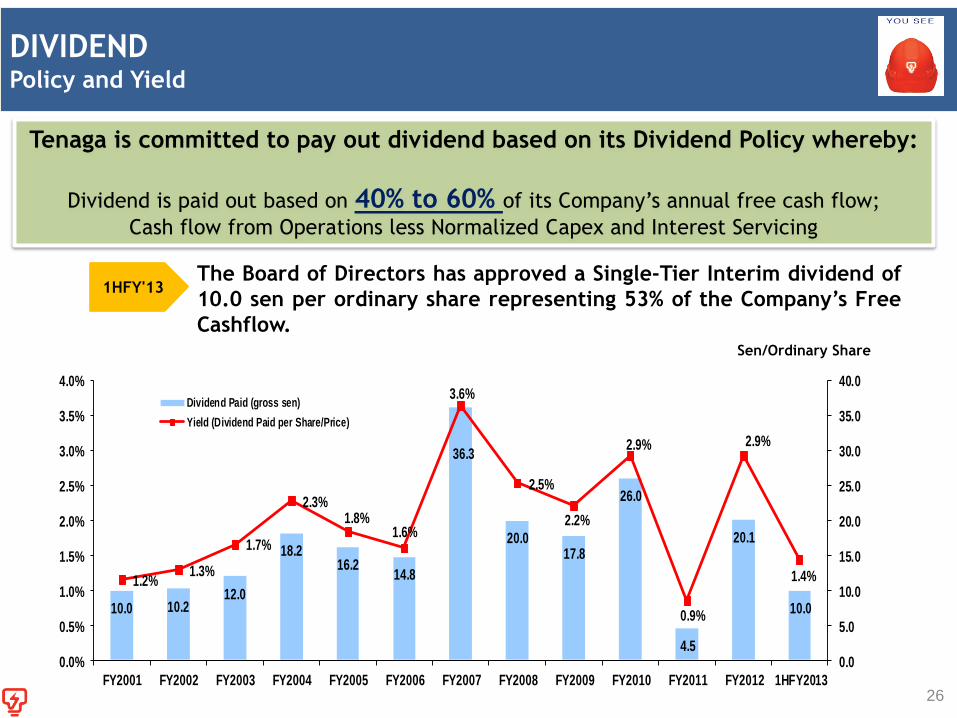
DIVIDEND Policy and Yield
Tenaga is committed to pay out dividend based on its Dividend Policy whereby:
Dividend is paid out based on 40% to 60% of its Company’s annual free cash flow;
Cash flow from Operations less Normalized Capex and Interest Servicing
10.0 10.212.0
18.216.2
14.8
36.3
20.017.8
26.0
4.5
20.1
10.0
1.2%1.3%
1.7%
2.3%1.8%
1.6%
3.6%
2.5%
2.2%
2.9%
0.9%
2.9%
1.4%
0.0
5.0
10.0
15.0
20.0
25.0
30.0
35.0
40.0
0.0%
0.5%
1.0%
1.5%
2.0%
2.5%
3.0%
3.5%
4.0%
FY2001 FY2002 FY2003 FY2004 FY2005 FY2006 FY2007 FY2008 FY2009 FY2010 FY2011 FY2012 1HFY2013
Dividend Paid (gross sen)
Yield (Dividend Paid per Share/Price)
s
Sen/Ordinary Share
The Board of Directors has approved a Single-Tier Interim dividend of
10.0 sen per ordinary share representing 53% of the Company‟s Free
Cashflow.
1HFY'13
26

OUTLOOK – KEY TAKEAWAYS 6
27
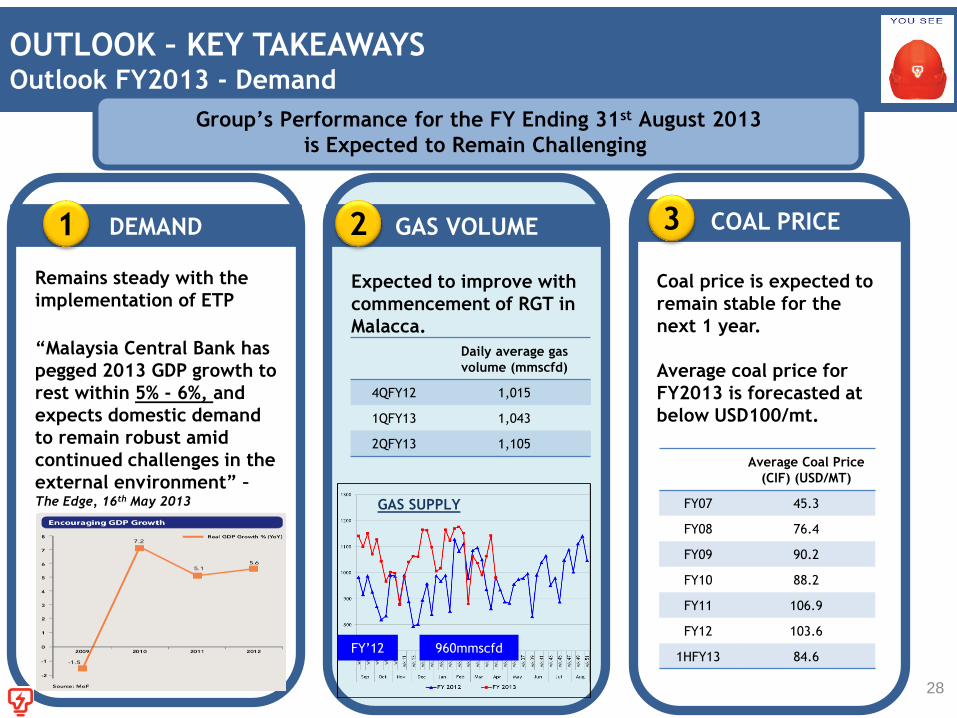
Expected to improve with
commencement of RGT in
Malacca.
Remains steady with the
implementation of ETP
“Malaysia Central Bank has
pegged 2013 GDP growth to
rest within 5% - 6%, and
expects domestic demand
to remain robust amid
continued challenges in the
external environment” – The Edge, 16th May 2013
DEMAND
OUTLOOK – KEY TAKEAWAYS Outlook FY2013 - Demand
Group‟s Performance for the FY Ending 31st August 2013
is Expected to Remain Challenging
28
1
Coal price is expected to
remain stable for the
next 1 year.
Average coal price for
FY2013 is forecasted at
below USD100/mt.
COAL PRICE 3 GAS VOLUME
Daily average gas
volume (mmscfd)
4QFY12 1,015
1QFY13 1,043
2QFY13 1,105
2
Average Coal Price
(CIF) (USD/MT)
FY07 45.3
FY08 76.4
FY09 90.2
FY10 88.2
FY11 106.9
FY12 103.6
1HFY13 84.6
GAS SUPPLY
960mmscfd FY’12
PART TWO
29
INVEST MALAYSIA 2013
1HFY2013 RESULTS HIGHLIGHTS
30
INVEST MALAYSIA 2013
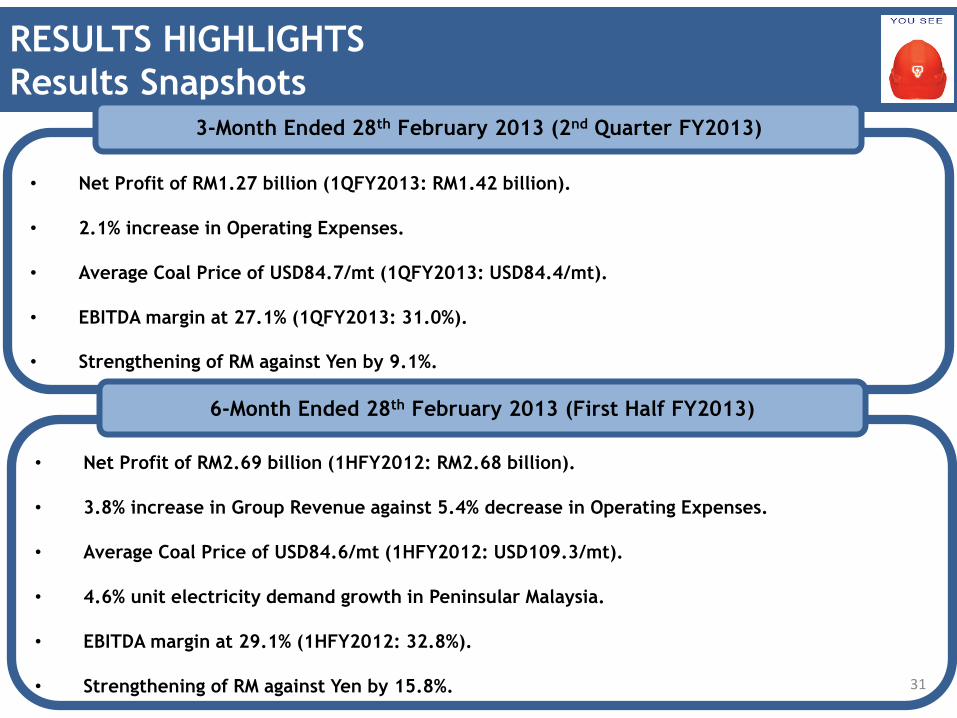
RESULTS HIGHLIGHTS
Results Snapshots
• Net Profit of RM1.27 billion (1QFY2013: RM1.42 billion).
• 2.1% increase in Operating Expenses.
• Average Coal Price of USD84.7/mt (1QFY2013: USD84.4/mt).
• EBITDA margin at 27.1% (1QFY2013: 31.0%).
• Strengthening of RM against Yen by 9.1%.
3-Month Ended 28th February 2013 (2nd Quarter FY2013)
• Net Profit of RM2.69 billion (1HFY2012: RM2.68 billion).
• 3.8% increase in Group Revenue against 5.4% decrease in Operating Expenses.
• Average Coal Price of USD84.6/mt (1HFY2012: USD109.3/mt).
• 4.6% unit electricity demand growth in Peninsular Malaysia.
• EBITDA margin at 29.1% (1HFY2012: 32.8%).
• Strengthening of RM against Yen by 15.8%.
6-Month Ended 28th February 2013 (First Half FY2013)
31
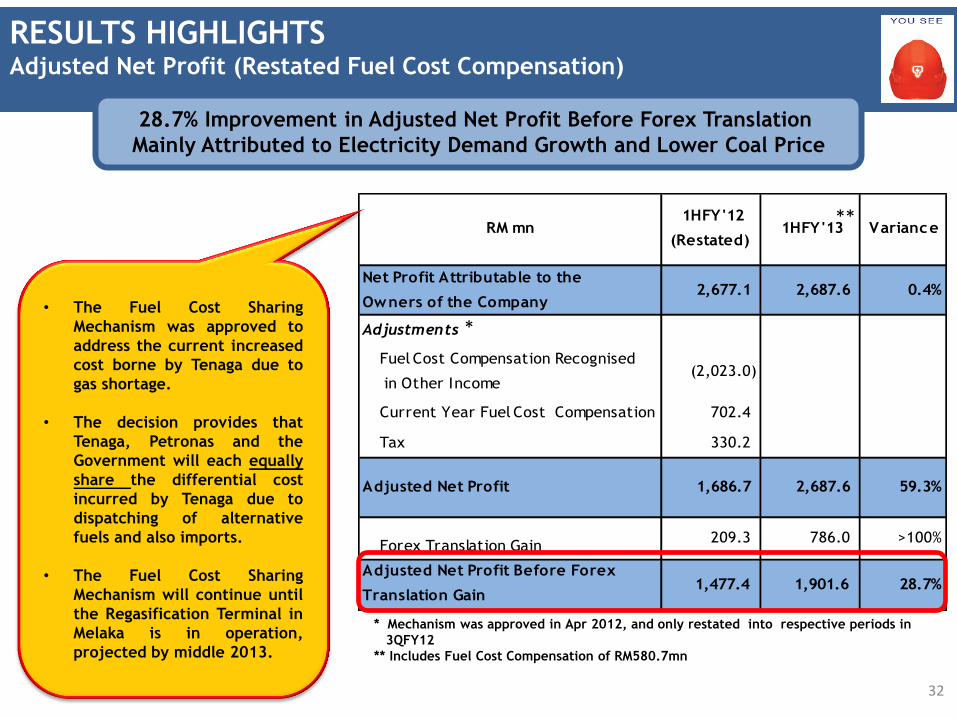
RESULTS HIGHLIGHTS Adjusted Net Profit (Restated Fuel Cost Compensation)
28.7% Improvement in Adjusted Net Profit Before Forex Translation
Mainly Attributed to Electricity Demand Growth and Lower Coal Price
Net Profit Attributable to the
Owners of the Company 2,677.1 2,687.6 0.4%
Adjustments
Fuel Cost Compensation Recognised
in Other Income(2,023.0)
Current Year Fuel Cost Compensation 702.4
Tax 330.2
Adjusted Net Profit 1,686.7 2,687.6 59.3%
Forex Translation Gain209.3 786.0 >100%
Adjusted Net Profit Before Forex
Translation Gain 1,477.4 1,901.6 28.7%
RM mn Variance 1HFY'12
(Restated) 1HFY'13
32
**
* Mechanism was approved in Apr 2012, and only restated into respective periods in
3QFY12
** Includes Fuel Cost Compensation of RM580.7mn
* • The Fuel Cost Sharing
Mechanism was approved to
address the current increased
cost borne by Tenaga due to
gas shortage.
• The decision provides that
Tenaga, Petronas and the
Government will each equally
share the differential cost
incurred by Tenaga due to
dispatching of alternative
fuels and also imports.
• The Fuel Cost Sharing
Mechanism will continue until
the Regasification Terminal in
Melaka is in operation,
projected by middle 2013.
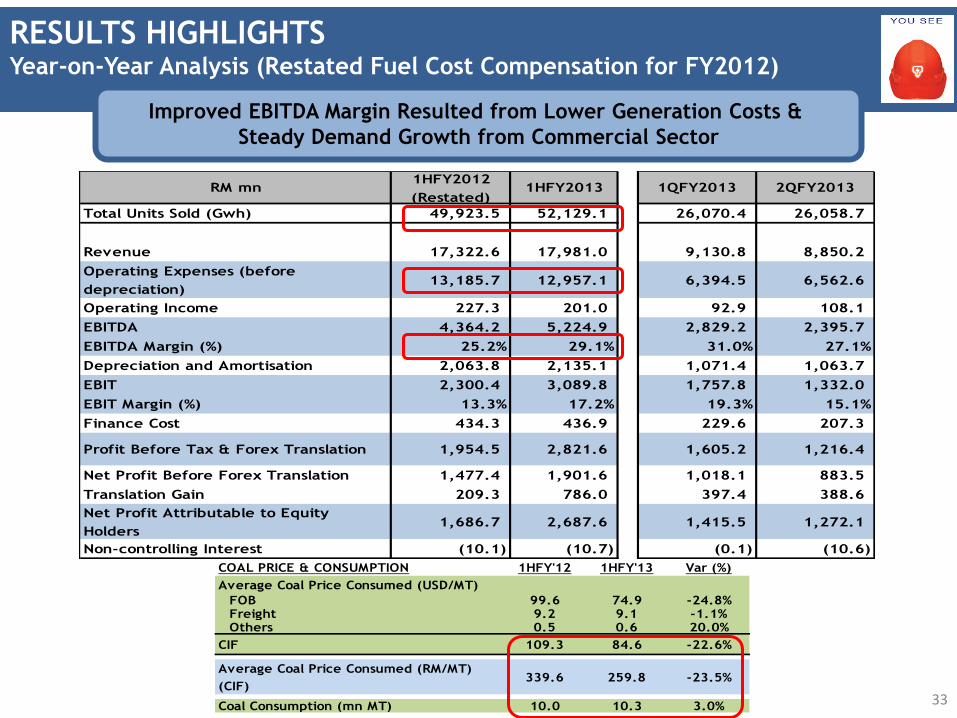
COAL PRICE & CONSUMPTION 1HFY'12 1HFY'13 Var (%)
Average Coal Price Consumed (USD/MT)
FOB 99.6 74.9 -24.8%Freight 9.2 9.1 -1.1%Others 0.5 0.6 20.0%
CIF 109.3 84.6 -22.6%
Average Coal Price Consumed (RM/MT)
(CIF)339.6 259.8 -23.5%
Coal Consumption (mn MT) 10.0 10.3 3.0%33
RESULTS HIGHLIGHTS Year-on-Year Analysis (Restated Fuel Cost Compensation for FY2012)
Improved EBITDA Margin Resulted from Lower Generation Costs &
Steady Demand Growth from Commercial Sector
RM mn1HFY2012
(Restated)1HFY2013 1QFY2013 2QFY2013
Total Units Sold (Gwh) 49,923.5 52,129.1 26,070.4 26,058.7
Revenue 17,322.6 17,981.0 9,130.8 8,850.2
Operating Expenses (before
depreciation)13,185.7 12,957.1 6,394.5 6,562.6
Operating Income 227.3 201.0 92.9 108.1
EBITDA 4,364.2 5,224.9 2,829.2 2,395.7
EBITDA Margin (%) 25.2% 29.1% 31.0% 27.1%
Depreciation and Amortisation 2,063.8 2,135.1 1,071.4 1,063.7
EBIT 2,300.4 3,089.8 1,757.8 1,332.0
EBIT Margin (%) 13.3% 17.2% 19.3% 15.1%
Finance Cost 434.3 436.9 229.6 207.3
Profit Before Tax & Forex Translation 1,954.5 2,821.6 1,605.2 1,216.4
Net Profit Before Forex Translation 1,477.4 1,901.6 1,018.1 883.5
Translation Gain 209.3 786.0 397.4 388.6
Net Profit Attributable to Equity
Holders1,686.7 2,687.6 1,415.5 1,272.1
Non-controlling Interest (10.1) (10.7) (0.1) (10.6)
34
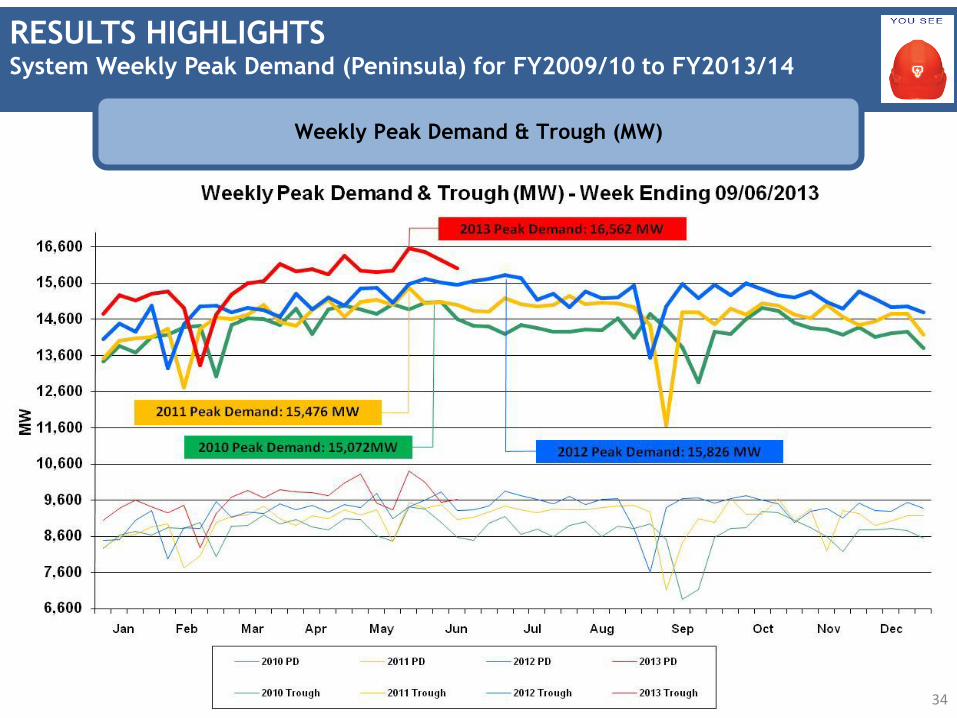
RESULTS HIGHLIGHTS System Weekly Peak Demand (Peninsula) for FY2009/10 to FY2013/14
Weekly Peak Demand & Trough (MW)
DISCLAIMER
All information contained herein is meant strictly for the use of this presentation only
and should not be used or relied on by any party for any other purpose and without the
prior written approval of TNB. The information contained herein is the property of
TNB and it is privileged and confidential in nature. TNB has the sole copyright to such
information and you are prohibited from disseminating, distributing, copying, re-
producing, using and/or disclosing this information.
CONTACT DETAILS
INVESTOR RELATIONS & MANAGEMENT
REPORTING DEPARTMENT
Tenaga Nasional Berhad
4th Floor, TNB Headquarters
No.129, Jalan Bangsar,
59200 Kuala Lumpur, MALAYSIA
Tel : +603 2296 5566
Fax : +603 2284 0095
Email : [email protected]
Website : www.tnb.com.my
For further enquiries, kindly contact us at:
IR OFFICERS:
Anida +603 2296 6077 [email protected]
Sherleen +603 2296 6183 [email protected]
Effa +603 2296 6647 [email protected]
Nadia +603 2296 6787 [email protected]

THANK YOU www.tnb.com.my