investigating approaches for balancing durability and
TRANSCRIPT

University of Texas at El Paso University of Texas at El Paso
ScholarWorks@UTEP ScholarWorks@UTEP
Open Access Theses & Dissertations
2020-01-01
Investigating Approaches For Balancing Durability And Stability Of Investigating Approaches For Balancing Durability And Stability Of
Asphalt Concrete Mixtures Asphalt Concrete Mixtures
Denis Iran Vieira Souza University of Texas at El Paso
Follow this and additional works at: https://scholarworks.utep.edu/open_etd
Part of the Transportation Commons
Recommended Citation Recommended Citation Vieira Souza, Denis Iran, "Investigating Approaches For Balancing Durability And Stability Of Asphalt Concrete Mixtures" (2020). Open Access Theses & Dissertations. 3203. https://scholarworks.utep.edu/open_etd/3203
This is brought to you for free and open access by ScholarWorks@UTEP. It has been accepted for inclusion in Open Access Theses & Dissertations by an authorized administrator of ScholarWorks@UTEP. For more information, please contact [email protected].

INVESTIGATING APPROACHES FOR BALANCING DURABILITY AND STABILITY OF
ASPHALT CONCRETE MIXTURES
DENIS IRAN VIEIRA SOUZA
Master’s Program in Civil Engineering
APPROVED:
Soheil Nazarian, Ph.D., Chair
Imad Abdallah, Ph.D.
Ramana Chintalapalle, Ph.D.
.
Stephen L. Crites, Jr., Ph.D.
Dean of the Graduate School

Copyright ©
by
Denis Iran Vieira Souza
2020

INVESTIGATING APPROACHES FOR BALANCING DURABILITY AND STABILITY OF
ASPHALT CONCRETE MIXTURES
by
DENIS IRAN VIEIRA SOUZA, BSCE
THESIS
Presented to the Faculty of the Graduate School of
The University of Texas at El Paso
in Partial Fulfillment
of the Requirements
for the Degree of
MASTER OF SCIENCE
Department of Civil Engineering
THE UNIVERSITY OF TEXAS AT EL PASO
December 2020

iv
ABSTRACT
Improving the durability and long-term performance of the asphalt concrete (AC) has
become a major concern, especially with the increase in the use of recycled materials, warm mix
asphalt additives and modified binders. To balance the mechanical properties durability and
stability of AC mixtures, mix design approaches that incorporate performance tests are needed.
This thesis presents an experimental evaluation of different mix design approaches to
balance the mechanical properties of AC mixtures. The current volumetric-based design method
was enhanced with performance-based analysis that specifies parameters from the overlay tester,
Hamburg wheel tracking device and indirect tension tests. Four typical Superpave mixes that
exhibited poor performance especially in cracking, from different plants were selected for this
evaluation. The mixtures were first designed following the current volumetric-based design
process and characterized under the proposed performance-based analysis. Two alternative
approaches that consider the influence of the asphalt content and aggregate gradation were
explored to improve the engineering behavior of the mixtures. From this evaluation, mixtures that
could potentially yield optimal volumetric and balanced mechanical properties were developed.
The optimization of the aggregate gradation is a promising approach to formulate a mixture with
balanced stability and durability as judged by its rutting and cracking potentials.
v
TABLE OF CONTENTS
ABSTRACT ............................................................................................................................. iv
TABLE OF CONTENTS ...........................................................................................................v
LIST OF TABLES .................................................................................................................. vii
LIST OF FIGURES ................................................................................................................ vii
LIST OF FIGURES ................................................................................................................. ix
CHAPTER 1 – INTRODUCTION ............................................................................................1
1.1 Research Gaps and Thesis Objectives .......................................................................1 1.2 Organization of Thesis ................................................................................................2
CHAPTER 2 – LITERATURE REVIEW .................................................................................4
2.1 Implementation of Superpave Design ......................................................................4
2.2 State of the Practice to Increase Asphalt Content of Asphalt Mixes .......................5
CHAPTER 3 – EXPERIMENT DESIGN AND RESEARCH METHODOLOGY ................11
3.1 Mix Design Characteristics ....................................................................................11
3.2 Performance Test Methods and Parameters ...........................................................12
CHAPTER 4 – ASSESMENT OF DESIGN APPROACHES FOR BALANCED MIX
DESIGN ..........................................................................................................................17
4.1 Evaluation of Volumetric Based Design with Performance Verification Approach
................................................................................................................................17
4.2 Evaluation of Performance Based Design Approach .............................................20
CHAPTER 5 – FORMULATION OF BALANCED MIX DESIGNS ....................................24
5.1 Alternative Approach to Increase Asphalt Content of Asphalt Mixtures ..............24
5.2 Plant 1 (Crack-Susceptible Mix Design) .............................................................264
5.3 Plant 2 (Unbalanced Mix Design)..........................................................................27
5.4 Plant 3 (Crack-susceptible Mix Design) ................................................................29
5.5 Plant 4 (Rut-susceptible Mix Design) ....................................................................31
5.6 Summary and Conclusions ....................................................................................33
CHAPTER 6 – INFLUENCE OF ESSENTIAL DESIGN VARIABLES ON
PERFORMANCE OF BALANCED MIX DESIGNS ...................................................35
6.1 Influence of Asphalt Binder Source .......................................................................35
vi
6.2 Influence of Performance Grade of Asphalt Binder ..............................................37
6.3 Influence of Recycled Material Content ................................................................40
6.4 Influence of Long-Term Aging ..............................................................................46
CHAPTER 7 – CONCLUSIONS AND RECOMMENDATIONS .........................................48
7.1 Conclusions ...............................................................................................................48
7.2 Recommendations .....................................................................................................50
REFERENCES ........................................................................................................................52
VITA ........................................................................................................................................54

vii
LIST OF TABLES
Table 2.1: California Requirements for Hamburg Test .................................................................. 9
Table 3.1: Summary of mix design information and pavement material characteristics.............. 11
Table 3.2: Hamburg Wheel Tracking (HWT) Test Requirements. .............................................. 14
Table 4.1: Summary of Volumetric Properties for TMD Mixtures. ............................................. 18
Table 4.2: Performance Test Results of Mixtures at Different Asphalt Contents. ....................... 22
Table 5.1: Influence of Aggregate Gradation on Volumetric Properties of Mixtures. ................. 25
Table 5.2: Volumetric and Performance Properties of Mixtures for Plant 1. ............................... 27
Table 5.3: Volumetric and Performance Properties of Mixtures for Plant 2. ............................... 28
Table 5.4: Volumetric and Performance Properties of Mixtures for Plant 3. ............................... 30
Table 5.5: Volumetric and Performance Properties of Mixtures for Plant 4. ............................... 32
Table 6.1: Volumetric and Performance Properties of Mixtures. ................................................. 40

viii
LIST OF FIGURES
Figure 2.1: Alternative Balanced AC Mix-Design Methodologies (Hall, 2016). ........................... 7
Figure 2.2: Balancing Rutting and Cracking Requirements (Zhou et al., 2014). ........................... 9
Figure 3.1: OT Device and Specimen Setup. ................................................................................ 13
Figure 3.2: HWT Device and Specimen Setup. ............................................................................ 14
Figure 3.3: IDEAL CT Device and Specimen Setup. ................................................................... 15
Figure 3.4: Performance Space Diagram for Balanced Mix Design. ........................................... 16
Figure 4.1: Particle Size Distribution of TMD Mixtures. ............................................................. 17
Figure 4.2: OT Test Results for TMD mixtures. .......................................................................... 18
Figure 4.3: HWT Test Results for TMD mixtures. ....................................................................... 19
Figure 4.4: Performance Space Diagram for TMD 1 and TMD 2 Mixtures. ............................... 20
Figure 4.5: Performance-Based Selection of Optimum Asphalt Content. .................................... 21
Figure 4.6: Altered Aggregate Gradations for TMD 1 Mixture. .................................................. 23
Figure 5.1: Altered Aggregate Gradations for TMD 1 Mixture. .................................................. 25
Figure 5.2: Comparison of Aggregate Gradations for Mixtures from Plant 1. ............................. 26
Figure 5.3: Performance Space Diagram for Mixtures from Plant 1. ........................................... 27
Figure 5.4: Comparison of Aggregate Gradations for Mixtures from Plant 2. ............................. 28
Figure 5.5: Performance Space Diagram for Mixtures from Plant 2. ........................................... 29
Figure 5.6: Comparison of Aggregate Gradations for Mixtures from Plant 3. ............................. 30
Figure 5.7: Performance Space Diagram for Mixtures from Plant 3. ........................................... 31
Figure 5.8: Comparison of Gradations for Mixtures from Plant 4. .............................................. 32
Figure 5.9: Performance Space Diagram for Mixtures from Plant 4. ........................................... 33
Figure 6.1: OT Test Results: Influence of Binder Source. ........................................................... 36
ix
Figure 6.2: HWT Test Results: Influence of Binder Source. ........................................................ 36
Figure 6.3: IDT Test Results: Influence of Binder Source. .......................................................... 36
Figure 6.4: Performance Space Diagram: Influence of Binder Source. ....................................... 37
Figure 6.5: OT Test Results: Influence of PG Binder. ................................................................. 38
Figure 6.6: HWT Test Results: Influence of PG Binder. .............................................................. 38
Figure 6.7: IDT Test Results: Influence of PG Binder. ................................................................ 39
Figure 6.8: IDT Test Results: Influence of PG Binder. ................................................................ 40
Figure 6.9: OT Test Results: Influence of RAP. ........................................................................... 41
Figure 6.10: HWT Test Results: Influence of RAP. ..................................................................... 41
Figure 6.11: IDT Test Results: Influence of RAP. ....................................................................... 42
Figure 6.12: Performance Space Diagram: Influence of RAP. ..................................................... 43
Figure 6.13: OT Test Results: Influence of RAS. ......................................................................... 44
Figure 6.14: HWT Test Results: Influence of RAS. ..................................................................... 44
Figure 6.15: IDT Test Results: Influence of RAS. ....................................................................... 45
Figure 6.16: Performance Space Diagram: Influence of RAS. ..................................................... 45
Figure 6.17: OT Test Results: Influence of Long-Term Aging. ................................................... 46
Figure 6.18: IDEAL CT Test Results: Influence of Long-Term Aging. ...................................... 47
1
CHAPTER 1 – INTRODUCTION
Improving the durability and long-term performance of the asphalt concrete has become a
challenge, especially with the increasing use of recycled materials, warm mix asphalt additives
and modified binders. Mix design approaches that incorporate performance tests are needed to
balance the mechanical properties, durability and stability, of asphalt mixtures.
The main objective of this thesis is to investigate the alternative mix design approaches
that can be readily implemented to develop balanced mix designs (BMDs). The current design
process for asphalt mixtures only relies on a volumetric-based analysis of the mix components
such as asphalt binder, aggregate particles distribution and air voids to determine the quality of the
final product. The volumetric- based analysis may not provide enough information related to the
engineering properties of the asphalt mixtures. With the advancement in designing asphalt
mixtures and acquired knowledge on pavement performance, a more engineered-based analysis
methodology can be incorporated into current practices to produce long-lasting mixtures and
flexible pavements. A comprehensive evaluation of current practices on producing BMDs with
balanced volumetric and engineering properties is carried out in this thesis.
1.1 RESEARCH GAPS AND THESIS OBJECTIVES
There are several limitations with current mix design methods as well as research gaps and
needs to implement a more performance-based design approach to produce BMD. Some of the
issues include 1) implementation of a mix design approach that incorporates performance test
methods, 2) the feasibility of meeting both volumetric and mechanical performance during the
design process, 3) the selection of reliable and consistent performance test methods, 4) the
influence of essential design variables such as binder source, PG binder, and recycled material
content and type, and 5) the formulation of durable and long-lasting mix designs following the
concept of BMD.
The objectives of this thesis study are to provide practical solutions and contribute to the
understanding of the following aspects of the BMD concept:

2
1. Practicality of implementing a mix design approach, volumetric-based design with
performance verification or performance-based design, to produce BMD mixtures.
2. Alternative approaches to develop asphalt mixtures that meet the volumetric and
mechanical requirements for BMD mixtures.
3. The role of aggregate gradation to improve durability and stability of asphalt
mixtures.
4. The implementation of a volumetric-based design with performance verification
approach that relies on the optimization of the aggregate gradation to produce BMD
mixtures.
5. Influence of design variables on the mechanical performance of TMD and BMD
mixtures.
1.2 ORGANIZATION OF THESIS
This thesis consists of seven chapters including this introductory chapter. The content of
these chapters is as follows:
1. Chapter 2 consists of a literature review on Superpave, state of practice to increase
asphalt content, departments of transportation approaches to improve mix design,
balanced mix design concept, and state of practice in balancing typical mix designs.
2. Chapter 3 describes the experiment design plan and research methodology
developed for this evaluation.
3. Chapter 4 presents a comparison of designing two asphalt mixtures following the
volumetric based design with performance verification and performance-based
design approaches.
4. Chapter 5 reports on the process to modify four typical mixtures to meet the
balanced mix design requirements using the volumetric design with performance
verifications approach.

3
5. Chapter 6 documents the results from evaluating the influence of essential design
variables such as binder source, PG binder, recycled material content and long-term
aging on performance of mixtures.
6. Chapter 7 provides a summary of research work, and conclusions drawn from this
study.
4
CHAPTER 2 – LITERATURE REVIEW
2.1. IMPLEMENTATION OF SUPERPAVE DESIGN
The Superpave design method, developed under the Strategic Highway Research Program
(SHRP), has been used widely to proportion pavement raw materials to produce asphalt mixtures
(Kennedy et al., 1994). Superpave relies on the volumetric properties and a target lab-molded
density for proportioning the combination of mineral aggregates and asphalt binder (McDaniel et
al., 2013). The difference between two volumetric properties, air void (Va) content and voids in
mineral aggregate (VMA), controls the calculation of asphalt content in the asphalt mixture. The
key to determining a mixture’s VMA is a precise determination of the total aggregate bulk specific
gravity (Gsb). However, there is a concern about whether the correct amount of asphalt binder is
used in the mix design due to the inherent variability and accuracy associated with calculation of
Gsb (West et al., 2018). The amount of asphalt binder is the primary driver of asphalt pavement
performance. Asphalt mixtures with excessive asphalt binder can experience premature permanent
deformation (i.e., rutting), while those with low asphalt binder content can experience premature
cracking and other durability related pavement distresses (Fee et al., 2018).
Since the early Superpave implementation focused primarily on improving the rutting
resistance by requiring a higher performance grade of asphalt binder and higher quality aggregates,
the rutting performance problems have been nearly eliminated (Tran et al., 2019). However, with
the increase in the use of recycled materials, additives and modified binders, there have been
growing concerns that cracking is now the primary mode of distress for asphalt mixtures
(Bonaquist et al., 2014). Many highway agencies and the asphalt paving industry are considering
incorporating performance tests for enhancing the mix design procedure and extending the service
life of asphalt pavements.
The following sections discuss common approaches followed by departments of
transportation (DOTs) to incorporate performance testing and mix design modifications to increase
the mixture’s asphalt content.

5
2.2 STATE OF PRACTICE TO INCREASE ASPHALT CONTENT OF ASPHALT MIXES
To enhance pavement durability and long-term performance, many DOTs have started to
modify their mix design specifications by focusing on increasing the asphalt content of an AC
mixture. Some of these modifications include lowering design air voids, lowering the number of
design gyrations (Ndesign), increasing the minimum VMA criteria and regressing air voids (West et
al., 2018).
Lowering the design air voids requires reducing the design air void content from 4.0% as
required in AASHTO M323 to 3.0% or 3.5% while maintain VMA constant. Several DOTs have
already started to decrease the design air voids specification with the goal of increasing the
mixture’s asphalt content (Tran et al., 2019).
Lowering Ndesign will generally result in an increase in the asphalt content of an AC mixture.
A number of studies indicated that the compaction efforts set by AASHTO R 35 were excessive
for the laboratory-compacted samples. Experimental data from many projects across the United
States showed that the levels of compaction achieved on Superpave Gyratory Compactor (SGC)
did not correspond to the ones in the pavement under the traffic (Prowell and Brown, 2007). Many
DOTs have started to reduce the compaction efforts during mix design to increase the asphalt
content (Maupin, 2003). Some of them obtained higher asphalt content and successful field
performance, while others reported that the increase in the asphalt content was not sustainable over
time (Tran et al., 2019). This phenomenon can be explained by the fact that contractors started to
adjust the gradations of their mix designs to meet the volumetric requirements without changing
the design asphalt content.
Increasing the minimum VMA requirement will consequently increase the optimum
asphalt content. A one-percent increase in VMA without changing the design air voids results in
approximately 0.4% to 0.5% higher design asphalt content (Tran et al., 2019). However, an
accurate calculation of the aggregate bulk specific gravity (Gsb) is necessary to obtain a realistic
increase in the asphalt content.

6
The air voids regression is a similar approach to lowering the design air voids. In this
approach, a mix is designed to meet all volumetric requirements including a target air void content
of 4.0%. The asphalt content is then increased to reach a reduced target air void content of 3.5%
or 3.0%. A 1% change in the design air voids with a constant VMA can increase the design asphalt
content by up to 0.5% (Tran et al., 2019). The main concern expressed by some states about this
approach is that with the random increase in asphalt content, the mixture may become susceptible
to rutting (West et al., 2018). Besides, even with the added binder the mixture may still not exhibit
acceptable cracking resistance.
2.2.1 Example of DOT Approaches to Improve Mix Designs
A survey by the AASHTO Subcommittee on Materials gathered information regarding
adjustments to the volumetric mix design system made by 26 DOTs (Aschenbrener, 2014). Seven
states have lowered their target design air voids, sixteen states decreased their Ndesign, and eight
states increased their minimum VMA requirements. One of the critical observations from that
study was that several states had implemented some of those approaches simultaneously with
satisfactory results. Although there was potential improvement in asphalt pavement performance,
it might have become more complex to determine which approach is the most effective.
2.2.2 Balanced Mix Design
The Superpave approach originally contained performance tests for verifying the
mechanical performance of asphalt mixtures. However, the associated performance testing was
never implemented. Performance tests have been used more frequently in the recent past due to
the attention paid to the concept of balanced mix design (BMD). BMD is defined by the Federal
Highway Administration (FHWA) Expert Task Group as (Cox et al., 2017):
“asphalt mix designed using performance tests on appropriately conditioned
specimens that address multiple modes of distresses taking into consideration mix
aging, traffic, climate, and location within the pavement structure”
7
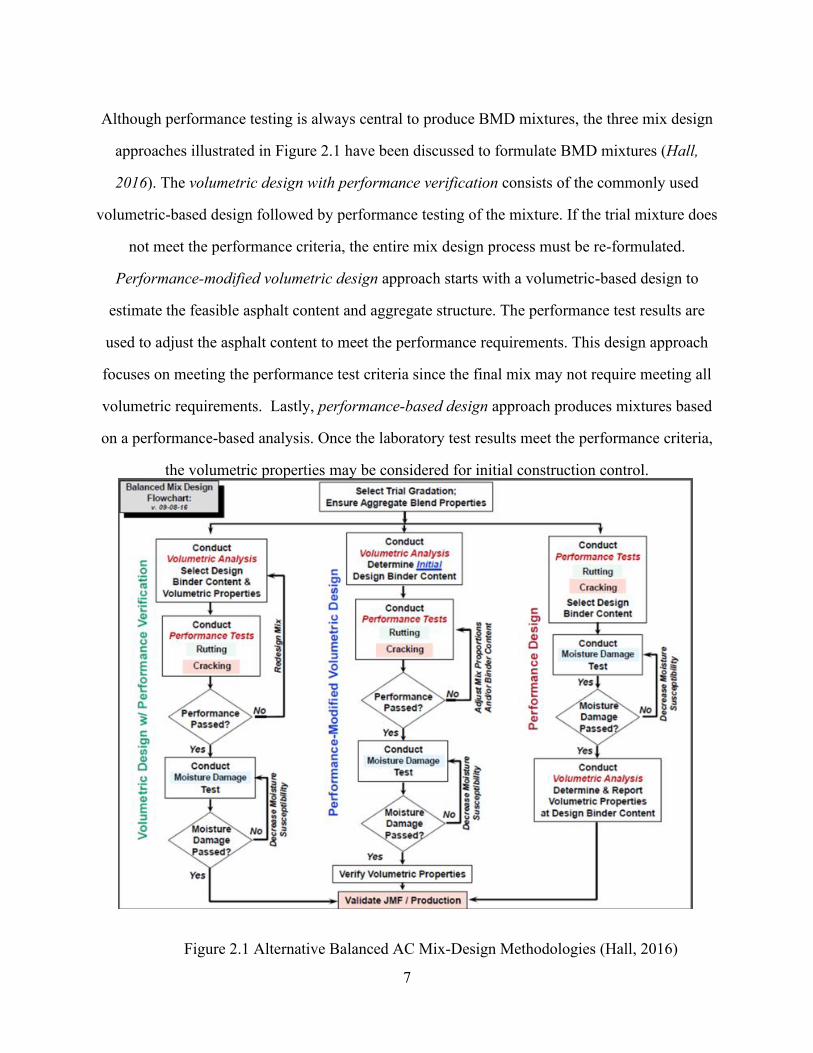
Although performance testing is always central to produce BMD mixtures, the three mix design
approaches illustrated in Figure 2.1 have been discussed to formulate BMD mixtures (Hall,
2016). The volumetric design with performance verification consists of the commonly used
volumetric-based design followed by performance testing of the mixture. If the trial mixture does
not meet the performance criteria, the entire mix design process must be re-formulated.
Performance-modified volumetric design approach starts with a volumetric-based design to
estimate the feasible asphalt content and aggregate structure. The performance test results are
used to adjust the asphalt content to meet the performance requirements. This design approach
focuses on meeting the performance test criteria since the final mix may not require meeting all
volumetric requirements. Lastly, performance-based design approach produces mixtures based
on a performance-based analysis. Once the laboratory test results meet the performance criteria,
the volumetric properties may be considered for initial construction control.
Figure 2.1 Alternative Balanced AC Mix-Design Methodologies (Hall, 2016)
8
An asphalt mixture must exhibit adequate rutting and cracking resistance to perform
satisfactorily in the field (Cooper et al., 2014). Several performance test methods have been
proposed for this purpose (e.g., Zhou et al., 2006; Al Qadi et al., 2015; Garcia et al., 2016). The
rutting resistance of asphalt mixtures has been commonly estimated using either the Hamburg
wheel-tracking (HWT), asphalt pavement analyzer (APA) or permanent deformation tests. The
cracking potential of asphalt mixtures can be estimated with a variety of test methods including
the overlay tester (OT), semi-circular bending (SCB), disk-shaped compact tension (DCT),
indirect tensile strength (IDT) (Newcomb et al., 2018). Zhou et al. (2006) recommended using the
OT and HWT tests to determine the cracking and rutting potentials of asphalt mixtures, while
Cooper et al. (2014) proposed the energy release rate parameter from the SCB and HWT tests. Al-
Qadi et al. (2015) proposed the HWT test and flexibility index from the SCB tests. Buttlar et al.
(2017) utilized the disk-shaped compact tension (DCT) and HWT tests.
2.2.4 State of the Practice in Balanced Mix Design
2.2.4.1 Texas Department of Transportation (TxDOT)
The BMD concept was investigated by the Texas Transportation Institution (TTI)
researchers using the HWT and OT tests. The HWT test is used to evaluate the rutting resistance
and moisture sensitivity and the OT test is used to assess the cracking resistance of asphalt
mixtures. This approach sets a maximum asphalt content where the rutting criterion is exceeded
and a minimum asphalt content by the cracking criterion’s failure point as shown in Figure 2.2.
An asphalt content that lies between the minimum and maximum will represent the optimum
asphalt content for a balanced mixture. For most mixtures, it is possible to find a range where both
rutting and cracking criterion are satisfied, but if a binder and aggregate combination do not pass
the performance testing criteria, the volumetric design must be re-formulated (Zhou et al., 2014).
TxDOT currently uses the volumetric design with performance verification approach. Further
research is needed to fully implement a performance-based approach.

9
Figure 2.2 Balancing Rutting and Cracking Requirements (Zhou et al., 2014)
2.2.4.2 California Department of Transportation (Caltrans)
Caltrans uses performance-based specifications (PBS) and CalME (Caltrans’ Mechanistic
Empirical Design Program) to carry out a mix design. Performance testing includes repeated shear
(AASHTO T 320), bending beam fatigue (AASHTO T 321) and HWT tests (AASHTO T 324). A
short-term conditioning protocol of four hours at 135°C is required for repeated shear and HWT
tests. Tsai et al. (2012) proposed the procedure for establishing the specification limits. To select
specification limits the 95% confidence interval for the specific property based on replicate tests
is used. A 95% of the risk of laboratory test variability is accepted by Caltrans. Up to now, seven
interstate projects have been built with this approach. The current HWTT requirement for each
binder PG is shown in Table 2.1.
Table 2.1 California Requirements for Hamburg Test (Caltrans, 2015)
High-Temperature
Performance Grade
Minimum Passes to 0.5-inch
Rut Depth
Minimum Passes at the
Inflection Point
PG 58 10,000 10,000
PG 64 15,000 10,000
PG 70 20,000 12,500

10
PG 76 or Higher 25,000 15,000
2.2.4.3 Illinois Department of Transportation (IDOT)
The Illinois DOT uses the volumetric design with performance verification approach with
two laboratory performance tests (Al-Qadi et al., 2015). IDOT approach integrates the HWT and
I-FIT SCB tests to evaluate rutting and cracking resistance. The initial cracking acceptance limits
have been proposed based on the I-FIT tests conducted for different types of mixtures and the
correlation to field cracking performance. To satisfy the performance criteria, there can be
adjustments in the asphalt binder content, the asphalt binder source and amounts of recycled
materials. However, final mix design must meet the volumetric properties requirement from
Superpave.
2.2.4.4 Louisiana Department of Transportation and Development (LADOTD)
LADOTD has complemented the volumetric design criteria with performance tests such as
the HWT and SCB (AASHTO TP105-13) tests. Historically, Louisiana mixtures are typically
considered crack susceptible. The design approach to improve mixture’s performance generally
focuses on increasing the mixture’s asphalt content. Additionally, LADOTD changed their
specification requirements in 2013 to lower the number of gyrations at Ndesign and to increase the
minimum VMA requirements (Cooper et al., 2014).
2.2.4.5 Wisconsin Department of Transportation (WisDOT)
The Wisconsin DOT in association with the Wisconsin Asphalt Producers Association
developed specifications to pilot the use of performance tests for mixtures with higher recycled
materials content (Hanz et al., 2017). Following the BMD concept, the HWT test was selected to
address the rutting resistance and moisture sensitivity, DCT test for low temperature cracking and
SCB test for fatigue cracking. PG grading of the recovered asphalt binder was also required.
Additionally, for some pilot projects, WisDOT reduced the mix design air void target from 4.0%
to 3.5%.

11
CHAPTER 3 – EXPERIMENT DESIGN AND RESEARCH
METHODOLOGY
3.1 MIX DESIGN CHARACTERISTICS
Four mixes from different regions were included in this evaluation. The mix from Plant 1
(hereafter referred to as “TMD 1”) exhibited poor cracking properties, the mix design from Plant
2 (hereafter referred to as “TMD 2”) exhibited poor cracking and rutting properties, the mix design
from Plant 3 (hereafter referred to as “TMD 3”) exhibited poor cracking properties and the mix
design from Plant 4 (hereafter referred to as “TMD 4”) exhibited poor rutting properties. The
asphalt mixtures were Superpave mixes with a nominal maximum aggregate size (NMAS) of 12.5
mm (1/2 in., designated as SP-C). The mixes were originally designed following the volumetric-
based design process and criteria for a SP C mix as specified in TxDOT Item 344 specification
(similar to AASHTO M 323). Detailed mix design information including binder performance
grade (PG), number of gyrations, aggregate type and recycled material content is summarized in
Table 3.1.
Table 3.1 Summary of mix design information and pavement material characteristics
Parameters TMD 1 TMD 2 TMD 3 TMD 4
Design
Informatio
n
NMAS 12.5 mm (1/2”)
Specified Binder
PG PG 70-22 PG 64-22 PG 58-28
Number of
Gyrations 50 75 50
Target Density,
% 96
Aggregates
Types
Granite/Dolomiti
c-Limestone Soft Limestone Granite/ Dolomitic-Limestone
RAP, % 16 20 20 10
RAS, % - - - 3
RAP asphalt
content, % 5.9 4.2 4.6 6.6
RAS asphalt
content, % - - - 20.4

12
Two mix design approaches described in Chapter 2 (i.e., volumetric based design with
performance verification, and performance-based design) were evaluated to produce BMD
mixtures using typical pavement materials.
3.2 PERFORMANCE TEST METHODS AND PARAMETERS
TxDOT specifications recommends the OT, HWT and IDEAL CT tests to estimate the
cracking and rutting properties of asphalt mixtures, respectively. These test methods are outlined
in TxDOT test procedures Tex-248-F, Tex-242-F, and Tex-250-F, respectively, and are briefly
discussed in the following sections. Four specimens were tested to account for the variability of
the OT and IDEAL CT tests results. Descriptive statistical parameters such as average, standard
deviation, and coefficient of variation (COV) were calculated to assess the consistency of the test
results. Only one set of HWT specimens was tested for rutting potential characterization.
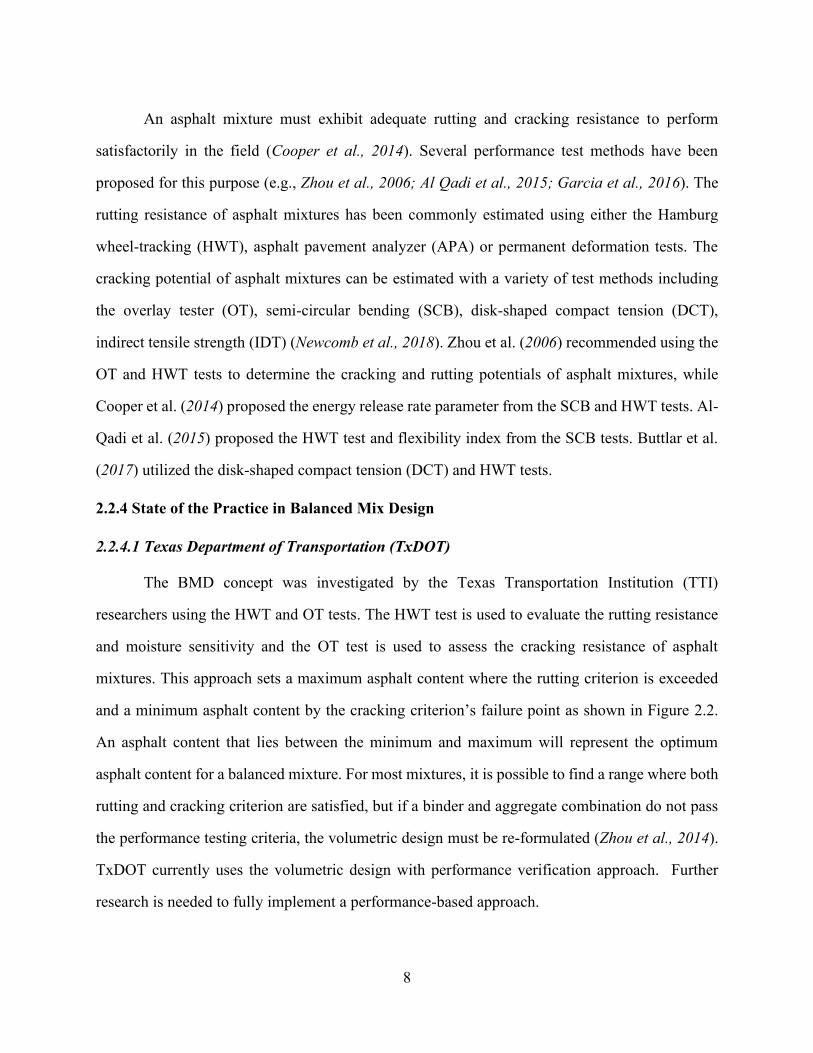
3.2.1 Texas Overlay Tester (OT) Test
The Overlay tester test can be seen in Figure 3.1 along with an insight of the actual test
specimen being placed for testing. The OT test is conducted in a displacement control mode at a
loading rate of one cycle per 10 sec. The movement of the sliding platen follows a cyclic triangular
waveform at a test temperature of 77ºF (25ºC). The OT specimens are nominally 6 in. (150 mm)
long, 3 in. (75 mm) wide and 1.5 in. (38 mm) thick compacted to nominal target air voids of
7±1.0%. The crack progression rate (CPR) parameter from the OT test was used in this study
(Garcia et al., 2016). CPR represents the flexibility of the mixture to attenuate the propagation of
a crack. The acceptance limit for CPR was selected as 0.45 for Superpave mixtures.
13
Figure 3.1 OT Device and Specimen Setup
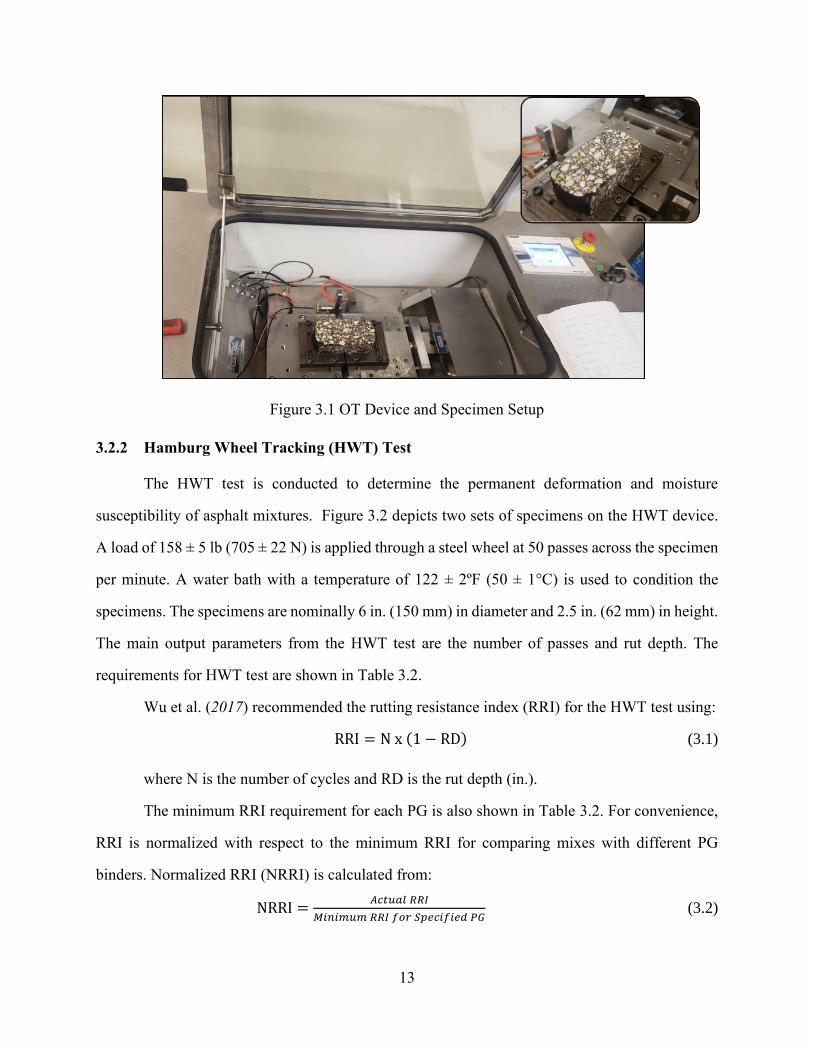
3.2.2 Hamburg Wheel Tracking (HWT) Test
The HWT test is conducted to determine the permanent deformation and moisture
susceptibility of asphalt mixtures. Figure 3.2 depicts two sets of specimens on the HWT device.
A load of 158 ± 5 lb (705 ± 22 N) is applied through a steel wheel at 50 passes across the specimen
per minute. A water bath with a temperature of 122 ± 2ºF (50 ± 1°C) is used to condition the
specimens. The specimens are nominally 6 in. (150 mm) in diameter and 2.5 in. (62 mm) in height.
The main output parameters from the HWT test are the number of passes and rut depth. The
requirements for HWT test are shown in Table 3.2.
Wu et al. (2017) recommended the rutting resistance index (RRI) for the HWT test using:
RRI = N x (1 − RD) (3.1)
where N is the number of cycles and RD is the rut depth (in.).
The minimum RRI requirement for each PG is also shown in Table 3.2. For convenience,
RRI is normalized with respect to the minimum RRI for comparing mixes with different PG
binders. Normalized RRI (NRRI) is calculated from:
NRRI =𝐴𝑐𝑡𝑢𝑎𝑙 𝑅𝑅𝐼
𝑀𝑖𝑛𝑖𝑚𝑢𝑚 𝑅𝑅𝐼 𝑓𝑜𝑟 𝑆𝑝𝑒𝑐𝑖𝑓𝑖𝑒𝑑 𝑃𝐺 (3.2)

14
NRRI of unity or greater means an acceptable mix in terms of rutting.
Figure 3.2 HWT Device and Specimen Setup
Table 3.2 Hamburg Wheel Tracking (HWT) Test Requirements
High-Temperature
Performance Grade Minimum Number of Passes Minimum RRI
PG 58 5,000 2,600
PG 64 10,000 5,100
PG 70 15,000 7,600
PG 76 20,000 10,100
PG = performance grade; RRI=rutting resistance index
3.2.3 IDEAL CT Test
The IDEAL CT specimens, which are nominally 6 in. (150 mm) in diameter and 2.4 in. (62
mm) in height, are placed in an environmental controlled chamber at a temperature of 77 ºF (25
ºC) for preconditioning before testing. The IDEAL CT test is performed on a displacement-
controlled mode at a rate of 2 in./min (50 mm/min) until the specimen completely fractures.
During the overall testing period, the time, load, and displacement are recorded. A universal testing
frame was used for application of the load, whereas an IDEAL- CT jig was used for testing as can
be seen in Figure 3.3.

15
Figure 3.3 IDEAL CT Device and Specimen Setup
The work of failure (Wf) can be calculated as the area under the load versus displacement
curve. The failure energy (Gf) can be evaluated using the work of failure and the cross-sectional
area of the specimen using:
Gf =Wf
Dt (3.3)
where t and D are the thickness and diameter of the specimen, respectively.
Eventually, the cracking tolerance index (CT Index) is calculated using the parameters
obtained from the load-displacement curve Zhou et al. (2017) using:
CTIndex =t
2.4×
l75
D×
Gf
|m75|× 106 (3.4)
where, |m75| is the absolute value of the post-peak slope and l75 is the associated displacement
at 75% of the peak load located after the peak.

16
3.2.4 Performance Space Diagram
The performance space diagram provides a multifaceted analysis of the mechanical
properties of mixtures in terms of cracking, rutting and toughness. As shown in Figure 3.4, CPR
from OT test is plotted on the abscissa with a corresponding acceptance limit of 0.45, while NRRI
from HWT test is plotted on the ordinance with an acceptance limit of 1.0. The CT Index is shown
as a data label.
Figure 3.4 Performance Space Diagram for Balanced Mix Design
Asphalt mixtures can be preliminarily divided into the following four general categories:
Quadrant 1: Acceptable cracking resistance (flexible) and rutting resistance (rigid).
Quadrant 2: Poor cracking resistance (brittle) and good rutting resistance (rigid).
Quadrant 3: Acceptable cracking resistance (flexible) but poor rutting resistance (unstable).
Quadrant 4: Poor cracking resistance (brittle) and rutting resistance (unstable).
0.45
1.0
Norm
ali
zed
RR
I
Crack Progression Rate
OT Limit HWT Limit
Quadrant 4Quadrant 3
Quadrant 2Rig
idU
nst
ab
le
Brittle Flexible
Quadrant 1
(Balance Mix)
17
CHAPTER 4 - ASSESMENT OF DESIGN APPROACHES FOR
BALANCED MIX DESIGN
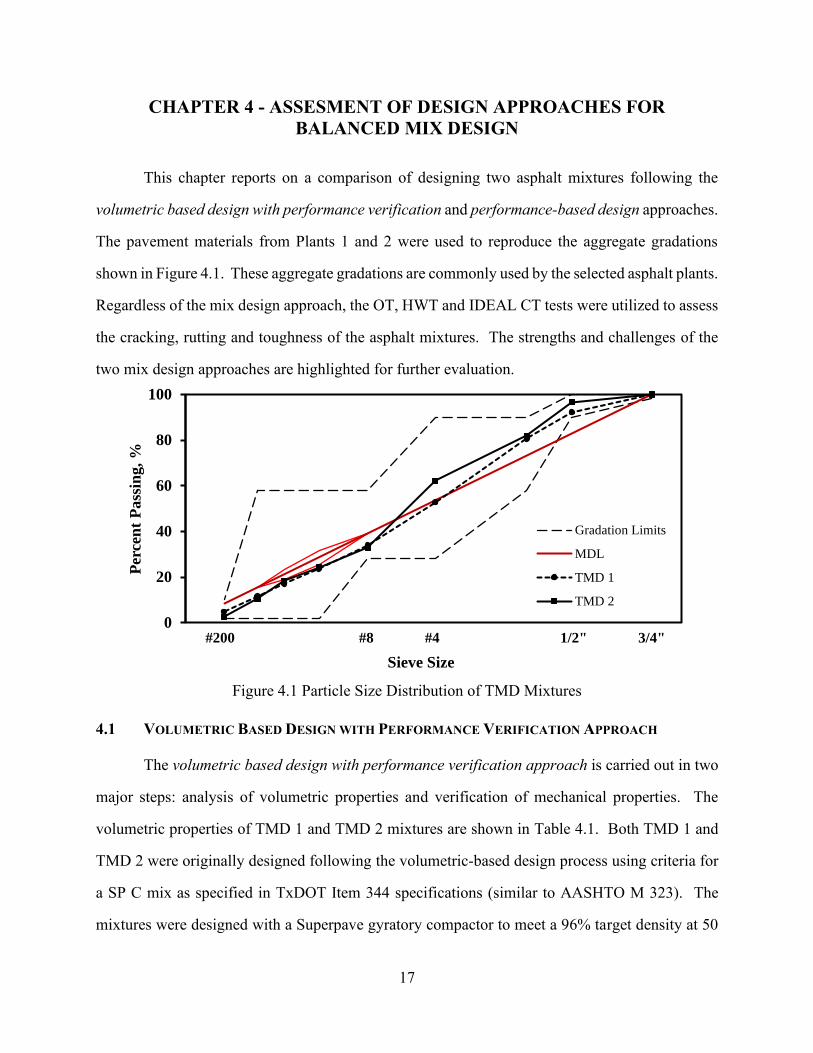
This chapter reports on a comparison of designing two asphalt mixtures following the
volumetric based design with performance verification and performance-based design approaches.
The pavement materials from Plants 1 and 2 were used to reproduce the aggregate gradations
shown in Figure 4.1. These aggregate gradations are commonly used by the selected asphalt plants.
Regardless of the mix design approach, the OT, HWT and IDEAL CT tests were utilized to assess
the cracking, rutting and toughness of the asphalt mixtures. The strengths and challenges of the
two mix design approaches are highlighted for further evaluation.
Figure 4.1 Particle Size Distribution of TMD Mixtures
4.1 VOLUMETRIC BASED DESIGN WITH PERFORMANCE VERIFICATION APPROACH
The volumetric based design with performance verification approach is carried out in two
major steps: analysis of volumetric properties and verification of mechanical properties. The
volumetric properties of TMD 1 and TMD 2 mixtures are shown in Table 4.1. Both TMD 1 and
TMD 2 were originally designed following the volumetric-based design process using criteria for
a SP C mix as specified in TxDOT Item 344 specifications (similar to AASHTO M 323). The
mixtures were designed with a Superpave gyratory compactor to meet a 96% target density at 50
0
20
40
60
80
100
Per
cen
t P
ass
ing, %
Sieve Size
Gradation Limits
MDL
TMD 1
TMD 2
#200 #8 #4 1/2" 3/4"

18
gyrations (Ndesign). The OAC for TMD 1 was determined to be 4.7%, while TMD 2 yielded an
OAC of 4.6%. The VMA for TMD 1 was determined to be 15%, while TMD 2 yielded a VMA of
14.7%. Only TMD 1 met the minimum VMA requirement of 15%.
Table 4.1 - Summary of Volumetric Properties for TMD Mixtures
Parameters TMD 1 TMD 2
Volumetric
Properties
Optimum Asphalt Content, % 4.7 4.6
Voids in Mineral Aggregates, % 15.0 14.7
Bulk Specific Gravity 2.369 2.379
Maximum Specific Gravity 2.470 2.486
Recycled Binder Ratio 19.1 18.7
Although the aggregate gradation for TMD 2 would need to be adjusted to meet the
minimum VMA requirement, performance testing was still performed for both TMD mixtures.
Figure 4.2 depicts the CPR values from the OT tests for the two TMD mixtures. Based on the
COVs shown as data labels the OT test yielded consistent results with acceptable variability (COV
< 20%). From the OT test results, TMD 1 yielded an average CPR of 0.57, which is greater than
the maximum acceptance limit of 0.45. TMD 2 yielded an average CPR of 0.49, which is also
greater than the maximum acceptance limit of 0.45. TMD 1 and TMD 2 can be considered cracking
susceptible mixtures.
Figure 4.2 OT Test Results for TMD mixtures
17%15%
0
0.15
0.3
0.45
0.6
0.75
0.9
TMD 1 TMD 2
Cra
ck P
rogre
ssio
n R
ate
Acceptance Limit

19
The HWT test results are presented in Figure 4.3. The minimum RRI for mixtures designed
with PG 70-22 binder is 7600. NRRI is reflected as a data label. TMD 1 yielded an RRI of 14881
and TMD 2 yielded an RRI of 5481. TMD 1 satisfactorily met the rutting requirements, while
TMD 2 did not pass the rutting requirement for a PG 70-22 binder.
Figure 4.3 HWT Test Results for TMD mixtures
The mechanical properties of the TMD mixtures are presented in the performance
interaction diagram in Figure 4.4. As a reference, CT index is shown as a data label. TMD 1
exhibited satisfactory rutting resistance with a NRRI of 1.9 but poor cracking resistance as
discussed before. Therefore, TMD 1 is categorized as a crack-susceptible mix design. TMD 2 did
not meet the minimum performance requirement for HWT test with a NRRI of 0.72 and yielded a
CPR of 0.49. Therefore, TMD 2 is categorized as a rut- and crack-susceptible mix design. Based
on CT index values of 65 and 22, TMD 1 and TMD 2 mixtures are also both crack suspectable.
1.9
0.7
0
5000
10000
15000
20000
TMD 1 TMD 2
RR
I
Acceptance Limit

20
Figure 4.4 Performance Space Diagram for TMD 1 and TMD 2 Mixtures
4.2 PERFORMANCE BASED DESIGN APPROACH
As part of the performance-based design approach, the main step to select a mixture is by
conducting performing tests at different asphalt contents. The optimum asphalt content (OAC) is
then selected based on the performance requirements of the test methods. Laboratory specimens
for OT and HWT tests were prepared at four asphalt contents including OAC, OAC-0.5%,
OAC+0.5% and OAC+1.0%. The main performance indices from the performance tests are
plotted against the asphalt content in Figure 4.5.
Figure 4.5a presents the variations of the CPR and NRRI with respect to asphalt content
for TMD 1. Even though NRRI decreased from 2.3 to 1.8 as the asphalt content increased,
specimens prepared with all four asphalt contents met the minimum performance requirements for
HWT test. CPR decreased from 0.97 to 0.42 as the asphalt content increased. Only specimens at
OAC+1.0% (5.7%) passed the OT test requirements of 0.45 or less.
65
22
0
0.5
1
1.5
2
2.5
0 0.25 0.5 0.75 1
NR
RI
Crack Progession Rate
Acceptance Limit TMD 1 TMD 2

21
Figure 4.5 Performance-Based Selection of Optimum Asphalt Content
Similar information is shown in Figure 4.5b for TMD 2. Again, specimens at OAC+1.0%
(5.6%) met the performance requirements for OT and HWT tests. The increase in NRRI for
specimens at OAC+1.0% might be explained by the fact that when there is enough binder in the
mixture, the aggregates are protected by a binder film thickness that reduces the aggregate crushing
under the HWT test. To produce a mix with balanced cracking and rutting potentials, TMD 1 and
TMD 2 must contain a minimum asphalt content of 5.3% and 5.2%, respectively, as illustrated by
the shaded regions in Figure 4.5.
A summary of the results from the performance test methods for TMD 1 and TMD 2 is
presented in Table 4.2. The OT test results yielded COVs less than 25%, except for TMD 2
OAC0
1
2
3
4
0
0.45
0.9
1.35
1.8
4.0% 4.5% 5.0% 5.5% 6.0%
NR
RI
CP
R
Asphalt Content
a) Plant 1 CPR
CPR Limit
NRRI
NRRI Limit
OAC0
1
2
3
4
0
0.45
0.9
1.35
1.8
4.0% 4.5% 5.0% 5.5% 6.0%
NR
RI
CP
R
Asphalt Content
b) Plant 2CPR
CPR Limit
NRRI
NRRI Limit

22
produced at OAC-0.5% (4.1%), which was a very stiff mixture. The COVs for IDT tests were
between 25% and 10%.
Table 4.2 Performance Test Results of Mixtures at Different Asphalt Contents
Mix Parameters OAC-
0.5 OAC OAC+0.5 OAC+1
Asphalt Content 4.2% 4.7% 5.2% 5.7%
TMD 1
OT CPR Avg. 0.97 0.57 0.53 0.42
COV 25% 17% 23% 10%
HWT RRI RRI 17283 14811 14677 9278
NRRI 2.3 1.9 1.9 1.8
IDT CT Index Avg. 22 65 71 142
COV 21% 23% 10% 19%
Asphalt Content 4.1% 4.6% 5.1% 5.6%
TMD 2
OT CPR Avg. 0.75 0.49 0.51 0.43
COV 44% 15% 16% 6%
HWT RRI RRI 11630 7419 5843 9624
NRRI 1.5 1.0 0.8 1.3
IDT CT Index Avg. 13 18 39 75
COV 19% 22% 18% 25%
The state of the practice in the production and placement of asphalt mixtures during
construction requires a quality control process. This is currently done by following a set of pre-
defined volumetric criteria, specifically a target lab molded density and VMA. The VMA and lab-
molded densities of the TMD mixtures with different asphalt contents are depicted in Figure 4.6.
For TMD 1, the minimum VMA of 15% for a SP C mix is achieved irrespective of the asphalt
content. In the contrary, only TMD 2 mix with OAC-0.5% (4.1%) met the minimum VMA.
A target lab-molded density of 96% ±1% of theoretical maximum density is currently used
in design to assess the consistency of the asphalt mixture. For the evaluated mixtures, the lab-
molded densities varied from 93% to 99%. TMD 1 and TMD 2 mixtures with asphalt contents of
5.2% or more (to satisfy the performance test requirements for a balanced mix design) yielded lab-
molded densities of 98.4% of theoretical maximum density and greater. These values raise

23
concerns about the constructability and durability of the mixtures. The implementation of a
performance-based design is feasible if paired with a more fundamental selection of pavement raw
materials and consistent quality control process
Figure 4.6 Altered Aggregate Gradations for TMD 1 Mixture
Based on the results from this chapter, asphalt mixtures that are designed with low asphalt
contents is the main contributor to the poor cracking resistance. To produce satisfactorily BMD
mixtures, alternative approaches to increase the asphalt content of mixtures must be further
evaluated.
90
92.5
95
97.5
100
10
12.5
15
17.5
20
4.0% 4.5% 5.0% 5.5% 6.0% Lab
-Mold
ed D
ensi
ty, %
VM
A,
%
Asphalt Content
a) Plant 1VMA VMA Acceptance Limit
Lab Density Target Density
90
92.5
95
97.5
100
10
12.5
15
17.5
20
4.0% 4.5% 5.0% 5.5% 6.0% Lab
-Mold
ed D
ensi
ty, %
VM
A,
%
Asphalt Content
b) Plant 2VMA VMA Acceptance Limit
Lab Density Target Density

24
CHAPTER 5 – FORMULATION OF BALANCED MIX DESIGNS
This chapter presents the modification of four TMD mixtures to meet the BMD
requirements. The mixtures were balanced by adjusting the aggregate gradation, gyrations levels,
binder PG and removing field sand. A volumetric design with performance verifications approach
was used to design the BMD mixtures. The key modification to produce BMD mixtures was the
formulation of an alternative aggregate gradation. Several volumetric properties including asphalt
content, voids in mineral aggregates (VMA), theoretical maximum specific gravity (Gmm), bulk
specific gravity (Gmb) and lab-molded density were measured and documented for the TMD and
BMD mixtures. For performance testing, the OT, HWT and IDEAL CT tests were performed. OT
and HWT tests were used to determine the cracking and rutting potentials of the mixtures, while
IDEAL CT test is considered a quality control test for production and placement of the asphalt
mixtures.
5.1 ALTERNATIVE APPROACH TO INCREASE ASPHALT CONTENT OF ASPHALT MIXTURES
One feasible way to produce BMD mixtures by coupling the volumetric and performance
criteria is by optimizing the selection of aggregate gradation. In that approach, the gradation is
optimized to not only provide aggregate interlocking but also provide enough void space to accept
more asphalt binder and potentially balance both rutting and cracking potentials. To investigate
the role of the aggregate gradation on the volumetric properties of the mixtures, four aggregate
gradations were studied by modifying the aggregate gradation of TMD 1 (referred to Control,
CNT). As shown in Figure 5.1, the coarse portion of the gradation was modified to produce a high
and low coarse aggregate (HCA and LCA) gradations, while the fine portion of the gradation was
perturbed to generate a high and low fine aggregate (HFA and LFA) gradations.
The measured volumetric properties of the mixtures are shown in Table 5.1. The coarse
portion of the gradation did not influence considerably the volumetric properties of the mixtures.

25
From the change in the fine portion of the gradation, the mix with LFA gradation yielded a greater
OAC and VMA than the mix with the CNT gradation. The mix with the LFA gradation exhibited
an OAC of 5.3% and a VMA of 16.2%. In comparison with the CNT gradation, the LFA gradation
requires less amount of intermediate aggregates (material retained on No. 8, No. 16 and No. 30
sieves), which can create more void space within the mix to accommodate the binder. A gradation
similar to the LFA gradation can be used to optimize and balance the volumetric and mechanical
properties of the mixture.
Figure 5.1 Altered Aggregate Gradations for TMD 1 Mixture
Table 5.1 Influence of Aggregate Gradation on Volumetric Properties of Mixtures
Gradation OAC, % VMA, % Gmm Gmb Dust to Binder Ratio
HCA 4.7 15.0 2.474 2.374 1.1
0
20
40
60
80
100
Per
cen
t P
ass
ing, %
Sieve Size
a) Coarse Portion
HCA
CTN
LCA
#200 #8 #4 1/2" 3/4"
0
20
40
60
80
100
Per
cen
t P
ass
ing, %
Sieve Size
b) Fine Portion
HFA
CNT
LFA
#200 #8 #4 1/2" 3/4"

26
LCA 4.6 14.7 2.477 2.375 1.0
CNT 4.7 15.0 2.470 2.369 1.0
HFA 4.6 14.8 2.478 2.380 1.1
LFA 5.3 16.2 2.459 2.358 0.9
5.2 PLANT 1 (CRACK-SUSCEPTIBLE MIX DESIGN)
The raw materials from Plant 1 were used to produce two mixtures with different
gradations. BMD 1 was designed using the same aggregates sources, binder type and RAP source
used for TMD 1, as shown in Figure 5.2. As previously described, TMD 1 is considered a crack
susceptible mix design. The major difference between the two aggregate gradations is the content
of intermediate aggregates. It is surmised that this modification should increase the asphalt content
without significantly affecting the rutting resistance of the mixture.
Figure 5.2 Comparison of Aggregate Gradations for Mixtures from Plant 1
The volumetric properties of TMD 1 and BMD 1 mixes are compared in Table 5.2. The
OAC for BMD 1 was determined to be 5.5%, while TMD 1 yielded an OAC of 4.7%. Both TMD
1 and BMD 1 mixes met the minimum VMA requirement of 15%. The mechanical performance
of the mixtures is compared in Table 5.2. From the performance space diagram in Figure 5.3, both
TMD 1 and BMD 1 yielded acceptable rutting properties based on the NRRI values. The
modification to TMD 1 mix gradation to produce BMD 1 mix improved the cracking properties
based on the OT and IDEAL CT test results. Furthermore, BMD 1 mix still provides acceptable
0
20
40
60
80
100
Per
cen
t P
ass
ing, %
Sieve Size
TMD 1
BMD 1
#200 #8 #4 1/2" 3/4"

27
volumetric properties and lab molded density as required by the current specifications. The
modification of the aggregate gradation helped to improve the performance of the mixture,
specifically the cracking susceptibility.
Table 5.2 Volumetric and Performance Properties of Mixtures for Plant 1
Parameters TMD 1 BMD 1
Volumetric Properties
Optimum Asphalt Content, % 4.7 5.5
Voids in Mineral Aggregates, % 15.0 16.7
Bulk Specific Gravity 2.369 2.353
Maximum Specific Gravity 2.470 2.450
Mechanical Properties
OT Crack Progression Rate 0.57 0.35
Rut Depth, mm 6.6 9.2
Number of Passes 20,000 20,000
Normalized Rutting Resistance Index 1.9 2.0
CT Index 65 103
Figure 5.3 Performance Space Diagram for Mixtures from Plant 1
5.3 PLANT 2 (UNBALANCED MIX DESIGN)
TMD 2 and BMD 2 mixes were produced using the pavement raw materials from Plant 2.
The aggregate gradation proposed for BMD 2 mix is compared with that of TMD 2 mix in Figure
65103
0
0.5
1
1.5
2
2.5
0 0.15 0.3 0.45 0.6 0.75 0.9
NR
RI
Crack Progression Rate
TMD 1 BMD 1 Acceptance Limit

28
5.4. Since the aggregates used in TMD 2 mix are very absorptive and considered very soft, BMD
2 mix was designed with 35 gyrations instead of 50 gyrations to increase the asphalt content of the
mixture, specifically the effective binder content.
Figure 5.4 Comparison of Aggregate Gradations for Mixtures from Plant 2
The volumetric and mechanical properties of TMD 2 and BMD 2 mixes are summarized
in Table 5.3. BMD 2 mix yielded an OAC of 5.4%, while TMD 2 mix had an OAC of 4.6%. BMD
2 mix yielded a VMA of 16.3% which satisfactorily meets the minimum VMA requirement. The
mechanical performance of the mixes is compared in the performance diagram shown in Figure
5.5. The cracking and rutting resistance of BMD 2 mix satisfactorily passed the performance
acceptance criteria as judged by its CPR and NRRI. The modification to the TMD 2 mix gradation
and lowering the Ndesign to produce BMD 2 mix improved the cracking and rutting properties based
on the OT, IDEAL CT and HWT test results. Unlike TMD 2 mix, BMD 2 mix satisfied all the
performance requirements while providing acceptable VMA and target lab molded density as
required under the current specifications.
Table 5.3 Volumetric and Performance Properties of Mixtures for Plant 2
Parameters TMD 2 BMD 2
Volumetric Properties
Optimum Asphalt Content, % 4.6 5.4
Voids in Mineral Aggregates, % 14.7 16.3
Bulk Specific Gravity 2.379 2.345
0
20
40
60
80
100
Per
cen
t P
ass
ing, %
Sieve Size
TMD 2
BMD 2
#200 #8 #4 1/2" 3/4"

29
Maximum Specific Gravity 2.486 2.445
Mechanical Properties
OT Crack Progression Rate 0.49 0.41
Rut Depth, mm 12.9 6.2
Number of Passes 11,110 20,000
Normalized Rutting Resistance Index 0.7 1.6
CT Index 18 85
Figure 5.5 Performance Space Diagram for Mixtures from Plant 2
5.4 PLANT 3 (CRACK-SUSCEPTIBLE MIX DESIGN)
The pavement raw materials from Plant 3 were used to produce a TMD and a BMD
mixture. The aggregate gradations for TMD 3 and BMD 3 mixes are presented in Figure 5.6.
Apart from the aggregate gradation modification, another difference between TMD 3 and BMD 3
mixes is the PG of the binder. While TMD 3 mix was initially designed with a PG 64-22 binder,
BMD 3 mix used a PG 70-22 binder.
18
85
0
0.5
1
1.5
2
2.5
0 0.15 0.3 0.45 0.6 0.75 0.9
NR
RI
Crack Progression Rate
Acceptance Limit TMD 2 BMD 2

30
Figure 5.6 Comparison of Aggregate Gradations for Mixtures from Plant 3
The volumetric and mechanical properties of TMD 3 and BMD 3 mixes are summarized
in Table 5.4. BMD 3 mix yielded an OAC of 5.7%, while TMD 3 mix exhibited an OAC of 4.6%.
TMD 3 mix yielded a VMA of 14.8% and BMD 3 mix yielded a VMA of 17.1%. The mechanical
performance of the mixtures is compared in the performance space diagram shown in Figure 5.7.
Both TMD 3 and BMD 3 mixes yielded acceptable NRRI values. TMD 3 and BMD 3 mixes
exhibited CPR values of 0.55 and 0.35, respectively. Apart from satisfying the performance
requirements of OT, IDEAL CT and HWT tests, BMD 3 mix yielded acceptable VMA and lab
molded density.
Table 5.4 Volumetric and Performance Properties of Mixtures from Plant 3
Parameters TMD 3 BMD 3
Volumetric Properties
Optimum Asphalt Content, % 4.6 5.7
Voids in Mineral Aggregates, % 14.8 17.1
Bulk Specific Gravity 2.399 2.345
Maximum Specific Gravity 2.504 2.445
Mechanical Properties
OT Crack Progression Rate 0.55 0.35
Rut Depth, mm 12.4 4.3
Number of Passes 20,000 20,000
Normalized Rutting Resistance Index 1.3 2.2
CT Index 37 178
0
20
40
60
80
100
Per
cen
t P
ass
ing, %
Sieve Size
TMD 3
BMD 3
#200 #8 #4 1/2” 3/4”

31
Figure 5.7 Performance Space Diagram for Mixtures from Plant 3
5.5 PLANT 4 (RUT-SUSCEPTIBLE MIX DESIGN)
The raw materials from Plant 4 were used to produce TMD 4 and BMD 4 mixes. To
produce BMD 4 mix, the same pavement raw materials were used except for the substitution of
the asphalt binder with a PG 70-28 binder and the removal of the field sand. The aggregate
gradation proposed for BMD 4 mix is compared with that of TMD 4 mix in Figure 5.8. It was
surmised that removing the field sand would create more space for asphalt binder, while increasing
the high-temperature grade of the binder would improve the rutting resistance and tensile strength
of the mixture.
37
178
0
0.5
1
1.5
2
2.5
0 0.25 0.5 0.75 1
NR
RI
Crack Progression Rate
Acceptance Limit TMD 3 BMD 3

32
Figure 5.8 Comparison of Gradations for Mixtures from Plant 4
The volumetric and mechanical properties of TMD 4 and BMD 4 mixes are summarized
in Table 5.5. BMD 4 mix yielded an OAC of 5.2%, while TMD 2 mix exhibited an OAC of 4.8%.
TMD 4 and BMD 4 mixes yielded VMAs of 15.1 and 15.9%, respectively, which satisfactorily
meet the minimum VMA requirement. The mechanical performance of the mixes is compared in
the performance diagram shown in Figure 5.9. Both TMD 4 and BMD 4 mixes yielded acceptable
CPR values. The increase in the high-temperature grade of the binder improved the rutting
resistance and the stiffness properties as determined with the HWT tests. Unlike TMD 4, BMD 4
yielded acceptable NRRI, CT Index and CPR values while providing acceptable VMA and lab
molded density as required under the current specifications.
Table 5.5 Volumetric and Performance Properties of Mixtures from Plant 4
Parameters TMD 4 BMD 4
Volumetric Properties
Optimum Asphalt Content, % 4.8 5.2
Voids in Mineral Aggregates, % 15.1 15.9
Bulk Specific Gravity 2.370 2.362
Maximum Specific Gravity 2.468 2.461
Mechanical Properties
OT Crack Progression Rate 0.31 0.40
Rut Depth, mm 12.5 4.95
Number of Passes 13690 20,000
Normalized Rutting Resistance Index 0.9 2.1
CT Index 101 66
0
20
40
60
80
100
Per
cen
t P
ass
ing, %
Sieve Size
TMD 4
BMD 4
#200 #8 #4 1/2" 3/4"

33
Figure 5.9 Performance Space Diagram for Mixtures from Plant 4
5.6 SUMMARY AND CONCLUSIONS
From this part of the study, the following conclusions can be drawn:
1. The TMD mixture from Plant 1, considered a crack susceptible mixture, was balanced by
adjusting the aggregate gradation and allowing more binder to get into the mixture. The
rutting resistance of the BMD mixtures was not significantly impacted by this modification.
For aggregate sources with a high absorption property, the asphalt content must be
increased to account for absorption. Lowering Ndesign can enable higher total asphalt
content, and consequently higher effective binder content. In this case, both cracking and
rutting properties were improved to make the mixture satisfactorily meet the performance
requirements.
2. The TMD mixture from Plant 3, considered a crack susceptible mixture, was balanced by
adjusting the aggregate gradation and replacing the asphalt binder with a PG 70-22 binder.
For this mix design, cracking and rutting resistance were significantly improved.
101
66
0
0.5
1
1.5
2
2.5
0 0.15 0.3 0.45 0.6 0.75 0.9
NR
RI
Crack Progression Rate
TMD 4 BMD 4 Acceptance Limit

34
3. The TMD mixture from Plant 4, considered a rut susceptible mixture, was balanced by
replacing the original binder grade with a PG 70-28 binder. The rutting resistance of the
mixture was improved without sacrificing the cracking resistance.
The implementation of a volumetric-based design with performance verification was tied
to the selection of the aggregate gradation to produce BMD mixtures. The incorporation
of performance tests and requirements such as the OT and HWT tests was key to
discriminate the properties of mixtures and delineate BMD mixtures.

35
CHAPTER 6 – INFLUENCE OF ESSENTIAL DESIGN VARIABLES ON
PERFORMANCE OF BALANCED MIX DESIGNS
With the introduction of BMD mixtures, the influence of essential design variables such as
binder source, PG binder, recycled material content and long-term aging must be documented to
develop thorough specifications and guidelines. A comparison of the sensitivity of TMD and
BMD mixtures to changes in the mix design was carried out. The results from this evaluation are
discussed next.
6.1 INFLUENCE OF ASPHALT BINDER SOURCE
The influence of the asphalt binder source was investigated using the raw materials from
Plant 2. PG 70-22 binders from five different producers were collected and evaluated in this
section. Figure 6.1 depicts the CPR values from OT tests for TMD 2 and BMD 2 mixtures. The
data labels reflect the COVs, which were less than 40% for CPR parameter. In general, all BMD
2 mixtures exhibited acceptable cracking resistance as judged by CPR. In the contrary to the BMD
2 mixtures, only TMD 2 mixture designed with Source B binder yielded an acceptable CPR of
0.44. In addition, TMD 2 mixtures were more sensitive to the change in binder source as observed
by the wide range of CPR values ranging from 0.40 to 0.75. BMD mixtures yielded similar CPR
values except for mixture designed with Source B binder that exhibited a CPR of 0.26.
The HWT test results are presented in Figure 6.2. NRRI is shown as a data label. TMD 2
mixtures with different binders yielded RRI values that ranged from 5481 to 8533. For BMD 2
mixtures with different binders the values ranged from 9561 to 17236. Based on NRRI, only three
out of five TMD mixtures passed the HWT test requirements, while the five BMD mixtures
satisfactorily passed the HWT test requirements. Regardless of the binder source, passing the
HWT test requirements would be easier with BMD mixtures.

36
Figure 6.1 OT Test Results: Influence of Binder Source
Figure 6.2 HWT Test Results: Influence of Binder Source
Figure 6.3 IDT Test Results: Influence of Binder Source
40%
16%17%
17%
15%10%
17%
19% 21% 5%
0
0.15
0.3
0.45
0.6
0.75
0.9
A B C D E
Cra
ck P
rogre
ssio
n R
ate
TMD 2 BMD 2 Acceptance Limit
0.81.1
1.0 1.0 0.7
1.7
2.32.0
1.3
2.0
0
5000
10000
15000
20000
A B C D E
RR
I
TMD 2 BMD 2 Acceptance Limit
9% 35% 25% 12% 22%
34%21%
31%19%
20%
0
50
100
150
200
A B C D E
CT
In
dex
TMD 2 BMD 2
37
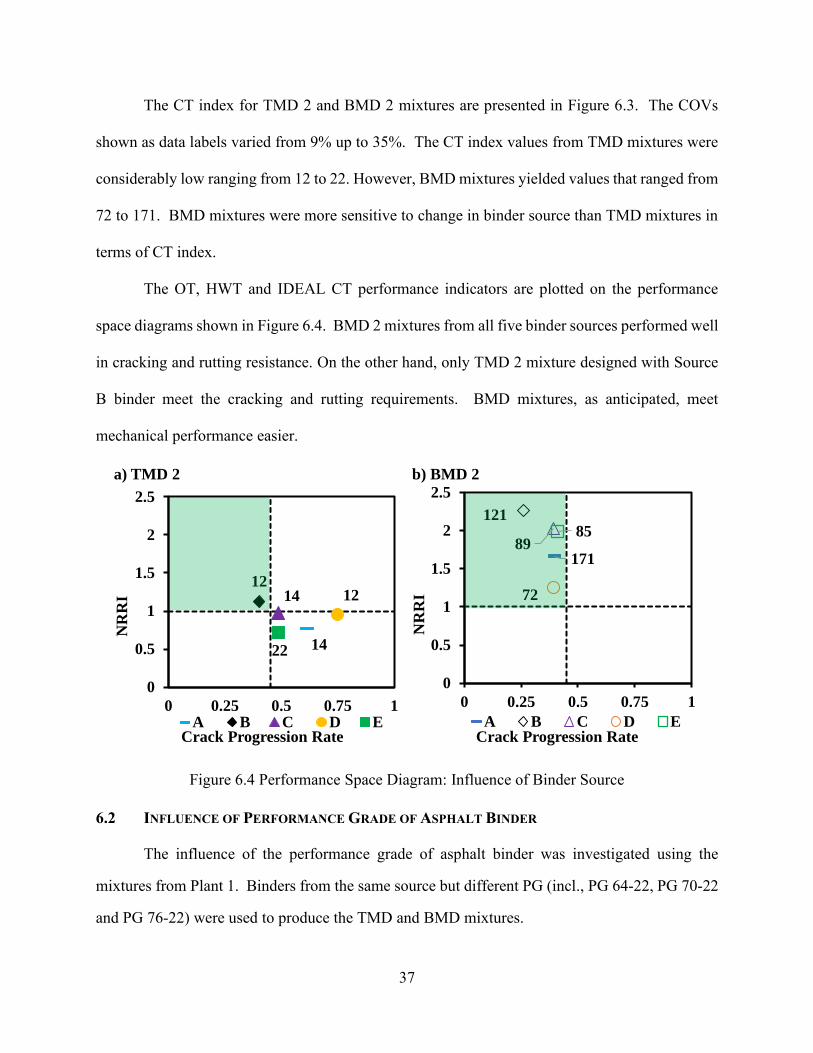
The CT index for TMD 2 and BMD 2 mixtures are presented in Figure 6.3. The COVs
shown as data labels varied from 9% up to 35%. The CT index values from TMD mixtures were
considerably low ranging from 12 to 22. However, BMD mixtures yielded values that ranged from
72 to 171. BMD mixtures were more sensitive to change in binder source than TMD mixtures in
terms of CT index.
The OT, HWT and IDEAL CT performance indicators are plotted on the performance
space diagrams shown in Figure 6.4. BMD 2 mixtures from all five binder sources performed well
in cracking and rutting resistance. On the other hand, only TMD 2 mixture designed with Source
B binder meet the cracking and rutting requirements. BMD mixtures, as anticipated, meet
mechanical performance easier.
Figure 6.4 Performance Space Diagram: Influence of Binder Source
6.2 INFLUENCE OF PERFORMANCE GRADE OF ASPHALT BINDER
The influence of the performance grade of asphalt binder was investigated using the
mixtures from Plant 1. Binders from the same source but different PG (incl., PG 64-22, PG 70-22
and PG 76-22) were used to produce the TMD and BMD mixtures.
14
1214 12
22
0
0.5
1
1.5
2
2.5
0 0.25 0.5 0.75 1
NR
RI
Crack Progression Rate
a) TMD 2
A B C D E
171
121
89
72
85
0
0.5
1
1.5
2
2.5
0 0.25 0.5 0.75 1
NR
RI
Crack Progression Rate
b) BMD 2
A B C D E

38
Figure 6.5 depicts the CPR values from OT tests for TMD 1 and BMD 1 mixtures. The
data label reflects the COVs. The COV values were less than 22% for CPR. The increase in high-
temperature grade of the binder did not impact the CPR for TMD 1 and BMD 1 mixtures..
Figure 6.5 OT Test Results: Influence of PG Binder
The HWT test results are presented in Figure 6.6. NRRI is reflected as a label above each
bar. TMD 1 mixtures with different performance grade of binders yielded RRI values that ranged
from 6750 to 16669. For BMD 1 mixtures with different performance grade of binders the values
ranged from 14543 to 16031. For TMD 1 The increase in the high-temperature grade of the asphalt
binder resulted in mixtures with better rutting resistance. Based on NRRI, all AC mixtures
exhibited acceptable rutting resistance regardless of their asphalt binder PG.
8% 13% 16%
10% 7%
13%
0
0.15
0.3
0.45
0.6
0.75
0.9
64-22 70-22 76-22
Cra
ck P
rog
resi
on
Rate
TMD 1 BMD 1 Acceptance Limit
1.3
2.01.6
2.92.1 1.6
0
5000
10000
15000
20000
64-22 70-22 76-22
RR
I
TMD 1 BMD 1 Acceptance Limit
39
Figure 6.6 HWT Test Results: Influence of PG Binder
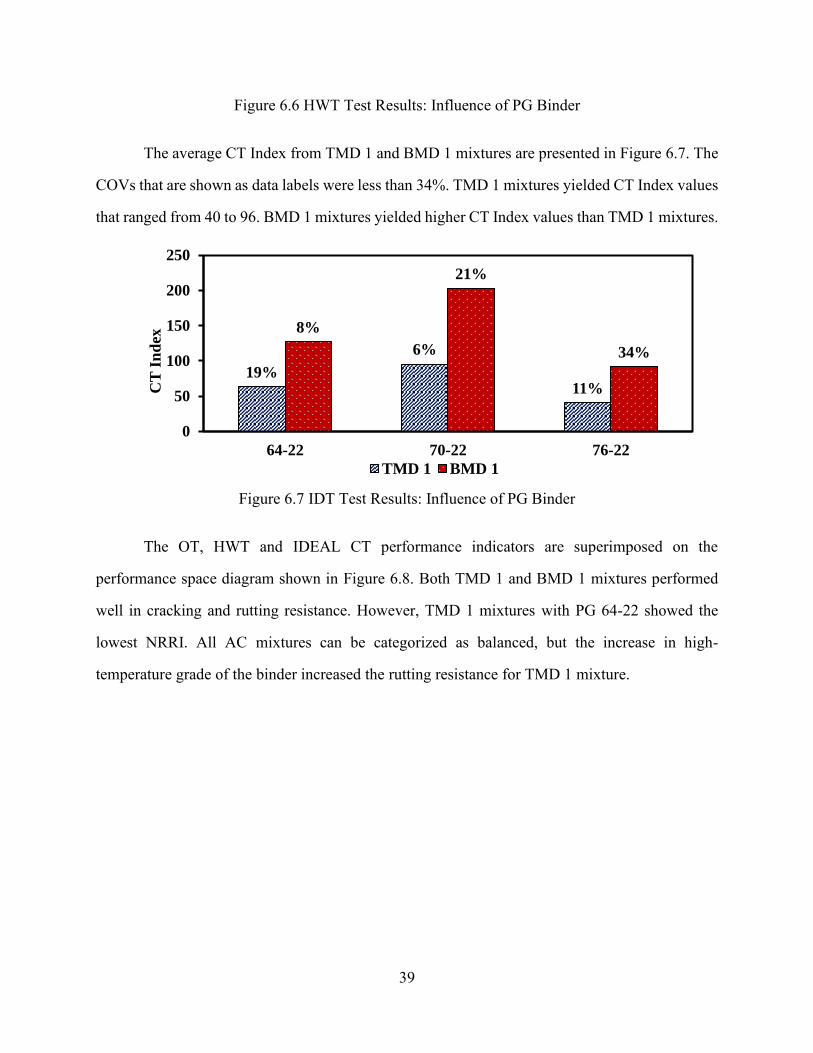
The average CT Index from TMD 1 and BMD 1 mixtures are presented in Figure 6.7. The
COVs that are shown as data labels were less than 34%. TMD 1 mixtures yielded CT Index values
that ranged from 40 to 96. BMD 1 mixtures yielded higher CT Index values than TMD 1 mixtures.
Figure 6.7 IDT Test Results: Influence of PG Binder
The OT, HWT and IDEAL CT performance indicators are superimposed on the
performance space diagram shown in Figure 6.8. Both TMD 1 and BMD 1 mixtures performed
well in cracking and rutting resistance. However, TMD 1 mixtures with PG 64-22 showed the
lowest NRRI. All AC mixtures can be categorized as balanced, but the increase in high-
temperature grade of the binder increased the rutting resistance for TMD 1 mixture.
19%
6%
11%
8%
21%
34%
0
50
100
150
200
250
64-22 70-22 76-22
CT
In
dex
TMD 1 BMD 1

40
Figure 6.8 Performance Space Diagram: Influence of Binder PG
6.3 INFLUENCE OF RECYCLED MATERIAL CONTENT
To investigate the influence of recycled material content on mixture’s performance, two
mixtures were designed using two recycled materials: reclaimed asphalt pavement (RAP) and
recycled asphalt shingles (RAS). BMD 1 mix was designed with three different RAP contents of
18%, 26% and 38%. BMD 4 mixture was designed with three RAS contents of 3%, 6% and 9%.
6.3.1 Influence of Reclaimed Asphalt Pavement for Plant 1
The volumetric properties of the AC mixes are summarized in Table 6.1. The OAC for
BMD 1 mix with 18% RAP was determined to be 5.5%, while BMD 1 mix containing 26 % RAP
yielded an OAC of 6.0% and for BMD 1 mix with 38% RAP an OAC of 5.7% was obtained. All
AC mixtures met the minimum 15% VMA requirement for SP C mixes.
Table 6.1 Volumetric and Performance Properties of Mixtures
BMD 1 18% 26% 38%
Volumetric Properties
Optimum Asphalt Content, % 5.5 6.0 5.7
Voids in Mineral Aggregates, % 16.7 17.6 15.9
Bulk Specific Gravity 2.353 2.327 2.324
Maximum Specific Gravity 2.450 2.424 2.422
63
96
40
0
0.5
1
1.5
2
2.5
0 0.15 0.3 0.45 0.6 0.75 0.9
NR
RI
Crack Progression Rate
a) TMD 1
64-22 70-22 76-22
127
203
92
0
0.5
1
1.5
2
2.5
3
0 0.15 0.3 0.45 0.6 0.75 0.9
NR
RI
Crack Progression Rate
a) BMD 1
64-22 70-22 76-22

41
Figure 6.9 depicts the OT test results in terms of CPR for BMD 1 mixtures with different
RAP contents. The data label reflects the COV. The COV values were less than 11% for CPR. All
mixtures exhibited acceptable cracking resistance as judged by CPR. The good cracking resistance
of mixture containing 26% RAP can be explained by the higher OAC obtained during the mix
design process.
Figure 6.9 OT Test Results: Influence of RAP
The HWT test results are presented in Figure 6.10. NRRI is reflected as a label above each
bar. TMD 1 mixtures with different performance grade of binders yielded RRI values that ranged
from 13906 to 15323. The range of NRRI values for BMD 1 mixtures with different RAP content
did not change significantly, and all AC mixtures exhibited acceptable rutting resistance.
8%
11% 24%
0
0.15
0.3
0.45
0.6
0.75
0.9
18% 26% 38%
Cra
ck P
rog
ress
ion
Rate
Acceptance Limit
1.4
1.82.0
0
5000
10000
15000
20000
18% 26% 38%
RR
I
Acceptance Limit

42
Figure 6.10 HWT Test Results: Influence of RAP
The average CT Index values are presented in Figure 6.11. COVs are presented as data
labels and were less than 33%. BMD 1 mixture with 38 % RAP yielded the lowest CT Index value
of 70. The CT Index for mix with 26% RAP was greater than that with 18% RAP and 38% RAP,
due to a higher OAC obtained during the design process.
Figure 6.11 IDT Test Results: Influence of RAP
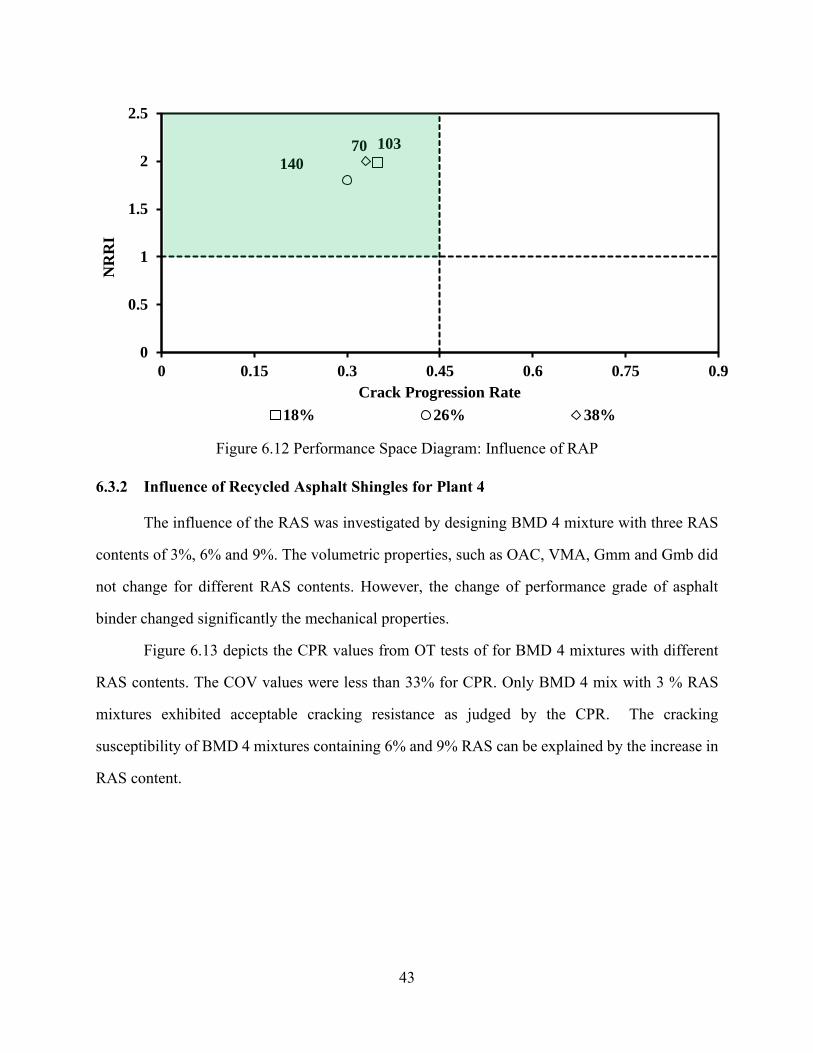
The OT, HWT and IDEAL CT performance indicators are superimposed on the
performance space diagram shown in Figure 6.12. All BMD 1 mixtures with different RAP
contents performed well in cracking and rutting resistance. However, the mixtures containing 26
% RAP yielded the lowest CPR due to the higher OAC obtained during the mix design. All BMD
1 mixtures with different RAP content were within the acceptable zone and can be categorized as
balanced.
24%
21%
33%
0
50
100
150
200
250
18% 26% 38%
CT
In
dex
43
Figure 6.12 Performance Space Diagram: Influence of RAP
6.3.2 Influence of Recycled Asphalt Shingles for Plant 4
The influence of the RAS was investigated by designing BMD 4 mixture with three RAS
contents of 3%, 6% and 9%. The volumetric properties, such as OAC, VMA, Gmm and Gmb did
not change for different RAS contents. However, the change of performance grade of asphalt
binder changed significantly the mechanical properties.
Figure 6.13 depicts the CPR values from OT tests of for BMD 4 mixtures with different
RAS contents. The COV values were less than 33% for CPR. Only BMD 4 mix with 3 % RAS
mixtures exhibited acceptable cracking resistance as judged by the CPR. The cracking
susceptibility of BMD 4 mixtures containing 6% and 9% RAS can be explained by the increase in
RAS content.
103
140
70
0
0.5
1
1.5
2
2.5
0 0.15 0.3 0.45 0.6 0.75 0.9
NR
RI
Crack Progression Rate
18% 26% 38%

44
Figure 6.13 OT Test Results: Influence of RAS
The HWT test results are presented in Figure 6.14. NRRI is reflected as a label above each
bar. The increase in RAS content resulted in AC mixtures with slightly better rutting resistance.
The range of NRRI values for BMD 4 mixtures with different RAS content did not change
significantly, and all mixtures exhibited acceptable rutting resistance.
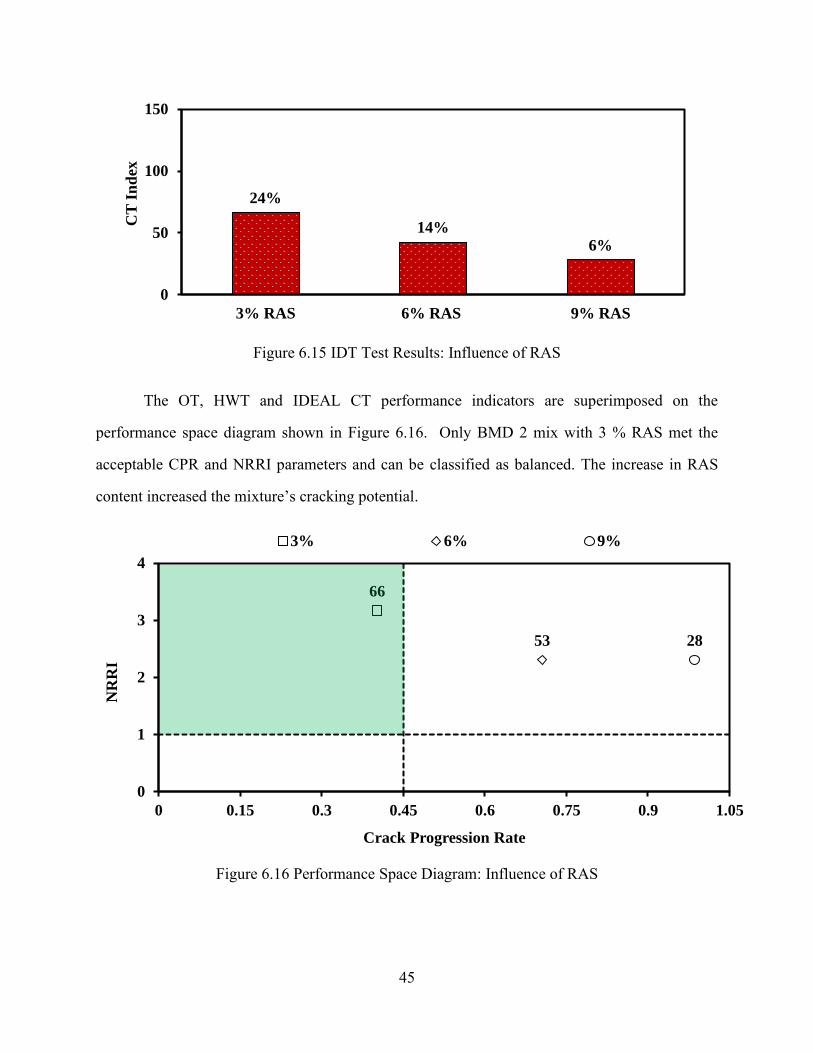
The average CT Index values are presented in Figure 6.15. COVs are presented as data
labels and were less than 24%. BMD 4 mix with 9% RAS yielded the lowest CT Index. The
increase in the RAS content reduced the CT Index values.
Figure 6.14 HWT Test Results: Influence of RAS
25%
20%
33%
0
0.45
0.9
1.35
3% RAS 6% RAS 9% RASCra
ck P
rogre
ssio
n R
ate
Acceptance Limit
2.12.3 2.3
0
5000
10000
15000
20000
3% RAS 6% RAS 9% RAS
RR
I
Acceptance Limit
45
Figure 6.15 IDT Test Results: Influence of RAS
The OT, HWT and IDEAL CT performance indicators are superimposed on the
performance space diagram shown in Figure 6.16. Only BMD 2 mix with 3 % RAS met the
acceptable CPR and NRRI parameters and can be classified as balanced. The increase in RAS
content increased the mixture’s cracking potential.
Figure 6.16 Performance Space Diagram: Influence of RAS
24%
14%
6%
0
50
100
150
3% RAS 6% RAS 9% RAS
CT
In
dex
66
53 28
0
1
2
3
4
0 0.15 0.3 0.45 0.6 0.75 0.9 1.05
NR
RI
Crack Progression Rate
3% 6% 9%

46
6.4 INFLUENCE OF LONG-TERM AGING
The influence of long-term aging on asphalt mixtures was investigated using the pavement
raw materials from Plants 1, 3 and 4. The TMD and BMD mixtures were produced following two
different aging conditions, short- and long-term oven aging. For both aging conditions only the
cracking tests IDEAL CT and OT were utilized. The short-term aging protocol, in accordance to
TxDOT specifications (Tex-206-F), requires a two-hour curing time at a temperature that varies
with the binder PG. After the material cured for the specified time, the specimens were prepared
for the two test procedures. An oven temperature of 95 ºC (203 ºF) is needed for the laboratory
long-term aging . The loose mixture is spread in several pans at a maximum thickness of 2 in. (50
mm, and placed in the oven for five days. After the five days of aging, the oven temperature is
elevated to the corresponding compaction temperature relevant to the binder PG (Rad et al., 2017).
Figure 6.17 depicts the CPR values from the OT tests for mixtures subjected to the short-
term and long-term aging. COVs that are included as data label are less than 43%. Due to the
stiffening of the mixtures during the aging process, the CPR values for the specimens subjected to
long-term aging are greater than those subjected to short-term aging. OT specimens were not
prepared using the material from TMD 3 mix after LTA protocol since the aged material became
very dry and could not be compacted properly.
Figure 6.17 OT Test Results: Influence of Long-Term Aging
17%5%
19%8% 17% 25%
17%
24%43%
27% 39%
0
0.45
0.9
1.35
1.8
2.25
2.7
TMD 1 BMD 1 TMD 3 BMD 3 TMD 4 BMD 4
Cra
ck P
rogre
ssio
n R
ate
STOA LTOA Acceptance Limit

47
The average IDEAL CT test results are presented in Figure 6.18. COVs for that tests are
less than 37%. Both TMD and BMD mixtures under the long-term aging protocol yielded
significantly lower CT Index values than those under the short-term aging protocol. TMD mixtures
under long-term aging protocol yielded CT Index values that ranged from 2 to 23, while TMD
mixtures under the shot-term aging protocol yielded CT Index values that ranged from 37 to 101.
BMD mixtures under long-term aging protocol yielded CT Index values that ranged from 22 to
37, while BMD mixtures under the shot-term aging protocol yielded CT Index values that ranged
from 66 to 178.
Figure 6.18 IDEAL CT Test Results: Influence of Long-Term Aging
23%
24%
22%
22%
31%
28%
23% 18%23%
27%22%
37%
0
50
100
150
200
TMD 1 BMD 1 TMD 3 BMD 3 TMD 4 BMD 4
CT
In
dex
STOA LTOA

48
CHAPTER 7 – CONCLUSIONS AND RECOMMENDATIONS
Possible mix design modifications that can be carried out to improve the volumetric and
mechanical properties of mixes, specifically the cracking resistance of mixtures were documented.
Four typical Superpave mixtures that exhibited poor mechanical performance were selected and
evaluated. A volumetric based design with performance verification was implemented to produce
BMD mixtures using the OT and HWT tests as the cracking and rutting tests, respectively. The
volumetric and mechanical properties of the Superpave mixes were improved by formulating an
alternative aggregate gradation. The BMD mixtures developed meet the volumetric and
performance requirements for Superpave mixtures. The influence of essential mix design variables
was also documented by evaluating TMD and BMD mixtures with varying binder sources, binder
PGs and recycled material contents.
7.1 CONCLUSIONS
From this study, the following conclusions can be drawn:
4. Current Superpave mixtures are designed to optimize the content of asphalt binder and
volumetric properties without strictly considering the use of performance requirements.
Due to the low binder content, Superpave mixtures exhibit poor cracking resistance. With
the inclusion of recycled materials, the cracking resistance of these Superpave mixtures is
further aggravated. Increasing the amount of asphalt content is the answer to improve the
mechanical performance of mixtures.
5. Based on the performance-based approach, the change in asphalt content can improve the
cracking resistance of a crack-susceptible mix. However, the volumetric properties (e.g.
laboratory molded density) of the mixture may fall outside the current operational tolerance
limits. If improving the mechanical performance of mixtures by adjusting only the asphalt
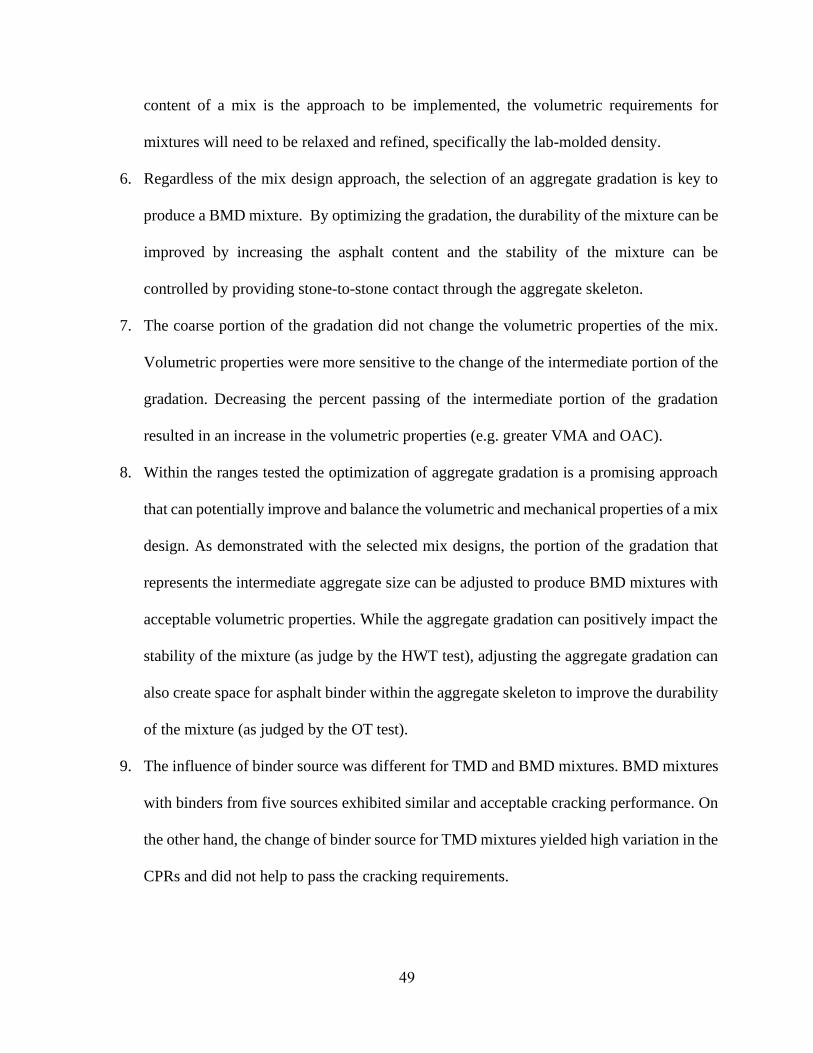
49
content of a mix is the approach to be implemented, the volumetric requirements for
mixtures will need to be relaxed and refined, specifically the lab-molded density.
6. Regardless of the mix design approach, the selection of an aggregate gradation is key to
produce a BMD mixture. By optimizing the gradation, the durability of the mixture can be
improved by increasing the asphalt content and the stability of the mixture can be
controlled by providing stone-to-stone contact through the aggregate skeleton.
7. The coarse portion of the gradation did not change the volumetric properties of the mix.
Volumetric properties were more sensitive to the change of the intermediate portion of the
gradation. Decreasing the percent passing of the intermediate portion of the gradation
resulted in an increase in the volumetric properties (e.g. greater VMA and OAC).
8. Within the ranges tested the optimization of aggregate gradation is a promising approach
that can potentially improve and balance the volumetric and mechanical properties of a mix
design. As demonstrated with the selected mix designs, the portion of the gradation that
represents the intermediate aggregate size can be adjusted to produce BMD mixtures with
acceptable volumetric properties. While the aggregate gradation can positively impact the
stability of the mixture (as judge by the HWT test), adjusting the aggregate gradation can
also create space for asphalt binder within the aggregate skeleton to improve the durability
of the mixture (as judged by the OT test).
9. The influence of binder source was different for TMD and BMD mixtures. BMD mixtures
with binders from five sources exhibited similar and acceptable cracking performance. On
the other hand, the change of binder source for TMD mixtures yielded high variation in the
CPRs and did not help to pass the cracking requirements.

50
10. The change in high-temperature grade of the binder improved the rutting resistance of
TMD and BMD mixtures as determined with the HWT test. The change in binder PG did
not impact the cracking resistance of TMD and BMD mixtures based on the OT test.
11. The change in RAP content while keeping the gradation constant only increased the rutting
resistance of BMD mixtures without impacting their cracking resistance.
12. The increase in RAS content negatively affected the cracking properties of the BMD
mixtures. The increase in RAS resulted in an increase of rutting resistance for BMDs.
13. Long-term oven aging significantly affected the cracking resistance of the mixtures. BMD
mixtures exhibited much better cracking resistance after LTOA conditioning than TMD
mixtures.
7.2 RECOMMENDATIONS
The following recommendations are provided to continue implementing the BMD concept:
1. Laboratory standard for aging mixtures during mix design should be investigated to ensure
an adequate level of aging. Practical guidelines and acceptance limits also should be
investigated under the long-term aging testing procedure of the asphalt mixture.
2. The implementation of a performance-based design approach sounds ideal to consider
directly the cracking and rutting resistance of an asphalt mixture for selecting an optimum
asphalt content during the design process. However, implementing a performance-based
design approach requires several modifications to current design, production and
placement processes for asphalt mixtures. Further research is required to fully implement
a performance-based design and corresponding design and construction specifications.
3. Regardless of the mix design approach, a procedure for introducing cracking tests into
QC/QA should be worked out.

51
4. Even though the variability of the tests was reasonable, more attention can be paid to
mitigating as much variability as possible for the sake of accuracy and bias.

52
REFERENCES
1. Al-Qadi, I. L., Ozer, H., Lambros, J., El Khatib, A., Singhvi, P., Khan, T., ... & Doll, B.
(2015). Testing protocols to ensure performance of high asphalt binder replacement
mixes using RAP and RAS. Illinois Center for Transportation/Illinois Department of
Transportation.
2. Aschenbrener, T. (2016). Case Histories of Setting the Job Mix Formula with a Balanced
Mix Design Compared to a Volumetric Mix Design. Slide from 2016 Presentation of
Balanced Mix Design to FHWA Mix ETG. Dartmouth, MA.
3. Aschenbrener, T. (2014). Selecting Optimum Asphalt Content with Superpave. Survey of
AASHTO Subcommittee on Material conducted by Idaho Transportation Department.
4. Bonaquist, R., Underwood B. S., Mohammad L.N., Eseifi M.A., Bennert T., … (2014)
Enhancing the Durability of Asphalt Pavements, Papers from a Workshop. Transportation
Research Circular C-186, Transportation Research Board.
5. Buttlar, W. G., Hill, B. C., Wang, H., & Mogawer, W. (2017). Performance space
diagram for the evaluation of high-and low-temperature asphalt mixture
performance. Road Materials and Pavement Design, 18(sup1), 336-358.
6. California Department of Transportation. Standard Specifications. 2015.
7. Cooper III, S. B., Mohammad, L. N., Kabir, S., & King Jr, W. (2014). Balanced asphalt
mixture design through specification modification: Louisiana's experience.
Transportation Research Record, 2447(1), 92-100.
8. Cox, B. C., Smith, B. T., Howard, I. L., & James, R. S. (2017). State of knowledge for
Cantabro testing of dense graded asphalt. Journal of Materials in Civil
Engineering, 29(10), 04017174.
9. Fee, F., Buchanan, S., Cooper III, S., Mohammad, L., Ozer, H., Al-Qadi, I., ... &
Aschenbrener, T. (2018). Innovations in Asphalt Mixture Design Procedures.
Transportation Research Circular, (E-C237).
10. Garcia, V., Miramontes, A., Garibay, J., Abdallah, I., and Nazarian, S. (2016). Improved
Overlay Tester for Fatigue Cracking Resistance of Asphalt Mixtures. Report No.
FHWA/TX-16/0-6815-1. Center for Transportation Infrastructure Systems, University of
Texas at El Paso, El Paso, TX.
11. Hall, K. (2016). Agency Approaches – 3 Main Approaches Identified. Slide from 2016
Presentation of Balanced Mix Design to FHWA Mix ETG. Dartmouth, MA.
12. Hanz, A., Dukatz, E., & Reinke, G. (2017). Use of performance-based testing for high
RAP mix design and production monitoring. Road Materials and Pavement
Design, 18(sup1), 284-310.
13. Kennedy, T. W., G. A. Huber, E. T. Harrigan, R. J. Cominsky, C. S. Hughes, H. Von
Quintus, and J. S. Moulthrop. (1994). Superior Performing Asphalt Pavements
(Superpave®). The Product of the SHRP Asphalt Research Program. SHRP-A-410. TRB,
National Research Council, Washington, D.C.
14. Maupin, G. W. (2003). Additional asphalt to increase the durability of Virginia’s
Superpave surface mixes (No. VTRC 03-R15). Virginia Transportation Research
Council.

53
15. McDaniel, R. S., and E. Levenberg. (2013) Risk Management of Low Air Void Asphalt
Concrete Mixtures. Publication FHWA/IN/JTRP-2013/15. Joint Transportation Research
Program, Indiana Department of Transportation and Purdue University, West Lafayette,
Indiana. https://doi.org/10.5703/1288284315217
16. Newcomb, D., & Zhou, F. (2018). Balanced Design of Asphalt Mixtures (No. MN/RC
2018-22). Minnesota. Dept. of Transportation. Research Services & Library.
17. Prowell, B. and E. R. Brown. NCHRP Report 573: Superpave Mix Design: Verifying
Gyration Levels in the Ndesign Table. Transportation Research Board of the National
Academies, Washington D.C., 2007
18. Rad, F. Y., Elwardany, M. D., Castorena, C., & Kim, Y. R. (2017). Investigation of
proper long-term laboratory aging temperature for performance testing of asphalt
concrete. Construction and Building Materials, 147, 616-629.
19. Tran, N., Director, P. A., Huber, G., Leiva, F., & Pine, B. (2019). Mix Design Strategies
for Improving Asphalt Mixture Performance NCAT Report 19-08.
20. Tsai, B. W., Wu, R., Harvey, J. T., & Monismith, C. L. (2012). Development of fatigue
performance specification and its relation to mechanistic-empirical pavement design
using four-point bending beam test results. Four Point Bending-CRC Press Book, 59-71.
21. West, R. C., Rodezno, C., Leiva, F., & Taylor, A. J. (2018). Regressing Air Voids for
Balanced HMA Mix Design (No. WHRP 0092-16-06). Wisconsin. Dept. of
Transportation.
22. Zhou, F., Estakhri, C., & Scullion, T. (2014). Literature review: performance of
RAP/RAS mixes and new direction (No. FHWA/TX-13/0-6738-1). Texas. Dept. of
Transportation. Research and Technology Implementation Office.
23. Zhou, F., Hu, S., & Scullion, T. (2006). Integrated asphalt (overlay) mixture design,
balancing rutting and cracking requirements (No. FHWA/TX-06/0-5123-1). Texas
Transportation Institute, Texas A & M University System.
54
VITA
Denis Vieira was born in Brazil where he received his Bachelor of Science in Civil
Engineering from Pontific University Catholic of Minas Gerais in July 2015. Through
determination and the invaluable guidance of his professors from the Civil Engineering
department; he excelled in his undergraduate program and was fortunate to receive funding from
the program of the University for All Scholarship (PROUNI), for five years (2010-2015). In
summer 2018 he moved to United States to pursue his Master of Science degree. Upon his arrival
to UTEP for his graduate’s studies he engaged in transportation research at a nationally recognized
Center for Transportation Infrastructure Systems (CTIS) under prominent civil engineering
researcher and mentor, Dr. Soheil Nazarian. Under his guidance and with the support of a Texas
Department of Transportation sponsored research project; He has successfully published a paper
in a first-tier research journal: Journal of The Transportation Research Record. Mr. Denis
completed a Master of Science in Civil Engineering degree in December 2020. While a graduate
student, he contributed and developed research projects for Texas Department of Transportation
(TxDOT).
Contact information: [email protected]
This thesis/dissertation was typed by Denis Iran Vieira Souza