investigating behavioral and habitat-use patterns of …
TRANSCRIPT

INVESTIGATING BEHAVIORAL AND HABITAT-USE PATTERNS OF
SPINNER DOLPHINS (STENELLA LONGIROSTRIS) IN THE MAUI NUI REGION
USING ACOUSTIC DATA
A THESIS SUBMITTED TO THE GRADUATE DIVISION OF THE
UNIVERSITY OF HAWAI‘I AT MĀNOA IN PARTIAL FULFILLMENT
OF THE REQUIREMENTS FOR THE DEGREE OF
MASTER OF SCIENCE
IN
MARINE BIOLOGY
MAY 2018
By
Megan M. McElligott
Thesis Committee:
Marc Lammers, Chairperson
Joseph Mobley
Jeffrey Polovina

ii
Acknowledgements
Thank you to Marc Lammers for his encouragement and mentorship as my advisor. I am grateful
for his guidance not only in regard to my master’s thesis, but my career goals beyond this degree
as well. Thank you to my committee members, Jeffrey Polovina, and Joseph Mobley for their
support and invaluable advice. Thank you to Kyle Edwards for his statistical guidance. Thanks
also to my Oceanwide Science Institute colleagues, Eden Zang, Lisa Munger, Anke Kügler,
Marcus Richter, and Sandy Yarbrough for their support and work in the field. I would also like
to thank the Colonel Willys E. Lord, DVM & Sandina L. Lord Scholarship Fund for HIMB.
Thank you to Russell and Emi Young for welcoming me into their home and ensuring
that I was well-fed during my field work. Thanks to Kimball Millikan and Dan Fitzgerald for
generously providing their time and vessel, and to Leann Castle and Karen Bryan for diving for
the O‘ahu deployments. Finally, I would like to thank my family and friends for their endless
backing, and for always being willing to listen to me talk about spinner dolphins.

iii
Abstract
Spinner dolphins (Stenella longirostris) rest during the day in nearshore areas where they are
susceptible to human disturbance. Due to concerns over the negative impacts of human activity,
the Pacific Islands Regional Office of NOAA Fisheries proposed a 50-yard approach and swim-
with limit for spinner dolphins with the potential for time-area closures. A combination of
passive acoustic monitoring and vessel surveys was employed to establish an understanding of
spinner dolphins’ current use of the Maui Nui region (Maui, Moloka‘i, Lāna‘i, and the ʻAuʻau
channel). Ecological acoustic recorders (EARs) were deployed in eight locations in Maui Nui,
and one well-established resting bay off west O‘ahu for comparison. The amount of whistles,
clicks, and burst pulses in each recording were quantified by an acoustic activity index (AAI)
and averaged by the hour of the day.
The deployment, time of day, and interaction between longitude and latitude were
significant predictors of variation in dolphin acoustic activity. Acoustic activity was greater at
the O‘ahu site than any of the Maui Nui sites, and was greatest between sunrise and noon.
Acoustic activity at the Maui Nui sites indicated, and vessel surveys confirmed, that spinner
dolphins exhibited resting behaviors in the ʻAuʻau channel between Maui and Lānaʻi, and along
west Maui, and southeast Lāna’i. Dolphins resting in the channel is unique to Maui Nui and has
not been described along Hawaiʻi Island or O‘ahu. Because spinner dolphins use the coastlines
and the channel to rest in Maui Nui the 50-yard approach limit would be a more feasible
management option for the region than time-area closures.

iv
Table of Contents
Acknowledgements ................................................................................................................ii
Abstract ..................................................................................................................................iii
List of Tables .........................................................................................................................v
List of Figures ........................................................................................................................vi
Introduction ............................................................................................................................9
Methods..................................................................................................................................14
Results ....................................................................................................................................18
Discussion ..............................................................................................................................28
Conclusion .............................................................................................................................33
Tables and Figures .................................................................................................................34
Appendix A ............................................................................................................................53
Appendix B ............................................................................................................................65
Literature Cited ......................................................................................................................68

v
List of Tables
1. EAR deployment specifications .................................................................................34
2. Acoustic Activity Index values for various categories of spinner dolphin signals ....35
3. Dredge output of best fit models based on corrected Akaike information criterion .36
4. Deviance explained by the GAM and each individual predictor ...............................37
5. Starting and ending times and locations for vessel surveys with dolphin sightings ..38

vi
List of Figures
1. Location of 2016 EAR deployments generally as shown by the yellow boxes (a), and
more specifically in Maui Nui (b), and O‘ahu (c) .....................................................40
2. Average hourly AAI (± SEM) in each deployment ...................................................41
3. Average hourly AAI by hour of day for each deployment ........................................42
4. Average hourly AAI (± SEM) by time of day category and deployment ..................43
5. Average hourly AAI by hour of day for the winter deployment in Kahekili (15 January
2016 to 16 March 2016) and the summer deployment in Kahekili (30 June 2016 to 30
August 2016) ..............................................................................................................44
6. Average hourly AAI by hour of day for the winter deployment in MM17 (15 January
2016 to 16 March 2016) and the summer deployment in MM17 (30 June 2016 to 30
August 2016) ..............................................................................................................45
7. Average hourly AAI by hour of day for the winter deployment in Maui-Lāna‘i (18
January 2015 to 18 March 2015) and the summer deployment in Maui-Lāna‘i (30 June
2016 to 30 August 2016)............................................................................................46
8. Fitted values of average acoustic activity index (BAAI, transformed for the beta
regression) predicted from the GAM plotted against time of day categories ............47
9. Fitted values of average acoustic activity index (BAAI, transformed for the beta
regression) predicted from the GAM plotted against deployments... ........................48
10. GAM smoothers included in the model to account for spatial autocorrelation based on the
interaction of Longitude and Latitude........................................................................49
11. Percentage of hours from 5 October 2016 to 30 November 2016 with dolphin acoustic
detections in both Honolua Bay and Mānele Bay simultaneously, only Honolua Bay, only
Mānele Bay, or neither bay ........................................................................................50
12. Number of files in which spinner dolphin detections occurred in Honolua Bay only,
Mānele Bay only, or both bays simultaneously by hour of day.................................51
13. Spinner dolphin sightings from vessel surveys on the 2nd, 5th, 10th, and 11th of August
2016, and the 20th and 21st of June 2017. .................................................................52
A1. Mākua fall deployment root mean square sound pressure level in 1-octave frequency
bands by date from 01 Oct. 2016 to 30 Nov. 2016 (a) and by hour of day from
0000-2300 h (b)..........................................................................................................53

vii
A2. Honolua fall deployment root mean square sound pressure level in 1-octave frequency
bands by date from 05 Oct. 2016 to 30 Nov. 2016 (a) and by hour of day from
0000-2300 h (b)..........................................................................................................54
A3. Kahekili summer deployment root mean square sound pressure level in 1-octave
frequency bands by date from 30 June 2016 to 30 Aug. 2016 (a) and by hour of day from
0000-2300 h (b)..........................................................................................................55
A4. Kahekili winter deployment root mean square sound pressure level in 1-octave frequency
bands by date from 15 Jan. 2016 to 16 March 2016 (a) and by hour of day from
0000-2300 h (b)..........................................................................................................56
A5. Launiupoko summer deployment root mean square sound pressure level in 1-octave
frequency bands by date from 30 June 2016 to 20 Aug. 2016 (a) and by hour of day from
0000-2300 h (b)..........................................................................................................57
A6. Lōpā fall deployment root mean square sound pressure level in 1-octave frequency bands
by date from 30 Sep. 2016 to 30 Nov. 2016 (a) and by hour of day from 0000-2300 h
(b) ...............................................................................................................................58
A7. Mānele fall deployment root mean square sound pressure level in 1-octave frequency
bands by date from 30 Sep. 2016 to 30 Nov. 2016 (a) and by hour of day from
0000-2300 h (b)..........................................................................................................59
A8. Maui-Lāna‘i summer deployment root mean square sound pressure level in 1-octave
frequency bands by date from 30 June 2016 to 30 Aug. 2016 (a) and by hour of day from
0000-2300 h (b)..........................................................................................................60
A9. Maui-Lāna‘i winter deployment root mean square sound pressure level in 1-octave
frequency bands by date from 18 Jan. 2015 to 18 March 2015 (a) and by hour of day
from 0000-2300 h (b) .................................................................................................61
A10. MM17 summer deployment root mean square sound pressure level in 1-octave frequency
bands by date from 30 Jan. 2016 to 30 Aug. 2016 (a) and by hour of day from
0000-2300 h (b)..........................................................................................................62
A11. MM17 winter deployment root mean square sound pressure level in 1-octave frequency
bands by date from 15 Jan. 2016 to 16 March 2016 (a) and by hour of day from
0000-2300 h (b)..........................................................................................................63
A12. North Mala summer deployment root mean square sound pressure level in 1-octave
frequency bands by date from 30 June 2016 to 30 Aug. 2016 (a) and by hour of day from
0000-2300 h (b)..........................................................................................................64

viii
B1. Detection ranges of the Maui-Lānaʻi, Kahekili, North Mala, Launiupoko, and MM17
EARs from the August 2016 pinger tests using a 4-7 kHz signal represented by circles.
....................................................................................................................................67

9
Introduction
The spinner dolphin (Stenella longirostris) is a well-studied odontocete species found throughout
the Hawaiian island chain. Hawaiian spinner dolphins are considered genetically distinct from
other populations in the Pacific Ocean (Andrews et al., 2010). Within the Hawaiian Islands,
spinner dolphins are regularly found around Kure Atoll, Midway Atoll, Pearl & Hermes Reef,
and the French Frigate Shoals of the Northwestern Hawaiian Islands, as well as all the Main
Hawaiian Islands (Niʻihau, Kauaʻi, O‘ahu, Moloka‘i, Lānaʻi, Kahoʻolawe, Maui, and Hawaiʻi
Island). Population genetic analyses published in 2006 revealed that spinner dolphins in the Kure
Atoll, Midway Atoll, and Pearl & Hermes Reef of the Northwestern Hawaiian Islands formed
one distinct interbreeding group (Andrews et al., 2006). Genetic differentiation was found
between the Kona Coast of Hawai‘i Island and all the other islands, including Maui, which lies
only 46 km away (Andrews et al., 2010). There was little genetic distinction between Kure and
Midway Atolls, and between French Frigate Shoals, Niʻihau, Kauaʻi, and O‘ahu. Additionally,
French Frigate Shoals and O‘ahu had the highest inferred migration rates based on the number of
individuals with genetics more similar to those found on an island other than the one from which
they were sampled (Andrews et al., 2010).
Currently, six stocks of Hawaiian spinner dolphins are recognized in the U.S. Exclusive
Economic Zone (EEZ) based on population genetic analyses. The island-associated stocks extend
up to 10 nautical miles (nm) from shore: Hawai‘i Island, O‘ahu/4-islands, Kauaʻi/Niʻihau, Pearl
and Hermes Reef, Midway Atoll/Kure. Spinner dolphins found beyond 10 nm, but within the
EEZ are considered part of the Hawai‘i Pelagic stock, which includes the population at French
Frigate Shoals (National Oceanic and Atmospheric Administration [NOAA], 2012). The best
estimates of population size by stock tend to be based on surveys in small geographic areas of

10
the islands conducted 10-15 years ago and are therefore likely underestimations of the true
population sizes. The estimated population size of the Hawai‘i Island stock based on a survey of
the leeward coast is 790 (CV=0.17) dolphins (Hill et al., 2011). The O‘ahu/4 Island stock has an
estimated population of 355 (CV=0.09) based off of a 2007 survey effort on the leeward side of
O‘ahu (Hill et al., 2011). The population estimate for the Kauaʻi/Niʻihau spinner dolphin stock is
601 (CV=0.2). This estimate was based off of a 2005 survey on the leeward coast of Kauaʻi
(NOAA, 2012). There are no current estimates for the populations at Pearl and Hermes Reef,
Midway Atoll/Kure, or the Hawai‘i Pelagic stocks (NOAA, 2012). A 2002 shipboard line-
transect survey of the entire Hawai‘i EEZ estimated the Hawaiian spinner dolphin population to
be 3,351 (CV=0.74), however this estimation is outdated and likely also an underestimate
(Barlow, 2006).
Past research off the Kona coast has established that spinner dolphins are reliably found
along Hawaiʻi Island’s sloping coastlines where they follow predictable, daily behavioral
routines (Norris et al., 1994). These cycles consist of nocturnal foraging offshore, and a return to
shallower waters to rest during the day (Norris et al., 1994). Spinner dolphins feed on vertically
migrating mesopelagic fish, and mesopelagic and epipelagic squid typically found in deeper
waters of the island slopes near the 1000-fathom contour (Klinowska, 1991; Norris et al., 1994;
Benoit-Bird et al., 2001; 2003). By dawn, the dolphins transition to a bout of increased aerial
activity followed by zig-zag swimming in which the dolphins frequently change the direction of
their swimming (Norris et al., 1994). The highly dispersed school begins to tighten into
subgroups as it moves into shallower, protected bays to rest (Norris et al., 1994).
Aerial surveys off the Kona coast in 1979-1980 suggested that bay selection was
opportunistic and showed a positive correlation between the closeness of deep water to shore and

11
the presence of dolphins in nearby coves (Norris et al., 1994). However these surveys also
showed that if visibility or weather conditions were poor, the dolphins would relocate to calmer
bays. While in the bays, spinner dolphins confine their movements to areas over white coral sand
and avoid dark reefs. This preference for shallow bays with low rugosity has also been
demonstrated in modeling of spinner dolphin habitat in the Main Hawaiian Islands (Thorne et al.,
2012). The need for clear visibility is attributed to the dolphins’ shift from primarily employing
echolocation to monitor their environment, to relying more on vision in the resting state (Norris
et al., 1994).
Since these surveys, it has been observed that groups of spinner dolphins off the islands
of Hawaiʻi, Lānaʻi, and O‘ahu show site fidelity and exhibit these predictable patterns of
behavior (Benoit-Bird et al., 2003; Bazúa-Durán & Au, 2004; Lammers et al., 2004; Tyne et al.,
2014; M.O. Lammers, pers. comm., 2015). However, there is another, more cryptic group that
occupies the coastline along west Maui. This group is commonly seen in the broader Maui Nui
area (between Maui, Molokaʻi, and Lānaʻi), but their behavioral use of the coastline and inter-
island channels is variable and poorly understood. This area is of particular interest because
Maui Nui has a uniquely shallow bathymetry compared to the steeper island slopes where the
Hawaiʻi Island, Lānaʻi, and O‘ahu spinner dolphins occur (Price & Elliot-Fisk, 2004). Therefore,
it is unclear how these dolphins complete their day/nighttime behavioral cycle, given the
relatively far distance to deep, island-slope waters. It is unknown whether this stock of spinner
dolphins expend more energy to travel the extra distance to the island slopes off west Lānaʻi or if
they exploit another source of prey.
In addition, the west Maui coast has been subject to intense urbanization and human
activity over the past three decades with the construction of numerous resorts and the growth of

12
recreational water activities. These activities, which include whale-watching tours, snorkeling
tours, parasailers, and recreational boaters, mostly occur in the shallow waters typically preferred
by spinner dolphins for daytime resting. This is a concern because human activity can disturb
dolphins and interrupt their resting periods or displace them from their prime resting locations
(Tyne et al., 2014).
Previous research in Shark Bay, Australia showed that an increase in the number of
dolphin tour vessels led to a significant decrease in the abundance of bottlenose dolphins (Bejder
et al., 2006). Studies conducted off the Kona coast of the Island of Hawaiʻi have shown that
human activities frequently interrupt dolphins at rest, and bays with dolphin-centric human
activities have greater amounts of dolphin acoustic activity, suggesting a reduction in rest
(Courbis & Timmel, 2009; Heenehan et al., 2016a, 2016b). Dolphins off Mākua Beach, O‘ahu
have also shown a decrease or delay of rest possibly in response to swimmers (Danil et al.,
2005). These interruptions are important to note since spinner dolphins that have been displaced
from a resting bay are thought to be unlikely to enter a resting state elsewhere (Tyne et al.,
2015). Spinner dolphins are also less resilient to human disturbance because of their consistent
daily behavioral cycles which cause their resting behavior to take place near human activities
(Tyne et al., 2017).
Recently in the Hawaiian Islands, the National Marine Fisheries Service proposed a 50-
yard approach limit for spinner dolphins in the wake of concerns over the possible negative
impacts of human disturbance (NOAA, 2016). In order to measure the efficacy of any
implemented regulations, there needs to be a baseline of current spinner dolphin habitat-use and
behavior patterns for comparison. The aim of this study is to provide this baseline information,
and examine if the dolphins in Maui Nui are exhibiting signs of adapting to habitat loss of prime

13
resting locations due to coastal development or boating activities. This analysis has the potential
to reveal behavioral trends that reflect the impacts of past and current human activities, and when
compared to studies conducted after the implementation of the new regulations, it can be used to
determine whether the regulations have had an impact on increasing spinner dolphin resting
behavior in areas affected by human activity.
To answer these questions and understand the habitat-use patterns of spinner dolphins in
Maui Nui, a combination of passive acoustic methods and vessel surveys were employed.
Spinner dolphins are an acoustically active species and their presence can be monitored by
autonomous recorders (Lammers & Munger, 2016). Passive acoustic monitoring and visual
survey methods have been shown to produce equivalent results in presence/absence studies, but
passive acoustic monitoring has the added benefit of providing continuous data recording
regardless of the time of day or weather conditions (Lammers & Munger, 2016). The vessel
surveys in this study are intended to supplement the acoustic data with visual confirmation of
species and behavior.
Spinner dolphins have three types of acoustic behavior: whistles, echolocation clicks, and
“burst pulse” click trains. Frequency modulated, tonal whistles and “burst pulse” click trains are
the main types of acoustic signals in social interactions (Lammers et al., 2006). Whistles have a
fundamental frequency range of 2-22 kHz and are generally used for group coordination when
the dolphin pod is spread out (Norris et al., 1994; Bazúa-Durán & Au, 2002). Echolocation clicks
range between 2 and 200 kHz with an inter-click interval greater than 10 milliseconds and are
primarily used as biosonar while foraging or navigating the environment (Au, 1993; Lammers et
al., 2004). Burst pulse click trains and echolocation clicks have a similar frequency range, but
burst pulse click trains have a smaller inter-click interval of 0.5-10 milliseconds (Lammers et al.,

14
2004). Burst pulses are used by nearby dolphins to communicate (Lammers et al., 2004). When
resting, spinner dolphins remain fairly silent but increase their acoustic activity while traveling or
foraging. Therefore, the variation in timing and type of acoustic behavior can be used to
determine the dolphins’ presence in a given area and infer their social state (Heenehan et al.,
2016a, 2016b).
Methods
Passive Acoustic Monitoring
Ecological Acoustic Recorders (EARs) are bottom-moored autonomous recorders programmed
to provide long-term monitoring for the presence of spinner dolphins at regular intervals
(Lammers et al., 2008a). EARs were deployed at nine locations: in Maui Nui along the west
Maui coast at Honolua Bay, off Kahekili beach, north of the Mala boat ramp (North Mala), off
Launiupoko beach park, and off Mile Marker 17 on the Honoapiʻilani highway (MM17); along
Southeast Lānaʻi at Mānele Bay and off Lōpā beach; in the Maui-Lānaʻi channel, also known as
the ʻAuʻau channel; and in an established resting bay off the Waiʻanae coast of O‘ahu known as
Mākua (Figure 1). The Mākua Beach location on O‘ahu was selected to represent the bioacoustic
activity pattern that can be expected to be present in a spinner dolphin resting bay.
Each EAR was set to record at a sample rate of 64 kHz on a 10% duty cycle of 30
seconds every 300 seconds producing recordings with an effective bandwidth of 0-32 kHz. This
frequency range is sufficient to capture the fundamental frequencies of spinner dolphin whistles
and the lower end of the frequency range of click trains (Au, 1993). The detection radii of the
Kahekili, Launiupoko, Maui-Lāna‘i, MM17, and North Mala summer deployments were
estimated with a series of pinger tests (Appendix B). EARs in relatively shallow water

15
(~12-20 m) were diver-deployed and moored with a 60-lb concrete block set on the sandy
substrate by certified scientific scuba divers. These included the Mākua, Honolua, Kahekili, and
MM17 EARs. The other EARs were deployed in deeper waters (~30-70 m) and were each
anchored by 125 lbs of sand bags connected to the EAR, which was coupled with paired
SubSeaSonic AR-60 acoustic releases to execute the recovery.
The EARs recorded for at least two months. The North Mala, Maui-Lānaʻi, and
Launiupoko EARs were deployed in late June 2016 and recovered in late September 2016. The
Kahekili and MM17 EARs were deployed in June 2016 and recovered in December 2016. The
Lōpā and Mānele EARs were deployed from late September 2016 to the beginning of December
2016. The Honolua EAR was deployed in October 2016 and was recovered in mid-December
2016, while the Mākua EAR was deployed at the end of September 2016 and was recovered in
February 2017. In addition, archived data from winter deployments at the Maui-Lānaʻi (mid-
January 2015 to mid-March 2015), Kahekili (mid-January 2016 to mid-March 2016), and MM17
(mid-January 2016 to mid-March 2016) EAR sites made during a previous project were analyzed
to detect any seasonal patterns in spinner dolphin acoustic activity. The Maui-Lānaʻi deployment
had a sample rate of 125 kHz with an effective bandwidth of 0-62.5 kHz, and the Kahekili and
MM17 deployments had sample rates of 50 kHz with effective bandwidths of 0-25 kHz. See
Table 1 for deployment specifications.
Analysis of Acoustic Recordings
EAR recordings were converted from .BIN format files to .ewav files using a custom script in
MATLAB (The Mathworks Inc., Natick MA; Version 2015b). The recordings were then visually
scanned in the MATLAB program Triton (Wiggins, 2003) using an FFT length of 1400 points,

16
with 50% overlap, and a plot length of 15 seconds. For each recording containing dolphin
signals, dolphin acoustic activity was quantified using an Acoustic Activity Index (AAI) based
on the quantity of whistles, clicks, and burst pulses present (Table 2). The resulting data were
compiled to establish the average acoustic activity index for each hour of the day for every day
of every deployment. In order to characterize the ambient noise of each EAR location, root mean
square sound pressure level (RMS SPL) was calculated for each deployment in 1-octave
frequency bands and plotted by date and hour of the day (Appendix A). The frequency ranges of
each octave band in the RMS SPL plots vary depending on the sampling rate of the deployment.
All dB are re 1 µPa.
In order to test the significance of deployment (site and season) and time of day as
predictors of variation in spinner dolphin acoustic activity, a generalized additive model (GAM)
with a beta regression distribution was fitted to the data. This model was selected because the
distribution of AAI is nonparametric, positive, and bounded. The statistical tests were performed
in the software package R with base, lmtest, dplyr, car, MuMIn, mgcv, StreamMetabolism, tidyr,
ggplot2, and colorspace packages (Zeileis & Hothron, 2002; Wickham, 2009; Fox & Weisberg,
2011; Wood, 2011; R Core Team, 2015; Wickham & Francois, 2015; Barton, 2016; Ihaka et al.,
2016; Sefick Jr., 2016; Wickham & Henry, 2018).
Deployment was tested as a variable for acoustic activity because it was expected that
spinner dolphins utilize certain areas in various seasons differently than others in their daily
behavioral cycles and as a result, different deployments would have varying acoustic patterns.
Time of day was binned into three categories for analysis in order to reduce temporal
autocorrelation within the data. The hours between local sunrise and noon (1200 h) were defined
as “Sunrise-Noon” in order to characterize the acoustic activity of spinner dolphins during the

17
hours in which they typically are traveling from foraging grounds to the nearshore resting bays
and beginning their resting behaviors. The hours between noon and local sunset were defined as
“Noon-Sunset” to characterize the acoustic activity of spinner dolphins during the hours in which
they transition from resting to traveling offshore to foraging grounds. The final category, “Night”
was defined as the hours between sunset and sunrise, when dolphins exhibit foraging behavior
(Norris et al., 1994; Tyne et al., 2015).
Vessel Surveys
Concurrent with the EAR deployments, vessel surveys and focal follows were used to provide
additional detail about the spinner dolphins’ movements and behavioral state at different
locations in Maui Nui. An initial series of seven surveys were conducted over a two-week period
in August 2016 that covered the west Maui coast and offshore waters where spinner dolphins
have been reported. The survey tracks closely followed the location of the EAR deployments in
order to confirm spinner dolphin presence. Each survey began out of Lāhainā Harbor in a 21-ft
cuddy cabin vessel with two observers on board cruising at 10 knots. When animals were
encountered and conditions permitted, spinner dolphin groups were followed for as long as
feasible with the ultimate goal of observing the group through their resting period and tracking
them to their foraging area in the late afternoon and early evening. As the dolphins were tracked,
their group size, location, and behavior were recorded every 15 minutes using an established
ethogram of typical behaviors (Lammers et al., 2004). Three additional vessel surveys took place
in June of 2017.

18
Results
Passive Acoustic Monitoring
A total of 191,808 recordings were manually scanned for dolphin acoustic signals, and assigned
a value for the AAI. The average AAI was plotted by each deployment in Figure 2, and by hour
of day for each deployment in Figure 3 to illustrate the diel patterns that occur within each 24-
hour day. Average AAI for each time of day category within each deployment were compared in
Figure 4. RMS SPL plotted against the hour of day and date for each deployment can be found in
Appendix A. All deployments detected snapping shrimp chorusing as indicated by the peaks in
RMS SPL between 0500 to 0700 h and 1800 to 2000 h (Figure A1-A12; Kaplan et al., 2017).
Mākua – fall
The deployment off of Mākua Beach on O‘ahu represents a well-established spinner dolphin
resting bay. Therefore, the average AAI and diel patterns in acoustic activity provide a baseline
with which to compare data collected from all other deployments. The Mākua deployment had
the greatest acoustic activity of all deployments with an average hourly AAI of 0.181 ± 0.011
(Figure 2). This higher average is also apparent in the diel trends shown in Figure 3. Average
hourly AAI was greatest at Mākua from 0600 to 1600 h with a peak of 0.635 at 0800 h and a
second peak of 0.249 at 1500 h. Acoustic activity persisted during the nighttime hours, but at
lower levels with the highest average of 0.051 occurring from 2000 to 2100 h.
In the Mākua soundscape—based on the RMS SPL calculations— the fullband
frequencies had an average SPL between 107 and 109 dB (Figure A1-a). Low frequencies

19
between 0 and 1.56 kHz fluctuated around 95 dB, peaking at 97 dB between 0600 and 1800 h.
The range of frequencies in which dolphin signals occur, 1.56-25 kHz, had SPLs between 94 and
108 dB (Figure A1-b).
Honolua – fall
The average hourly AAI in Honolua Bay was 0.049 ± 0.006 (Figure 2). Diel patterns also
revealed greater average AAI during daytime hours than nighttime hours (Figure 3). Hourly
average AAI had a maximum of 0.194 at 0800 h and a small secondary peak of 0.054 at 1400 h.
RMS SPL of the ambient noise in Honolua Bay ranged between 110 and 112 dB in the fullband
frequencies. Low frequencies of 0-2 kHz ranged between 95 and 102 dB. The octave bands that
include dolphin signals (2-32 kHz) ranged from 100 to 108 dB (Figure A2-a). A slight increase
in the lowest octave band of approximately 1 dB occurred between 1000 and 1500 h (Figure A2-
b).
Kahekili – summer
The average AAI for recordings in the Kahekili summer deployment by day is 0.006 ± 0.001
(Figure 2). The highest AAI averaged by hour was 0.024 at 1500 h (Figure 3). The 0-2 kHz
octave band RMS SPL varied between 100 and 102 dB, while the octave bands between 2 and 32
kHz varied between 100 and 108 dB, and the fullband varied between 112 and 113 dB (Figure
A3-a). The peaks indicating snapping shrimp chorus were most notable in the 0-2 kHz octave
band. This low frequency band was also the only octave band to show a greater SPL during the
daytime hours than in the nighttime hours (Figure A3-b).

20
Kahekili – winter
The winter deployment in Kahekili had less acoustic activity than the summer deployment with
an average AAI of 0.001 ± 0.001 (Figure 2). The greatest AAI averaged by hour was 0.012 at
1500 h (Figure 3). The RMS SPL of the fullband frequencies varied between 113 and 118 dB.
Frequencies between 1.56 and 25 kHz ranged between 99 and 116 dB, and the low frequency
octave band of 0-1.56 kHz ranged between 111 and 116 dB (Figure A4-a). The average SPL of
the lowest frequency octave band was greater than any of the other individual octave bands
(Figure A4-b). This was likely due to the presence of humpback whale song during the
humpback whale breeding season (Au et al., 2000).
Launiupoko – summer
The Launiupoko deployment had an average AAI of 0.018 ± 0.002 (Figure 2). The greatest AAI
averaged by hour was 0.040 at 1200 h (Figure 3). The fullband RMS SPL ranged between 105
and 109 dB, the 0-2 kHz octave band ranged between 95 and 101 dB, and the octave bands
ranging from 2 to 32 kHz varied between 91 and 104 dB (Figure A5-a). In this deployment the
RMS SPL was greater during the daytime hours between 0600 and 1900 h than the nighttime
hours. The most notable increase within this timeframe was approximately 4 dB in the 0-2 kHz
and 2-4 kHz octave bands (Figure A5-b).
Lōpā – fall
The average AAI for the deployment off of Lōpā was 0.005 ± 0.001 (Figure 2). The hour with
the greatest average AAI was 1100 h with a value of 0.026 (Figure 3). In the Lōpā deployment
the RMS SPL of the fullband frequencies fell between 108 and 111 dB (Figure A6-a). The 0-2

21
kHz octave band had RMS SPLs between 95 and 107 dB, and the octave bands between 2-32
kHz varied between 95 and 104 dB, with the 4-32 kHz ranging between 102 and 104 dB. The
RMS SPL of the 0-2 kHz octave band had a peak at 101 dB around 0800 h that was not reflected
in the other frequencies (Figure A6-b).
Mānele – fall
Of the Maui Nui EARs, the Mānele Bay deployment had the greatest average AAI of 0.073 ±
0.008 (Figure 2). When averaged by hour of day, AAI was greater between 0700 and 1600 h than
during the nighttime hours, and the greatest AAI of 0.232 occurred at 1200 h (Figure 3). A
second peak of 0.180 occurred at 1500 h. The RMS SPL of the fullband frequencies had little
fluctuation over the duration of the deployment with a range between 113 and 114 dB (Figure
A7-a). The 0-2 kHz octave band ranged between 98 and 100 dB, while the 2-32 kHz frequencies
fell between 102 and 110 dB. Diel patterns in the RMS SPL of the 0-2 kHz octave band show a 3
dB increase during the daytime hours with a peak of 101 dB at 1000 h (Figure A7-b). Vessel
traffic may have caused the increase in low frequency noise during the day.
Maui-Lāna‘i – summer
The summer deployment at the Maui-Lāna‘i location had an average AAI of 0.045 ± 0.005
(Figure 2). The diel averages indicate that acoustic activity occurs at night in this location with
the highest nighttime hourly average of 0.047 occurring at 0300 h. The acoustic activity is
greater during the day; the highest average AAI occurs at 0900 h with a value of 0.103 (Figure
3). A second peak occurs at 1500 h with a value of 0.097.

22
The Maui-Lāna‘i summer deployment had one of the quieter soundscapes with a fullband
RMS SPL fluctuating between 103 and 106 dB (Figure A8-a). Low frequencies of 0-2 kHz as
well as the frequencies from 2 to 32 kHz ranged from 93 to 100 dB. Frequencies ranging
between 0 and 8 kHz showed a 3-5 dB increase in RMS SPL between the hours of 0600 and
1600 h (Figure A8-b).
Maui-Lāna‘i – winter
The Maui-Lānaʻi winter dataset had high levels of ambient snapping shrimp broadband acoustics
that distorted the upper frequency range, thus only whistles were detected. The average AAI was
0.013 ± 0.002, much lower than the average from the summer deployment in the same location
(Figure 2). Average AAI was greatest at 0800 h with an average value of 0.031 (Figure 3). This
deployment had one of the louder soundscapes with its fullband RMS SPL ranging between 110
and 116 dB (Figure A9-a). Octave bands from 3.9 to 62.5 kHz varied between 93 and 99 dB,
while the 0-3.91 kHz octave band was 109-116 dB (Figure A9-b). As seen in the winter
deployment of the Kahekili EAR, these higher RMS SPLs particularly in the lower frequencies
correlate with the presence of humpback whale song.
MM17 – summer
Average AAI of the MM17 summer deployment was 0.015 ± 0.002 (Figure 2). When averaged
by hour of day, 0000 h had the greatest AAI of 0.038 (Figure 3). The RMS SPL of the fullband
frequencies was 105-106 dB indicating that this deployment was relatively quieter than the
others (Figure A10-a). The 0-2 kHz octave band had RMS SPL’s from 96 to 98 dB, and the 2-32

23
kHz octave bands were 93-103 dB. RMS SPL varied only by approximately 1 dB when averaged
by hour of day (Figure A10-b).
MM17 – winter
The winter deployment at MM17 had lower levels of dolphin acoustic activity than its summer
counterpart with an average of 0.004 ± 0.001 (Figure 2). The greatest average AAI by hour
occurred at 1900 h with a value of 0.013 (Figure 3). The RMS SPL’s were greater in this
deployment than those of the summer deployment. The fullband frequencies averaged between
109 and 117 dB (Figure A11-a). The frequencies from 1.56 to 25 kHz were 93-103 dB, while the
low frequency band from 0 to 1.56 kHz had higher SPLs from 107 to 117 dB. The higher RMS
SPL of lower frequencies in this deployment correlates with the presence of humpback whale
song. Apart from the peaks in RMS SPL due to snapping shrimp, there were no diel patterns
(Figure A11-b).
North Mala – summer
The North Mala deployment had an average hourly AAI of 0.027 ± 0.003 (Figure 2). The
greatest hourly average of AAI was 0.117 at 1300 h (Figure 3). Nighttime acoustic activity had
two peaks in the average AAI of 0.042 at 2000 h and 0.030 at 0100 h. The RMS SPL of the
fullband frequencies was 108-114 dB, the 0-2 kHz octave band varied between 96 and 106 dB,
and the octave bands from 2 to 32 kHz were 96-109 dB (Figure A12-a). The North Mala
deployment had the greatest difference in RMS SPL between nighttime hours and daytime hours
with a 9 dB increase during daytime hours in the 0-2 kHz octave band (Figure A12-b).

24
Seasonal Patterns
For the locations in which deployments took place during different seasons, the average hourly
AAI was plotted by hour of day and season. In the winter deployment, Kahekili had the greatest
average AAI of 0.012 at 1500 h followed by 0.009 at 0900 h. The only other hours of the day
with average AAI greater than zero were 0200, 0800, and 1600 to 1800 h (Figure 5). The
summer deployment had the greatest average AAI of 0.024 at 1500 h followed by 0.021 at 1100
h and 0.019 at 0900 h. The hours of day in the summer deployment with average AAI greater
than zero included 0700 to 1800 h and 2300 h (Figure 5).
MM17 had peaks of acoustic activity during the nighttime hours of 1900 to 0400 h which
was apparent in both the winter and summer deployments. In the winter deployment, MM17 had
the greatest average AAI of 0.013 at 1900 h followed by 0.012 at 0100 h. At 1000, 1200, 1300,
and 1600 h the average AAI was zero. In the summer deployment MM17 had a greatest average
AAI of 0.038 at 0000 h. Each hour of day had an average AAI greater than 0.002, and a mid-day
peak in average AAI of 0.024 and 0.022 occurred at 1000 and 1200 h respectively (Figure 6).
The winter deployment of the Maui-Lāna‘i EAR location had the greatest average AAI at
0800 and 1100 h with a value of 0.031. There was no hour of day with an average AAI of zero,
but the AAI dipped down to approximately 0.002 at 1300 and 2200 h. The summer deployment
in Maui-Lāna‘i had the highest average AAI at 0900 h of 0.103 with a secondary peak around
1500 h of 0.097. There were also elevated levels of average acoustic activity ranging between
0.036 and 0.047 during the nighttime hours of 0000 to 0400 h (Figure 7). In all three locations,
the summer deployment had higher average AAI over more hours of the day than the winter
deployment.

25
Generalized Additive Model
The following GAM was fit to the AAI, with the deployment (site and season), time of day, and
a two-dimensional spatial smoother as predictors:
gam(BAAI ~ DayCat + Deployment + s(Longitude, Latitude, k = 10),
family = betar(link = “cloglog”)).
The term “BAAI” used in the GAM represents the AAI averaged by time of day category
(Sunrise-Noon, Noon-Sunset, and Night) transformed so that 0 < BAAI < 1 (Table 2). The range
of AAI was adjusted to zero to one, and values exactly equal to zero or one were removed
through the following formula:
BAAI = (AAI / 3.5 * (n - 1) + 0.5) / n,
where n = 2,178. This transformation was necessary because a beta distribution—which best
describes the distribution of BAAI—assumes that no values are exactly equal to zero or one
(Smithson & Verkuilen, 2006). The term “DayCat” indicates the category for the time of day
previously defined as “Sunrise-Noon,” “Noon-Sunset,” and “Night.” A two-dimensional
smoother for the interaction of Longitude and Latitude was included in the model to account for
spatial autocorrelation.
The best fit models were determined using the dredge function in the MuMIn package to
compare models of all possible combinations of the predictors (Barton, 2016). Model 8 was
selected from the results as it included both predictors, DayCat and Deployment, the spatial
smoother, and had the lowest corrected Akaike information criterion (Table 3). All three
predictors were significant based on marginal F-tests: DayCat (chi-squared = 17.17, p-value =
0.000187), Deployment (chi-squared = 72.04, p-value = 6.06e-12), and the spatial smoother,
s(Longitude, Latitude), (chi-squared = 93.96, p-value < 2.0e-16). Deployment explained 4.07%

26
of deviance, and DayCat explained 1.01% of deviance (Table 4). Fitted BAAI values predicted
by the model were plotted against each predictor, time of day category and deployment, as well
as the spatial smoother. The fitted BAAI values predicted by the GAM show that hours between
sunrise and noon tend to have the greatest average BAAI, followed by hours between noon and
sunset, while hours at night have the lowest (Figure 8). Hours in the Mākua deployment have the
greatest predicted average BAAI, followed by the Maui-Lāna‘i summer deployment, Honolua
Bay, Mānele Bay, and the Launiuopoko summer deployment. The deployments with the lowest
predicted average AAI were the winter deployments in Kahekili and MM17 (Figure 9). The
spatial smoother indicates an increase in BAAI at the coordinates of the Mākua EAR (Figure 10).
Honolua Bay vs Mānele Bay
Honolua Bay and Mānele Bay were two Maui Nui locations that stood out from the other
deployments as having higher average AAI. Because these deployments were concurrent, it was
possible to compare on an hourly basis, whether spinner dolphin signals were detected only in
Honolua Bay, only in Mānele Bay, in both bays, or neither bay. At approximately 40 km distance
from each other, it is unlikely that a spinner dolphin recorded in one bay will be recorded in the
other bay within the same hour. Therefore, if dolphin signals are consistently seen in both bays
simultaneously, then there is likely a group with some level of site fidelity to Lāna‘i, and another
group with site fidelity to the west Maui coast. If dolphin signals are rarely seen in both bays
simultaneously, it is more likely that one group of spinner dolphins varies spending time in either
bay.
The percentage of hours in the deployments that included dolphin signals in Honolua Bay
only, Mānele Bay only, both bays simultaneously, or neither bay were calculated (Figure 12). Of

27
those deployments 47% of files did not contain dolphin signals in either location, 6% of files
contained dolphin signals in both locations within the same hour of day, and 24% and 23% of
files contained dolphin signals in only Honolua Bay and only Mānele Bay respectively. When
plotted by the hour of day during which these detections occurred, dolphin signals were detected
in both bays simultaneously between 0000 and 1400 h (Figure 13). Dolphin acoustic signals
were detected during all hours of the day in Honolua Bay except for 1800 h. The most hours with
only Honolua Bay detections occurred between 0600 and 0900 h. Hours with dolphin acoustic
signals in Mānele Bay only were detected during all hours of the day except for 1800 h with a
peak between 0700 and 1700 h (Figure 13).
Vessel Surveys
Out of ten surveys, six had successful spinner dolphin sightings (four from 2016 and two from
2017), of which five involved extended focal follows that allowed the tracking of animals
(Figure 13). Generally, the spinner dolphin sightings first occurred in the late-morning before
noon and continued into the afternoon. Dolphins were typically first seen along west Maui in the
late-morning hours between 1100 and 1200 h and then followed into the Maui-Lānaʻi channel by
early afternoon (Table 5). On two occasions the spinner dolphins were tracked as they moved
toward the southeast side of Lānaʻi in the late afternoon, at which point the dolphins were
steadily traveling towards Lānaʻi’s south shore.
The first spinner dolphin sighting occurred on 2 August 2016 when a small group of four
individuals was spotted at 0908 h along the west coast of Maui, just north of the North Mala
EAR. The sighting was short and ended at 0923 h in roughly the same location. On 5 August
2016 a group estimated to be between 150-180 spinner dolphins was first located at 1218 h near

28
the west Maui coast between the North Mala EAR and Lāhainā. The dolphins were seen milling
and resting as they moved north towards Kāʻanapali, and then reversed to move down the
coastline and into the ʻAuʻau channel past the Maui-Lāna‘i EAR. The sighting ended at 1649 h
with the group moving eastward back into the channel.
On 10 August 2016 at 1132 h, an estimated 50 spinner dolphins were sighted north of the
Kahekili EAR close to the Maui coastline. This group was followed into the middle of the
ʻAuʻau channel where they were lost track of at 1403 h. The following day on 11 August 2016
approximately 80 spinner dolphins were spotted between the Kahekili and North Mala EARs at
1053 h. The group moved perpendicularly away from shore into the ʻAuʻau channel. By the end
of the sighting at 1323 h, there were an estimated 50 individuals in the group being tracked.
Surveys continued the following summer during which, spinner dolphins were first
sighted on 20 June 2017 at 1138 h. The group was composed of approximately 140 dolphins and
were found between Lāhainā harbor and the Launiupoko EAR. The dolphins made their way
across the ʻAuʻau channel towards the Lōpā EAR off the southeast side of Lāna‘i where the
sighting was ended at 1553 h. By that time, the spinner dolphins had increased their aerial
activities and were traveling southwest of Lāna‘i. The final dolphin sighting occurred on 21 June
2017 with approximately 140 individuals between the Lōpā and Maui-Lāna‘i EAR at 1217 h.
This group changed their direction of travel between Maui and Lāna‘i four times before heading
towards the Lōpā EAR at 1435 h and continuing in a southwestern direction.
Discussion
Spinner dolphin habitat-use patterns in Maui Nui do not follow the same patterns of site fidelity
to specific bays that has been documented off the Kona coast of Hawai‘i Island and the Wai‘anae

29
coast of O‘ahu (Norris et al., 1994; Lammers et al., 2004; Thorne et al., 2012). Based on the
combination of passive acoustic monitoring and vessel surveys, the evidence from this study
suggests that spinner dolphins utilize the west Maui coastline, the southeast Lāna‘i coastline, and
the ʻAuʻau channel during their daytime resting behaviors in Maui Nui. The Maui Nui
monitoring sites could be distinguished from the O‘ahu sites by lower acoustic activity, and less
defined bimodal diel patterns of acoustic activity.
Deployment (site and season) as well as the time of day in which an hour occurred
whether it be from sunrise to noon, noon to sunset, or night, and a two-dimensional spatial
smoother were significant predictors of the average acoustic activity index (BAAI). In other
words, there were spatial, seasonal, and diel patterns in the acoustic activity of dolphins in Maui
Nui and Mākua Beach. There is a clear distinction in the AAI between the Mākua site and the
Maui Nui sites. More specifically, the deployment in Mākua, which was used as a baseline for
spinner dolphin acoustic activity in a well-established resting bay, had the greatest average
hourly acoustic activity index (AAI) of 0.181 ± 0.011. Honolua Bay and Mānele Bay were the
two deployment locations in Maui Nui with the greatest average AAI of 0.049 ± 0.006 and 0.073
± 0.008 respectively, which peaked between 0600 and 1300 h. The North Mala and Maui-Lāna‘i
summer deployments also had AAI averages greater than the other Maui Nui EARs (0.027 ±
0.003 and 0.045 ± 0.005 respectively) with peak average AAI between 0800 and 1800 h (Figure
3). The Mākua deployment showed two peaks in activity, one at 0800 h and a second at 1500 h.
The bimodal nature of dolphin acoustic activity illustrates the times during the day in which
spinner dolphins enter or exit their rest behavior (Lammers et al., 2008b). This bimodal trend is
also reflected in the Mānele Bay deployment and the Maui-Lāna‘i summer deployment, while
30
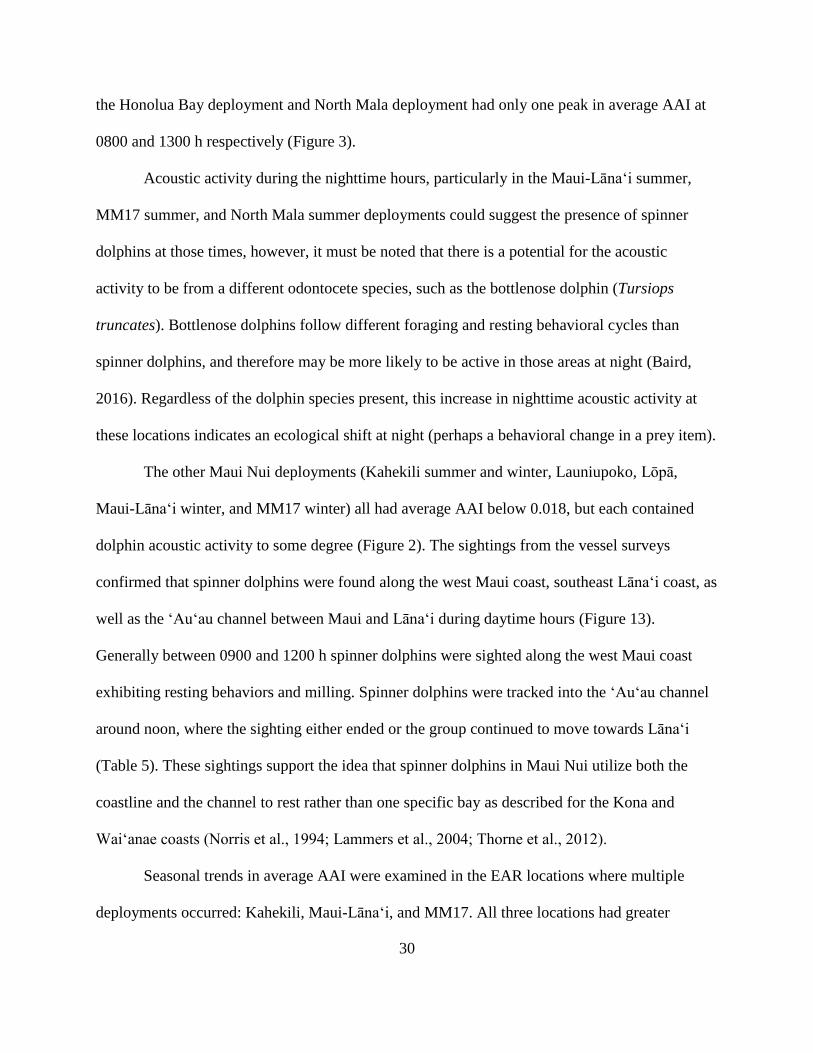
the Honolua Bay deployment and North Mala deployment had only one peak in average AAI at
0800 and 1300 h respectively (Figure 3).
Acoustic activity during the nighttime hours, particularly in the Maui-Lāna‘i summer,
MM17 summer, and North Mala summer deployments could suggest the presence of spinner
dolphins at those times, however, it must be noted that there is a potential for the acoustic
activity to be from a different odontocete species, such as the bottlenose dolphin (Tursiops
truncates). Bottlenose dolphins follow different foraging and resting behavioral cycles than
spinner dolphins, and therefore may be more likely to be active in those areas at night (Baird,
2016). Regardless of the dolphin species present, this increase in nighttime acoustic activity at
these locations indicates an ecological shift at night (perhaps a behavioral change in a prey item).
The other Maui Nui deployments (Kahekili summer and winter, Launiupoko, Lōpā,
Maui-Lāna‘i winter, and MM17 winter) all had average AAI below 0.018, but each contained
dolphin acoustic activity to some degree (Figure 2). The sightings from the vessel surveys
confirmed that spinner dolphins were found along the west Maui coast, southeast Lāna‘i coast, as
well as the ʻAuʻau channel between Maui and Lāna‘i during daytime hours (Figure 13).
Generally between 0900 and 1200 h spinner dolphins were sighted along the west Maui coast
exhibiting resting behaviors and milling. Spinner dolphins were tracked into the ʻAuʻau channel
around noon, where the sighting either ended or the group continued to move towards Lāna‘i
(Table 5). These sightings support the idea that spinner dolphins in Maui Nui utilize both the
coastline and the channel to rest rather than one specific bay as described for the Kona and
Wai‘anae coasts (Norris et al., 1994; Lammers et al., 2004; Thorne et al., 2012).
Seasonal trends in average AAI were examined in the EAR locations where multiple
deployments occurred: Kahekili, Maui-Lāna‘i, and MM17. All three locations had greater

31
average AAI overall as well as by hour of day in the summer deployment than the winter
deployments (Figure 2, 5-7). Winter deployments coincide with the humpback whale breeding
season in Hawai‘i. It is possible that spinner dolphins utilize other, less populated areas during
this time, as they have been shown to do when exposed to increased human activity (Courbis &
Timmel, 2009). Further exploration of seasonal trends in other Maui Nui locations, as well as
studying the interactions between humpback whales and spinner dolphins would shed light on
whether spinner dolphins do in fact, move to a new location to rest and/or reduce the acoustic
signals they produce when humpback whales are present. Another possible explanation for
seasonal trends in dolphin acoustic activity is seasonal change in prey distributions. Spinner
dolphins have been shown to follow closely both the vertical and horizontal migrations of the
mesopelagic boundary community (Benoit-Bird & Au, 2003). Therefore, changes in the spatial
patterns of dolphin acoustic activity would likely mirror changes in the prey distribution.
The Honolua Bay and Mānele Bay deployments were among the sites with the highest
levels of AAI. When compared by concurrent hours, these two deployments had dolphin acoustic
activity in both bays within the same hour only 6% of the time (Figure 11). The hours in which
dolphin acoustic activity was detected in either bay were split almost evenly between both
locations. This suggests that rather than one Lāna‘i group of spinner dolphins and a separate
group of west Maui spinner dolphins, there is likely one main group that occupies the area using
both island coasts. The presence of dolphin acoustic detections in Honolua Bay (especially in the
earlier morning hours of 0600 to 0800 h) is particularly interesting due to the distance from
presumed foraging grounds west of Lāna‘i (Benoit-Bird & Au, 2003). With Mānele Bay’s close
proximity to this foraging area, it seems unlikely that spinner dolphins would select Honolua Bay
approximately the same percentage of the time. Therefore, it is likely that dolphins are exploiting

32
a food source in the Pailolo channel (between Maui and Molokaʻi) north of Honolua Bay.
Acoustic data collected from an EAR for a previous project within the Pailolo channel contained
echolocation clicks during the nighttime hours, suggesting that foraging by odontocetes does
indeed occur in this area (Howe, 2016). Further research on the movement of the mesopelagic
and epipelagic fish, squid, and shrimp community in the Pailolo channel could provide stronger
evidence of whether or not spinner dolphins are utilizing a food resource in this area.
This study documents the ways in which spinner dolphins use the Maui Nui region for
their daytime socializing and resting behavior. This analysis is timely as it provides a baseline of
dolphin behavior and movement in the west Maui/Lāna’i area prior to the implementation of a
new regulation that will limit the approach of humans to spinner dolphins to 50 yards with the
potential for time-area closures (NOAA, 2016). The acoustic patterns described here can be
compared to those collected in future deployments to reveal any changes in spinner dolphin
habitat-use. Additionally, an understanding of the areas in Maui Nui that are frequented by
spinner dolphins during their resting behaviors can inform resource managers which locations
are particularly in need of protection. In the case of spinner dolphins in Maui Nui, dolphins move
throughout the ʻAuʻau channel in addition to the coastlines of Maui and Lāna‘i, thus a time-area
closure would not be practical or effective in providing protection. The application of the 50-
yard approach limit would be a better option for the Maui Nui region as the closure of the entire
channel is unrealistic. Time-area closures are a more viable option in areas where spinner
dolphins exhibit the site fidelity to resting bays observed along the Kona and Wai‘anae coasts.
This study demonstrates the necessity of establishing existing behavioral patterns of the species
of interest before implementing management plans in a particular region in order to select the
plan that will have the greatest likelihood of success.

33
Conclusion
The spinner dolphins in Maui Nui use the habitat during their daily behavioral cycles differently
than has been described for spinner dolphins along the Kona coast of Hawaiʻi Island, and the
Waiʻanae coast of Oʻahu (Norris et al., 1994; Lammers et al., 2004; Thorne et al., 2012). In
particular, one main group of spinner dolphins moves between the west Maui coastline, southeast
Lāna’i coastline, as well as in the ʻAuʻau channel to rest. The middle of the ʻAuʻau channel does
not fit the model of a shallow, sheltered resting bay with white sandy bottoms (Norris et al.,
1994). It is possible that spinner dolphins are able to utilize the Maui Nui region almost as one
large resting bay due to its uniquely shallow bathymetry between Maui, Molokaʻi, and Lānaʻi
(Price & Elliot-Fisk, 2004). By using the channel as resting habitat, spinner dolphins may also be
able to increase their distance from human disturbance that occurs along the coastline.
The habitat-use patterns of spinner dolphins in Maui Nui demonstrate that location must
be taken into consideration when developing regulations for the management of spinner
dolphins. The possibility of time-area closures proposed by the Pacific Islands Regional Office
of NOAA Fisheries makes sense in the context of resting bays along the Kona coast of Hawaiʻi
Island where spinner dolphin rest is closely associated with being inside a resting bay (Tyne et
al., 2015). However, if applied to the Maui Nui area, the entire ʻAuʻau channel would need to be
closed to human activity during the day—an unlikely prospect. The acoustic activity patterns of
spinner dolphins in Maui Nui suggest that the 50-yard approach limit would be a more viable
management option.

34
Figures and Tables
Table 1. EAR deployment specifications
EAR Season Start End Sample Rate (Hz)
Depth (m)
Latitude Longitude
Honolua Fall 10/5/2016 11/30/2016 64000 25.5 21.01693 -156.64980
Kahekili Summer 6/30/2016 8/30/2016 64000 11.2 20.93892 -156.69470
Kahekili Winter 1/15/2016 3/16/2016 50000 11.2 20.93892 -156.69470
Launiupoko Summer 6/30/2016 8/20/2016 64000 43.9 20.84208 -156.66920
Lōpā Fall 9/30/2016 11/30/2016 64000 42.2 20.80275 -156.79930
Mākua Fall 10/1/2016 11/30/2016 50000 18.0 21.53210 -158.23450
Mānele Fall 9/30/2016 11/30/2016 64000 20.9 20.73928 -156.88200
Maui-Lāna‘i Summer 6/30/2016 8/30/2016 64000 70.1 20.84877 -156.74882
Maui-Lāna‘i Winter 1/18/2015 3/18/2015 125000 70.1 20.84877 -156.74882
MM17 Summer 6/30/2016 8/30/2016 64000 12.0 20.83077 -156.64320
MM17 Winter 1/15/2016 3/16/2016 50000 12.0 20.83077 -156.64320
North Mala Summer 6/30/2016 8/30/2016 64000 30.0 20.89812 -156.69720

35
Table 2. Acoustic Activity Index values for various categories of spinner dolphin signals. The
index ranges from 0 to 3.5. Values increase with increasing acoustic activity. Beta distributions
only include values greater than zero and less than one, therefore the AAI was divided by 3.5 and
transformed—shown in the “Acoustic Activity Index Adjusted for Beta Regression” column
(Smithson & Verkuilen, 2006).
Dolphin Signals in 30 s Recording Acoustic Activity Index
(AAI)
Acoustic Activity Index Adjusted for Beta
Regression (BAAI)
No acoustic activity 0 0.00023
1-5 whistles 0.5 0.14316
Burst pulses only (<5 pulses) 0.5 0.14316
Sonar only <1/2 recording 0.5 0.14316
6-10 whistles 1 0.28610
Sonar only >1/2 recording 1 0.28610
Burst pulses only (>5 pulses) 1 0.28610
Sonar and burst pulses (<5 pulses) 1 0.28610
1-5 whistles and sonar or burst pulses 1.5 0.42903
>10 whistles 2 0.57097
Sonar and burst pulses (>5 pulses) 2 0.57097
1-5 whistles and sonar and burst pulses 2.5 0.71390
6-10 whistles and sonar or burst pulses 2.5 0.71390
6-10 whistles and sonar and burst pulses 3 0.85684
>10 whistles and sonar or burst pulses 3 0.85684
>10 whistles and sonar and burst pulses 3.5 0.99977

36
Table 3. Dredge output of best fit models based on corrected Akaike information criterion,
inclusion of predictors in the model is indicated by a (+), and model 8 was selected for further
interpretation
Model Intercept DayCat Deployment s(Lat, Lon) R2 df AICc
8 -3.998 + + + 0.1187 15 0.42 4 -4.036 + + 0.1187 15 0.42 6 -4.203 + + 0.1160 12 0.16

37
Table 4. Deviance explained by the GAM and each individual predictor
Predictor Whole Model Total Deviance Explained
Deviance Explained without the predictor
Deviance Explained by the Predictor
Deployment 0.1665 0.1258 0.0407 DayCat 0.1665 0.1564 0.0101

38
Table 5. Starting and ending times and locations for vessel surveys with dolphin sightings
Sighting Date Start Time (h) End Time (h) Starting Location Ending Location
8/2/2016 0908 0923 North Mala North Mala
8/5/2016 1218 1649 North Mala Lōpā
8/10/2016 1132 1403 Kahekili Maui-Lānaʻi
8/11/2016 1053 1323 Kahekili Maui-Lānaʻi
6/20/2017 1138 1541 Launiupoko Lōpā
6/21/2017 1217 1436 Maui-Lānaʻi Lōpā

39
a)
b)

40
c)
Figure 1. Location of 2015 and 2016 EAR deployments generally as shown by the yellow boxes
(a), and more specifically in Maui Nui (b), and O‘ahu (c). Map (a) ranges from -158.3962° to
-155.8748° longitude and from 20.32903° to 21.78646° latitude. Map (b) ranges from
-157.0149° to -156.4952° longitude and from 20.72011° to 21.02992° latitude. Map (c) ranges
from -158.4103° to -157.5266° longitude and from 21.22212° to 21.71685° latitude.

41
Figure 2. Average hourly AAI (± SEM) in each deployment. Deployments are denoted by
location and season in which they took place.
0
0.05
0.1
0.15
0.2
0.25A
ve
rage
Ho
urly A
co
ustic A
ctivity I
nd
ex

42
Figure 3. Average hourly AAI by hour of day for each deployment. Deployments are denoted by
location and season in which they took place. In “Hour of Day,” hour 0 begins at midnight, and
hour 23 begins at 2300 h.
0
0.1
0.2
0.3
0.4
0.5
0.6
0.7
0 1 2 3 4 5 6 7 8 9 10 11 12 13 14 15 16 17 18 19 20 21 22 23
Ave
rage
Ho
urly A
co
ustic A
ctivity I
nd
ex
Hour
Honolua Bay Fall
Kahekili Summer
Kahekili Winter
Launiupoko Summer
Lopa Fall
Makua Fall
Manele Bay Fall
Maui-Lanai Summer
Maui-Lanai Winter
MM17 Summer
MM17 Winter
North Mala Summer

43
Figure 4. Average hourly AAI (±SEM) by time of day category and deployment. Deployments
are denoted by location and season in which they took place. The “Sunrise-Noon” category
includes hours between local sunrise and 1200 h, “Noon-Sunset” includes hours between 1200 h
and local sunset, and “Night” includes hours between local sunset and local sunrise.
0.000
0.100
0.200
0.300
0.400
0.500
0.600
Ave
rage
Ho
urly A
co
ustic A
ctivity I
nd
ex
Sunrise-Noon
Noon-Sunset
Night

44
Figure 5. Average hourly AAI by hour of day for the winter deployment in Kahekili (15 January
2016 to 16 March 2016) and the summer deployment in Kahekili (30 June 2016 to 30 August
2016)
0
0.005
0.01
0.015
0.02
0.025
0 2 4 6 8 10 12 14 16 18 20 22
Ave
rage
H
ou
rly A
co
ustic A
ctivity I
nd
ex
Hour
Kahekili Winter
Kahekili Summer

45
Figure 6. Average hourly AAI by hour of day for the winter deployment in MM17 (15 January
2016 to 16 March 2016) and the summer deployment in MM17 (30 June 2016 to 30 August
2016)
0
0.005
0.01
0.015
0.02
0.025
0.03
0.035
0.04
0 2 4 6 8 10 12 14 16 18 20 22
Ave
rage
Ho
urly A
co
ustic A
ctivity I
nd
ex
Hour
MM17 Winter
MM17 Summer

46
Figure 7. Average hourly AAI by hour of day for the winter deployment in Maui-Lāna‘i (18
January 2015 to 18 March 2015) and the summer deployment in Maui-Lāna‘i (30 June 2016 to
30 August 2016)
0
0.02
0.04
0.06
0.08
0.1
0.12
0 2 4 6 8 10 12 14 16 18 20 22
Ave
rage
Ho
urly A
co
ustic A
ctivity I
nd
ex
Hour
Maui-Lanai Winter
Maui-Lanai Summer

47
Figure 8. Fitted values of average acoustic activity index (BAAI, transformed for the beta
regression) predicted from the GAM plotted against time of day categories

48
Figure 9. Fitted values of average acoustic activity index (BAAI, transformed for the beta
regression) predicted from the GAM plotted against deployments. Each deployment is indicated
by its name-based location and the season in which it took place.

49
Figure 10. GAM smoother included in the model to account for spatial autocorrelation based on
the interaction of Longitude and Latitude. The height of the light blue surface indicates BAAI for
those coordinates.

50
Figure 11. Percentage of hours from 5 October 2016 to 30 November 2016 with dolphin
acoustic detections in both Honolua Bay and Mānele Bay simultaneously, only Honolua Bay,
only Mānele Bay, or neither bay
6%
24%
23%
47%Simultaneous
Honolua Bay Only
Manele Bay Only
Neither

51
Figure 12. Number of files in which spinner dolphin detections occurred in Honolua Bay Only,
Mānele Bay only, or both bays simultaneously by hour of day (where 0 represents midnight, and
23 represents 2300 h)
0
2
4
6
8
10
12
14
16
18
20
0 1 2 3 4 5 6 7 8 9 10 11 12 13 14 15 16 17 18 19 20 21 22 23
Nu
mb
er
of
Ho
urs
wit
h D
olp
hin
Dete
cti
on
s
Hour of Day
Honolua Bay Only
Manele Bay Only
Simultaneous

52
Figure 13. Spinner dolphin sightings from vessel surveys on the 2nd, 5th, 10th, and 11th of August
2016, and the 20th and 21st of June 2017. The beginnings and endings of sightings are labeled
with the time at which they occurred. EAR locations are marked by orange labels. The
longitudinal bounds of this map are -157.0098° to -156.4900°, and the latitudinal bounds are
20.7219° to 21.03114°.

53
Appendix A
Root Mean Square Sound Pressure Level
Figure A1. Mākua fall deployment root mean square sound pressure level in 1-octave frequency
bands by date from 01 October 2016 to 30 November 2016 (a) and by hour of day from 0000 to
2300 h (b)
90
95
100
105
110
115
1201-O
ct
8-O
ct
15
-Oct
22
-Oct
29
-Oct
5-N
ov
12
-Nov
19
-Nov
26
-Nov
Mean
SP
L (
dB
RM
S r
e 1
µP
a)
a)
Fullband
0-1.56kHz
1.56-3.13kHz
3.13-6.25kHz
6.25-12.5kHz
12.5-25kHz
90
95
100
105
110
115
120
0 1 2 3 4 5 6 7 8 9 10 11 12 13 14 15 16 17 18 19 20 21 22 23
Mean
SP
L (
dB
RM
S r
e 1
µP
a)
Hour
b)
Fullband
0-1.56kHz
1.56-3.13kHz
3.13-6.25kHz
6.25-12.5kHz
12.5-25kHz

54
Figure A2. Honolua fall deployment root mean square sound pressure level in 1-octave
frequency bands by date from 05 October 2016 to 30 November 2016 (a) and by hour of day
from 0000 to 2300 h (b)
90
95
100
105
110
115
120
5-O
ct
12
-Oct
19
-Oct
26
-Oct
2-N
ov
9-N
ov
16
-Nov
23
-Nov
30
-Nov
Mean
SP
L (
dB
RM
S r
e 1
µP
a)
a)
Fullband
0-2kHz
2-4kHz
4-8kHz
8-16kHz
16-32kHz
90
95
100
105
110
115
120
0 1 2 3 4 5 6 7 8 9 10 11 12 13 14 15 16 17 18 19 20 21 22 23
Mean
SP
L (
dB
RM
S r
e 1
µP
a)
Hour
b)
Fullband
0-2kHz
2-4kHz
4-8kHz
8-16kHz
16-32kHz

55
Figure A3. Kahekili summer deployment root mean square sound pressure level in 1-octave
frequency bands by date from 30 June 2016 to 30 August 2016 (a) and by hour of day from 0000
to 2300 h (b)
90
95
100
105
110
115
120
30
-Jun
7-J
ul
14
-Jul
21
-Jul
28
-Jul
4-A
ug
11
-Aug
18
-Aug
25
-Aug
Mean
SP
L (
dB
RM
S r
e 1
µP
a)
a)
Fullband
0-2kHz
2-4kHz
4-8kHz
8-16kHz
16-32kHz
90
95
100
105
110
115
120
0 1 2 3 4 5 6 7 8 9 10 11 12 13 14 15 16 17 18 19 20 21 22 23
Mean
SP
L (
dB
RM
S r
e 1
µP
a)
Hour
b)
Fullband
0-2kHz
2-4kHz
4-8kHz
8-16kHz
16-32kHz

56
Figure A4. Kahekili winter deployment root mean square sound pressure level in 1-octave
frequency bands by date from 15 January 2016 to 16 March 2016 (a) and by hour of day from
0000 to 2300 (b)
90
95
100
105
110
115
120
0 1 2 3 4 5 6 7 8 9 10 11 12 13 14 15 16 17 18 19 20 21 22 23
Mean
SP
L (
dB
RM
S r
e 1
µP
a)
Hour
b)
Fullband
0-1.56kHz
1.56-3.13kHz
3.13-6.25kHz
6.25-12.5kHz
12.5-25kHz
90
95
100
105
110
115
120
15
-Jan
22
-Jan
29
-Jan
5-F
eb
12
-Fe
b
19
-Fe
b
26
-Fe
b
4-M
ar
11
-Mar
Mean
SP
L (
dB
RM
S r
e 1
µP
a)
a)
Fullband
0-1.56kHz
1.56-3.13kHz
3.13-6.25kHz
6.25-12.5kHz
12.5-25kHz

57
Figure A5. Launiupoko summer deployment root mean square sound pressure level in 1-octave
frequency bands by date from 30 June 2016 to 20 Aug 2016 (a) and by hour of day from 0000 to
2300 h (b)
90
95
100
105
110
115
120
30
-Jun
7-J
ul
14
-Jul
21
-Jul
28
-Jul
4-A
ug
11
-Aug
18
-Aug
Mean
SP
L (
dB
RM
S r
e 1
µP
a)
a)
Fullband
0-2kHz
2-4kHz
4-8kHz
8-16kHz
16-32kHz
90
95
100
105
110
115
120
0 2 4 6 8 10 12 14 16 18 20 22
Mean
SP
L (
dB
RM
S r
e 1
µP
a)
Hour
b)
Fullband
0-2kHz
2-4kHz
4-8kHz
8-16kHz
16-32kHz

58
Figure A6. Lōpā fall deployment root mean square sound pressure level in 1-octave frequency
bands by date from 30 September 2016 to 30 November 2016 (a) and by hour of day from 0000
to 2300 h (b)
90
95
100
105
110
115
120
30
-Sep
7-O
ct
14
-Oct
21
-Oct
28
-Oct
4-N
ov
11
-Nov
18
-Nov
25
-Nov
Mean
SP
L (
dB
RM
S r
e 1
µP
a)
a)
Fullband
0-2kHz
2-4kHz
4-8kHz
8-16kHz
16-32kHz
90
95
100
105
110
115
120
0 1 2 3 4 5 6 7 8 9 10 11 12 13 14 15 16 17 18 19 20 21 22 23
Mean
SP
L (
dB
RM
S r
e 1
µP
a)
Hour
b)
Fullband
0-2kHz
2-4kHz
4-8kHz
8-16kHz
16-32kHz

59
Figure A7. Mānele fall deployment root mean square sound pressure level in 1-octave frequency
bands by date from 30 September 2016 to 30 November 2016 (a) and by hour of day from 0000
to 2300 h (b)
90
95
100
105
110
115
120
30
-Sep
7-O
ct
14
-Oct
21
-Oct
28
-Oct
4-N
ov
11
-Nov
18
-Nov
25
-Nov
Mean
SP
L (
dB
RM
S r
e 1
µP
a)
a)
Fullband
0-2kHz
2-4kHz
4-8kHz
8-16kHz
16-32kHz
90
95
100
105
110
115
120
0 1 2 3 4 5 6 7 8 9 10 11 12 13 14 15 16 17 18 19 20 21 22 23
Mean
SP
L (
dB
RM
S r
e 1
µP
a)
Hour
b)
Fullband
0-2kHz
2-4kHz
4-8kHz
8-16kHz
16-32kHz

60
Figure A8. Maui-Lāna‘i summer deployment root mean square sound pressure level in 1-octave
frequency bands by date from 30 June 2016 to 30 August 2016 (a) and by hour of day from 0000
to 2300 h (b)
90
95
100
105
110
115
12030
-Jun
7-J
ul
14
-Jul
21
-Jul
28
-Jul
4-A
ug
11
-Aug
18
-Aug
25
-Aug
Mean
SP
L (
dB
RM
S r
e 1
µP
a)
a)
Fullband
0-2kHz
2-4kHz
4-8kHz
8-16kHz
16-32kHz
90
95
100
105
110
115
120
0 1 2 3 4 5 6 7 8 9 10 11 12 13 14 15 16 17 18 19 20 21 22 23
Mean
SP
L (
dB
RM
S r
e 1
µP
a)
Hour
b)
Fullband
0-2kHz
2-4kHz
4-8kHz
8-16kHz
16-32kHz

61
Figure A9. Maui-Lāna‘i winter deployment root mean square sound pressure level in 1-octave
frequency bands by date from 18 January 2015 to 18 March 2015 (a) and by hour of day from
0000 to 2300 h (b)
90
95
100
105
110
115
120
18
-Jan
25
-Jan
1-F
eb
8-F
eb
15
-Fe
b
22
-Fe
b
1-M
ar
8-M
ar
15
-Mar
Mean
SP
L (
dB
RM
S r
e 1
µP
a)
a)
Fullband
0-3.91 kHz
3.91-7.81 kHz
7.81-15.6 kHz
15.6-31.3 kHz
31.3-62.5 kHz
90
95
100
105
110
115
120
0 1 2 3 4 5 6 7 8 9 10 11 12 13 14 15 16 17 18 19 20 21 22 23
Mean
SP
L (
dB
RM
S r
e 1
µP
a)
Hour
b)
Fullband
0-3.91 kHz
3.91-7.81 kHz
7.81-15.6 kHz
15.6-31.3 kHz
31.3-62.5 kHz

62
Figure A10. MM17 summer deployment root mean square sound pressure level in 1-octave
frequency bands by date from 30 January 2016 to 30 August 2016 (a) and by hour of day from
0000 to 2300 h (b)
90
95
100
105
110
115
120
30
-Jun
7-J
ul
14
-Jul
21
-Jul
28
-Jul
4-A
ug
11
-Aug
18
-Aug
25
-Aug
Mean
SP
L (
dB
RM
S r
e 1
µP
a)
a)
Fullband
0-2kHz
2-4kHz
4-8kHz
8-16kHz
16-32kHz
90
95
100
105
110
115
120
0 1 2 3 4 5 6 7 8 9 10 11 12 13 14 15 16 17 18 19 20 21 22 23
Mean
SP
L (
dB
RM
S r
e 1
µP
a)
Hour
b)
Fullband
0-2kHz
2-4kHz
4-8kHz
8-16kHz
16-32kHz

63
Figure A11. MM17 winter deployment root mean square sound pressure level in 1-octave
frequency bands by date from 15 January 2016 to 16 March 2016 (a) and by hour of day from
0000 to 2300 h (b)
90
95
100
105
110
115
120
15
-Jan
22
-Jan
29
-Jan
5-F
eb
12
-Fe
b
19
-Fe
b
26
-Fe
b
4-M
ar
11
-Mar
Mean
SP
L (
dB
RM
S r
e 1
µP
a)
a)
Fullband
0-1.56kHz
1.56-3.13kHz
3.13-6.25kHz
6.25-12.5kHz
12.5-25kHz
90
95
100
105
110
115
120
0 1 2 3 4 5 6 7 8 9 10 11 12 13 14 15 16 17 18 19 20 21 22 23
Mean
SP
L (
dB
RM
S r
e 1
µP
a)
Hour
b)
Fullband
0-1.56kHz
1.56-3.13kHz
3.13-6.25kHz
6.25-12.5kHz
12.5-25kHz

64
Figure A12. North Mala summer deployment root mean square sound pressure level in 1-octave
frequency bands by date from 30 June 2016 to 30 August 2016 (a) and by hour of day from 0000
to 2300 h (b)
90
95
100
105
110
115
120
30
-Jun
7-J
ul
14
-Jul
21
-Jul
28
-Jul
4-A
ug
11
-Aug
18
-Aug
25
-Aug
Mean
SP
L (
dB
RM
S r
e 1
µP
a)
a)
Fullband
0-2kHz
2-4kHz
4-8kHz
8-16kHz
16-32kHz
90
95
100
105
110
115
120
0 1 2 3 4 5 6 7 8 9 10 11 12 13 14 15 16 17 18 19 20 21 22 23
Mean
SP
L (
dB
RM
S r
e 1
µP
a)
Hour
b)
Fullband
0-2kHz
2-4kHz
4-8kHz
8-16kHz
16-32kHz

65
Appendix B
Pinger Test
Methods
In August of 2016 tests were conducted for the Maui-Lānaʻi channel, Kahekili, North Mala,
MM17 and Launiupoko EARs to estimate their detection radii. For each location the vessel was
positioned at approximately 2 km, 1.5 km, 1 km, 0.5 km, and 100 m away from the deployed
EARs. An RJE International ARS 100 Pinger was placed in the water over the side of the vessel
and programmed to play a continuous series of 0.10-second 4-7 kHz chirps at 145.5 dB re 1 μPa
every 5 seconds for a total of 5-10 min. The fundamental frequency range of spinner dolphin
whistles is 2-22 kHz with a mid-frequency average of 12.9 kHz and an average source level of
153.9±4.47 dB (Bazúa-Durán & Au, 2002; Lammers et al., 2003). Therefore the pinger signal
has a lower frequency and source level than spinner dolphin whistles.
Once the EAR data were recovered, spectrograms of the recordings were scanned for the
pinger signal. The vessel GPS track and the known GPS locations of the EARs were used to
calculate the distance between the pinger and the EAR at the time of each recording.
Results
The detection ranges for the Maui-Lānaʻi, Kahekili, North Mala, Launiupoko, and MM17 EARs
were determined by the maximum distance at which the pinger signal was detected on the EAR
recordings. The Maui- Lānaʻi EAR had the greatest detection radius of 2,173.4 m, while the
Kahekili EAR had the smallest radius of 534.0 m. The MM17, Launiupoko, and North Mala
EARs had radii of 1963.8 m, 1375.5 m, and 1221.2 m respectively (Figure B1).

66
Discussion
The vast difference in detection range between the Kahekili EAR and the other locations can be
explained by the difference in ambient noise. Vessel noise masked most of the pinger signals on
the North Mala EAR, except in a small window of low ambient noise. This higher level of
background noise is apparent when the root mean square sound pressure levels (RMS SPLs) for
each EAR are compared. The North Mala 4-8 kHz octave band had a RMS SPL between
approximately 102 and 109 dB, and the 4-8 kHz octave band of the Kahekili summer
deployment ranged between 107 and 108 dB (Figure A12-a; A3-a). The same octave band had
lower averages which ranged from 95 to 99 dB in the Maui-Lāna‘i summer deployment, 98-102
dB in the Launiupoko deployment, and 100-101 dB in the MM17 deployment (Figure A8-a; A5-
a; A10-a). It is important to take the ambient noise into consideration when interpreting the
results of dolphin acoustic activity, as there are likely to be some masking effects.
Additionally, because the pinger signal had a lower frequency range than spinner dolphin
whistles, as well as a lower source level it is likely slightly overestimating the EAR detection
radii as the low frequencies of the pinger signal can travel farther than the upper frequencies of a
whistle.

67
Kahekili
North Mala
Maui-Lānaʻi
Launiupoko
MM17
2173.4 m
1963.8 m
534 m
1221.2 m
1375.5 m
Figure B1. Detection ranges of the Maui- Lānaʻi, Kahekili, North Mala, Launiupoko, and
MM17 EARs from the August 2016 pinger tests using a 4-7 kHz signal represented by
circles. The points in the center of each circle indicate the location of the EAR, while the red
line indicates the radius of the circle which is the maximum distance from the EAR at which
the pinger could be detected. Map is centered on -156.6927°, 20.88052°

68
Literature Cited
Andrews, K. R., Karczmarski, L., Au, W. W. L., Rickards, S. H., Vanderlip, C. A., & Toonen, R.
J. (2006). Patterns of genetic diversity of the Hawaiian spinner dolphin (Stenella
longirostris). Atoll Research Bulletin, 543, 65-73.
Andrews, K. R., Karczmarski, L., Au, W. W. L., Rickards, S. H., Vanderlip, C. A., Bowen, B.
W., … Toonen, R. J. (2010). Rolling stones and stable homes: Social structure, habitat
diversity and population genetics of the Hawaiian spinner dolphin (Stenella longirostris).
Molecular Ecology, 19(4), 732-748. https://doi.org/10.1111/j.1365-294X.2010.04521.x
Au, W. W. L., Mobley, J., Burgess, W. C., Lammers, M. O., & Nachtigall, P. E. (2000).
Seasonal and Diurnal Trends of Chorusing Humpback Whales Wintering in Waters Off
Western Maui. Marine Mammal Science, 16(3), 530-544. https://doi.org/10.1111/j.1748-
7692.2000.tb00949.x
Baird, R. (2016). The lives of Hawaiʻi's dolphins and whales: Natural history and conservation
(1st ed.) Honolulu, HI: University of Hawai‘i Press.
Barton, K. (2016). MuMIn: Multi-Model Inference. R package version 1.15.6.
https://CRAN.R-project.org/package=MuMIn
Bazúa-Durán, C., & Au, W. W. L. (2002). The whistles of Hawaiian spinner dolphins. The
Journal of the Acoustical Society of America, 112(6), 3064-3072.
https://doi.org/10.1121/1.1508785
Bazúa-Durán, C., & Au, W. W. L. (2004). Geographic variations in the whistles of spinner
dolphins (Stenella longirostris) of the Main Hawaiian Islands. The Journal of the
Acoustical Society of America, 116(6), 3757-3769. https://doi.org/10.1121/1.1785672
Bejder, L., Samuels, A., Whitehead, H., Gales, N., Mann, J., Connor, R.,…Krützen, M. (2006).
Decline in relative abundance of bottlenose dolphins exposed to long-term disturbance.
Conservation Biology, 20(6), 1791-1798. https://doi.org/10.1111/j.1523-
1739.2006.00540.x
Benoit-Bird, K. J., Au, W. W. L., Brainard, R. E., & Lammers, M. O. (2001). Diel horizontal
migration of the Hawaiian mesopelagic boundary community observed acoustically.
Marine Ecology Progress Series, 217(1991), 1-14. https://doi.org/10.3354/meps217001
Benoit-Bird, K. J., & Au, W. W. L. (2003). Prey dynamics affect foraging by a pelagic predator
(Stella longirostris) over a range of spatial and temporal scales. Behavioral Ecology and
Sociobiology, 53, 364-373. https://doi.org/10.1007/s00265-003-0585-4

69
Courbis, S., & Timmel, G. (2009). Effects of vessels and swimmers on behavior of Hawaiian
spinner dolphins (Stenella longirostris) in Kealakeʽakua, Honaunau, and Kauhako bays,
Hawaiʽi. Marine Mammal Science, 25(2), 430-440. https://doi.org/10.1111/j.1748-
7692.2008.00254.x
Danil, K., Maldini, D., & Marten, K. (2005). Patterns of Use of Mäkua Beach, O‘ahu, Hawai‘i,
by Spinner Dolphins (Stenella longirostris) and Potential Effects of Swimmers on Their
Behavior. Aquatic Mammals, 31(4), 403-412. https://doi.org/10.1578/AM.31.4.2005.403
Fox, J., & Weisberg, S. (2011). An {R} Companion to Applied Regression (2nd ed.)
Thousand Oaks, CA: Sage. http://socserv.socsci.mcmaster.ca/jfox/Books/Companion
Hastie, T., Tibshirani, R. (1990). Generalized additive models. London and New York: Chapman
and Hall.
Heenehan, H. L., Johnston, D. W., Van Parijs, S. M., Bejder, L., & Tyne, J. A. (2016a). Acoustic
response of Hawaiian spinner dolphins to human disturbance. Proceedings of Meetings
on Acoustics, 27, 10001. https://doi.org/10.1121/2.0000232
Heenehan, H. L., Van Parijs, S. M., Bejder, L., Tyne, J. A., & Johnston, D. W. (2016b).
Differential effects of human activity on Hawaiian spinner dolphins in their resting bays.
Global Ecology and Conservation, 10, 60-69.
https://doi.org/10.1016/j.gecco.2017.02.003
Hill, M.C., Bradford, A. L., Andrews, K. R., Baird, R. W., Deakos, M. H., Johnston, S. D.,
Mahaffy, D. W., Milette, A. J., Oleson, E. M., Östman-Lind, J., Pack, A. A., Rickards, S.
H., & Yin, S. S. (2011). Abundance and movements of spinner dolphins off the main
Hawaiian Islands. Pacific Islands Fisheries Science Center Working Paper WP-11-013.
Howe, M. (2016). Investigating odontocete occurrence around Oʻahu and Maui-Nui using a
multimethod approach (Unpublished master’s thesis). University of Hawai‘i at Mānoa
Ihaka, R., Murrell, P., Hornik, K., Fisher, J. C., Zeileis, A. (2016). colorspace: Color Space
Manipulation. R package version 1.3-2. https://CRAN.R-project.org/package=colorspace
Kaplan, M. B., Lammers, M. O., Zang, E., & Mooney, T. A. (2018). Acoustic and biological
trends on coral reefs off Maui, Hawai‘i. Coral Reefs, 37(1), 121-133.
https://doi.org/10.1007/s00338-017-1638-x
Klinowska, M. (1991). Dolphins, porpoises and whales of the world: the IUCN red data book.
Gland, Switzerland: IUCN.
Lammers, M. O. (2004). Occurrence and Behavior of Hawaiian Spinner Dolphins (Stenella
longirostris) Along O‘ahu’s Leeward and South Shores. Aquatic Mammals, 30(2), 237-
250. https://doi.org/10.1578/AM.30.2.2004.237

70
Lammers, M. O., Schotten, M., & Au, W. W. L. (2006). The spatial context of free-ranging
Hawaiian spinner dolphins (Stenella longirostris) producing acoustic signals. The Journal
of the Acoustical Society of America, 119(2), 1244. https://doi.org/10.1121/1.2151804
Lammers, M. O., Brainard, R. E., Au, W. W. L., Mooney, T. A., & Wong, K. B. (2008a). An
ecological acoustic recorder (EAR) for long-term monitoring of biological and
anthropogenic sounds on coral reefs and other marine habitats. Journal of the Acoustical
Society of America, 123(3), 1720-1728. https://doi.org/10.1121/1.2836780
Lammers, M. O., Bernasconi, S., Au, W. W. L., Wong, K., & Brainard, R. (2008b). Patterns of
coastal use by Hawaiian spinner dolphins (Stenella longirostris) observed using passive
acoustic monitoring. Journal of the Acoustical Society of America, 124(4), 2483.
https://doi-org /10.1121/1.4782748
Lammers, M. O., Munger, L. M. (2016). From Shrimp to Whales: Biological Applications of
Passive Acoustic Monitoring on a Remote Pacific Coral Reef. In W. W. L. Au & M. O.
Lammers (Eds.), Listening in the Ocean: New Discoveries and Insights on Marine Life
from Autonomous Passive Acoustic Recorders (1st ed., pp. 61-81). New York, NY:
Springer Science+Business Media.
NOAA. (2012). SPINNER DOLPHIN (Stenella longirostris longirostris): Hawaiian Islands
Stock Complex- Hawai‘i Island, O‘ahu/4-islands, Kauaʻi/Niʻihau, Pearl & Hermes
Reef, Midway Atoll/Kure, Hawai‘i Pelagic. 240-247.
NOAA. (2016). Protective Regulations for Hawaiian Spinner Dolphins Under the Marine
Mammal Protection Act. Federal Register, 81(164), 57854-57876.
Norris, K. S., Wursig, B., Wells, R. S., Wursig, M., Brownlee, S. M., Johnson, C., & Solow, J.
(1994). The Hawaiian Spinner Dolphin. Berkeley, CA: University of California Press,
Berkeley.
Price, J. P., & Elliott-Fisk, D. (2004). Topographic history of the Maui Nui complex, Hawai’i,
and its implications for biogeography. Pacific Sci., 58, 27-45. doi:10.1353/psc.2004.0008
R Core Team (2015). R: A language and environment for statistical computing. R Foundation for
Statistical Computing. Vienna, Austria. https://www.R-project.org/.
Smithson, M., & Verkuilen, J. (2006). A better lemon squeezer? Maximum-likelihood regression
with beta-distributed dependent variables. Psychological Methods, 11(1), 54-71.
http://dx.doi.org/10.1037/1082-989X.11.1.54
Sefick Jr., S. (2016). Stream Metabolism-A package for calculating single station metabolism
from diurnal Oxygen curves. R package version 1.1.2.

71
Thorne, L. H., Johnston, D. W., Urban, D. L., Tyne, J., Bejder, L., Baird, R. W., …Chapla Hill,
M. (2012). Predictive modeling of spinner dolphin (Stenella longirostris) resting habitat
in the main Hawaiian Islands. PLoS ONE, 7(8).
https://doi.org/10.1371/journal.pone.0043167
Tyne, J. A., Pollock, K. H., Johnston, D. W., & Bejder, L. (2014). Abundance and survival rates
of the Hawai’i Island associated spinner dolphin (Stenella longirostris) stock. PLoS ONE,
9(1). https://doi.org/10.1371/journal.pone.0086132
Tyne, J. A., Johnston, D. W., Rankin, R., Loneragan, N. R., & Bejder, L. (2015). The importance
of spinner dolphin (Stenella longirostris) resting habitat: Implications for management.
Journal of Applied Ecology, 52(3), 621-630. https://doi.org/10.1111/1365-2664.12434
Tyne, J. A., Johnston, D. W., Christiansen, F., & Bejder, L. (2017). Temporally and spatially
partitioned behaviours of spinner dolphins: implications for resilience to human
disturbance. Royal Society Open Science, 4(1), 160626.
https://doi.org/10.1098/rsos.160626
Wickham, H. (2009). ggplot2: Elegant Graphics for Data Analysis. New York, NY: Springer-
Verlag.
Wickham, H., Henry, L. (2018). tidyr: Easily Tidy Data with 'spread()' and 'gather()' Functions.
R package 0.8.0. https://CRAN.R-project.org/package=tidyr
Wickham, H., Francois, R. (2015). dplyr: A Grammar of Data Manipulation. R package version
0.4.3. https://CRAN.R-project.org/package=dplyr
Wood, S.N. (2011). Fast stable restricted maximum likelihood and marginal likelihood
estimation of semiparametric generalized linear models. Journal of the Royal Statistical
Society (B), 73(1):3-36
Zeileis, A., & Hothron, T. (2002). Diagnostic Checking in Regression Relationships. R News,
2(3):7-10. https://CRAN.R-project.org/doc/Rnews/