investigating coagulation of cellulose...
TRANSCRIPT
Department of Skogsindustriell kemiteknik CHALMERS UNIVERSITY OF TECHNOLOGY, SWEREA IVF Gothenburg, Sweden 2016
Investigating coagulation of cellulose solutions
Master’s thesis in Materials Chemistry
David Sandström
Supervisor: Artur Hedlund
Examiner: Hans Theliander

2
Summary: As the need to replace cotton as a resource in textile production increases alternative materials with the same
properties as cotton becomes very interesting. One of the most interesting raw materials is the most abundant
biomaterial on earth, cellulose from lignocellulosic material. The most sustainable process for producing fabrics
out of cellulose from wood fibres is the lyocell process in which the cellulose is dissolved in N-methylmorpholine
N-oxide (NMMO) and regenerated as filaments. The regeneration is done by rearranging the cellulose molecules
in its dissolved state and then coagulating it using a non-solvent. The lyocell solvent NMMO has worked well
but have some problems as it is thermally unstable. A family of relatively new solvents are ionic liquids, molten
salts with very low vapor pressures. Ionic liquids have shown different abilities as cellulose solvents but some
have also shown great potential. In this project the coagulation of three different ionic liquids was researched,
the previously studied 1-ethyl-3-methyl imidazolium acetate (EmimAc) and 1-butyl-3-methyl imidazolium chlo-
ride (BmimCl), and the less studied tetra-methyl guanidine acetate (TMGHOAc), the later has the unique prop-
erty of being a distillable ionic liquid. Two different non-solvents were analyzed; water and isopropanol. Three
different analyzing methods was used; the coagulation value method in which the required weight fraction of
non-solvent that has to be added before the dissolved cellulose starts to coagulate is measured, the mass-transport
rate method in which the rate of the total diffusion of non-solvent into and of solvent out of a cellulose solution
as it is submerged in non-solvent, and a visual coagulation front propagation measurement in which the thickness
of the coagulated layer is measured as it is submerged in non-solvent.
The dissolution of cellulose in the tetra-methyl guanidine acetate proved to be more complex than the other ionic
liquids. It was shown that the TMGHOAcs dissolution ability is highly dependent on the pH of the solution and
that a pH below the equivalence point of the tetra-methyl guanidine and acetate ions makes dissolution impossi-
ble. Another problem was caused by the fact that the ionic liquid phase changed from a liquid into a solid structure
even after cellulose had seemingly been dissolved in it. This could be hindered by using increased amounts of
DMSO which prevented the phase transition of the solution. The difficulty to avoid the liquid to solid phase
transition that seem to occur regularly might be the reason why poor properties of fibers spun from TMGHOAc
solutions have been observed. It was also found that the latter stage of the diffusion in TMGHOAc is substantially
slower than for EmimAc and BmimCl. This resulted in very thick coagulated layers with large swelling even
after long submersion times.
The coagulation mechanism was investigated for all three ionic liquids and it was found that the mechanism
varied heavily between the solvents. The BmimCl solutions showed almost no change in turbidity as it coagulated
while the EmimAc and TMGHOAc showed a sharp increase in turbidity. The diffusion rate experiments showed
that the diffusion process is very different for water and isopropanol for EmimAc and BmimCl which is possibly
caused by the isopropanol interacting much more with the ionic liquid than the water. The same could not be
seen in the TMGHOAc where the isopropanol and water diffusion curves looked very similar. The coagulation
depth method showed that the growth of the coagulation layer is the fastest in BmimCl while the EmimAc and
TMGHOAC have similar growth rates.

3
Acknowledgements:
I would like to thank my supervisor Artur Hedlund for all the helpful suggestions and assistance during the pro-
ject and for being so dedicated. I would also like to thank my examiner Hans Theliander for his investment and
interest.

4
Contents Summary: .......................................................................................................................................................... 2
Acknowledgements: .......................................................................................................................................... 3
Contents ............................................................................................................................................................. 4
1 Introduction: ................................................................................................................................................... 6
2 Theory: ........................................................................................................................................................... 7
2.1 The cellulose polymer: ............................................................................................................................ 7
2.3 Dissolution and coagulation of cellulose ................................................................................................ 8
2.4 Ionic liquids as solvents: ....................................................................................................................... 10
3 Purpose ......................................................................................................................................................... 12
3.1 Scope ..................................................................................................................................................... 12
4 Method: ........................................................................................................................................................ 13
4.1 Preparation of cellulose solutions ......................................................................................................... 13
4.2 Preparation of TMGHOAc ionic liquid ................................................................................................ 13
4.3 Coagulation value measurements .......................................................................................................... 14
4.2 Mass-transport rate measurements ........................................................................................................ 14
4.3 Coagulation depth measurements ......................................................................................................... 15
4.4 Solution preparation .............................................................................................................................. 15
4.5 Preparation of EmimAc cellulose solution: .......................................................................................... 15
4.6 Preparation of BmimCl cellulose solution: ........................................................................................... 16
4.7 Synthesis of TMGHOAc ionic liquid ................................................................................................... 16
4.8 Investigation of the TMGHOAC ionic liquid ....................................................................................... 16
4.9 Large scale cellulose dissolution in TMGHOAc .................................................................................. 19
5 Results: ......................................................................................................................................................... 22
5.1 Coagulation value results: ..................................................................................................................... 22
5.2 Mass-transport rate results .................................................................................................................... 23
5.3 Coagulation depth results ...................................................................................................................... 25
6 Discussion: ................................................................................................................................................... 27
7 Conclusion: .................................................................................................................................................. 29
8 Future work: ................................................................................................................................................. 30

5
References: ...................................................................................................................................................... 31
Appendix A: Results and measurements ......................................................................................................... 33
Appendix B: Extended experimental section .................................................................................................. 48
6
1 Introduction:
The production of cotton textiles is as of today a very unsustainable process. Cotton requires huge amounts of
water to grow and process. Additionally the cotton industry is today responsible for 16% of the world’s total
pesticide use [1]. As the population grows and the number of people with the monetary requirements to afford
mass produced clothes and textiles increases, a new alternative to cotton becomes more and more relevant. Cel-
lulose, the polymer building material of all plants, exists all over the globe and has some very good properties
for textile production. To be able to harness the potential of cellulose it first has to be isolated from the wood
material and reshaped into fibers. Unlike plastic polymers cellulose cannot be melted and reshaped as it decom-
poses at elevated temperatures. The process of manufacturing fabric out of cellulose instead requires the cellulose
to be dissolved and regenerated by coagulation. This process is called wet spinning and it frees the cellulose
molecules which then may be rearranged into filaments.
The two most common methods for producing cellulose fibers are the viscose process, in which the cellulose is
derivatized into cellulose xanthate and dissolved in sodium hydroxide, and the lyocell process, where the cellu-
lose is directly dissolved [2]. The solvent used in the lyocell process is NMMO (N-methylmorpholine N-oxide).
The process is much more environmentally sustainable than either cotton textile manufacturing or the viscose
method. Furthermore, NMMO is low in toxicity and biodegradable [2] however the usage of NMMO as a solvent
is not without any drawbacks. It has poor thermal stability which means that it can react violently exothermically
[3] [4] if it is heated excessively. It will gradually decompose [3] and it may discolor the solution and the spun
fibers by forming chromophores which will also degrade the pulp [3] and large amounts of stabilizers are re-
quired. These drawbacks have led to prominent research in alternate solvent which may circumvent the problems
associated with the usage of NMMO.
The most investigated and prominent alternative solvents to NMMO have been ionic liquids, salts with relatively
low melting points consisting of an anion with a corresponding cation. Ionic liquids are thermally stable with a
minimal release of volatile substances [5] and have good miscibility with common anti solvents such as water
and different alcohols. Most ionic liquids irreversibly decompose at temperatures above 175 C [6] and have very
low vapor pressures, around 0.1-0.05 mbar, but there are ionic liquids that have higher vapor pressures and there-
fore can be separated from decay products and residual glucose at higher temperatures using distillation. A dis-
tillable ionic liquid would be highly beneficiary as it would allow for a higher rate of recyclability and a cleaner
recycled ionic liquid. An ionic liquid that is recyclable by distillation can be produced by mixing 1,1,3,3-tetra-
methylguanidine (TMG) with acids such as formic(CO2H2), acetic(HOAc) and propionic(HCO2Et) acids. The
TMGH ionic liquids have been shown to meet the required hydrogen bond basicity to break up the intra molecular
hydrogen bonding and overcome the hydrophobic interactions caused by the celluloses structure, in order to
dissolve the cellulose [7]. The TMG ionic liquids have been shown to be able to effectively dissolve high cellu-
lose contents but the spun fibers have shown very poor properties which might be related to the coagulation step.
In this project the coagulation mechanism and dissolution properties of TMGHOAc will be investigated and
compared to 1-ethyl-3-methyl imidazolium acetate and 1-butyl-3-methyl imidazolium chloride, two widely re-
searched ionic solvents that have been used to varying degrees of success in wet-spinning.

7
2 Theory:
2.1 The cellulose polymer: Cellulose is a polysaccharide consisting of linked glucose units and is the key building block in the cell walls of
plants and is also the most abundant biomaterial on earth [1]. The glucose units are linked through 1-4 beta
glycosidic bonds with an ether bond consisting of a single oxygen group. The monomers are referred to as anhy-
drous glucose units. Each of the anhydrous glucose units have three hydroxyl groups that can hydrogen bond
and this hydrogen bonding causes the cellulose to be more ordered and crystalline which makes it a very hard
substance to dissolve. It is also believed that the amphiphilic (both polar and apolar) structure of the cellulose
structure contribute to the insolubility. The hydrophobic parts are drawn to each other and holds the cellulose
together making it harder to dissolve [8].
Figure 1: The general structure of the repeating unit of the cellulose chain consisting of linked glucose units.
The length of the cellulose chain is measured by the degree of polymerization which is defined as the number of
linked glucose units and has been shown to greatly affect the tenacity and stiffness of drawn fiber from air gap
spun cellulose [9]. The typical degree of polymerization is approximately 8000 for native wood cellulose but is
reduced by approximately 10 times in the pulping process [10]. The degree of polymerization can be decreased
by two different reactions; alkaline hydrolysis where the glucose chain is cut under basic conditions by hydroxide
ions that splits the polymer chain, and end group removal where glucose units are removed from the end of the
glucose chains by radical reactions that is propagated by elevated temperatures.
Cellulose chains are linear and unbranched but the cellulose material varies in crystalline forms. There are four
major distinct cellulose allomorphs called cellulose I, II, III and IV. Cellulose type I is the untreated cellulose
found in nature such as cotton and wood and is by far the most common of the four types. Type I cellulose has
parallel chains bonded by hydrogen bonds creating sheets which are stacked and held together by van der Waals
bonding [10]. Cellulose of type II is formed when cellulose of type I is mercerized or in the wet spinning process

8
when the cellulose is dissolved and precipitated. In Cellulose II the hydrogen bonding occurs both in the sheets
plane direction, as in cellulose I, and between the different sheets. Cellulose III can be prepared by treatment of
cellulose I or cellulose II with liquid ammonia [11]. The cellulose is inflated by the ammonia molecules and
forms crystalline complexes with the cellulose and as the ammonia is evaporated the complex bonding is replaced
by hydrogen bonding between the sheets [12]. Cellulose IV is obtained by heating cellulose III in glycerol and
the cellulose is transformed into a hydrated form of cellulose II [13].
The cellulose that is being used in this project is not normal dissolving pulp but instead micro crystalline cellu-
lose. Microcrystalline cellulose is refined cellulose that can be produced by acid hydrolysis of cellulosic fibers
which disintegrates and remove the amorphous domains between the crystalline domains [14][15].
2.3 Dissolution and coagulation of cellulose The solvent dissolve the cellulose by breaking the celluloses hydrogen bonds and disrupting the hydrophobic
interactions, instead forming new hydrogen bonds between the solvent molecules and the celluloses hydroxyl
groups [16]. This means that the strength of the solvent hydrogen bond must be stronger than the hydroxyl-
hydroxyl hydrogen bonds of the original cellulose allomorph in order for the ionic liquid to dissolve the cellulose.
A critical property for the dissolution is the Kamlet Taft parameters α, β and *π where α describes the solvents
hydrogen bond donating acidity, β describes the solvents hydrogen bond accepting basicity and *π describes the
dipolarity/polarizability ratio [17]. In a study from 2012 the Kamlet Taft parameters for the ionic liquid tetra-
methyl guanidinium propionate was researched. It was found that the hydrogen bond basicity and the net basicity,
β-α, were the critical parameters for the dissolution of cellulose and it was determined that when β<0.8 and when
β-α<0.35 the dissolution of cellulose is no longer possible in this specific solvent [18] and the cellulose start to
coagulate.
Figure 2 The inter-molecular hydrogen-bonding between the different cellulose chains and the intra-molecular hydrogen-bonding within
the cellulose chains.

9
Figure 3 In order to dissolve the cellulose a solvent (sol) that is able to break the hydrogen bonds of the cellulose is required. R denotes the
continuation of the polymer chain
Coagulation of cellulose in a cellulose solution happens when the solvent is removed from the cellulose. In order
to coagulate the cellulose the hydrogen bonds need to be reestablished. This is achieved by using a non-solvent
that can remove the solvent from the cellulose thereby reestablishing the hydrogen bonds and van der Waals
forces between the cellulose sheets. Addition of an anti-solvent will decrease the hydrogen bond basicity β and
as the basicity gets low enough the cellulose will start to precipitate and coagulation will set in. The regeneration
process can be divided into four stages: Gelation, particle formation, regenerated cellulose with water/IL ab-
sorbed and removal of residual IL via washing [18].
One of the most important parts in the mechanism for cellulose coagulation is the diffusion of non-solvent into
the cellulose solution and the diffusion of cellulose solvent out from the solution. In a study from 2006 [19] the
diffusion of NMMO, the most commonly used solvent in the lyocell process, was investigated and the diffusion
of ionic liquids are believed to occur in a similar way. It was determined that there are two different diffusion
regimes for NMMO as it diffuses from the cellulose. The first regime is fast and happens as hydrogen bonds form
between the water and the NMMO and the second regime is much slower. It has been shown that NMMO due to
its hygroscopic nature, its ability to hold water, has a diffusion coefficient that is 10 times smaller than the diffu-
sion of water into the solution [20] in the second region. It has also been shown that the diffusion rate is not
related to the molecular weight of the cellulose molecule which has lead to the assumption that the diffusion is
predicated upon the number of hydrogen bonds between the NMMO and the cellulose hydroxyl groups. Accord-
ing to one study the difference in diffusion between the non-solvent and the solvent will influence how solid the
coagulated layer becomes [21]. According to this study, if the solvent is removed at a higher rate than the non-
solvent can diffuse into the coagulated layer, the layer will become more solid and if the opposite is true the
coagulated layer will be thicker and more gel like.

10
The coagulation bath in wet spinning generally contains water which is the most common non-solvent [22] but
it can also contain other forms of non-solvents such as alcohols, which interact with the ionic liquid similar to
water. The value of coagulation is defined as the amount of non-solvent divided by the amount of solution and
gives a ratio that determines at which weight percentage of the original solvent the cellulose will start to coagu-
late. The coagulation value is a useful tool when comparing different solvents or anti-solvents.
2.4 Ionic liquids as solvents: Ionic liquids are as described earlier, molten salts consisting of corresponding anions and cations. An ionic liquid
is by definition in its liquid state at 373K [23] and usually consists of a large asymmetrical organic cation with a
smaller inorganic or organic anion [23]. The dissolving capabilities for ionic liquid is linked to the anions ability
to form strong hydrogen bonds to the celluloses hydroxyl groups.
The three ionic liquids that are investigated in this project are ethyl-methyl imidazolium acetate, butyl-methyl
imidazolium chloride and tetra-methyl guanidine. Ethyl-methyl imidazolium acetate is made up of two corre-
sponding ions, ethyl-methyl imidazolium being the cation and acetate being the anion while butyl-methyl imid-
azolium chloride consists of butyl-methyl imidazolium as the cation and chloride as the anion. These ionic liquids
are both imidazolium derivatives which together with pyridinium derivatives are the most common ionic liquids
[23]. Ethyl-methyl imidazolium acetate is liquid at room temperature which makes it easy to handle while butyl-
methyl imidazolium chloride has a melting point around 70 degrees Celsius which means that the ionic liquid
has to be either dissolved in a solvent such as water or that it must be heated before it can be used to dissolve
cellulose.
Figure 4 The ethyl-methyl imidazolium acetate ion pair on the top left, the butyl-methyl imidazolium chloride ion pair on the top right
and the tetra-methyl guanidine acetate ion pair on the bottom

11
The cellulose dissolution abilities of different ionic liquids have been found to differ greatly and in a study from
2008 [24] butyl-methyl-imidazolium chloride (BmimCl), ethyl-methyl-imidazolium chloride (EmimCl), butyl-
methyl-imidazolium acetate (BmimAc), ethyl-methyl-imidazolium acetate (EmimAc) and NMMO were com-
pared. It was shown that BmimCl dissolves cellulose similarly to NMMO by studying the tourque moment during
dissolution and seeing how closely it resembles that of NMMO. The cation affects the zero shear viscosity of the
solution as it was shown in the same study that a 13.5% cellulose EmimAc solution had a zero shear viscosity of
2281 Pas compared to a 13.2% cellulose BmimAc solution which had a zero shear viscosity of 9690 Pas. The
authors suggest that this might be due to the smaller ethyl-methyl imidazolium cation being able to interact more
with the cellulose chain compared to the bulkier butyl-methyl imidazolium cation. The exchange in anions from
chloride to acetate was shown to have much greater effect on the properties of the solution than the exchange in
cations. The BmimAc solutions had a zero shear viscosity of 9690 Pas compared to the previously mentioned
BmimCls zero shear viscosity of 47540 Pas. The chloride IL spun fibers also showed greater tenacity and loop
tenacity values than those spun in the acetate ILs. The acetate ILs were able to dissolve a higher amount of
cellulose which according to the authors might be related to the difference in solution states between the acetate
and chloride ILs. Anisotropic behavior has been found in BmimCl with 20 w% cellulose at 100 degrees Celsius
while an anisotropic behavior for EmimAc was not detected until the elevated cellulose concentration of 25 w%
[25]. All of the anisotropic effects increase as the cellulose concentration increases for all ILs but the authors also
made clear that the change from an isotropic to anisotropic state happens very slowly and can take up to several
days.
The cation of the ionic liquid also affect the dissolution process although not as obviously as for the case of the
anion. In a study by Kosan (2014) it was found that the acidic protons on the anion greatly affect the dissolution
process. The authors suggest that the acidic protons form hydrogen bonds with the glucose hydroxyl groups or
the ether bonds between the glucose units [26]. In a study from 2012 the authors speculate that the length of the
alkyl chain in a methyl-alkyl imidazolium ionic liquid affects the distribution of the chloride ions with a longer
chain obstructing the chloride ions from interacting with the cellulose decreasing the maximum amount of cellu-
lose that could potentially be dissolved. [27]
The ionic liquid TMGHOAc consisting of the tetra-methyl guanidine cation and the acetate anion has been shown
to have a melting point between 90-97 degrees Celsius and a vaporization point between 100 and 250 degree
Celsius at atmospheric conditions [7]. The vaporization of these ionic liquids is greatly dependent on the basicity
of the anion. According to a study [7] the basicity of the anion will determine the volatility of the ionic liquid. A
more basic anion results in a more volatile ionic liquid. The vaporization process of these ionic liquids is based
on the fact that the ion pair goes back to the neutral species which have their own distinct vapor pressures [28].
This fact also means that the corresponding base and acid of the ionic liquid will vaporize one by one with the
TMG having a boiling point at 52-54 degrees Celsius and HOAc having a boiling point at 117-118 according to
Sigma Aldrich. The dissolution of cellulose have already been proven for these ILs but the wet spinning of these
solutions have proved to have unfavorable spinning conditions. In a study by L. Hauru [28] the [TMGH][OAc]
spun fibers were shown to be collectable but the spun filament only had a tenacity of 10.9 cN/tex at a draw ratio
of 2.0 compared to the NMMO spun filaments which showed a tenacity of 31.2 cN/tex at a draw ratio of 6.2.
The [TMGH][OAc] gel has been shown to have good resilience and strength which suggests that this is not the
reason why the spinning does not work. In the previously mentioned study [28] it was found that the diffusion
rate of ionic liquid was constant during the regeneration phase for [TMGH][OAc] while it decreased significantly

12
for NMMO. The authors suggest that the changes in diffusion rate is caused by the realignment, and regeneration
should be accompanied by a significant decrease in the diffusion rate. The authors suggest that the reason for the
poor spinnability may be due to a gel like structure which does not allow the fibers to realign and reorient them-
selves to gain sufficient strength for spinning [28]. Furthermore to achieve good filament strength during spinning
the polymer chains must be allowed to align and then form intermolecular bonds during drying [28]: a gelatinous
structure would prevent both of these steps and is the reason behind the poor properties of the spun fibers.
In 2014 a patent for the use of a diazabicyclonene (DBN) based ionic liquid for the use in a process concerning
different spinning methods of lignocellulosic cellulose material was filed [29]. The authors found that the cellu-
lose DBN solution had the same viscoelastic properties as NMMO but at lower temperature and that the filament
could be drawn to draw ratios exceeding 10.
Dimethyl sulfoxide (DMSO) has been used in many studies as a co-solvent to the ionic liquid in cellulose disso-
lution. DMSO can act both as a soft base in its sulfoxide sulfur form and as a hard base in its sulfoxide oxygen
form, which allows the DMSO to dissolve a number of different substances. DMSO cannot dissolve cellulose by
itself but it can swell the cellulose making it easier for the actual solvent to penetrate the cellulose structure [30].
The main purpose of the DMSO is to disassociate the anion and cation in the ionic liquid. The enhanced dissoci-
ation of the ions makes the ions more readily available for hydrogen bonding to the cellulose and the cellulose
dissolution becomes easier [31][32]. DMSO has also been found to decrease the viscosity of the cellulose/ionic
liquid solution making it easier to work with [33] and it is also inert to the ionic liquid.
3 Purpose The purpose of the project is to further improve the understanding of the cellulose coagulation phenomena and
how it relates to the mechanical properties of the wet spun fibers. The reasons behind the difficulties when using
[TMGH][OAc] will be investigated thoroughly and it will also be investigated if the coagulation in these solution
can shed some light on its poor performance in fiber spinning. The dissolution of cellulose in [TMGH][OAc]
will also to be examined and the factors that affect the dissolution process will be investigated.
3.1 Scope The following limitations have been set for this project: Only micro crystalline cellulose will be analyzed. The
solvents has been limited to ethyl-methyl imidazolium acetate, butyl-methyl imidazolium chloride and tetrame-
thyl guanidinium acetate. The non-solvents have been limited to water and isopropanol.

13
4 Method:
4.1 Preparation of cellulose solutions
The dissolution of the cellulose is done by mixing the cellulose in the solvent during stirring and heating. The
heating should not be excessive and should be kept below 80 degrees during the entire process. The ionic liquid
will in some cases be diluted with DMSO in order to lower the viscosity and decrease the amount of ionic liq-
uid used.
4.2 Preparation of TMGHOAc ionic liquid
The preparation of TMGHOAc ionic liquid have been described in a study by Gao (2003) [34]. The ionic liquid
was prepared by neutralizing TMG in ethanol by adding a molar equivalent amount of acetic acid. 20mmol
TMG was solved in 100ml ethanol in a 250 ml flask and kept in a water bath with a temperature of 25 degree
Celsius. 20 mmol of acetic acid was solved in 35 ml ethanol and gradually added to the TMG solution. The re-
action took up to 2 hours and after the reaction was completed the reaction mixture was evaporated under re-
duced pressure and the remaining residue was then dissolved in 100 ml ethanol and treated with active carbon.
The product was then filtered and evaporated under vacuum which resulted in the finished ionic liquid.
In another study [35] the preparation of the TMG ionic liquid was done in a similar way, using dichloromethane
instead of ethanol. The ratio between TMG and dichloromethane were 50 mmol TMG to 40 ml dichloromethane
and 50 mmol acetic acid to 30 ml dichloromethane. In this study the ionic liquid was simply washed with hexane
in a vacuum after the evaporation of the dichloromethane.
TMGHOAc has also been prepared in larger volumes and it has been reported that a volumetric ratio of 1:3
between the IL and the co-solvent was used [6].

14
4.3 Coagulation value measurements
Measuring of the coagulation values (CV) was done using a
method where in the light absorbance of the cellulose is measured
[36]. First roughly 0.75 grams of the dissolved cellulose solution
was weighed up on a glass plate. Another glass plate was added on
top and by adding pressure a thin layer of cellulose solution was
created. The two plates were separated resulting in two different
cellulose films. One of the samples were placed within the analyz-
ing apparatus while the other was placed in a sealed container with
nitrogen to avoid exposure to moisture in the air. In the apparatus
the cellulose film was placed on a HDPE pipe on a scale with a
light source underneath it. Above the light source a light meter
measured the intensity of the light that passes through the cellulose
film. Above the light source a bath containing the non-solvent with
a heater was located. The whole system was closed to the sur-
rounding atmosphere so the heated water bath will locally increase
the moisture of the air in the same space as the cellulose film. By
continuously measuring the weight and light intensity the absorbed
mass of water at which the cellulose start to coagulate (the coagu-
lation value) could be found.
4.2 Mass-transport rate measurements
The coagulation rate was measured with an apparatus with the following set-
up. A small metal rod was inserted into a plastic syringe that has been filled
with cellulose solution. As the rod was inserted into the syringe it became
covered in cellulose solution. The rod and syringe was placed above a bath
filled with anti-solvent (water, isopropanol) and the rod was pushed out of
the syringe into the bath and kept there under a controlled amount of time.
The total mass of the rod, the syringe and the solution was weighed before
and after immersion which yields the net mass transport of the solution. The
dimension of the cellulose solution that covers the rod was in a cylindrical
shape with the length of 5.8 cm, the diameter of 4.6mm with a thickness of
0.35 mm. The conductivity in the non-solvent bath was measured which de-
termined the amount of the ionic liquid diffused out from the cellulose which
in combination with the net mass transport yields the non-solvents apparent
diffusion into the solution. The mass transfer of the non-solvent can be cal-
culated using the following equation: 𝑄𝑛𝑒𝑡 = 𝑄𝑁𝑆 − 𝑄𝐼𝐿. The conductivity
was correlated to the concentration of ionic liquid by making a conductivity to concentration series for the dif-
ferent ionic liquids in water and isopropanol (see Appendix A figures 26-30). The conductivity to concentration
Figure 5: Picture of the CV-measurement setup.
Figure 6: Picture showing the Coagula-
tion rate measurement setup.

15
correlation between water and EmimAc could be deduced by a previously existing reference curve. The diffusion
coefficient has been described in previous studies to have Fickian characteristics meaning that it follows Ficks
second law of diffusion [35] and is independent of the concentration of the solution (Ficks second law: 𝑑𝐶
𝑑𝑡=
𝐷𝑑2𝐶
𝑑𝑥2). The diffusion coefficient of the initial mass transfer can be calculated by the following equation:
𝑚
𝑚0=
2(𝐷𝑡
𝑙2)0.5 ∗ 𝜋−0.5[37], where
𝑚
𝑚0 is a function of the root of time, D is the diffusion coefficient, t is the submersion
time and l is the thickness of the cellulose solution layer.
4.3 Coagulation depth measurements
The rate of the expansion of the coagulation layer is meas-
ured using a microscope and laser combined with a program
that allows you to measure the thickness graphically. The cel-
lulose solution is inserted into a glass pipe and a glass rod is
inserted into the pipe. The construction is mounted into a
support frame of the microscope with a laser beneath it
pointed upwards into the glass pipe. The laser allows one to
better distinguish the cellulose layer and the microscope with
its built in camera is used to see and analyze the growth of
the layer. The method was also used without a laser, using a
normal light instead.
4.4 Solution preparation The cellulose dissolution sometimes requires certain procedure. Some of the ionic liquids are solid at room
temperature and thus have to be dissolved before being mixed with the cellulose. The ionic liquid solvents that
has been used to dissolve the solid ionic liquids in this study has been water and isopropanol. Water and isopro-
panol are as previously mentioned non-solvents and will hinder the dissolution in the mixture. The additive sol-
vent must be vaporized before dissolution can be achieved. After the additive solvent has been evaporated the
ionic liquid/cellulose solution stays in its liquid phase at room temperature.
4.5 Preparation of EmimAc cellulose solution: The preparation of the ethyl-methyl imidazolium acetate cellulose solution was done by mixing the components
and then stirring the solution in an open top syringe using a drill. The syringe is mounted into a structure that
holds the syringe in place and minimizes air supply. The mixing takes place during two hours after which the
solution is centrifuged to remove air bubbles. The two solutions that were prepared contained 13% and 8% cel-
lulose respectively, both containing a 99:1 weight ratio between the ionic liquid and the DMSO.
Figure 7: Picture showing the microscope image of the cellulose layer as it
coagulates
16
Table 1: EmimAc solution compositions
Solution IL MCC DMSO
13% 17.33 2.75 0.18
8% 18.39 1.67 0.19
4.6 Preparation of BmimCl cellulose solution: The butyl-methyl imidazolium chloride cellulose solution was prepared by first dissolving the ionic liquid in a
NaOH water solution with pH 10 as it is a solid at room temperature. The pH of the water solution is important
in order to avoid the acidic degradation that will occur if the pH is not kept at a high value. The ionic liquid has
5w% water after having been dissolved in the NaOH water solution. The components of the different solutions
were then mixed in the same way as with the EmimAc solution. After the mixing stage the solution was spread
onto a sheet and placed in a vacuum oven until the water has been evaporated. The dissolution is observed by
using a microscope where undissolved cellulose can easily be spotted. The 75:25 IL:DMSO solution contained
enough DMSO to dissolve the ionic liquid without the use of water.
Table 2 BmimCl solution compositions
Solution mBmimCl(g) mmcc(g) mDMSO(g)
13%C 99:1 20.88 (5% water) 3.17 0.22
8%C 99:1 22.25 (5% water) 1.92 0.24
13%C 75:25 16.66 3.26 5.52
8%C 85:15 19.22 (5% water) 1.63 0.19
4.7 Synthesis of TMGHOAc ionic liquid The synthesis of the tetra-methyl guanidine ionic liquid was performed by neutralizing the tetra-methyl guanidine
base with acetic acid. The acetic acid was put in an e-flask and placed in an ice bath while the TMG was added
carefully using a syringe. The acetic acid was originally dissolved in acetone in order to further prevent the sharp
temperature rise that occurs as the reaction is very exothermic and the TMG vaporizes at 52-54 degrees Celsius.
The acetone was later avoided as it was hard to distinguish the separation of acetone and TMG and the tempera-
ture increase could be managed with the ice bath and using an excess of TMG to. For detailed description of the
synthesis of the different TMGHOAc solutions see appendix B.
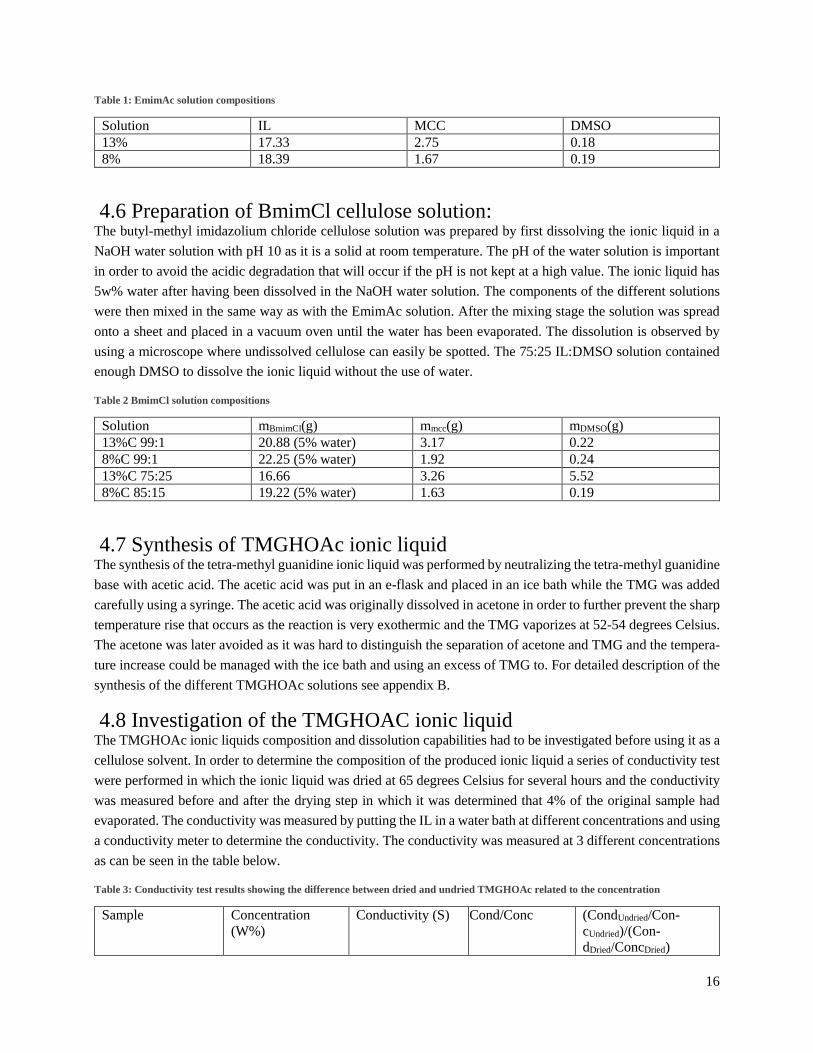
4.8 Investigation of the TMGHOAC ionic liquid The TMGHOAc ionic liquids composition and dissolution capabilities had to be investigated before using it as a
cellulose solvent. In order to determine the composition of the produced ionic liquid a series of conductivity test
were performed in which the ionic liquid was dried at 65 degrees Celsius for several hours and the conductivity
was measured before and after the drying step in which it was determined that 4% of the original sample had
evaporated. The conductivity was measured by putting the IL in a water bath at different concentrations and using
a conductivity meter to determine the conductivity. The conductivity was measured at 3 different concentrations
as can be seen in the table below.
Table 3: Conductivity test results showing the difference between dried and undried TMGHOAc related to the concentration
Sample Concentration
(W%)
Conductivity (S) Cond/Conc (CondUndried/Con-
cUndried)/(Con-
dDried/ConcDried)

17
Dried 1 0.9992 3210 3212.6 0.956
Undried 1 0.9963 3060 3071.4
Dried 2 0.7756 2550 3287.8 0.961
Undried 2 0.7757 2450 3158.4
Dried 3 0.5540 1843 3326.7 0.961
Undried 3 0.5482 1752 3195.9
The results which proved that the conductivity was roughly 4 % higher for the dried IL than for the undried IL.
The conductivity to concentration relationship of the TMGHOAc, the TMG and the HOAc was investigated in
order to find how the composition of the ionic liquid affects its conductivity. The substances were diluted in
water at different concentrations and the conductivity at these concentration were measured, the result can be
seen in the figure below.
Figure 8: The conductivity to correlation relationship for TMGHOAc, TMG and HOAc
The result showed that an excess of TMG base will lead to a higher conductivity to concentration correlation
while the opposite is true for the HOAc acid. This result shows that the vaporized component in the first conduc-
tivity test was residual acetone as this would increase the conductivity.
Another experiment measuring the pH instead of the conductivity was performed. In this experiment the sample
was dried in a vacuum oven and it was determined that 12% of the original sample had evaporated. The pH was
measured by dissolving the IL in water at different concentrations and using a pH-meter.
Table 4: pH tests comparing the dried and undried TMGHOAc related to the concentration of TMGHOAc
Sample Concentration (w%) pH (pH1/Conc1)/(pH2/Conc2)
Dried1 0.6298 5.58 0.887
Undried1 0.6297 6.29
Dried2 0.3277 5.56 0.843
Undried2 0.3136 6.31
0 2000 4000 6000 8000 10000 12000
0
0.2
0.4
0.6
0.8
1
1.2
1.4
mS
w%
TMGHOAcTMGHOAc

18
The results of the pH measurements showed that the pH decreases as the samples are dried which suggested that
the evaporated fraction was the TMG base.
In order to correlate the pH of the solution to the composition of the IL a pH titration series was performed in
which a 500 ml 0.1 M acetic acid solution was titrated with 0.5M TMG solution. The equivalence point was
found to be 8.8 (see figure 9).
An experiment to investigate how the pH of the IL affects the cellulose dissolution was performed. The original
IL had a pH of 5.89. The pH was once again measured by dissolving the IL in water and using a pH-meter
Table 5: pH dissolution series sample compositions and dissolution ability
Sample Solution (g) TMG (g) pH Dissolution
1 0.6466 0.0320 6.80 No
2 0.7824 0.0570 9.21 Partial
3 1.0689 0.2343 10.78 Yes
4 0.7190 0.2895 10.89 Yes
5 0.5041 0.3449 11.03 Yes
6 0.6348 0.6993 11.50 Yes
A clear correlation between the pH and the dissolution capabilities of the IL could be observed and an increase
in the pH value was shown to promote the dissolution of the cellulose with dissolution being impossible below
the equivalence point. This can be seen in the figure 9 below.
Figure 9: The pH-titration curve with added images showing the cellulose dissolution at pH: 5.89, 6.80, 9.21 and 10.78.
A test to evaluate DMSO as a co-solvent was administered. A 50:50 IL:DMSO solution was compared to a
solution without any cellulose. The results showed that the 50:50 DMSO:IL mixture shows much greater disso-
lution capabilities than the 0:100 DMSO:IL solution. The result can be seen in the figure 10 below.

19
Figure 10: The 50:50 IL:DMSO solution on the left side and the 100:0 IL:DMSO solution on the right side
4.9 Large scale cellulose dissolution in TMGHOAc The dissolution of larger volumes of cellulose solution were initially performed using a metal container with a
surrounding heating band and a stationary drill was used as a stirrer. The container was enclosed preventing air
contact. The IL was first adjusted to a lower pH before dissolution with the intention of increasing the pH, by
adding additional TMG after the mixing as this method to achieve dissolution had been shown to be successful
in the pH titration test. This was done to minimize the evaporation of the volatile TMG so that the contents of
the solution would be known with some accuracy.
Figure11: Schematic figure of the heating chamber set-up

20
The method proved to be problematic as the metal container was too large for the drill, preventing sufficient
mixing.
Figure 12: The unsuccessful attempt at cellulose dissolution in TMGHOAc
A new method was used in which the components were premixed in an open syringe and subsequently heated.
The results for the dissolution attempts resulted in a hard gel like solid material even after the extra TMG had
been added. After several attempts it was determined that adding the TMG after the heating was a problem as.
The IL with the higher pH can be used directly and the composition of the IL can be determined after the fact
using the titration curve and measuring the pH.
Dissolution of 8w% cellulose in a 99:1 IL:DMSO solution is attempted with the following composition:
Table 6: Components of the first TMGHOAc solution with 8w% cellulose and 99:1 IL:DMSO ratio.
Component Amount(g)
IL 9.122
MCC 0.802
DMSO 0.093
The components were premixed and then heated at 120 degrees Celsius. The dissolution seemed to be successful
as it remained in its liquid form without the sample solidifying. The solution had a dark red color which suggested
that there had been degradation of the cellulose.
Dissolution tests were performed on solutions with the following compositions:
Table 7: Compositions of failed TMGHOAc solutions
Composition IL(g) MCC(g) DMSO(g)
8%C, 99:1 IL:DMSO 9.122 0.802 0.093
13%C, 97:3 IL:DMSO 8.441 1.299 0.281
13%C, 96:4 IL:DMSO 12.694 1.953 0.557
8%C, 95:5 IL:DMSO 5.130 0.302 0.472

21
All of the tests resulted in the samples solidifying. The phase change in the 8% cellulose 95:5 IL:DMSO took
several hours even as it was refrigerated at a low temperature.
The DMSO to IL ratio was increased to 10:90 and a new solution was produced. The pH of the IL was 12.64
during this dissolution attempt.
Table 8: Components of the first TMGHOAc solution with 8w% cellulose and 90:10 IL:DMSO ratio.
Component Amount(g)
IL 12.437
MCC 1.205
DMSO 1.387
The solution remained in its liquid state and the solution could be analyzed.
Table 9: Components of the first TMGHOAc solution with 8w% cellulose and 85:15 IL:DMSO ratio.
Component Amount(g)
IL 5.189
MCC 0.533
DMSO 1.387
Table 10: Components of the first TMGHOAc solution with 13w% cellulose and 85:15 IL:DMSO ratio.
Component Amount(g)
IL 11.100
MCC 1.948
DMSO 1.966

22
5 Results:
5.1 Coagulation value results:
The CV test performed on the ethyl-methyl imidazolium acetate solutions resulted in solid films with a clear
change in turbidity and it could generally be observed that the coagulation happened at a lower weight percentage
for water compared to isopropanol. The coagulation was easy to measure as the intensity signal was large and
the change happened quickly at a specific amount of mass uptake of the non-solvent. The mass uptake denotes
the weight difference between when the plates are weighed together immediately after the solutions has been
added to the plates and the weight of the plates as they are weighed individually as the test is being performed
and represents the additional water that has been absorbed from the moisture in the air.
Table 11: The CV results for the EmimAc solutions.
Sample First second Mass uptake Average
13w% Cellulose 99:1 IL:DMSO
Water 1 16.30 15.31 0.58% 16.095
Water 2 17.24 16.28 0.65% 17.085
IPA 1 20.77 16.45 2.5% 19.86
IPA 2 23.8 25.50 1% 25.15
IPA 3 19.24 -
8w% Cellulose 99:1 IL:DMSO
Water 1 19.65 20.02 0.38% 20.025
Water 2 19.55 22.77 0.49% 21.405
IPA 1 19.82 24.65 2.85% 23.66
IPA 2 25.63 31.8 2.99% 29.21
The butyl-methyl imidazolium chloride CV results were much harder to interpret than the EmimAc results as the
coagulation process happened over a longer period of time resulting in a less clear signal and for the fact that the
signal was much lower in magnitude. This led to the BmimCl CV results being inconclusive as can be seen in
the figure below (see Appendix A: Figures 3, 4, 5 for further examples).

23
Figure 13: the cv results for the 8% cellulose 99:1 IL:DMSO, BmimCl solution
The CV results for the TMGHOAc solutions showed a coagulation similar to EmimAc with clear changes in
turbidity (see appendix A figure 6).
Table 12: CV results for the TMGHOAc solutions.
Sample CV1 CV2 Losses (%) Average CV
8w% Cellulose 90:10 IL:DMSO
Water 1 18.04 18.31 1.33 18.840
Water 2 18.24 16.55 1.30 18.045
IPA 1 20.16 20.89 1.73 21.390
IPA 2 28.85 28.62 2.18 29.825
5.2 Mass-transport rate results
The mass-transport tests resulted in information about the net mass-transport in and out of the cellulose solution
and the apparent diffusion of IL out of the solution by relating the conductivity of the solution to the concentration
of IL. The conductivity/concentration correlation was made by doing a conductivity series with different IL con-
centrations in both water and ipa. The series shows that there is a linear relation between the concentration of IL
and the conductivity (see Appendix A figures 20, 21, 22, 23). The concentration was compared to a long time
sample where it is assumed that all of the IL has diffused from the solution in order to find the amount of ionic
liquid that has diffused into the non-solvent compared to the total amount of ionic liquid in the cellulose solution.
The apparent diffusion of the non-solvent as well as the apparent diffusion coefficients are calculated as described
in chapter 4.2. Note that the non-solvents apparent diffusion rate and diffusion coefficient could not be accurately
calculated in the solutions with a high DMSO concentration as the DMSO diffusion was not measured. The
results for the 8w% 99:1 DMSO solutions proved to be unreliable.
The diffusion rate experiments for the EmimAc were performed on the 13w% cellulose 99:1 IL:DMSO.
0 5 10 15 20 25 30-0.2
0.3
0.8
1.3
1.8
2.3Water 1
Water 2
IPA 1
IPA 2
CV1

24
Table 13: Mass-transport rate results for the EmimAc solutions
Water IPA
13w% Cellulose 99:1 IL:DMSO
Initial rate of net mass transport
((Δm/m0)/√t)
0.0166 0.0155
Rate of IL diffusion((ΔmIL/m0)/√t) 0.0520 0.0295
Rate of Non-solvent diffu-
sion((ΔmNS/m0)/√t)
0.0706 0.0450
DIL(m2/s) 1.929E-10 6.208E-11
DNS(m2/s) 4.793E-10 1.947E-10
The diffusion rate experiments for the BmimCl were performed on the 8w% cellulose 99:1 IL:DMSO, 13w%
cellulose 99:1 IL:DMSO and the 13w% cellulose 25:75 IL:DMSO.
Table 14: Mass-transport rate results for the BmimCl solutions.
Water IPA
13w% Cellulose 99:1 IL:DMSO
Initial rate of net mass transport
((Δm/m0)/√t)
0.0223 0.0139
Rate of IL diffusion((ΔmIL/m0)/√t) 0.0332 0.0233
Rate of Non-solvent diffu-
sion((ΔmNS/m0)/√t)
0.0555 0.0372
DIL(m2/s) 7.863E-11 3.873E-11
DNS(m2/s) 2.962E-10 1.331E-10
8w% Cellulose 99:1 IL:DMSO
Initial rate of net mass transport
((Δm/m0)/√t)
0.0178 0.0131
Rate of IL diffusion ((ΔmIL/m0)/√t) 0.0459 0.0226
Rate of Non-solvent diffu-
sion((ΔmNS/m0)/√t)
0.0637 0.0357
DIL(m2/s) 1.681E-10 4.074E-11
DNS(m2/s) 3.902E-10 1.226E-10
13w% Cellulose 75:25 IL:DMSO
Initial rate of net mass transport
((Δm/m0)/√t)
0.0114 0.0100
Rate of IL diffusion((ΔmIL/m0)/√t) 0.0599 0.0323
DIL(m2/s) 1.469E-10 4.271E-11

25
The diffusion rate experiments for the TMGHOAc were performed on the 8w% cellulose 90:10 IL:DMSO solu-
tion and on 8w%.and 13w% cellulose 85:15 IL:DMSO.
Table 15: Mass-transport rate results for the TMGHOAc solutions
Water IPA
8w% Cellulose 90:10 IL:DMSO
Initial rate of net mass transport
((Δm/m0)/√t)
0.0229 0.0171
Rate of IL diffusion((ΔmIL/m0)/√t) 0.0436 0.0231
DIL(m2/s) 1.253E-10 3.518E-11
13w% Cellulose 85:15 IL:DMSO
Initial rate of net mass transport
((Δm/m0)/√t)
0.0156 0.0121
Rate of IL diffusion((ΔmIL/m0)/√t) 0.0412 0.0251
DIL(m2/s) 8.926E-11 3.287E-11
8w% Cellulose 85:15 IL:DMSO
Initial rate of net mass transport
((Δm/m0)/√t)
0.0176 0.0172
Rate of IL diffusion((ΔmIL/m0)/√t) 0.0376 0.0200
DIL(m2/s) 8.317E-11 2.352E-11
5.3 Coagulation depth results
The microscope method was performed on the 8w% cellulose EmimAc, BmimCl solutions and with TMGHOAc
8w% cellulose 10:90 DMSO:IL, 8w% cellulose 15:85 DMSO:IL and 13w% cellulose 15:85 DMSO:IL with
water being the used non-solvent. The growth rate is defined as the change in thickness of the coagulated front
divided by the square root of the time submerged in non-solvent.
Table 16: Microscope results for the EmimAc, BmimCl and TMGHOAc 8w% cellulose solutions with water as non-solvent.
Ionic liquid Growth rate (mm/√s)
EmimAc 0.0439
BmimCl 0.0716
TMGHOAc 8w% 10:90 0.0545
TMGHOAc 8w% 15:85 0.0195
TMGHOAc 13w% 15:85 0.044
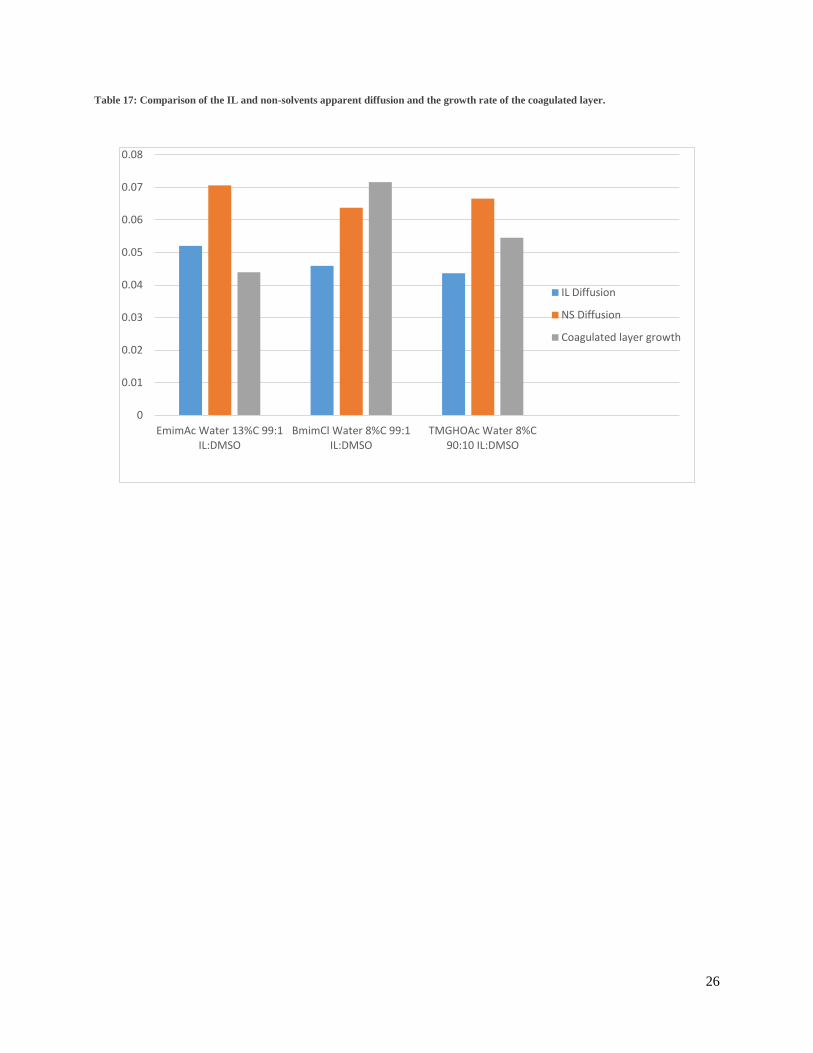
The apparent diffusion rates of the ionic liquids and non-solvents can be compared to the growth rate of the
different cellulose solutions as they are all proportional to the square root of time. This comparison can be seen
in the figure below.
26
Table 17: Comparison of the IL and non-solvents apparent diffusion and the growth rate of the coagulated layer.
EmimAc Water 13%C 99:1 IL:DMSO
BmimCl Water 8%C 99:1 IL:DMSO
TMGHOAc Water 8%C 90:10 IL:DMSO
0
0.01
0.02
0.03
0.04
0.05
0.06
0.07
0.08
IL Diffusion
NS Diffusion
Coagulated layer growth

27
6 Discussion:
The coagulation value analyzing method proved to be somewhat problematic for some of the solutions being
analyzed. The method worked well for the EmimAc and TMGHOAc solutions as these solutions showed a clear
change in light transmittance between the liquid solution and the coagulated layer with a transmitted intensity
change in the range of 7-17% for the EmimAc solutions and 14-18.5% for the TMGHOAc (see appendix figures
1,2 for EmimAc and 6 for TMGHOAc). This was expected for the EmimAc as the solvent has been studied
previously and shown to work well with this methods and the TMGHOAc fortunately also showed very clear
results. The results showed that the coagulation occurred at a lower non-solvent fraction for TMGHOAc cellulose
solutions than for the EmimAc solutions although the difference in DMSO concentration makes the results not
fully comparable.
The BmimCl was much harder to analyze and the CV tests with this ionic liquid are less conclusive due to the
very small signal that was shown as the cellulose coagulated with a transmitted intensity decrease of 0.5-2.5%
(see appendix figures 3 and 4). Combining the low intensity change with a very slow gradual coagulation and the
results become very hard to interpret. The low opacity change might be a result from the cellulose being less
crystalline in this solution since a more crystalline polymer tends to be more opaque than an amorphous polymer.
The low signal can also be caused by the pore size of the cellulose being too small to observe in the BmimCl
solution. If the pore size is smaller than 200 nm the pore will not be able to reflect visible light since it is smaller
than half of the smallest wavelength in visible light. The CV technique seems to not be the ideal analyzing method
for ionic liquids where the coagulated cellulose produces a transparent films. This type of weak signal has been
observed previously with solutions with cellulose concentrations above 25% showing similarly weak signals
[36].
The diffusion rate shows what was previously discussed in the theory segment, that the apparent diffusion of
non-solvent into the cellulose solution is much faster than the apparent diffusion of solvent out of the solution.
This shows that the rate determining step is the apparent diffusion of solvent out of the solution and it was deter-
mined that the apparent diffusion rate of IL in the initial stage of coagulation is in descending order: EmimAc,
BmimCl, TMGHOAc. It can be observed that water diffuses through the ionic liquids slightly faster than isopro-
panol. The apparent diffusion of IL out from the solution is much faster when water is used. This seems to suggest
that the structure of the IPA allows it to interact both with the cellulose and the ionic liquids whereas the water
preferably interacts with the cellulose. A good example of this can be seen in the IL diffusion result for BmimCl
with 8w% cellulose where it is apparent that that the apparent diffusion of ionic liquid has reached completion
after 225 seconds when water was used as a non-solvent whereas the apparent diffusion in isopropanol is much
slower (see Appendix A figure 10).
The diffusion rate experiments performed on the TMGHOAc solutions shows that the apparent diffusion pattern
for water and isopropanol is more similar than they were for the EmimAc and BmimCl samples (see Appendix
A figure 14). It could also be seen that the swelling of the coagulated layer was much greater in the TMGHOAc
and that the apparent diffusion of ionic liquid out of the cellulose solution is much slower than it has been in the
previously examined solvents. The slow apparent diffusion leads to a very thick coagulated layer with substan-
tially larger swelling than the EmimAc and BmimCl solutions.

28
The microscope measurements were only performed with water as the non-solvent. The results showed that the
rate at which the coagulated layer grows is the fastest in the BmimCl solutions followed by the TMGHOAc
solutions and the slowest being the EmimAc solutions (see appendix figures 15, 16 and 17). A potential reason
that makes the microscope method slightly unreliable is that the angle between the top of the coagulating cellulose
layer and the mirror might not be exactly the same for all of the samples resulting in a slight error. In the com-
parisons between IL and non-solvents apparent diffusion and the growth of the coagulated layer it can be seen
that faster mass transfer through the solution result in a quicker growth of the coagulated layer.
The dissolution of cellulose in the tetra-methyl guanidine ionic liquid was found to be very difficult to perform
as the solution easily reverted back to a solid structure at room temperature. The high dependence on pH on the
dissolution might explain this as it seems as if an abundance in acid promotes the phase change. The unreacted
acid might be able to hydrogen bond to the IL anions thereby preventing them from interacting with the cellulose
and stopping the cellulose solution from initiating. The fact that the TMGH ionic liquid is distillable and that the
TMG base in its nonionic form is very volatile also makes handling of the ionic liquid much more complicated
than the more stable ionic liquids.
It was also determined that the easiest way to achieve dissolution is to simply use heat to liquefy the tetra-methyl
guanidine ionic liquid and to use DMSO as a co-solvent. Because of the TMGs high vapor pressure and volatility
the evaporation stage of an eventual solvent such as an alcohol becomes problematic. The easiest way to be sure
of what components are present in the final solution is to only use heat and measure the pH to determine the
composition of the solution.
The DMSO is able to facilitate the dissolution in the TMGHOAc solutions, preventing the phase change of the
solution. The reason behind this phenomena might be that the ion pair does not separate well enough to effectively
dissolve the cellulose before returning to the solid state. The DMSO is known to enhance dissociation of the ion
pair of ionic liquids allowing the ionic liquid to remain in its liquid state. A gel like structure during regeneration
of cellulose was observed in a previous study [33] and was believed to be a reason for why the spun fibers showed
poor mechanical properties. In that study the authors produced a cellulose solution with a concentration of 13%
cellulose without any DMSO. Such a high cellulose concentration without any DMSO could not be produced in
this study as the solidification occurred once the temperature was decreased.

29
7 Conclusion:
The aim of this study was to investigate the coagulation process of the three ionic liquid solvents. It was shown
that the three solvents coagulate in different ways. EmimAc and TMGHOAc shows clear changes in turbidity
and opacity while BmimCl coagulates while showing only a minimal change in turbidity making the CV value
very hard to determine. The diffusion rate experiments also showed widely different results with the EmimAc
and BmimCl showing similar Δm/Δm0 curves with the water giving a more rapid apparent diffusion into the
solution and an ability to rapidly wash out solvent from the solution compared to isopropanol. The TMGHOAc
instead had much more similar Δm/Δm0 curves for water and isopropanol. These results suggests that the different
ways that water and isopropanol interact with the imidazolium based cations is not present in the tetra-methyl
guanidine ionic liquid where the difference in mass-transfer in and out from the IPA and water non-solvents only
differ slightly.
The dissolution of cellulose in TMGHOAc solvent was shown to be highly dependent on the pH value of the
system and a pH lower than the equivalence point will prevent the cellulose from dissolving. It was shown that
the easiest way to achieve dissolution was to use heat and stirring without dissolving the ionic liquid in water or
IPA. The higher vapor pressure of the ionic liquid which is its most interesting property also proved to be some-
what of a disadvantage as the heating required for dissolving the cellulose will vaporize parts of the solvent
affecting its composition and changing the dissolution properties of the solvent. In this study it was found that
the TMGHOAc solutions that were able to successfully dissolve the cellulose had an excess of TMG which
evaporates at a low temperature. The evaporation of the TMG base will change the composition of the solution.
The change can be kept under control by keeping the solution in a sealed container during heating and it can be
monitored by measuring the pH before and after the heating. It was shown that the phase change of the solution
can be avoided by using greater amounts of DMSO in the solution.

30
8 Future work:
Potential future works may include investigating the coagulation of NMMO based cellulose solutions to compare
the mechanism to the standard cellulose solvent. It would be interesting to compare the coagulation of ionic liquid
solvents to NMMO to investigate if there is any noticeable difference between the two or if the process is close
to identical. Further investigation of the TMGHOAc would also be interesting such as increasing the cellulose
concentration without changing the IL:DMSO ratio to find if the gel formation which makes the solvents so
difficult to work with is caused solely by the ionic liquid or if the cellulose promotes the gel formation. Spinning
trials of TMGHOAc solutions with higher amounts of DMSO would also be an interesting future study to find if
the TMGHOAc truly have insufficient spinning properties or if they can be circumvented by the use of DMSO
as a co-solvent.

31
References:
[1] Sanches. R.A. et al. Organic cotton, lyocell and SPF: a comparative study, 2014
[2] Hauru. K. J. et al. Role of solvent parameters in the regeneration of cellulose from Ionic Liquid Solutions, 2012
[3] Rosenau T. et al. The chemistry of side reactions and byproduct formation in the system NMMO/cellulose
(Lyocell process). 2001
[4] Hedlund. A. et al. Coagulation of EmimAc-cellulose solutions: dissolution-precipitation disparity and effects of
non-solvents and cosolvents. 2015
[5] Mazza. M. et al. Influence of water on the dissolution of cellulose in selected ionic liquids, 2008
[6] Parviainen. A. et al, Predicting cellulose solvating capabilities of Acid-Base conjugate ionic liquids. 2013
[7] King. A. W. T. et al, Distillable Acid-Base conjugate ionic liquids for cellulose dissolution and processing. 2011
[8] Lindman. B. et al. On the mechanism of dissolution of cellulose, 2010
[9] Olsson. C. et al. Wet spinning of cellulose from Ionic Liquid solutions-Viscometry and Mechanical performance,
2012
[10] Hedlund. A. Air gap spinning of cellulose fibers from ionic solvents, 2013
[11] Goldberg R.et al. A Thermodynamic Investigation of the cellulose amorphs: Cellulose(am), cellulose Iβ(cr), cel-
lulose IIβ(cr) and cellulose IIIβ(cr) 2015
[12] Wada M. et al X-ray Structure of Ammonia-Cellulose I: New Insights into the Conversion of Cellulose I to Cel-
lulose IIII, 2006
[13] Kobayashi K. et al. Crystal transition from Na-cellulose IV to cellulose II monitored using synchrotron x-ray
diffraction, 2010
[14] Dufresne A. Nanocellulose : from nature to high performance tailored materials, 2012
[15] Wu. Q. et al, A High Strength Nanocomposite Based on Microcrystalline Cellulose and Polyurethane,
2007
[16] Tarik A.M. et al, Biomimetic wet-stable fibres via wet spinning and diacid-based crosslinking of collagen
triple helices, 2015
[17] Lee J. M. et al, Solvent Polarities and Kamlet-Taft Parameters for Ionic Liquids Containing a Pyridinium
Cation, 2008
[18] Hauru L. K. J. et al, Role of Solvent Parameters in the Regeneration of Cellulose from Ionic Liquid Solu-
tions 2012
[19] Liu R.and Hu. X. Precipitation Kinetics of Cellulose in the Lyocell Spinning Process, 2006
32
[20] Biganska O. and Navard. P. Kinetics of precipitation of cellulose from cellulose-nmmo-water, 2005
[21] Liu C. K. et al. Diffusion competition between solvent and nonsolvent during the coagulation process of
cellulose/ammonia/ammonium thiocynate fiber spinning system, 1989
[22] Hedlund. A. Litterature study on cellulose coagulation, 2013
[23] Rey-Castro C. et al, Effect of the flexibility and the anion in the structural and transport properties of ethyl-me-
thyl-imidazolium ionic liquids 2007
[24] Lu B. et al, Cation does matter: how cationic structure affects the dissolution of cellulose in ionic liquids,
2013
[25] Kosan B. et al. Solution states of cellulose in selected direct dissolution agents, 2010
[26] Kosan B. et al. Dissolution and forming of cellulose with ionic liquids, 2007
[27] Zhao Y. et al, Effects of cationic structure on Cellulose Dissolution in Ionic Liquids: a molecular dynam-
ics study, 2012
[28] Hauru. L. K. J. Et al, Cellulose regeneration and spinnability from ionic liquids. 2015
[29] Michud A. et al. Process for the production of shaped cellulose articles, 2014, WO2014/162062 A1
[30] Östlund Å. et al, Dissolution of Cellulose in TBAF/DMSO Solutions: The Roles of Fluoride Ions and Wa-
ter, 2009
[31] Xu. A. Dissolution Behavior of Cellulose in IL+DMSO solvent: Effect of Alkyl Length in Imidazolium
Cation on Cellulose Dissolution, 2015
[32] Swatloski R. P. Dissolution of Cellose with Ionic Liquids 2002
[33] Cao H. T. et al, Effect of Dimethyl Sulfoxide (DMSO) on Cellulose Solution with High Concentration,
2015
[34] Gao. H. Et al. Preparation of room temperature ionic liquids by neutralization of 1,1,3,3-tetramethylguani-
dine with acids and their use as media for Mannich reactions, 2003
[35] Zhu et al. Dissolution of cellulose with ionic liquids and its application: a mini-review, 2006
[36] Hedlund. A, Coagulation of EmimAc-cellulose solutions: Dissolution-precipitation disparity effects of non-
solvents and co-solvents, 2015
[37] Crank. J The mathematics of diffusion, 1975

33
Appendix A: Results and measurements
Appendix A figure 1: Example of the CV measurements for 13% cellulose EmimAc solutions with a 1:99 weight fraction between DMSO
and IL
Appendix A figure 2: Example of the CV measurements for 8%cellulose EmimAc solutions with a 1:99 weight fraction between DMSO
and IL
0 5 10 15 20 25 30 35 40
-3
-1
1
3
5
7
9
11
13
mNS/m0
I/I0
Water sample 1Water sample 2IPA sample 1IPA sample 2
0 5 10 15 20 25 30 35 40
-3
2
7
12
17
mNS/m0
I/I0
Water sample 1
Water sample 2
IPA sample 1
IPA sample 2

34
Appendix A figure 3: Example of the CV measurements for 13%cellulose BmimCl solutions with a 1:99 weight fraction between DMSO
and IL
Appendix A figure 4: Example of the CV measurements for 8%cellulose BmimCl solutions with a 1:99 weight fraction between DMSO
and IL.
0 5 10 15 20 25
-1.3
-0.3
0.7
1.7
2.7
3.7
4.7
mNS/m0
I/I0
Water sample 1Water sample 2IPA sample 1IPA sample 2
0 5 10 15 20 25 30-0.2
0.3
0.8
1.3
1.8
2.3
mNS/m0
I/I0
Water 1
Water 2
IPA 1
IPA 2

35
Appendix A figure 5: Example of CV measurements for 13% Cellulose in BmimCl solution with a 25:75 weight fraction between DMSO
and IL
Appendix A figure 6: Example of CV measurements for 8% Cellulose in TMGHOAc with a 10:90 weight fraction between DMSO and IL
2 4 6 8 10 12 14 16
-0.3
-0.1
0.1
0.3
0.5
0.7
0.9
1.1
1.3
mNS/m0
I/I0
Water 1
Water 2
IPA 2
IPA 1
0 5 10 15 20 25 30 35 40-1.3
3.7
8.7
13.7
18.7
mNS/m0
I/I0
Water 1
Water 2
IPA 1
IPA 2

36
Appendix A figure 7: Diffusion rate results for EmimAc 13% cellulose
Appendix A figure 8: Diffusion rate results for EmimAc 13% Cellulose IL diffusion
y = 0.0295x
y = 0.052x
0 10 20 30 40 50 60 70
0
0.2
0.4
0.6
0.8
1
1.2
Square root of time(√s)
%IL
WaterIPAIpa initial IL diffusionWater initial IL diffusion
y = 0.0166x
y = 0.0155x
0 10 20 30 40 50 60 70
-0.05
0
0.05
0.1
0.15
0.2
0.25
m/m
0
WaterIPAWater initial diffusionIPA initial diffusion

37
Appendix A figure 9: Diffusion rate results for BmimCl 8% Cellulose
Appendix A figure 10: Diffusion rate results for BmimCl 8% Cellulose IL diffusion
y = 0.0178x
y = 0.0131x
-5 5 15 25 35 45 55 65
0
0.02
0.04
0.06
0.08
0.1
0.12
0.14
0.16
0.18
0.2
Square root of time (√s)
m/m
0
Water
IPA
Water initial diffusion
IPA initial diffusion
y = 0.0459x
y = 0.0226x
-5 5 15 25 35 45 55 65
0
0.2
0.4
0.6
0.8
1
1.2
Square root of time (√s)
%IL
WaterIPAWater initial diffusionIPA initial diffusion

38
Appendix A Figure 11: Diffusion rate results for BmimCl 13% Cellulose
Appendix A Figure 12: Diffusion rate results for BmimCl 13% Cellulose IL diffusion
y = 0.0223x
y = 0.0139x
0 10 20 30 40 50 60 70
-0.05
0
0.05
0.1
0.15
0.2
Square root of time (√s)
m/m
0
WaterIPAWater initial diffusionIPA initial diffusion
y = 0.0505x
y = 0.0302x
0 10 20 30 40 50 60 70
0
0.1
0.2
0.3
0.4
0.5
0.6
0.7
0.8
0.9
1
Square root of time(√s)
%IL
WaterIPAWater initial diffusionIPA initial diffusion
39
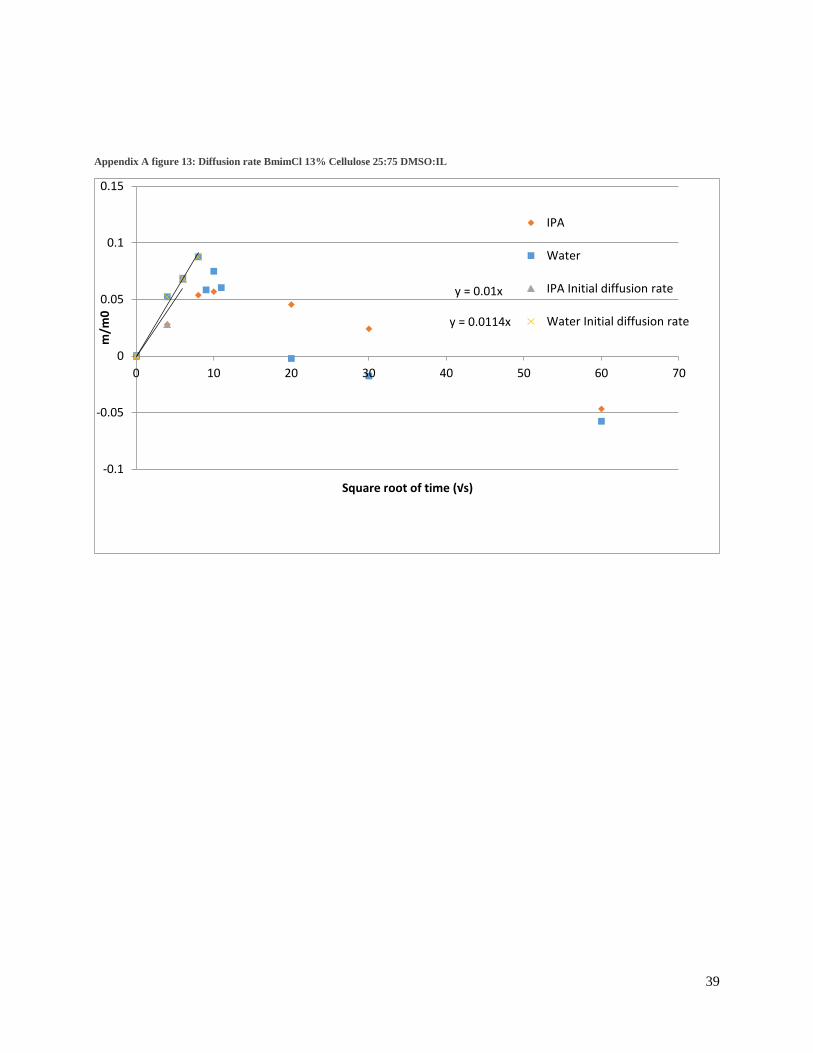
Appendix A figure 13: Diffusion rate BmimCl 13% Cellulose 25:75 DMSO:IL
y = 0.01x
y = 0.0114x
0 10 20 30 40 50 60 70
-0.1
-0.05
0
0.05
0.1
0.15
Square root of time (√s)
m/m
0
IPA
Water
IPA Initial diffusion rate
Water Initial diffusion rate

40
Appendix A Figure 14: Diffusion rate for BmimCl 13% Cellulose 25:75 DMSO:IL
y = 0.0599x
y = 0.0323x
0 10 20 30 40 50 60 70
0
0.2
0.4
0.6
0.8
1
1.2
%IL
Water
IPA
Water Initial diffusion
IPA Initial diffusion
y = 0.0229x y = 0.0171x
0 10 20 30 40 50 60 70
-0.05
0
0.05
0.1
0.15
0.2
0.25
0.3
m/m
0
Water
IPA
Water Initial diffusion rate
IPA Initial diffusion rate
Appendix A figure 15: Diffusion rate results for TMGHOAc 8% Cellulose 10:90 DMSO:IL
41
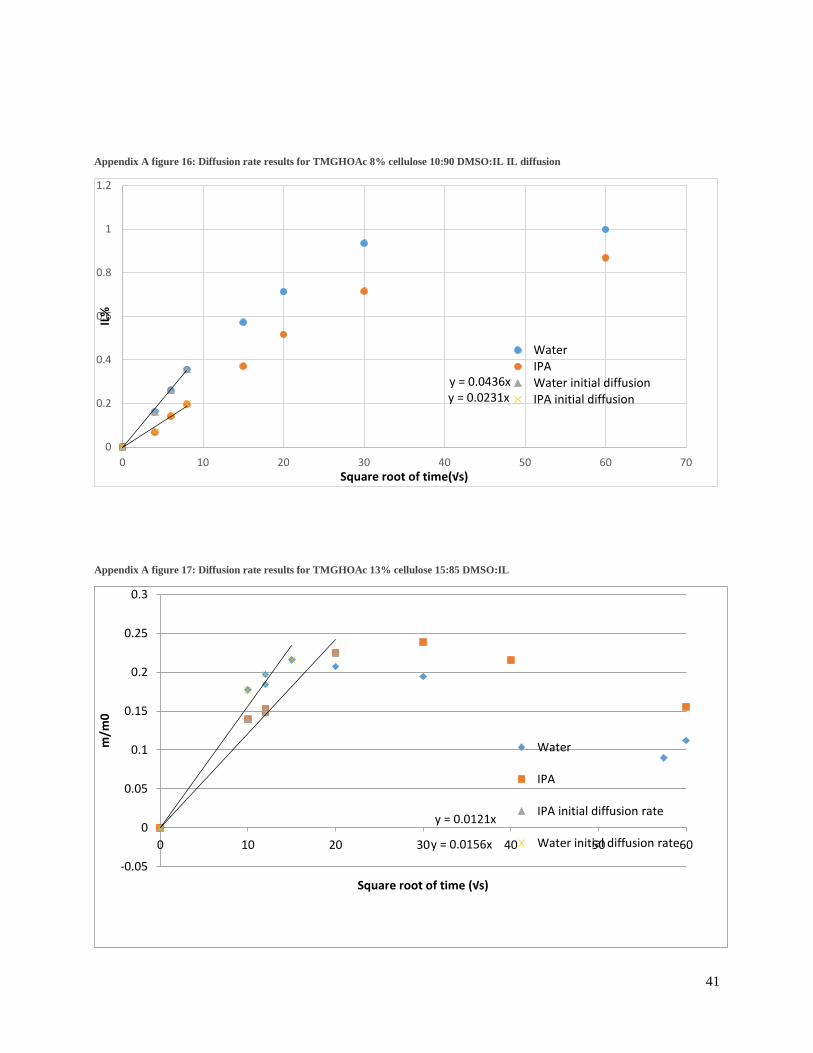
Appendix A figure 16: Diffusion rate results for TMGHOAc 8% cellulose 10:90 DMSO:IL IL diffusion
Appendix A figure 17: Diffusion rate results for TMGHOAc 13% cellulose 15:85 DMSO:IL
y = 0.0436xy = 0.0231x
0 10 20 30 40 50 60 70
0
0.2
0.4
0.6
0.8
1
1.2
Square root of time(√s)
IL%
WaterIPAWater initial diffusionIPA initial diffusion
y = 0.0121x
y = 0.0156x0 10 20 30 40 50 60
-0.05
0
0.05
0.1
0.15
0.2
0.25
0.3
Square root of time (√s)
m/m
0
Water
IPA
IPA initial diffusion rate
Water initial diffusion rate

42
Appendix A figure 18 Diffusion rate results TMGHOAc 13% cellulose 15:85 DMSO:IL
y = 0.0412x
y = 0.0251x
0 10 20 30 40 50 60 70
0
0.2
0.4
0.6
0.8
1
1.2
Square root of time (√s)
%IL
Water
IPA
Water initial IL diffusion
IPA initial IL diffusion

43
Appendix A figure 19: Diffusion rate results TMGHOAc 8% cellulose 15:85 DMSO:IL
Appendix A figure 20: Diffusion rate results TMGHOAc 8% cellulose 15:85 DMSO:IL
y = 0.0176x
y = 0.0172x
0 10 20 30 40 50 60
-0.05
0
0.05
0.1
0.15
0.2
0.25
0.3
Square root of time (√s)
m/m
0
IPA
water
IPA initial diffusion
Water initial diffusion
y = 0.0376x
y = 0.02x
-5 5 15 25 35 45 55 65
0
0.2
0.4
0.6
0.8
1
1.2
Square root of time (√s)
%IL
WaterIPAWater initial diffusionIPA initial diffusion

44
Appendix A figure 21: Coagulation depth results for EmimAc 8% Cellulose solution
Appendix A figure 22: Coagulation depth results for BmimCl 8% Cellulose solution
y = 0.0464x - 0.0402R² = 0.9502
0 10 20 30 40 50 60 70 80 90
0
0.5
1
1.5
2
2.5
3
3.5
4
4.5
Square root of time (√s)
Thic
kne
ss (
mm
)
y = 0.0716x - 0.4598R² = 0.9847
0 10 20 30 40 50 60 70 80
0
1
2
3
4
5
6
Square root of time (√s)
Thic
kne
ss (
mm
)
45
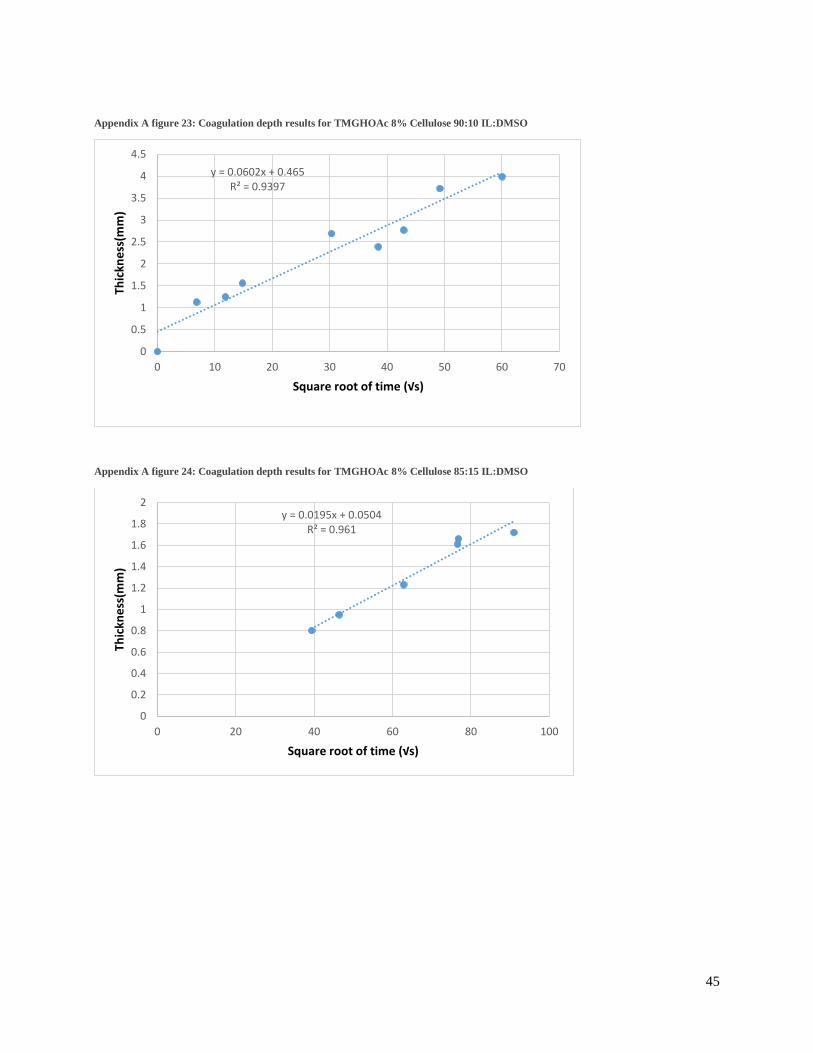
Appendix A figure 23: Coagulation depth results for TMGHOAc 8% Cellulose 90:10 IL:DMSO
Appendix A figure 24: Coagulation depth results for TMGHOAc 8% Cellulose 85:15 IL:DMSO
y = 0.0602x + 0.465R² = 0.9397
0 10 20 30 40 50 60 70
0
0.5
1
1.5
2
2.5
3
3.5
4
4.5
Square root of time (√s)
Thic
kne
ss(m
m)
y = 0.0195x + 0.0504R² = 0.961
0 20 40 60 80 100
0
0.2
0.4
0.6
0.8
1
1.2
1.4
1.6
1.8
2
Square root of time (√s)
Thic
kne
ss(m
m)

46
Appendix A figure 25: Coagulation depth results TMGHOAc 13% Cellulose 85:15 IL:DMSO
Appendix A figure 26: EmimAc concentration-conductivity relationship for EmimAc in isopropanol
y = 0.044x - 0.7339R² = 0.993
0 10 20 30 40 50 60 70 80 90
0
0.5
1
1.5
2
2.5
3
3.5
Square root of time (√s)
Thic
kne
ss(m
m)
y = 0.0081x - 0.4455R² = 0.9531
0 20 40 60 80 100 120 140 160 180
0
0.2
0.4
0.6
0.8
1
1.2
Conductivity (mS)
Co
nce
ntr
atio
n w
%

47
Appendix A figure 27: BmimCl concentration-conductivity relationship for BmimCl in water
Appendix A figure 28: BmimCl concentration-conductivity relationship for BmimCl in Isopropanol
y = 0.0002x - 0.0035R² = 0.9998
0 100 200 300 400 500 600
0
0.01
0.02
0.03
0.04
0.05
0.06
0.07
0.08
0.09
0.1
Conductivity (mS)
Co
ncen
trati
on
w%
y = 0.0052x - 0.1351R² = 0.9982
0 50 100 150 200 250
0
0.2
0.4
0.6
0.8
1
1.2
Conductivity (mS)
Co
nce
ntr
atio
n w
%

48
Appendix A figure 29: TMGHOAc concentration-conductivity relationship for TMGHOAc in water
Appendix A figure 30: TMGHOAC concentration-conductivity relationship for TMGHOAc in Isopropanol
y = 0.0002x + 0.0861R² = 0.9864
0 1000 2000 3000 4000 5000 6000 7000 8000
0
0.2
0.4
0.6
0.8
1
1.2
1.4
Conductivity (mS)
Co
nce
ntr
atio
n w
%
y = 0.0102x - 0.4812R² = 0.995
0 50 100 150 200 250
0
0.2
0.4
0.6
0.8
1
1.2
1.4
1.6
1.8
2
Conductivity (mS)
Co
nce
ntr
atio
n w
%

49
Appendix B: Extended experimental section
Preparation of EmimAc cellulose solution:
The preparation of the ethyl-methyl imidazolium acetate cellulose solution was done by mixing the components
and then stirring the solution in an open top syringe using a drill. The syringe is mounted into a structure that
holds the syringe in place and minimizes air supply. The mixing takes place during two hours after which the
solution is centrifuged to remove air bubbles. The two solutions that are prepared contain 13% and 8% cellu-
lose respectively, both containing a 99:1 weight ratio between the ionic liquid and the DMSO.
Appendix B Table 1: EmimAc solution compositions
Solution IL MCC DMSO
13% 17.325 2.745 0.175
8% 18.388 1.670 0.186
Preparation of BmimCl cellulose solution:
The butyl-methyl imidazolium chloride cellulose solution was prepared by first dissolving the ionic liquid in a
NaOH water solution with pH 10 as it is a solid at room temperature. The Ionic liquid has 5w% water after be-
ing dissolved. The components of the different solutions were then mixed in the same way as with the EmimAc
solution. After the mixing state the solution is spread onto a sheet and placed in a vacuum oven until the water
has been evaporated. The evaporation of the water is observed by using a microscope to find if the cellulose has
been completely dissolved as even low water concentrations would hinder dissolution of the cellulose. The
75:25 IL:DMSO solution contained enough DMSO to dissolve the ionic liquid without the use of water.
Appendix B Table 2: BmimCl solution compositions
Solution mBmimCl(g) mmcc(g) mDMSO(g)
13%C 99:1 20.877 (5% water) 3.166 0.2167
8%C 99:1 22.254 (5% water) 1.919 0.2446
13%C 75:25 16.657 3.258 5.517
Preparation of [TMGH][OAc] ionic liquid:
Appendix B Table 3: Molar mass and density for the components used in the TMGHOAc synthesis
Compound Molar mass[g/mol] Density[g/l]
TMG 115.18 918
HOAc 60.05 1050
Acetone 58.08 791
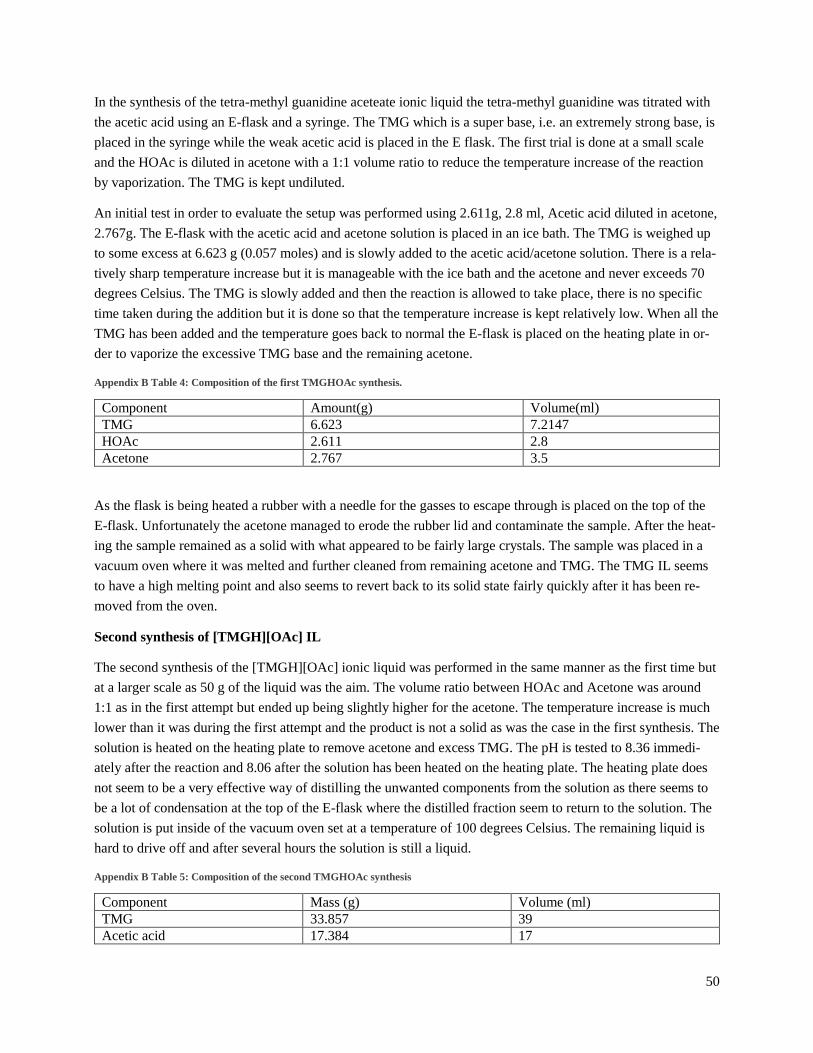
50
In the synthesis of the tetra-methyl guanidine aceteate ionic liquid the tetra-methyl guanidine was titrated with
the acetic acid using an E-flask and a syringe. The TMG which is a super base, i.e. an extremely strong base, is
placed in the syringe while the weak acetic acid is placed in the E flask. The first trial is done at a small scale
and the HOAc is diluted in acetone with a 1:1 volume ratio to reduce the temperature increase of the reaction
by vaporization. The TMG is kept undiluted.
An initial test in order to evaluate the setup was performed using 2.611g, 2.8 ml, Acetic acid diluted in acetone,
2.767g. The E-flask with the acetic acid and acetone solution is placed in an ice bath. The TMG is weighed up
to some excess at 6.623 g (0.057 moles) and is slowly added to the acetic acid/acetone solution. There is a rela-
tively sharp temperature increase but it is manageable with the ice bath and the acetone and never exceeds 70
degrees Celsius. The TMG is slowly added and then the reaction is allowed to take place, there is no specific
time taken during the addition but it is done so that the temperature increase is kept relatively low. When all the
TMG has been added and the temperature goes back to normal the E-flask is placed on the heating plate in or-
der to vaporize the excessive TMG base and the remaining acetone.
Appendix B Table 4: Composition of the first TMGHOAc synthesis.
Component Amount(g) Volume(ml)
TMG 6.623 7.2147
HOAc 2.611 2.8
Acetone 2.767 3.5
As the flask is being heated a rubber with a needle for the gasses to escape through is placed on the top of the
E-flask. Unfortunately the acetone managed to erode the rubber lid and contaminate the sample. After the heat-
ing the sample remained as a solid with what appeared to be fairly large crystals. The sample was placed in a
vacuum oven where it was melted and further cleaned from remaining acetone and TMG. The TMG IL seems
to have a high melting point and also seems to revert back to its solid state fairly quickly after it has been re-
moved from the oven.
Second synthesis of [TMGH][OAc] IL
The second synthesis of the [TMGH][OAc] ionic liquid was performed in the same manner as the first time but
at a larger scale as 50 g of the liquid was the aim. The volume ratio between HOAc and Acetone was around
1:1 as in the first attempt but ended up being slightly higher for the acetone. The temperature increase is much
lower than it was during the first attempt and the product is not a solid as was the case in the first synthesis. The
solution is heated on the heating plate to remove acetone and excess TMG. The pH is tested to 8.36 immedi-
ately after the reaction and 8.06 after the solution has been heated on the heating plate. The heating plate does
not seem to be a very effective way of distilling the unwanted components from the solution as there seems to
be a lot of condensation at the top of the E-flask where the distilled fraction seem to return to the solution. The
solution is put inside of the vacuum oven set at a temperature of 100 degrees Celsius. The remaining liquid is
hard to drive off and after several hours the solution is still a liquid.
Appendix B Table 5: Composition of the second TMGHOAc synthesis
Component Mass (g) Volume (ml)
TMG 33.857 39
Acetic acid 17.384 17

51
Acetone 14.6 19
Heating test
By heating the sample it can be determined that the solution is 95% dry material. The test is done fairly quickly
and without liquefying the sample. Upon cooling the rest of the IL also solidified to a structure similar to the
first synthesis test and when two more samples are heated it can be determined that the solid content after one
day standing in a sealed E-flask to be 75% after 1.5 hours and 63% after 2 hours suggesting that the IL might
have vaporized and both of the samples had completely liquefied.
Conductivity test
A new test with lower temperature around 65 degrees Celsius is being administered for several hours. The IL
stays in its solid form so it can be assumed that none of the IL has been evaporated. The solid content of this
sample was determined to be 90%. Comparing the conductivities of the dry and undried IL it was found that the
dried ionic liquid had a higher conductivity than the undried one. The difference in conductivity between the
dried and undried ionic liquid was shown to be roughly 4%, which is unexpected since it would have been sus-
pected that the undried IL could possibly contain some remaining TMG base or acetic acid that might increase
the conductivity but that was not the case. This suggests that there is some remaining acetone left in the undried
IL. A pH test is performed in order to further try to understand the properties of the ionic liquid and how to de-
termine its contents.
Appendix B Table 6: Conductivity test results showing the difference between dried and undried TMGHOAc related to the concentration
Sample Concentration (W%) Conductivity (S) (CondUndried/Con-
cUndried)/(Con-
dDried/ConcDried)
Dried 1 0.9992 3210 0.956
Undried 1 0.9963 3060
Dried 2 0.7756 2550 0.961
Undried 2 0.7757 2450
Dried 3 0.5540 1843 0.961
Undried 3 0.5482 1752
A pH test is performed in order to further try to understand the properties of the ionic liquid and how to deter-
mine its contents. A new sample is dried and roughly 88% of the original IL remains. The pH for the dried
samples are found to be significantly lower in pH than the undried sample suggesting that their might be some
residual TMG left in the sample. The pH is measured by dissolving the IL in water and using a pH-meter.
Appendix B Table 7: pH tests comparing the dried and undried TMGHOAc related to the concentration of TMGHOAc
Sample Concentration (w%) pH (pH1/Conc1)/(pH2/Conc2)
Dried1 0.6298 5.58 0.887
Undried1 0.6297 6.29
Dried2 0.3277 5.56 0.843

52
Undried2 0.3136 6.31
These results seem to contradict each other since the conductivity test seem to suggest that only acetone has
evaporated while the pH test seems to suggest that TMG has evaporated.
pH titration test:
A titration is being performed with the acetic acid and TMG in order to determine the pH at the equilibrium of
the ionic liquid. A volume of 500 ml 0.1 M acetic acid solution is being titrated with a 0.5M TMG solution. It
can be determined that the equivalence point is at a pH of 8.795. This result points to the fact that the vaporized
fraction in the dried samples are part of the ionic liquid. The TMG base has a higher vapor pressure than the
acetic acid which would lead to it being the first component to vaporize. The undried ionic liquid has a pH
around 6.3 which is still too low when compared to the titration curve. This suggests that there is still some un-
reacted acid left in the sample. It can be determined that it is important to react all of the acid in the sample and
to have the TMG in excess to minimize the residual acid since it would seem that the residual acid is not easily
removed by vaporization. A pH test on the first batch of [TMGH][OAc] ionic liquid reveals that this one had a
pH of 5. 46, much lower than the pH of the equivalence point revealed in the titration test.
In order to try to correct the pH dissolution tests were done where extra TMG base was added to the solution. A
test with ethanol as the co-solvent was performed where 1.8827g IL, 0.5304g EtOH, 0.1028g TMG and 0.250g
Cellulose. The pH of this solution, when dissolved in water was determined to be 10.16 giving a pH value that
is within the interval for the equivalence point. The solution was mixed and heated in order for the ethanol to
dissolve and to create a cellulose IL solution. The solutions greatly resemble the previous cellulose solutions
but when examined under the microscope it can be seen that the cellulose has not been dissolved. Tests were
performed on an IPA solution and a 50:50 DMSO solution neither of which were able to dissolve the cellulose
completely, although the DMSO solution showed much more promise than the IPA solution and had almost
fully dissolved the cellulose.
Appendix B Figure 1: The 50:50 IL:DMSO solution on the left side and the IPA solution on the right side.

53
In order to determine if and how the pH affect the dissolution of the cellulose a test were set up where the pH
of the solution was altered. A base cellulose solution with 9 w% cellulose and pH 5.89 was prepared. The cellu-
lose solution was separated into different samples and different amounts of TMG was added to the respective
samples (see table 9). As can be seen in the picture below it was discovered that the pH of the solution deter-
mines if the cellulose can be dissolved or not and it was shown that while a low pH meaning an excess in acid
cannot dissolve the cellulose, an excess in base is capable of dissolving the cellulose. The pH is measured by
dissolving the IL in water and using a pH-meter.
Appendix B Table 8: pH dissolution series sample compositions and dissolution ability
Sample Solution (g) TMG (g) pH Dissolution
1 0.6466 0.0320 6.80 No
2 0.7824 0.0570 9.21 Partial
3 1.0689 0.2343 10.78 Yes
4 0.7190 0.2895 10.89 Yes
5 0.5041 0.3449 11.03 Yes
6 0.6348 0.6993 11.50 Yes
Appendix B Figure 2: The pH-titration curve with added images showing the cellulose dissolution at pH: 5.89, 6.80, 9.21 and 10.78.
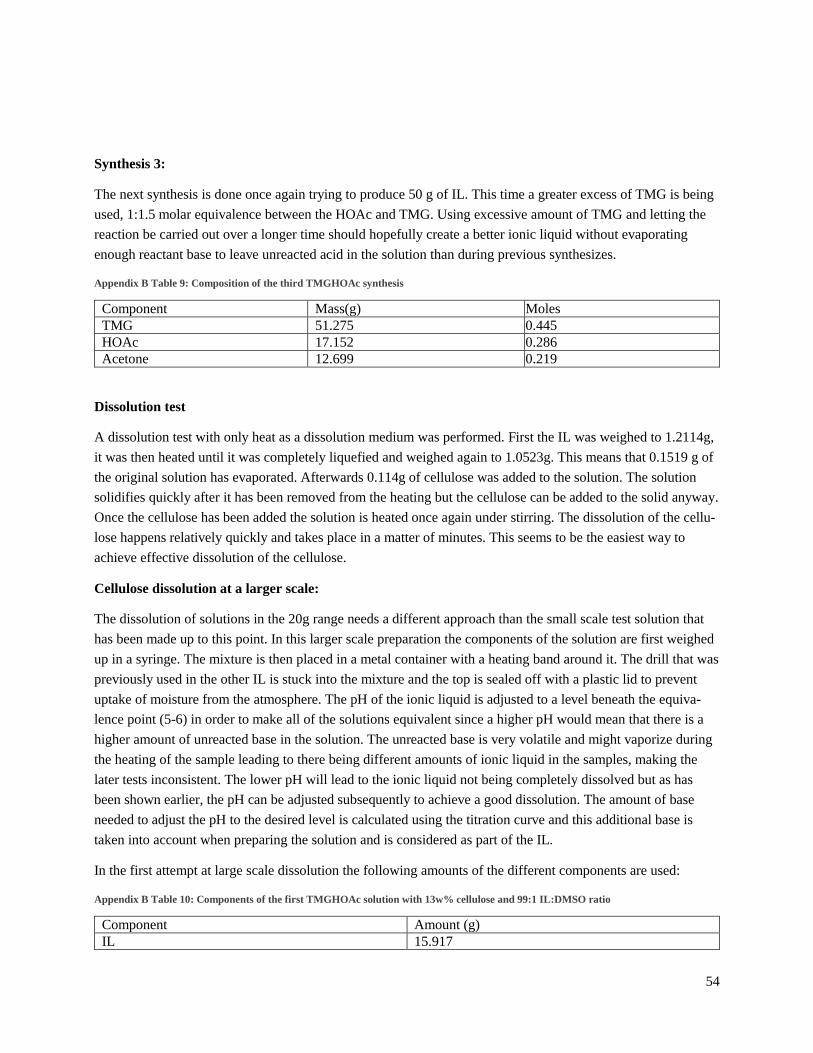
54
Synthesis 3:
The next synthesis is done once again trying to produce 50 g of IL. This time a greater excess of TMG is being
used, 1:1.5 molar equivalence between the HOAc and TMG. Using excessive amount of TMG and letting the
reaction be carried out over a longer time should hopefully create a better ionic liquid without evaporating
enough reactant base to leave unreacted acid in the solution than during previous synthesizes.
Appendix B Table 9: Composition of the third TMGHOAc synthesis
Component Mass(g) Moles
TMG 51.275 0.445
HOAc 17.152 0.286
Acetone 12.699 0.219
Dissolution test
A dissolution test with only heat as a dissolution medium was performed. First the IL was weighed to 1.2114g,
it was then heated until it was completely liquefied and weighed again to 1.0523g. This means that 0.1519 g of
the original solution has evaporated. Afterwards 0.114g of cellulose was added to the solution. The solution
solidifies quickly after it has been removed from the heating but the cellulose can be added to the solid anyway.
Once the cellulose has been added the solution is heated once again under stirring. The dissolution of the cellu-
lose happens relatively quickly and takes place in a matter of minutes. This seems to be the easiest way to
achieve effective dissolution of the cellulose.
Cellulose dissolution at a larger scale:
The dissolution of solutions in the 20g range needs a different approach than the small scale test solution that
has been made up to this point. In this larger scale preparation the components of the solution are first weighed
up in a syringe. The mixture is then placed in a metal container with a heating band around it. The drill that was
previously used in the other IL is stuck into the mixture and the top is sealed off with a plastic lid to prevent
uptake of moisture from the atmosphere. The pH of the ionic liquid is adjusted to a level beneath the equiva-
lence point (5-6) in order to make all of the solutions equivalent since a higher pH would mean that there is a
higher amount of unreacted base in the solution. The unreacted base is very volatile and might vaporize during
the heating of the sample leading to there being different amounts of ionic liquid in the samples, making the
later tests inconsistent. The lower pH will lead to the ionic liquid not being completely dissolved but as has
been shown earlier, the pH can be adjusted subsequently to achieve a good dissolution. The amount of base
needed to adjust the pH to the desired level is calculated using the titration curve and this additional base is
taken into account when preparing the solution and is considered as part of the IL.
In the first attempt at large scale dissolution the following amounts of the different components are used:
Appendix B Table 10: Components of the first TMGHOAc solution with 13w% cellulose and 99:1 IL:DMSO ratio
Component Amount (g)
IL 15.917
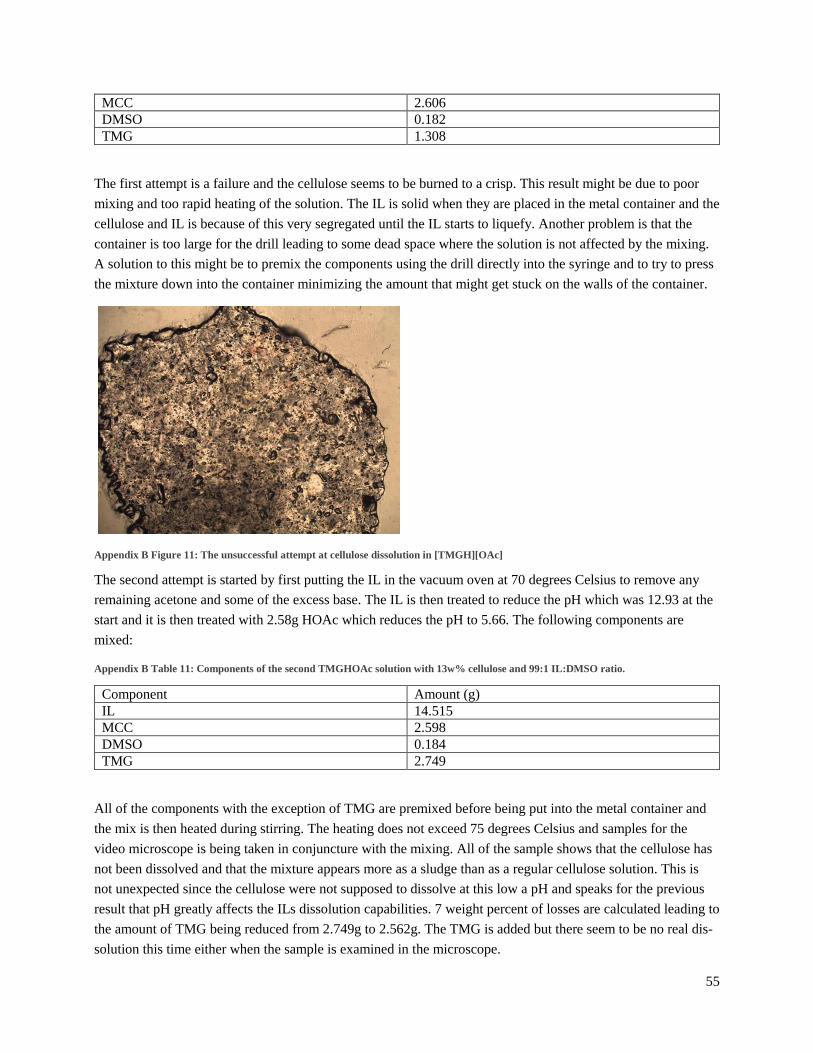
55
MCC 2.606
DMSO 0.182
TMG 1.308
The first attempt is a failure and the cellulose seems to be burned to a crisp. This result might be due to poor
mixing and too rapid heating of the solution. The IL is solid when they are placed in the metal container and the
cellulose and IL is because of this very segregated until the IL starts to liquefy. Another problem is that the
container is too large for the drill leading to some dead space where the solution is not affected by the mixing.
A solution to this might be to premix the components using the drill directly into the syringe and to try to press
the mixture down into the container minimizing the amount that might get stuck on the walls of the container.
Appendix B Figure 11: The unsuccessful attempt at cellulose dissolution in [TMGH][OAc]
The second attempt is started by first putting the IL in the vacuum oven at 70 degrees Celsius to remove any
remaining acetone and some of the excess base. The IL is then treated to reduce the pH which was 12.93 at the
start and it is then treated with 2.58g HOAc which reduces the pH to 5.66. The following components are
mixed:
Appendix B Table 11: Components of the second TMGHOAc solution with 13w% cellulose and 99:1 IL:DMSO ratio.
Component Amount (g)
IL 14.515
MCC 2.598
DMSO 0.184
TMG 2.749
All of the components with the exception of TMG are premixed before being put into the metal container and
the mix is then heated during stirring. The heating does not exceed 75 degrees Celsius and samples for the
video microscope is being taken in conjuncture with the mixing. All of the sample shows that the cellulose has
not been dissolved and that the mixture appears more as a sludge than as a regular cellulose solution. This is
not unexpected since the cellulose were not supposed to dissolve at this low a pH and speaks for the previous
result that pH greatly affects the ILs dissolution capabilities. 7 weight percent of losses are calculated leading to
the amount of TMG being reduced from 2.749g to 2.562g. The TMG is added but there seem to be no real dis-
solution this time either when the sample is examined in the microscope.

56
Two new tests are performed, one where the IL, DMSO and cellulose is homogenized using the drill and then
placed inside of the oven to melt the IL and create a cellulose solution. In the other method the IL is melted in
the oven alone and the cellulose is added to the melted IL along with the DMSO and subsequently the solution
is mixed using the drill.
Appendix B Table 12: Components of the third TMGHOAc solution with 13w% cellulose and 99:1 IL:DMSO ratio
Component Amount (g)
IL 7.853
MCC 1.306
DMSO 0.091
TMG 1.139
Appendix B Table 13: Components of the third TMGHOAc solution with 13w% cellulose and 99:1 IL:DMSO ratio without added TMG.
Component Amount (g)
IL 7.846
MCC 1.302
DMSO 0.087
TMG -
The tests result in the same way as previously with a hard sludge like material. The two samples are heated at
120 degrees until they appear liquefied and a clear distinction can be seen between the sample with the added
TMG and the sample without the added TMG. The sample with the added TMG appears as one of the previous
successful cellulose solutions while the one without the added base quickly reverts to its gel like state. The pH
for the samples are measured to 9.9 for the one with the added base and 6.6 for the one without the added base.
However as the samples are kept overnight the sample with the added base also reverts back to its gel like state.
The samples are heated once again at 120 degrees Celsius and once again return to their liquid states. The solu-
tion state seem to be highly temperature dependent and goes back to its solid state quickly after the temperature
is lowered
A new batch of [TMGH][OAc] is prepared this time with the following components:
Appendix B Table 14: Components of the fourth TMGHOAc synthesis
Component Amount(g)
TMG 38.51
HOAc 17.14
The base is added in excess to the acetic acid by 1:1.7 molar equivalence. The acetone is neglected this time
since the evaporation of acetone seems to be a bigger problem than the initial temperature increase caused by
the reaction.
Because of the difficulty to create a solution that is usable in the tests a DMSO test is performed.
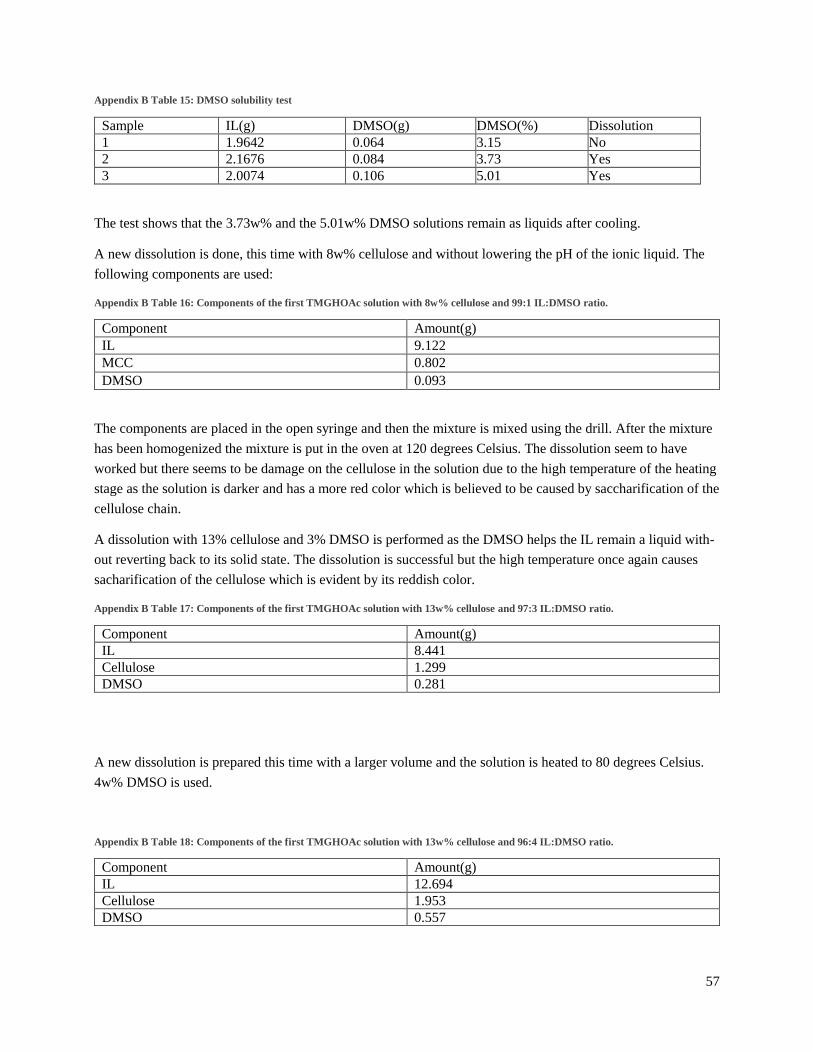
57
Appendix B Table 15: DMSO solubility test
Sample IL(g) DMSO(g) DMSO(%) Dissolution
1 1.9642 0.064 3.15 No
2 2.1676 0.084 3.73 Yes
3 2.0074 0.106 5.01 Yes
The test shows that the 3.73w% and the 5.01w% DMSO solutions remain as liquids after cooling.
A new dissolution is done, this time with 8w% cellulose and without lowering the pH of the ionic liquid. The
following components are used:
Appendix B Table 16: Components of the first TMGHOAc solution with 8w% cellulose and 99:1 IL:DMSO ratio.
Component Amount(g)
IL 9.122
MCC 0.802
DMSO 0.093
The components are placed in the open syringe and then the mixture is mixed using the drill. After the mixture
has been homogenized the mixture is put in the oven at 120 degrees Celsius. The dissolution seem to have
worked but there seems to be damage on the cellulose in the solution due to the high temperature of the heating
stage as the solution is darker and has a more red color which is believed to be caused by saccharification of the
cellulose chain.
A dissolution with 13% cellulose and 3% DMSO is performed as the DMSO helps the IL remain a liquid with-
out reverting back to its solid state. The dissolution is successful but the high temperature once again causes
sacharification of the cellulose which is evident by its reddish color.
Appendix B Table 17: Components of the first TMGHOAc solution with 13w% cellulose and 97:3 IL:DMSO ratio.
Component Amount(g)
IL 8.441
Cellulose 1.299
DMSO 0.281
A new dissolution is prepared this time with a larger volume and the solution is heated to 80 degrees Celsius.
4w% DMSO is used.
Appendix B Table 18: Components of the first TMGHOAc solution with 13w% cellulose and 96:4 IL:DMSO ratio.
Component Amount(g)
IL 12.694
Cellulose 1.953
DMSO 0.557
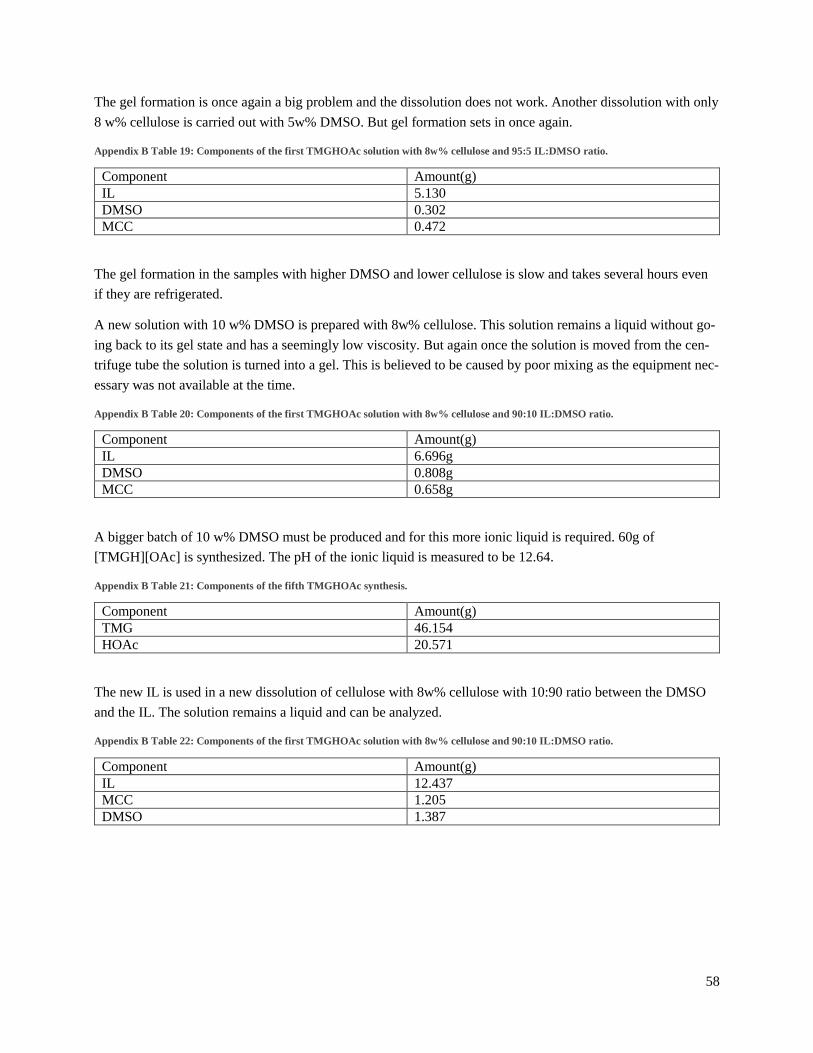
58
The gel formation is once again a big problem and the dissolution does not work. Another dissolution with only
8 w% cellulose is carried out with 5w% DMSO. But gel formation sets in once again.
Appendix B Table 19: Components of the first TMGHOAc solution with 8w% cellulose and 95:5 IL:DMSO ratio.
Component Amount(g)
IL 5.130
DMSO 0.302
MCC 0.472
The gel formation in the samples with higher DMSO and lower cellulose is slow and takes several hours even
if they are refrigerated.
A new solution with 10 w% DMSO is prepared with 8w% cellulose. This solution remains a liquid without go-
ing back to its gel state and has a seemingly low viscosity. But again once the solution is moved from the cen-
trifuge tube the solution is turned into a gel. This is believed to be caused by poor mixing as the equipment nec-
essary was not available at the time.
Appendix B Table 20: Components of the first TMGHOAc solution with 8w% cellulose and 90:10 IL:DMSO ratio.
Component Amount(g)
IL 6.696g
DMSO 0.808g
MCC 0.658g
A bigger batch of 10 w% DMSO must be produced and for this more ionic liquid is required. 60g of
[TMGH][OAc] is synthesized. The pH of the ionic liquid is measured to be 12.64.
Appendix B Table 21: Components of the fifth TMGHOAc synthesis.
Component Amount(g)
TMG 46.154
HOAc 20.571
The new IL is used in a new dissolution of cellulose with 8w% cellulose with 10:90 ratio between the DMSO
and the IL. The solution remains a liquid and can be analyzed.
Appendix B Table 22: Components of the first TMGHOAc solution with 8w% cellulose and 90:10 IL:DMSO ratio.
Component Amount(g)
IL 12.437
MCC 1.205
DMSO 1.387