investigating fusion plasma instabilities in the mega amp ... · investigating fusion plasma...
TRANSCRIPT
Investigating fusion plasma instabilities in the Mega Amp Spherical Tokamak usingmega electron volt proton emissions (invited)a)R. V. Perez, W. U. Boeglin, D. S. Darrow, M. Cecconello, I. Klimek, S. Y. Allan, R. J. Akers, D. L. Keeling, K. G.McClements, R. Scannell, M. Turnyanskiy, A. Angulo, P. Avila, O. Leon, C. Lopez, O. M. Jones, N. J. Conway,and C. A. Michael Citation: Review of Scientific Instruments 85, 11D701 (2014); doi: 10.1063/1.4889736 View online: http://dx.doi.org/10.1063/1.4889736 View Table of Contents: http://scitation.aip.org/content/aip/journal/rsi/85/11?ver=pdfcov Published by the AIP Publishing Articles you may be interested in Publisher's Note: “Bi-directional Alfvén cyclotron instabilities in the mega-amp spherical tokamak” [Phys.Plasmas 21, 082501 (2014)] Phys. Plasmas 22, 049901 (2015); 10.1063/1.4916942 Research on anisotropy of fusion-produced protons and neutrons emission from high-current plasma-focusdischarges Rev. Sci. Instrum. 86, 013502 (2015); 10.1063/1.4905181 Bi-directional Alfvén cyclotron instabilities in the mega-amp spherical tokamak Phys. Plasmas 21, 082501 (2014); 10.1063/1.4891322 First fusion proton measurements in TEXTOR plasmas using activation techniquea) Rev. Sci. Instrum. 83, 10D318 (2012); 10.1063/1.4739228 High definition imaging in the Mega Amp Spherical Torus spherical tokamak from soft x rays to infrared (invited) Rev. Sci. Instrum. 75, 4069 (2004); 10.1063/1.1789583
This article is copyrighted as indicated in the article. Reuse of AIP content is subject to the terms at: http://scitationnew.aip.org/termsconditions. Downloaded to IP:
150.203.177.240 On: Mon, 18 May 2015 07:15:05
REVIEW OF SCIENTIFIC INSTRUMENTS 85, 11D701 (2014)
Investigating fusion plasma instabilities in the Mega Amp SphericalTokamak using mega electron volt proton emissions (invited)a)
R. V. Perez,1,b) W. U. Boeglin,1 D. S. Darrow,2 M. Cecconello,3 I. Klimek,3 S. Y. Allan,4
R. J. Akers,4 D. L. Keeling,4 K. G. McClements,4 R. Scannell,4 M. Turnyanskiy,5 A. Angulo,1
P. Avila,1 O. Leon,1 C. Lopez,1 O. M. Jones,4,6 N. J. Conway,4 and C. A. Michael71Department of Physics, Florida International University, 11200 SW 8 ST, CP204, Miami, Florida 33199, USA2Princeton Plasma Physics Laboratory, James Forrestal Campus, P.O. Box 451, Princeton,New Jersey 08543, USA3Department of Physics and Astronomy, Uppsala University, Uppsala SE-751 20, Sweden4CCFE, Culham Science Centre, Abingdon, Oxfordshire OX14 3DB, United Kingdom5ITER Physics Department, EFDA CSU Garching, Boltzmannstrasse 2, D-85748, Garching, Germany6Department of Physics, Durham University, Durham DH1 3LE, United Kingdom7Australian National University, Canberra ACT 0200, Australia
(Presented 5 June 2014; received 31 May 2014; accepted 26 June 2014; published online 18 July2014)
The proton detector (PD) measures 3 MeV proton yield distributions from deuterium-deuterium fu-sion reactions within the Mega Amp Spherical Tokamak (MAST). The PD’s compact four-channelsystem of collimated and individually oriented silicon detectors probes different regions of theplasma, detecting protons (with gyro radii large enough to be unconfined) leaving the plasma oncurved trajectories during neutral beam injection. From first PD data obtained during plasma oper-ation in 2013, proton production rates (up to several hundred kHz and 1 ms time resolution) dur-ing sawtooth events were compared to the corresponding MAST neutron camera data. Fitted protonemission profiles in the poloidal plane demonstrate the capabilities of this new system. © 2014 AIPPublishing LLC. [http://dx.doi.org/10.1063/1.4889736]
I. INTRODUCTION
Fast ion redistribution caused by electromagnetic fieldfluctuations could affect the performance of plasmas in theITER burning plasma device, currently under construction.Diagnostics providing cost-effective, high time and spatialresolution of fast ion density profiles are essential forstudying high frequency, short-time scale MHD plasmainstabilities. A precedent exists for using collimated silicondetectors in conventional tokamak fast ion experiments tomeasure emission profiles.1, 2 Energy spectra were obtainedfor 3 MeV fusion protons (from Deuterium-Deuterium, orDD, fusion reactions) detected in the Princeton Large Torusand Axially Symmetric Divertor Experiment.3–5 Sphericaltokamak fast ion diagnostics such as the Mega Amp SphericalTokamak (MAST) Neutron Camera6 (NC) use 2.5 MeV DDfusion neutrons to infer emission profiles, while the MASTFast Ion Deuterium Alpha (FIDA) spectrometer,7 NationalSpherical Torus Experiment (NSTX) FIDA8 spectrometer,and NSTX solid state neutral particle analyzer9 observecharge exchange interactions, to study fast ion distributionsduring plasma MHD instabilities.
A prototype diagnostic to detect 3 MeV DD fusion pro-tons in a spherical tokamak10 has been installed in MAST atthe Culham Centre for Fusion Energy (CCFE) in Culham, theUnited Kingdom. A compact, four-channel system of colli-
a)Invited paper, published as part of the Proceedings of the 20th Topical Con-ference on High-Temperature Plasma Diagnostics, Atlanta, Georgia, USA,June 2014.
b)Electronic mail: [email protected].
mated silicon detectors where each detector probes a differentregion of the plasma, detects charged fusion products emittedalong curved trajectories. This diagnostic takes advantage ofthe unconfined nature of 3 MeV protons and 1 MeV tritonsfrom DD fusion reactions during the neutral beam injection(NBI) to create proton emission profiles. The capability ofthis prototype diagnostic to infer the proton emissivity duringfast MHD events such as sawteeth is presented.
II. PROTON DETECTOR DESIGN
A. Charged fusion product trajectories
The PD’s curved sightlines were reconstructed from anorbit code that calculates particle trajectories backwards intime from the point where they hit one of the PD’s detec-tors. The curved integration paths for the DD charged fusionproduct trajectories, or orbits, depend on the MAST equilib-rium magnetic field configuration reconstructed with EFIT11
(an isotropic DD cross section is assumed). With a toroidalmagnetic field between 0.5 T and 0.6 T, the 3 MeV proton and1 MeV triton’s gyro radii are of the order of 1 m, leaving themessentially unconfined by the plasma’s magnetic field, andallowing them to leave the plasma before completing a fullgyro-orbit. Equatorial and poloidal orbit projections (shownin Figs. 1 and 2) were used to determine the necessary angu-lar orientation, with respect to the center of the MAST ves-sel, to probe different parts of the plasma core for each de-tector. Of the charged fusion products from the DD reaction,the protons and tritons have the same orbits while the helium-3 ions have considerably smaller gyro radii, completing ten
0034-6748/2014/85(11)/11D701/6/$30.00 © 2014 AIP Publishing LLC85, 11D701-1
This article is copyrighted as indicated in the article. Reuse of AIP content is subject to the terms at: http://scitationnew.aip.org/termsconditions. Downloaded to IP:
150.203.177.240 On: Mon, 18 May 2015 07:15:05
11D701-2 Perez et al. Rev. Sci. Instrum. 85, 11D701 (2014)
PD detector array
Center stack
X [m]
Y [m
]
Orbits lead to detector
Plasma edge
Vessel wall
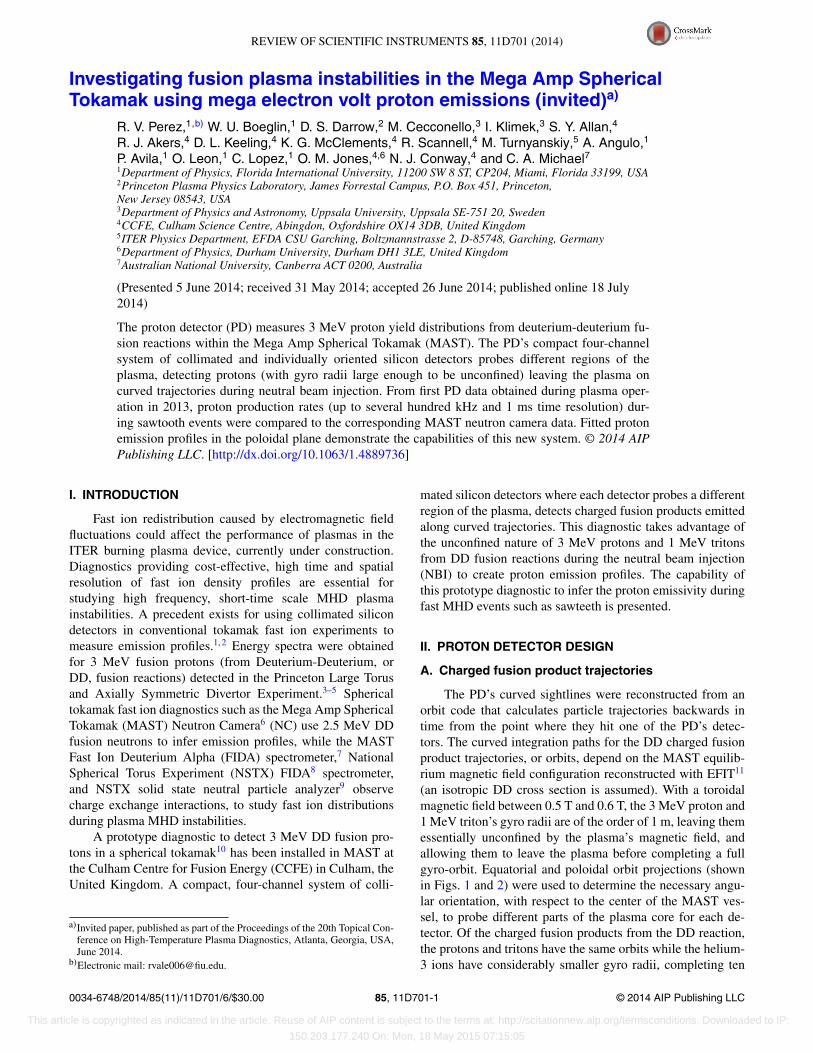
FIG. 1. The equatorial cross section of the MAST vessel with central orbitprojections (in the PD coordinate system).
or more gyro-orbits before leaving the plasma. The plottedtrajectories show the central orbits for each detector. Each ofthe four central orbits has a bundle of orbits which are de-pendent on the finite dimensions, length and diameter, of thecollimating system (described in Sec. II B). The range of ra-dial positions at the midplane sampled for one orbit bundle is±3 cm from the plotted central orbit. Initial measurements forthe detector-collimator system’s solid angle acceptance arecurrently being carried out.
B. Mechanical housing
The PD stainless steel housing (Fig. 3(A)) connects toa mechanical probe arm that inserts the entire instrument,
Ch1 orbit
PD detector array
Ch2 orbit
Ch3 orbit
Ch0 orbit
Z [m
]
R [m]
low
em
issi
on
hi
gh e
mis
sion
1.51.20.9
−0.4
−0.6
−0.2
0.0
0.2
0.4
FIG. 2. Poloidal cross section of MAST with orbit projections. The PD de-tects particles with velocities tangential to the central orbits. The midplaneradial intersections are the particle’s R positions at Z = 0 m. The contourlines are surfaces of constant magnetic flux. Solid colors show the simulatedproton emission.
FIG. 3. Assembled PD is attached to a mechanical probe arm which insertsthe entire diagnostic radially into the tokamak and towards the plasma. (A)Steel housing, (B) transparent shield, (C) Washer for foil attachment, (D)PEEK sleeve, (E) Detector, (F) Signal cable connection.
110 mm in diameter and 185 mm in length, through a12.7 cm porthole into MAST’s midplane. A 6 mm thick boronnitride (BN) ceramic shield (Fig. 3(B)) offers thermal andelectrical insulation protecting the four detectors (Fig. 3(E))and associated electrical components. The housing contains a38 mm long collimator with a 3.8 mm diameter leading to thedetector’s 100 μm thick active layer. An 0.8 μm thick Alu-minum foil (spot welded to a shim stock washer, Fig. 3(C))was used to filter out soft x-rays and light emitted from theplasma. The energy loss for the proton, triton, and helium-3ions passing through the foil were 18.4 keV, 34.6 keV, and282 keV, respectively. A 1.8 mm thick Ketron PEEK 1000sleeve (Fig. 3(D)) electrically insulates the gold-plated detec-tor and its cable connection (Fig. 3(F)) from the rest of thesteel housing. Note that a placement pin near the point ofattachment of the PD to the mechanical probe arm ensuredproper detector orientation after installation.
C. Data acquisition system
In each of the four data channels, the Ortec CU-014-050-100S silicon surface barrier detectors (intrinsic energyresolution of 14 keV) were attached to coaxial connectorsof Accu-Glass Products, Inc.-TYPE25 Ultra High Vacuum(UHV) Kapton-coded coaxial cables. The detector’s currentsignals passed through two custom connectors to the pre-existing UHV cables inside of the mechanical probe armshaft. The connector thickness, crimping, and groundingmethods used to create the connector resulted in a 30 mmdistance of unshielded parallel signal cables. The signal leftthe probe arm shaft through two more custom connectorsto Canberra 2003BT charge sensitive preamplifiers, where itwas converted to a voltage proportional to the accumulatedcharge. LMR-195 coaxial cables were used for airside sig-nal cables. The voltage signal was then amplified and shapedby a Canberra 2111 timing filter amplifier and digitizedin a NI-PCI5105 high-speed digitizer. The digitizer, whichcollects 60 MSamples/s and has a 512 MB onboard memory,was installed on an Adnaco-S2 PCI Expansion System whichwas connected to a Supermicro 5016I-MTF server throughan Adnaco-FC1 fiber patch cable. A program was written inLabVIEW 2011 to automate the digitizer’s data collection.
A distance of about 3 m between the detectors and pream-plifiers, the use of non-coaxial electrical feedthroughs, and
This article is copyrighted as indicated in the article. Reuse of AIP content is subject to the terms at: http://scitationnew.aip.org/termsconditions. Downloaded to IP:
150.203.177.240 On: Mon, 18 May 2015 07:15:05
11D701-3 Perez et al. Rev. Sci. Instrum. 85, 11D701 (2014)
the grounding scheme for the system contributed to relativelyhigh noise levels on the order of 0.1 V–0.15 V (five timeshigher than expected) with data signals ranging from 0.15 Vto 1 V. These factors can be mitigated to reduce contributionsto background noise levels for future diagnostic installations.
III. RAW DATA COLLECTION AND ANALYSIS
The diagnostic was installed and operated at MAST (atthe CCFE) from August to September 2013. It was used, to-gether with the NC and FIDA spectrometer, in dedicated fastparticle physics experiments involving both the classical be-havior of beams in the plasma and the effect of plasma insta-bilities on fast ions. The focus of this paper will be on saw-tooth events in which the plasma’s toroidal magnetic field (atthe magnetic axis) was 0.58 T, plasma current was 600 kA,and NBI heating power was 1.3 MW. During these experi-ments the PD radial position along the major radius was re-motely changed between plasma pulses to move towards andaway from the center of the tokamak. The option for man-ual rotation of the PD about the major radius was not used.A digital trigger sent from the MAST Central Controller wasconfigured in such a way that the PD collected 0.67 s of dataper shot, or pulse (where a typical plasma pulse lasted up to0.5 s).
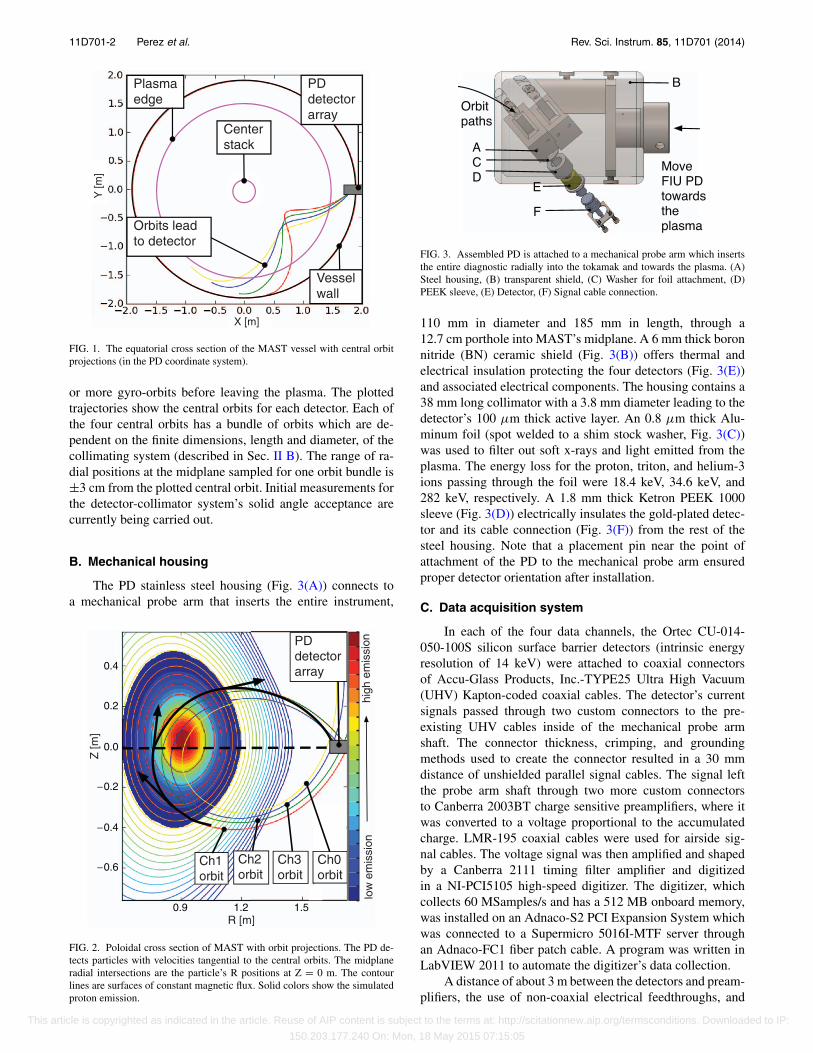
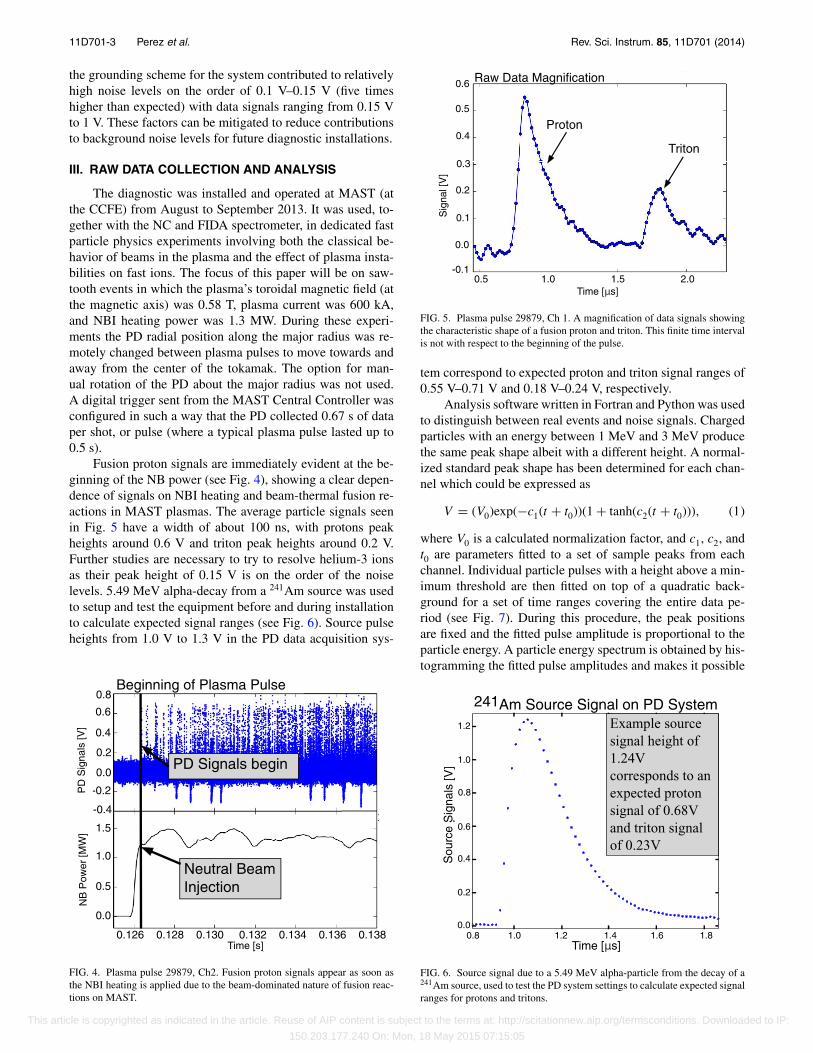
Fusion proton signals are immediately evident at the be-ginning of the NB power (see Fig. 4), showing a clear depen-dence of signals on NBI heating and beam-thermal fusion re-actions in MAST plasmas. The average particle signals seenin Fig. 5 have a width of about 100 ns, with protons peakheights around 0.6 V and triton peak heights around 0.2 V.Further studies are necessary to try to resolve helium-3 ionsas their peak height of 0.15 V is on the order of the noiselevels. 5.49 MeV alpha-decay from a 241Am source was usedto setup and test the equipment before and during installationto calculate expected signal ranges (see Fig. 6). Source pulseheights from 1.0 V to 1.3 V in the PD data acquisition sys-
Neutral Beam Injection
PD Signals begin
Beginning of Plasma Pulse
Time [s]0.126 0.128 0.130 0.132 0.134 0.136 0.138
0.8
0.6
0.4
0.2
0.0
-0.2
-0.4
1.5
1.0
0.5
0.0
PD
Sig
nals
[V]
NB
Pow
er [M
W]
FIG. 4. Plasma pulse 29879, Ch2. Fusion proton signals appear as soon asthe NBI heating is applied due to the beam-dominated nature of fusion reac-tions on MAST.
Proton
Triton
Time [ s]
0.6
Sig
nal [
V]
0.5
0.4
0.3
0.2
0.1
0.0
-0.10.5 1.0 1.5 2.0
FIG. 5. Plasma pulse 29879, Ch 1. A magnification of data signals showingthe characteristic shape of a fusion proton and triton. This finite time intervalis not with respect to the beginning of the pulse.
tem correspond to expected proton and triton signal ranges of0.55 V–0.71 V and 0.18 V–0.24 V, respectively.
Analysis software written in Fortran and Python was usedto distinguish between real events and noise signals. Chargedparticles with an energy between 1 MeV and 3 MeV producethe same peak shape albeit with a different height. A normal-ized standard peak shape has been determined for each chan-nel which could be expressed as
V = (V0)exp(−c1(t + t0))(1 + tanh(c2(t + t0))), (1)
where V0 is a calculated normalization factor, and c1, c2, andt0 are parameters fitted to a set of sample peaks from eachchannel. Individual particle pulses with a height above a min-imum threshold are then fitted on top of a quadratic back-ground for a set of time ranges covering the entire data pe-riod (see Fig. 7). During this procedure, the peak positionsare fixed and the fitted pulse amplitude is proportional to theparticle energy. A particle energy spectrum is obtained by his-togramming the fitted pulse amplitudes and makes it possible
241Am Source Signal on PD System
Time [ s]
Sou
rce
Sig
nals
[V]
0.8 1.0 1.2 1.4 1.6 1.8
Example source signal height of 1.24V corresponds to an expected proton signal of 0.68V and triton signal of 0.23V
0.4
0.2
0.6
0.8
1.0
1.2
0.0
FIG. 6. Source signal due to a 5.49 MeV alpha-particle from the decay of a241Am source, used to test the PD system settings to calculate expected signalranges for protons and tritons.
This article is copyrighted as indicated in the article. Reuse of AIP content is subject to the terms at: http://scitationnew.aip.org/termsconditions. Downloaded to IP:
150.203.177.240 On: Mon, 18 May 2015 07:15:05
11D701-4 Perez et al. Rev. Sci. Instrum. 85, 11D701 (2014)
Time [ s]1.0 2.0 3.0 4.0 5.0 6.0 7.0
Fit (line)
Raw data (point)
Fitt
ed D
ata
[V]
-1.0
0.0
0.1
0.2
0.3
0.4
0.5
0.6 Fit amplitudeσ
Peak height
PD Fitted Data
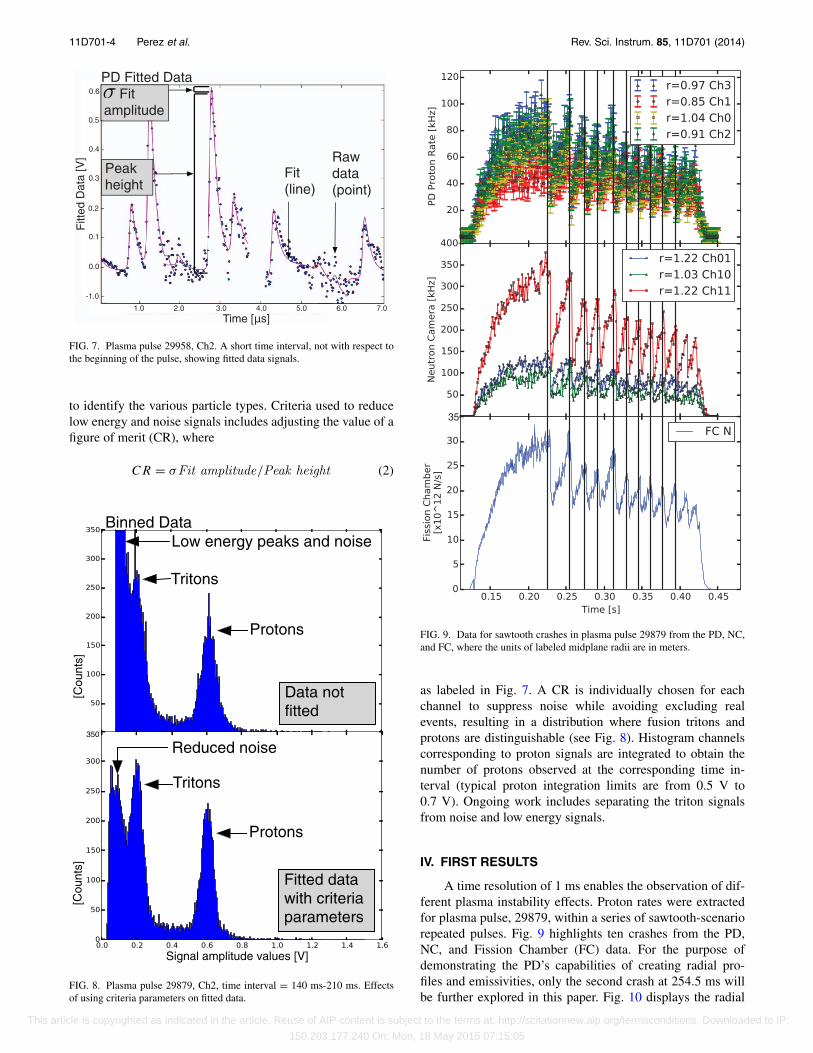
FIG. 7. Plasma pulse 29958, Ch2. A short time interval, not with respect tothe beginning of the pulse, showing fitted data signals.
to identify the various particle types. Criteria used to reducelow energy and noise signals includes adjusting the value of afigure of merit (CR), where
CR = σFit amplitude/Peak height (2)
[Cou
nts]
Signal amplitude values [V]
Tritons
Protons
Low energy peaks and noise
Reduced noise
[Cou
nts]
Fitted data with criteria parameters
Data not
350
Tritons
Protons
Binned Data
FIG. 8. Plasma pulse 29879, Ch2, time interval = 140 ms-210 ms. Effectsof using criteria parameters on fitted data.
35
FIG. 9. Data for sawtooth crashes in plasma pulse 29879 from the PD, NC,and FC, where the units of labeled midplane radii are in meters.
as labeled in Fig. 7. A CR is individually chosen for eachchannel to suppress noise while avoiding excluding realevents, resulting in a distribution where fusion tritons andprotons are distinguishable (see Fig. 8). Histogram channelscorresponding to proton signals are integrated to obtain thenumber of protons observed at the corresponding time in-terval (typical proton integration limits are from 0.5 V to0.7 V). Ongoing work includes separating the triton signalsfrom noise and low energy signals.
IV. FIRST RESULTS
A time resolution of 1 ms enables the observation of dif-ferent plasma instability effects. Proton rates were extractedfor plasma pulse, 29879, within a series of sawtooth-scenariorepeated pulses. Fig. 9 highlights ten crashes from the PD,NC, and Fission Chamber (FC) data. For the purpose ofdemonstrating the PD’s capabilities of creating radial pro-files and emissivities, only the second crash at 254.5 ms willbe further explored in this paper. Fig. 10 displays the radial
This article is copyrighted as indicated in the article. Reuse of AIP content is subject to the terms at: http://scitationnew.aip.org/termsconditions. Downloaded to IP:
150.203.177.240 On: Mon, 18 May 2015 07:15:05
11D701-5 Perez et al. Rev. Sci. Instrum. 85, 11D701 (2014)
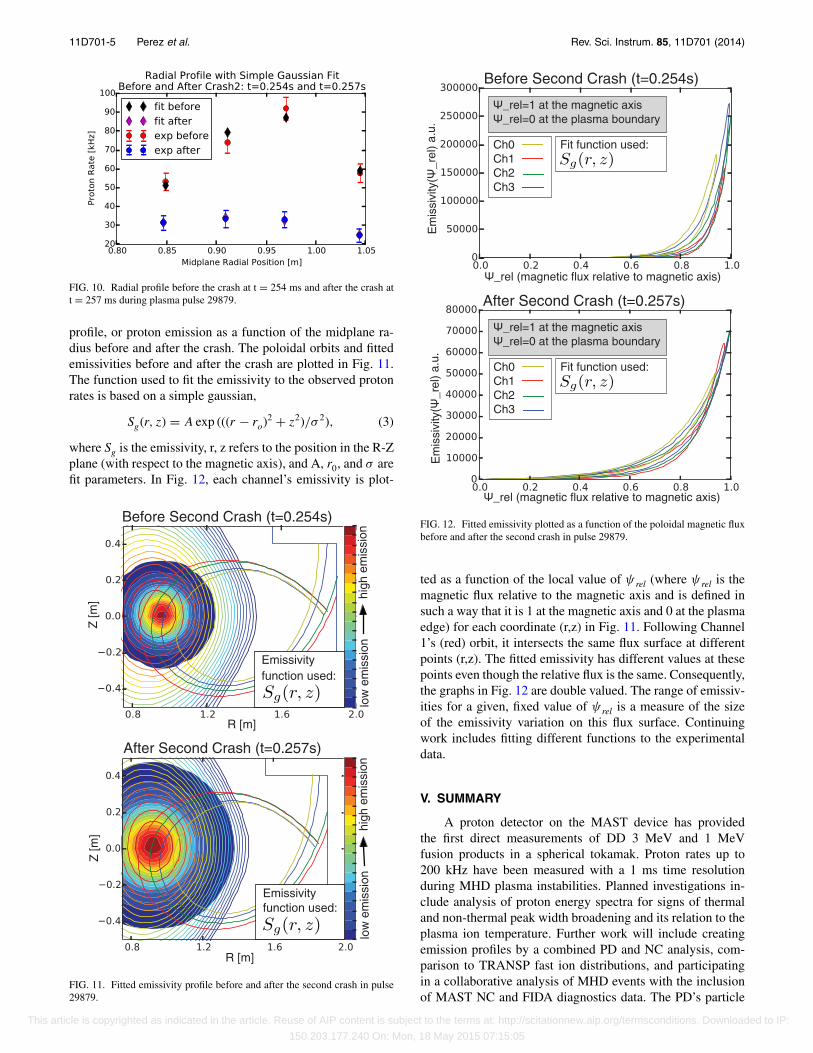
FIG. 10. Radial profile before the crash at t = 254 ms and after the crash att = 257 ms during plasma pulse 29879.
profile, or proton emission as a function of the midplane ra-dius before and after the crash. The poloidal orbits and fittedemissivities before and after the crash are plotted in Fig. 11.The function used to fit the emissivity to the observed protonrates is based on a simple gaussian,
Sg(r, z) = A exp (((r − ro)2 + z2)/σ 2), (3)
where Sg is the emissivity, r, z refers to the position in the R-Zplane (with respect to the magnetic axis), and A, r0, and σ arefit parameters. In Fig. 12, each channel’s emissivity is plot-
Before Second Crash (t=0.254s)
After Second Crash (t=0.257s)
low
em
issi
on
hi
gh e
mis
sion
Emissivity function used: Sg(r, z)
low
em
issi
on
hi
gh e
mis
sion
Emissivity function used:
Sg(r, z)
Z [m
]
R [m]
Z [m
]
R [m]
FIG. 11. Fitted emissivity profile before and after the second crash in pulse29879.
After Second Crash (t=0.257s)
Before Second Crash (t=0.254s)
Em
issi
vity
(_r
el)
a.u.
_rel=1 at the magnetic axis _rel=0 at the plasma boundary
Ch0Ch1 Ch2 Ch3
Fit function used: Sg(r, z)
Em
issi
vity
(_r
el)
a.u.
_rel=1 at the magnetic axis _rel=0 at the plasma boundary
Ch0Ch1 Ch2 Ch3
Fit function used: Sg(r, z)
FIG. 12. Fitted emissivity plotted as a function of the poloidal magnetic fluxbefore and after the second crash in pulse 29879.
ted as a function of the local value of ψ rel (where ψ rel is themagnetic flux relative to the magnetic axis and is defined insuch a way that it is 1 at the magnetic axis and 0 at the plasmaedge) for each coordinate (r,z) in Fig. 11. Following Channel1’s (red) orbit, it intersects the same flux surface at differentpoints (r,z). The fitted emissivity has different values at thesepoints even though the relative flux is the same. Consequently,the graphs in Fig. 12 are double valued. The range of emissiv-ities for a given, fixed value of ψ rel is a measure of the sizeof the emissivity variation on this flux surface. Continuingwork includes fitting different functions to the experimentaldata.
V. SUMMARY
A proton detector on the MAST device has providedthe first direct measurements of DD 3 MeV and 1 MeVfusion products in a spherical tokamak. Proton rates up to200 kHz have been measured with a 1 ms time resolutionduring MHD plasma instabilities. Planned investigations in-clude analysis of proton energy spectra for signs of thermaland non-thermal peak width broadening and its relation to theplasma ion temperature. Further work will include creatingemission profiles by a combined PD and NC analysis, com-parison to TRANSP fast ion distributions, and participatingin a collaborative analysis of MHD events with the inclusionof MAST NC and FIDA diagnostics data. The PD’s particle
This article is copyrighted as indicated in the article. Reuse of AIP content is subject to the terms at: http://scitationnew.aip.org/termsconditions. Downloaded to IP:
150.203.177.240 On: Mon, 18 May 2015 07:15:05
11D701-6 Perez et al. Rev. Sci. Instrum. 85, 11D701 (2014)
energy resolution and dominant signal dependence on beam-thermal fusion events can provide information on the fast iondistribution, heating profile, and confinement of beam ions.
To construct more detailed emissivities, this prototypesystem can be scaled up into a larger 16-channel system tocreate model-independent proton and triton emission profiles.A PD array has the potential to provide information similarand complementary to a collimated neutron camera system ina more compact instrument, which will make it possible toemploy a larger number of detector channels.
ACKNOWLEDGMENTS
This work was supported by: the (U.S.) Depart-ment of Energy (DOE) Contract Nos. DESC0001157 andDEAC0209CH11466 , the RCUK Energy Programme un-der Grant No. EP/I501045, the Swedish Research Council,the European Union’s (EU) Horizon 2020 programme under
Grant Agreement No. 210130335, the FIU Graduate & Pro-fessional Student Committee, and the FIU Ronald E. McNairPost-Baccalureate Achievement Program. We would like tothank Nigel Thomas-Davies for his expertise during the PDinstallation. The views and opinions expressed herein do notnecessarily reflect those of the European Commission.
1J. D. Strachan, Rev. Sci. Instrum. 57, 1771 (1986).2D. H. Lo, R. L. Boivin, and R. D. Petrasso, Rev. Sci. Instrum. 66, 345(1995).
3R. E. Chrien, R. Kaita, and J. D. Strachan, Nucl. Fusion 23, 1399 (1983).4W. W. Heidbrink and J. D. Strachan, Rev. Sci. Instrum. 56, 501 (1985).5H.-S. Bosch, Rev. Sci. Instrum. 61, 1699 (1990).6M. Cecconello et al., Nucl. Instrum. Methods Phys. Res. A 753, 72–83(2014).
7O. M. Jones et al., Plasma Phys. Control. Fusion 55, 085009 (2013).8M. Podestà et al., Rev. Sci. Instrum. 79, 10E521 (2008).9D. Liu et al., Rev. Sci. Instrum. 77, 10F113 (2006).
10W. U. Boeglin, R. Valenzuela Perez, and D. S. Darrow, Rev. Sci. Instrum.81, 10D301 (2010).
11L. L. Lao et al., Nucl. Fusion 30, 1035 (1990).
This article is copyrighted as indicated in the article. Reuse of AIP content is subject to the terms at: http://scitationnew.aip.org/termsconditions. Downloaded to IP:
150.203.177.240 On: Mon, 18 May 2015 07:15:05