investigating - national science teachers...
TRANSCRIPT

INVESTIGATING WEATHER AND CLIMATE • TEACHER’S GUIDE 2
This teacher’s guide supports teachers using the Investigating Weather and Climate e-book in their classrooms. It lays out
learning goals for each chapter, shares student misconceptions and
how to address them, and highlights where students explicitly practice
science and use crosscutting concepts to support their learning. It also
provides end of chapter investigations that connect readings and interactives in
the e-book with students’ world.
Teachers who follow the guide while addressing the specific needs of their classroom will be able to:
Overview
• engage students in grade-level appropriate,
three-dimensional learning;
• use the e-book as a tool in class-wide, small
group, or independent explorations of its
content;
• facilitate investigations that utilize the
e-book content and connect it with their own
classroom and community; and
• assess students on the NGSS Performance
Expectations to which this e-book is
aligned and additional Common Core State
Standards, in English language arts and
mathematics suggested throughout the
e-book.
Grade 3
Lexile® Measure: 820L
INVESTIGATING WEATHER AND CLIMATE • TEACHER’S GUIDE 5
OVERVIEW
This e-book does not use all of the grade-level elements for the practices and crosscutting concepts, but that does not mean that you should not be aware of the other practices and concepts your students need to know. For a full list of all the grade-level elements for the science and engineering practices and crosscutting concepts, refer to Appendix A.
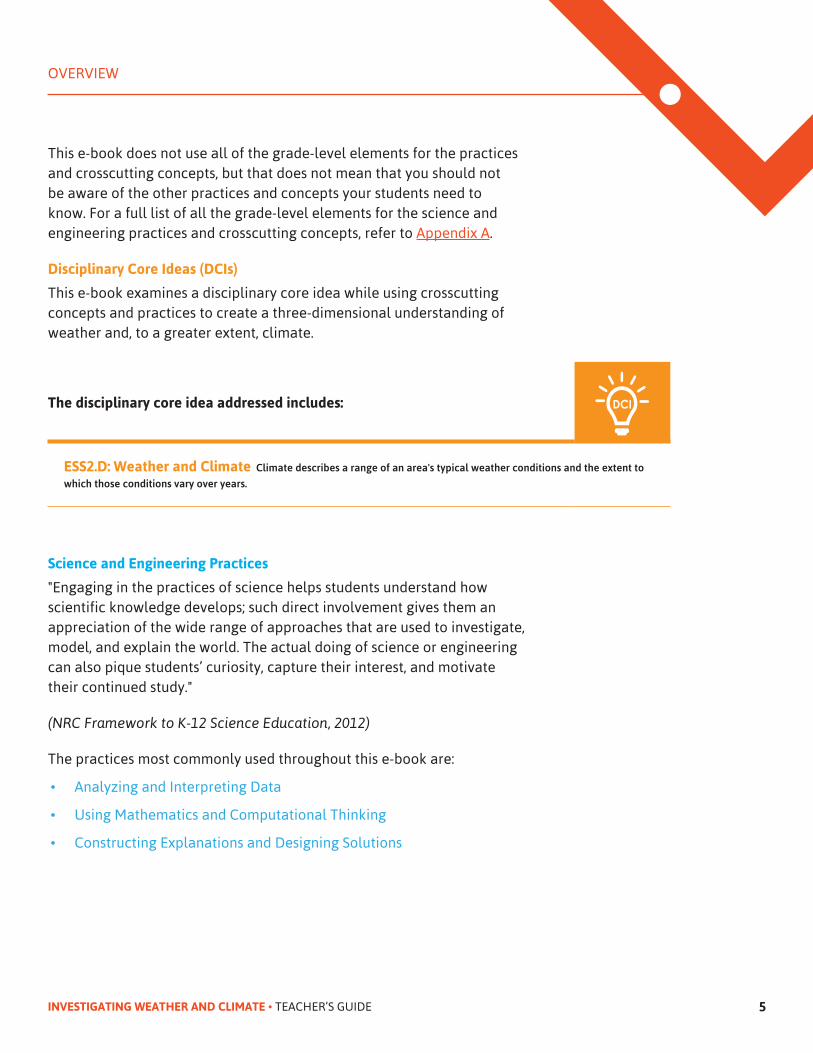
Disciplinary Core Ideas (DCIs)
This e-book examines a disciplinary core idea while using crosscutting concepts and practices to create a three-dimensional understanding of weather and, to a greater extent, climate.
The disciplinary core idea addressed includes:
ESS2.D: Weather and Climate Climate describes a range of an area's typical weather conditions and the extent to which those conditions vary over years.
Science and Engineering Practices
"Engaging in the practices of science helps students understand how scientific knowledge develops; such direct involvement gives them an appreciation of the wide range of approaches that are used to investigate, model, and explain the world. The actual doing of science or engineering can also pique students’ curiosity, capture their interest, and motivate their continued study."
(NRC Framework to K-12 Science Education, 2012)
The practices most commonly used throughout this e-book are:
• Analyzing and Interpreting Data
• Using Mathematics and Computational Thinking
• Constructing Explanations and Designing Solutions
INVESTIGATING WEATHER AND CLIMATE • TEACHER’S GUIDE 6
OVERVIEW
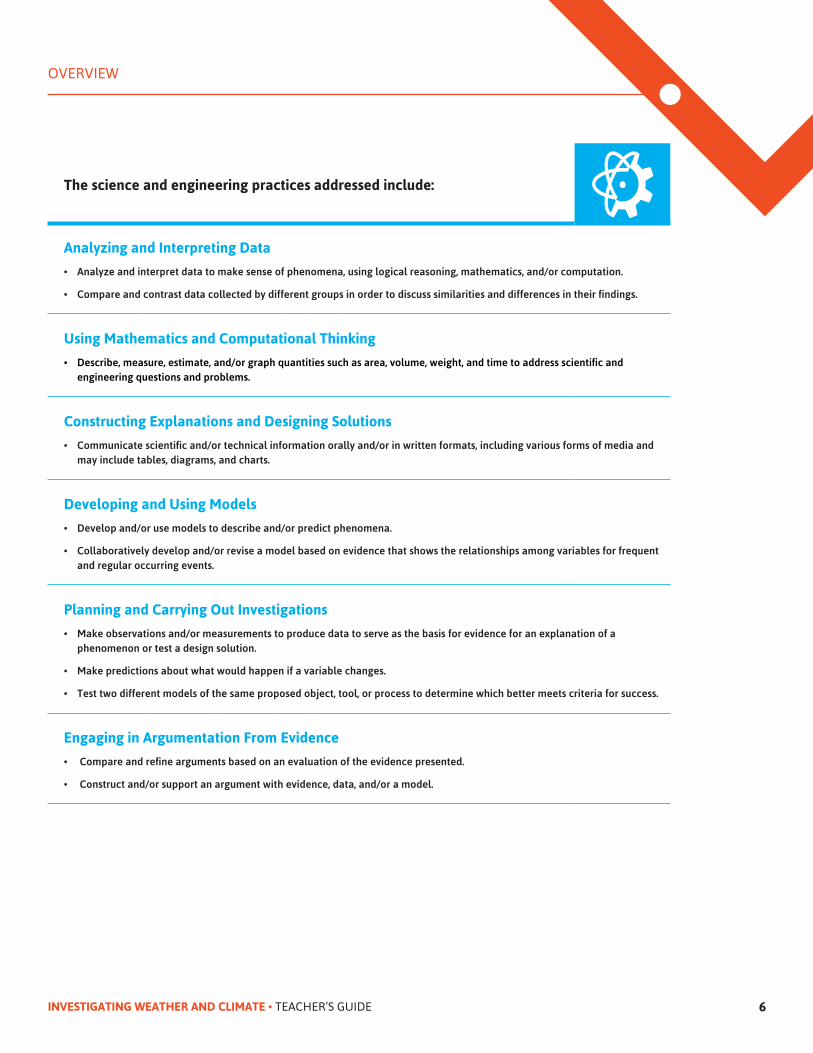
The science and engineering practices addressed include:
Analyzing and Interpreting Data
• Analyze and interpret data to make sense of phenomena, using logical reasoning, mathematics, and/or computation.
• Compare and contrast data collected by different groups in order to discuss similarities and differences in their findings.
Using Mathematics and Computational Thinking
• Describe, measure, estimate, and/or graph quantities such as area, volume, weight, and time to address scientific and engineering questions and problems.
Constructing Explanations and Designing Solutions
• Communicate scientific and/or technical information orally and/or in written formats, including various forms of media and may include tables, diagrams, and charts.
Developing and Using Models
• Develop and/or use models to describe and/or predict phenomena.
• Collaboratively develop and/or revise a model based on evidence that shows the relationships among variables for frequent and regular occurring events.
Planning and Carrying Out Investigations
• Make observations and/or measurements to produce data to serve as the basis for evidence for an explanation of a phenomenon or test a design solution.
• Make predictions about what would happen if a variable changes.
• Test two different models of the same proposed object, tool, or process to determine which better meets criteria for success.
Engaging in Argumentation From Evidence
• Compare and refine arguments based on an evaluation of the evidence presented.
• Construct and/or support an argument with evidence, data, and/or a model.

INVESTIGATING WEATHER AND CLIMATE • TEACHER’S GUIDE 20
Chapter 2
Searching for Patterns in Weather DataThis chapter introduces students to a variety of different kinds of grade-appropriate charts including bar graphs, line plots, and pictographs. Students will have the opportunity to explore each type of chart and become familiar with how each one illustrates different quantities of a measured weather condition. Students are then asked a series of questions where they identify and describe patterns of change over time.
By reading and exploring the interactives in this chapter, students will be able to:
• explain the relationship between the same weather data represented in a table and in a graph,
• interpret patterns in weather data represented in bar charts, pictographs, and line plots, and
• use charts to communicate the relationship between temperature and which kind of precipitation we experience on Earth’s surface.

INVESTIGATING WEATHER AND CLIMATE • TEACHER’S GUIDE 22
CHAPTER 2: Searching for Patterns in Weather Data
Page 7
This interactive demonstrates the relationship between data in a data table and data visualized in a graph. By tapping on one of the rows or bars in the graph, the highlighted area on both the table and the graph will change to reflect the connection between the two.
The colored bands in the backdrop of the bar graph give students a concrete connection between quantitative temperature data and qualitative descriptions we often use to express weather conditions.
Teachers can explicitly address the patterns crosscutting concept by asking questions where students draw connections between the tallest bar and the highest numbers in the data table or the shortest bar and the lowest numbers in the data table.
In the interactive in the previous chapter, students used words to describe the weather conditions outside the window. This interactive begins to illustrate an important difference between data that uses such descriptions and empirical data like those taken from
thermometers and other weather instruments.

INVESTIGATING WEATHER AND CLIMATE • TEACHER’S GUIDE 25
CHAPTER 2: Searching for Patterns in Weather Data
Page 11 & 12
This pair of pages provides students the opportunity to practice their pictograph analysis capabilities to determine which months have the most and least bright sunshine and then identify the pattern of rise and fall over the seasons and calendar year.
Half suns are presented in this data set to stretch student thinking about what a fraction of a picture might mean in a pictograph. This sort of understanding is beyond the expectation for third grade students so therefore there are no half-image pictographs in the summative assessment. Teachers may decide how deeply to discuss this feature depending on their students’ current understanding of fractions and/or graphs.
In 2015, the bright sunshine average for June strayed significantly from the pattern evident when looking at the other months. Teachers are encouraged to ask students to consider possibilities for why this might be. Student predictions may lead to gathering additional data from the Blue Hill website or other historical weather data warehouse website. This is also a good opportunity to reinforce how the term average does not mean that all days in June only experienced seven hours of sunlight.
Appendix B
INVESTIGATING WEATHER AND CLIMATE • TEACHER’S GUIDE 75
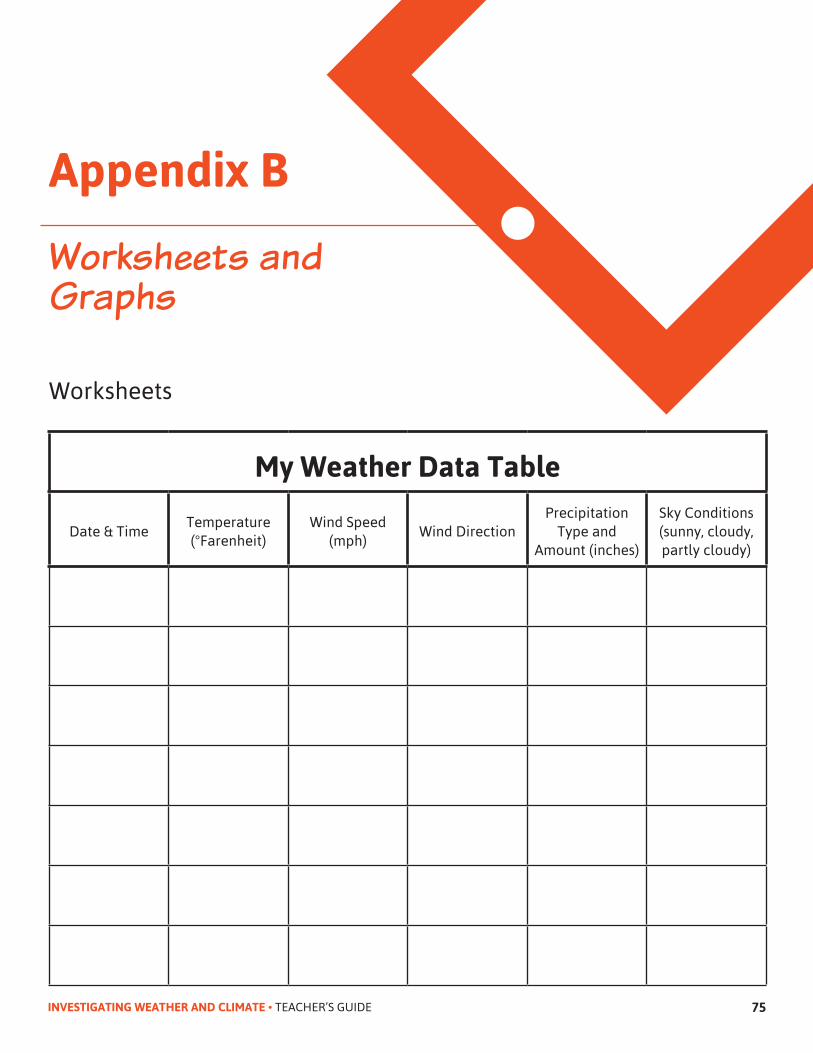
Worksheets and Graphs
Worksheets
My Weather Data Table
Date & TimeTemperature (°Farenheit)
Wind Speed (mph)
Wind DirectionPrecipitation
Type and Amount (inches)
Sky Conditions (sunny, cloudy, partly cloudy)