investigating solar o&m
TRANSCRIPT
Investigating the operations and maintenance strategy of solar photovoltaic plants in South
Africa
K Naicker
orcid.org 0000-0003-2345-6580
Mini-dissertation submitted in partial fulfilment of the requirements for the degree Master of Business
Administration at the North-West University
Supervisor: Mr TP Venter
Graduation May 2018
Student number: 28256980
i
ACKNOWLEDGEMENTS
The author would like to extend his appreciation and gratitude to the following
persons:
My supervisor, Mr Theo Venter for his wisdom, guidance and support.
My friend, Mr Kumaresan Cunden for his guidance and support.
My wife, Lolita and daughters Latika and Kriya for understanding and
supporting me.
My parents, family and friends for motivating me.
Sri Sri Nitai & Gauranga for giving me this opportunity.

ii
ABSTRACT
The REIPPPP (Renewable Energy Independent Power Producer Procurement
Program) was introduced in South Africa (SA) in August 2011. By the end of 2014
more than 1000 MW was allocated to solar photovoltaic (PV) plants (Milazi &
Bischof-Niemz, 2015). In Bid Windows 1, 2, 3 and 4, 45 solar PV projects were part
of South Africa’s REIPPPP (Department of Energy, 2014).
The engineering and construction of utility scale solar PV plants was led by foreign
companies since SA has never owned or operated a utility scale solar PV plant
previously. The amount of installed PV globally has increased tremendously since
2010. In September 2013 the first solar PV IPP (Independent Power Producer) was
synchronised onto the South African national electricity grid. Therefore, operation
and maintenance (O&M) of solar PV plants is a relatively new area for owners of PV
plants. Naturally, owners of solar PV plants will want to maximise energy yield of the
plant, and this is only possible by having a skilled maintenance team which follow a
maintenance strategy. Solar PV plants are not maintenance free, resulting in fulltime
staff performing corrective and preventative maintenance in utility scale PV plants. In
this research study a review of current practices of solar O&M world-wide and in SA
is discussed.
Recommendations are provided to owners and O&M managers of solar PV plants on
issues such as staffing requirements based on DC (Direct Current) capacity, module
cleaning strategies and O&M contracts. The research findings indicated that on
average 1% of total modules installed are kept as replacement parts and two central
inverters are kept as spare parts. Cracked glass, snail tracks and hot spots were the
three most common PV module faults. The most common faults in the PV plant were
related to communication networks and inverters.
Key words: Common Faults, Equipment Warranties, Eskom, Independent Power
Producers, Inverters, Maintenance Strategies, Monitoring, Operations, Performance
Indicators, Photovoltaic Modules, Solar, South Africa, Utility Scale
iii
TABLE OF CONTENTS
ACKNOWLEDGEMENTS ............................................................................................. i
ABSTRACT ................................................................................................................. ii
TABLE OF CONTENTS ............................................................................................. iii
LIST OF FIGURES ..................................................................................................... vi
LIST OF TABLES ..................................................................................................... viii
LIST OF ACRONYMS ................................................................................................ ix
CHAPTER 1: NATURE AND SCOPE OF THE STUDY.............................................. 1
1.1 Introduction ..................................................................................................... 1
1.2 Problem statement ......................................................................................... 4
1.3 Objectives of the study ................................................................................... 5
1.3.1 Primary objective .................................................................................... 5
1.3.2 Secondary objective ................................................................................ 5
1.4 Scope of the study .......................................................................................... 5
1.5 Research methodology ................................................................................... 7
1.5.1 Literature/theoretical study ...................................................................... 7
1.5.2 Empirical study ........................................................................................ 7
1.6 Limitation of the study ..................................................................................... 7
1.7 Layout of the study ......................................................................................... 7
CHAPTER 2: LITERATURE REVIEW ........................................................................ 8
2.1 Introduction ..................................................................................................... 8
2.2 Operation and maintenance strategies ........................................................... 9
2.2.1 Infra-red thermography ......................................................................... 12
2.2.2 Tracker maintenance ............................................................................ 13
2.2.3 Spares .................................................................................................. 15
2.2.4 Module cleaning .................................................................................... 15
2.3 South Africa’s REIPPPP ............................................................................... 18
2.4 O&M budgeting ............................................................................................ 19
2.5 O&M contracts .............................................................................................. 20
2.6 Staffing ......................................................................................................... 24
2.7 Equipment warranties ................................................................................... 25
2.7.1 Solar modules ....................................................................................... 25

iv
2.7.2 Inverters ................................................................................................ 31
2.8 Insurance ...................................................................................................... 33
2.9 Levelised cost of electricity ........................................................................... 34
2.10 Monitoring of solar plants ............................................................................. 35
2.11 String level monitoring .................................................................................. 36
2.12 Inverter monitoring........................................................................................ 36
2.13 Layout of solar PV plant ............................................................................... 37
2.14 Performance Indicators ................................................................................ 38
2.15 Safety at PV plants ....................................................................................... 39
2.16 Training and documentation ......................................................................... 40
2.17 Summary ...................................................................................................... 41
CHAPTER 3: EMPIRICAL STUDY ........................................................................... 43
3.1 Introduction ................................................................................................... 43
3.2 Gathering of data .......................................................................................... 43
3.3 Results and discussion ................................................................................. 44
3.3.1 Manpower requirements at solar PV plants .......................................... 44
3.3.2 Common faults at utility scale PV plants ............................................... 45
3.3.3 Panel washing, vegetation management and pyranometer cleaning .... 51
3.3.4 Staff working hours ............................................................................... 54
3.3.5 Other O&M practices ............................................................................ 55
3.4 Summary ...................................................................................................... 59
CHAPTER 4: CONCLUSIONS AND RECOMMENDATIONS ................................... 61
4.1 Conclusion and recommendations ............................................................... 61
4.2 Achievement of the objectives of the study .................................................. 64
4.3 Recommendations of future research........................................................... 64
REFERENCES ......................................................................................................... 65
APPENDIX 1 - Detail Maintenance Plan per Component ......................................... 72
APPENDIX 2 – PV Module Cleaning Methods ......................................................... 83
APPENDIX 3 - Skills Matrix for O&M Staff ................................................................ 85
APPENDIX 4 – SCADA System ............................................................................... 87
APPENDIX 5 – Switchgear room .............................................................................. 88
APPENDIX 6 - Hazards in a PV Plant ...................................................................... 89
APPENDIX 7 – SOLAR O&M Questionnaire ............................................................ 91
APPENDIX 8 – Consent Cover Letter ...................................................................... 96
v
APPENDIX 9 – Ethical Clearance ............................................................................ 97

vi
LIST OF FIGURES
Figure 1-1: Eskom's aging power stations .................................................................. 3
Figure 1-2: Annual PV Installation from 2005 to 2016 (GWp) ..................................... 4
Figure 1-3: Location of solar PV plants in South Africa .............................................. 6
Figure 1-4: Solar radiation in SA ................................................................................. 6
Figure 2-1: Relative frequency of failure of PV components ..................................... 11
Figure 2-2: O&M responsibilities ............................................................................... 12
Figure 2-3: IR Thermography ................................................................................... 13
Figure 2-4: Tracker vs Fixed ..................................................................................... 14
Figure 2-5: Horizontal single axis tracker.................................................................. 14
Figure 2-6: Tractor with module cleaning attachments ............................................. 16
Figure 2-7: Reference cells....................................................................................... 18
Figure 2-8: Utility scale solar PV bid prices from around the world ........................... 19
Figure 2-9: Life cycle maintenance costs (% of total) ............................................... 22
Figure 2-10: Average breakdown costs for a solar PV project – ground mounted .... 27
Figure 2-11: Tier system ........................................................................................... 28
Figure 2-12: Bypass diode failure ............................................................................. 30
Figure 2-13: Burnt connector .................................................................................... 30
Figure 2-14: Failures in PV strings ........................................................................... 31
Figure 2-15: Failures in SunEdison operated and maintained PV plants (2008 to
2010) ................................................................................................................. 32
Figure 2-16: Affected inverter component ................................................................ 33
Figure 2-17: Causes of insurance claims – Germany 2003 to 2008 ......................... 34
Figure 2-18: Array blocks.......................................................................................... 38
Figure 3-1: DC Capacities of solar PV plants surveyed ............................................ 44
Figure 3-2: PV plant common faults ......................................................................... 46
Figure 3-3: PV module defects ................................................................................. 47
Figure 3-4: Percentage of total modules installed kept as spares ............................ 48
Figure 3-5: Snail tracks ............................................................................................. 49
Figure 3-6: Inverter faults.......................................................................................... 50
Figure 3-7: Number of spare inverters ...................................................................... 50
Figure 3-8: Panel cleaning frequency ....................................................................... 51

vii
Figure 3-9: Module cleaning method ........................................................................ 52
Figure 3-10: Source of water .................................................................................... 52
Figure 3-11: Pyranometer cleaning frequency .......................................................... 53
Figure 3-12: Vegetation control – frequency ............................................................. 54
Figure 3-13: Terrain in the Northern Cape ................................................................ 54
Figure 3-14: Daily working hours .............................................................................. 55
Figure 3-15: O&M costs per year – percentage of total EPC cost ............................ 56
Figure 3-16: Historical and forecasted utility PV system pricing ............................... 56
Figure 3-17: Annual performance ratio ..................................................................... 57
Figure 3-18: Percentage insurance annual cost of total O&M costs ......................... 58
Figure 3-19: Highest level of monitoring employed ................................................... 59

viii
LIST OF TABLES
Table 2-1: Frequency of Preventative Maintenance Inspections .............................. 10
Table 2-2: List of spares ........................................................................................... 15
Table 2-3: Average price in South African rand per PPA – Bid windows 1 to 4 ........ 20
Table 2-4: Utility-scale solar PV plant O&M estimates ............................................. 23
Table 2-5: Technical controller skills ......................................................................... 24
Table 2-6: Module product and performance warranty ............................................. 26
Table 2-7: Failure and degradation modes of crystalline-silicon PV modules ........... 29
Table 2-8: LCOE's for EMEA .................................................................................... 35
Table 2-9: Inverter monitoring - live parameters ....................................................... 37
Table 2-10: Levels of monitoring .............................................................................. 37
Table 2-11: Degradation rate of modules ................................................................. 39
Table 3-1: Number of operational solar PV plants .................................................... 43
Table 3-2: Personnel requirements at solar PV plants ............................................. 45
Table 4-1: Recommended number of staff per PV site ............................................. 61

ix
LIST OF ACRONYMS
AC Alternating current
a-Si Amorphous silicon
BW Bid Window
CBM Condition-Based Monitoring
CCGT Combined Cycle Gas Turbine
CCTV Closed-circuit television
CdTe Cadmium telluride
CO2 Carbon dioxide
COP Conference of the parties
CSP Concentrated Solar Power
DC Direct Current
EL Earth Leakage
EMEA Europe, Middle East and Asia
EPC Engineering, Procurement and Construction
GCC Government Certificate of Competency
GMR General Machinery Regulations
GPS Global Positioning System
GWp Gigawatt peak
HMI Human Machine Interface
HV High Voltage
IGBT Insulated-Gate Bipolar Transistor
IPP Independent Power Producer
IR Infra-Red
Isc Short circuit current of the PV module
JB’s Junction Boxes
kWh Kilowatt hour
LCOE Levelised Cost of Electricity
LV Low Voltage
Mt Millions of tons
MV Medium Voltage
MW Megawatt

x
MWp Megawatt peak
NERSA National Energy Regulator of South Africa
OHAS Act Occupational Health and Safety Act
O&M Operations and Maintenance
OEM Original Equipment Manufacturer
PLC Programmable Logic Controllers
PR Performance Ratio
PM Preventative Maintenance
PPA Power Purchase Agreement
PV Photovoltaic
R Rands
REIPPPP Renewable Energy Independent Power Producer Procurement
Program
SA South Africa
STC Standard Test Conditions
SCADA Supervisory, Control and Data Acquisition
sms short message service
US United States
Voc Open circuit voltage of the PV module

1
CHAPTER 1: NATURE AND SCOPE OF THE STUDY
1.1 Introduction
In January 2008 the power utility, Eskom, had to implement load shedding in order to
prevent a national blackout. Eskom, which provides at least 95% of South Africa’s
electricity, could not meet energy demand at that time. Load shedding affected the
economic growth of the country and revealed that South Africa was facing an energy
crisis. In order for South Africans to have a sustainable energy source and to address
supply security, the South African government introduced the REIPPPP in August
2011. By the end of 2014 more than 1000 MW was allocated to solar PV plants
(Milazi & Bischof-Niemz, 2015). All successful Independent Power Producer (IPPs)
who had signed power purchase agreements (PPAs) with Eskom were contracted to
feed energy into the grid for twenty years. Ninety IPP’s had been added to the South
African grid by October 2015 (ESI Africa, 2015).
Solar PV plants are designed to operate for a minimum of 25 years. A basic
representation of the levelised cost of electricity (LCOE) for a power plant is shown
below (Cambell, 2008):
(1.1)
The total life time energy production is the estimated amount of energy in kilowatt
hours (kWh) expected over 25 years. The total life cycle cost comprises the capital
cost and the total cost of operations, maintenance and insurance for the 25 year
period. In order for solar PV plant to be sustainable in terms of profits, the revenue
from energy sales (R/kWh) is required to be higher than the LCOE value. The unit for
LCOE is (R/kWh) as shown in Equation 1.1. Although the capital cost of a solar PV
plant is high, it’s O&M cost is relatively low compared to traditional forms of power
generation. However, in order for a solar PV plant to be financially viable for its
lifetime, it is vital to keep O&M costs to a minimum. Therefore, the development and
implementation of an O&M strategy is a key factor in the success of a solar PV plant.
The O&M of solar PV plants is relatively new in SA and therefore many contractors

2
from all over the world are providing these services for solar PV plants in SA. This is
a new skill that requires to be learnt, since the construction and operation of
renewable power plants is a new market in SA. Solar PV plants are here to stay
since the costs of modules are decreasing annually and manufacturers are
performing research in order to increase efficiencies of the PV modules. The global
community wants environmentally friendly solutions for power generation, so that we
do not destroy the world for future generations. The game changer in the energy
sector will be battery storage. If energy can be stored and dispatched economically
then base load stations, such as coal fired or nuclear power stations, will not be as
necessary and common, as they are now in SA. Furthermore, end users of electricity
in the residential sector may not require grid connection if battery technology
advances drastically and becomes cheaper.
Eskom has an aging fleet of power stations as shown in Figure 1-1. Most of Eskom’s
coal-fired power stations are planned to be decommissioned by the year 2030 since
by then they have would have been in operation for longer than 40 years
(Independent Entrepreneurship Group, 2015) (Figure 1-1). By 2030 Kendal
4116MW, Matimba 3990MW, Lethabo 3708MW, Tutuka 3654MW, Dhuva 3600MW,
Matla 3600MW, Kriel 3000MW, Arnot 2352 MW, Grootvlei 1200MW, Camden
1510MW and Hendrina Power Station 2000MW would have been in operation for at
least 40 years. The operational costs of these aging power stations will rise and
become uneconomical to run. Therefore South Africa will need to construct new
power stations in the future in order to meet demand.

3
Figure 1-1: Eskom's aging power stations
Source: Independent Entrepreneurship Group (2015)
According to the Conference of the Parties (COP) 22 South Africa will not be allowed
to increase emissions after 2025 (Eskom, 2016). By 2050 Eskom will not be able to
emit more than 90 Mt to 190 Mt of carbon dioxide (CO2) annually. Eskom currently
emits 518 Mt of CO2 (Eskom, 2016). Therefore, Eskom has to build emission free
power plants such as hydro, nuclear and renewables, in order to meet the demand
after 2025. Currently the intermittency of renewable power (solar and wind) and the
high cost of battery storage limits the amount of renewable power allowed onto the
South African grid. The capacity factors of renewable plants (solar and wind) are low
compared to fossil fuel and nuclear power stations. The capacity factor for Koeberg
Nuclear Power Station is 83.1% (Madhlopa et al., 2013). The average capacity factor
of renewable plants in SA is 25% for solar PV and 31% for wind (National Energy
Regulator of South Africa [NERSA], 2016). Nonetheless generation capacity of the
future electrical grids will be met by a combination of nuclear and renewable energy
technologies.

4
1.2 Problem statement
The amount of installed PV globally has increased tremendously since 2010 as
shown in Figure 1-2. In September 2013 the first solar PV IPP was synchronised
onto the South African national electricity grid. Therefore O&M of solar PV plants is a
relatively new area for owners of PV plants. Owners of PV plants are challenged with
the following:
What are the best strategies for O&M?
What spares are required to keep availability of the plant above 98%?
When will the inverters start to fail?
What skills are required?
What are the staffing requirements for a typical utility scale solar PV plant?
What preventative maintenance needs to be performed and how often in a
utility scale solar PV plant?
Figure 1-2: Annual PV Installation from 2005 to 2016 (GWp)
Source: European Commission (2016)
Solar PV plants in Sub-Saharan Africa are financed partly by debt and partly by
investors. The debt to equity ratio is typically 70:30 (Norton Rose Fullbright, 2015). In
order to increase profits, operational costs have to be kept at a minimum without
5
sacrificing the health of the plant. Like any other industry, key success factors are
required to be known in order for the owner to maximise profits and ensure that the
plant has a high availability throughout its lifetime.
1.3 Objectives of the study
The following section of the dissertation outlines in brief the key objectives that were
identified for the analysis of the study. The objectives were derived from the
challenges mentioned in Section 1.2.
1.3.1 Primary objective
The primary objective of this study was to investigate the O&M challenges which
need to be understood in order to develop and implement a successful O&M strategy
for solar PV plants. This study will benefit owners and O&M managers of solar PV
plants. It will also increase the knowledge base of technical personnel involved in the
operations and maintenance of solar PV plants. The intention of the study is to
ascertain the maintenance activities and knowledge required to operate and maintain
a utility scale solar PV plant in SA.
1.3.2 Secondary objective
The secondary objective of this study is to establish what the current best practices
are for solar PV O&M worldwide. The amount of solar PV installed worldwide has
increased more than 10 times in the last 10 years (Jager-Waldau, 2016). Prior to the
boom in solar PV installations globally, O&M for PV plants was typically a monthly
visit to check if everything is in order and to perform vegetation control. Presently,
due to the ‘internet of things’, solar PV plants are monitored offsite and fulltime staff
perform O&M in order to increase the viability of the plant. The world is no longer
concerned about whether solar PV works, that is now accepted. Now it is about
PPAs and increasing energy yield of the plant through an effective O&M plan.
1.4 Scope of the study
The scope of this study is to determine the O&M strategies of solar PV IPPs
operating in SA. The location of solar PV IPPs in SA is shown in Figure 1-3. As can
be seen from the figure, the majority of solar PV IPPs are located in the Northern

6
Cape. The Northern Cape has the highest level of solar irradiation in SA as shown in
Figure 1-4. Irradiation is a measure of the sun’s power per a unit area. Therefore, the
Northern Cape is well suited for the generation of electricity using solar modules.
Figure 1-3: Location of solar PV plants in South Africa
Source: PV Insider (2016a)
Figure 1-4: Solar radiation in SA
Source: Quinton Green Freak (2012)

7
1.5 Research methodology
The research methodology consisted of a literature review of current O&M practices
in utility scale solar PV plants in the world and the analysis of questionnaires
completed by O&M managers of solar PV plants operating in SA.
1.5.1 Literature/theoretical study
Information pertaining to the O&M of solar PV plants was obtained from the internet,
journal articles, magazines, presentations and manuals.
1.5.2 Empirical study
The empirical study is on the O&M strategies of utility scale solar PV plants. Chapter
3 includes the statistical analysis of questionnaires obtained from PV O&M
managers.
1.6 Limitation of the study
This study is limited to the O&M plans and practices of utility scale Solar PV plants in
SA. Only activities performed by maintenance staff and equipment requiring
maintenance located in utility scale Solar PV plants have been researched. The
questionnaires were sent to solar PV plants that were in operation for five years or
less.
1.7 Layout of the study
Chapter 1 Introduces the subject of solar PV IPPs in SA.
Chapter 2 Presents a literature review of current practices of operations and
maintenance in solar PV plants.
Chapter 3 Presents and discusses the results of the empirical study.
Chapter 4 Presents the conclusion and recommendations.

8
CHAPTER 2: LITERATURE REVIEW
2.1 Introduction
This chapter includes a discussion of current O&M practices globally for solar PV
plants. The failures experienced with modules and inverters are also reviewed. South
Africa’s REIPPPP is discussed to show how IPP’s came into existence. Staffing,
manufacturer’s warranties, budgeting and contractors are also explained.
The main components in a PV plant are the solar modules and inverters. In a solar
PV plant modules are connected in series to form a string. These strings are paralled
in combiner boxes. The combiner boxes are then connected to the input (DC side) of
the inverter. The AC side of the inverter is then connected to a step up transformer. A
photovoltaic cell is an electrical device that employs a photovoltaic effect and
converts the light energy directly into electricity (Ameta & Ameta, 2016). A PV panel
or module comprises a number of individual photovoltaic cells sandwiched between
layers of glass and packaged together with a plastic or metal backing and edging. A
PV array (also called a solar array) consists of multiple PV modules that are strung
together. The modules in a PV array are first connected in series (like a chain) to
obtain the desired voltage. The individual strings are then connected in parallel to
generate more current, if required.
There are three types of PV panels: monocrystalline, polycrystalline and amorphous
thin film (Solar Choice, 2009). Monocrystalline are the most expensive type of PV
panel, but they are also the most efficient (15-20%). Polycrystalline are less
expensive but are slightly less efficient (13-16%). Therefore, more polycrystalline PV
panels are required for the same wattage compared to the monocrystalline type.
Amorphous thin-film is the least expensive and the least efficient (6-8%), requiring
approximately double the number of panels compared to the polycrystalline type
(Maehlum, 2015).
PV inverters convert the DC voltage and current generated in the PV panels into
alternating current (AC) voltage and current. PV modules for utility scale applications
are either ground mounted, fixed tilted, or tracking. For the fixed tilt application, the

9
PV modules are arranged to face north in the southern hemisphere. When tracking
technology is used the PV modules follow/track the sun from the east to west or
east/west and north/south simultaneously in the case of dual axis tracking. The
east/west tracking application produces the most annual energy yield compared to
any other single axis application or fixed tilt application.
2.2 Operation and maintenance strategies
Solar PV plants have low maintenance requirements compared to other technologies
employed to generate power such as coal fired and nuclear power stations (Miller &
Lumby, 2012). The O&M of solar PV plants must be considered during the design of
the PV plant. Low or no maintenance options, office space for the required number of
staff, size of warehouse for spares, water requirements, control room size, level of
monitoring, etc. can be decided during the design, with O&M in mind. Preventative
maintenance is required for the following reasons:
1. To maximise energy yield of the plant.
2. To extend lifetime of the plant.
3. To maintain warranties of components.
Preventative maintenance lowers the risk of unplanned/corrective maintenance.
Preventative maintenance is scheduled maintenance and must be done according to
manufacturer’s recommendations. Corrective maintenance limits the downtime of the
plant in the case of faults or equipment failure. Condition based monitoring is where
the plant is monitored using a supervisory, control and data acquisition (SCADA)
system to detect possible failures and low performance. Maintenance is then planned
accordingly.
Every utility scale solar PV installation must have a maintenance schedule as shown
in Table 2-1 below, which is the maintenance schedule of a typical unstaffed PV
plant. Unstaffed PV plants are usually less than 5 MW in capacity. It is recommended
that every utility scale installation must have a task manual that describes the
procedures for maintenance and operating activities and a strategy document that
details the schedule of maintenance and the modes of failure, for the various
equipment installed. Appendix 1 shows a detailed maintenance plan per component
for a utility scale PV plant.
10
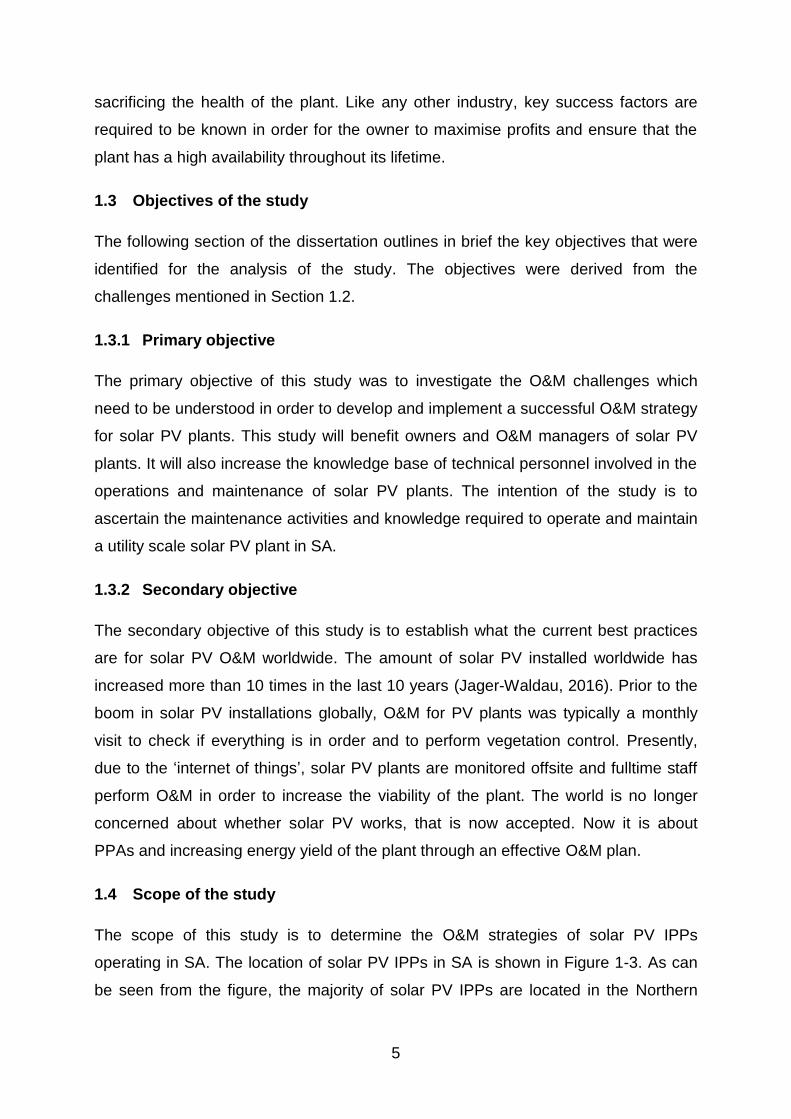
Table 2-1: Frequency of Preventative Maintenance Inspections
Apparatus Activity Frequency
Inverter Inspection and cleaning
Electrical connection checks
Functional checks
Dust filters of inverters located in polluted environments
6 months
1 month
PV Modules Inspection
Verifications of connections
Electrical verification, Voc and Isc
Cleaning
1 month
6 months
12 months
Twice in winter
Electrical JB’s Mechanical inspection, door level/catch mechanism
Corrosion, labelling, electrical connections, earthing
6 months
Structures Inspection 6 months
Pyranometers/Reference cells Cleaning Weekly
SCADA System Remote monitoring, Status of plant & sensors Daily
Pyranometer silica-gel desiccant Replace when desiccant changes colour to clear. Inspect weekly
Weekly
Auxiliary Supply Inspection and electrical connection checks 6 months
Control room Containers and Prefabs Inspection and cleaning 6 months
Weather station Verification of connection 1 month
Transformers Inspection 12 months
Trackers Functioning Weekly
Source: Naicker (2015)
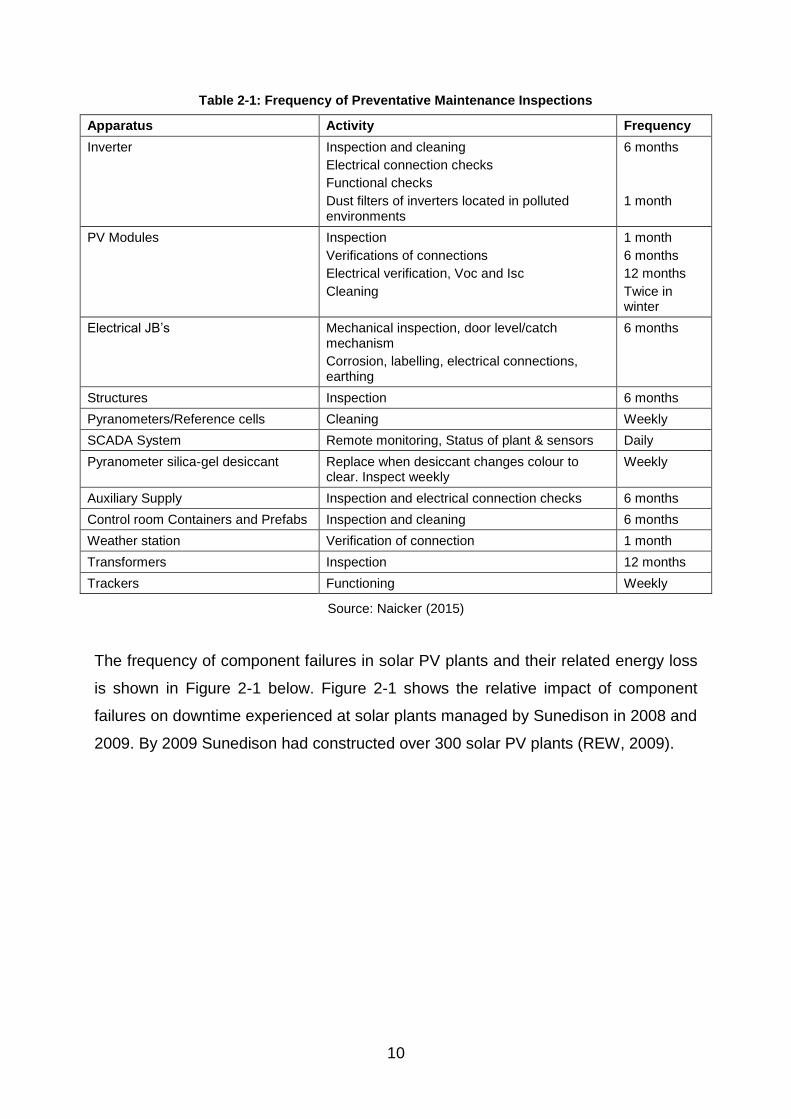
The frequency of component failures in solar PV plants and their related energy loss
is shown in Figure 2-1 below. Figure 2-1 shows the relative impact of component
failures on downtime experienced at solar plants managed by Sunedison in 2008 and
2009. By 2009 Sunedison had constructed over 300 solar PV plants (REW, 2009).
11
Figure 2-1: Relative frequency of failure of PV components
Source: Enbar & Key (2010)
The O&M function at a utility scale solar PV plant must achieve the following goals:
1. Monitor the plant to ensure maximum generation.
2. Ensure that safety regulations are adhered to.
3. Record all preventative and corrective maintenance done.
4. Record and store plant data.
5. Maintenance is performed according to manufacturer’s recommendations.
6. Assist the owner with warranty claims.
7. Keep a list of critical spares and maintain the level of stock.
8. Maintain the security system and the grounds.
9. Reduce the risk of the plant being unavailable.
According to Williams (2010), solar PV maintenance is more about analysis of data,
possible failure of plant components and management of contracts. In order to
ensure that the plant is operational it is vital for the solar PV plant to be monitored
daily. Figure 2-2 illustrates the difference between maintenance and operational
activities and all the activities required to be performed by the O&M department of a
utility scale solar PV plant. The O&M department is expected to perform asset
management as well.

12
Figure 2-2: O&M responsibilities
Source: Solar Power Europe (2016)
2.2.1 Infra-red thermography
In order to locate defective panels and hot spots quickly in large solar plants, a
thermal imaging camera mounted on a drone can be used. A cracked panel is hotter
than the other surrounding undamaged panels. The cracked panel can be seen
easily using an infra-red (IR) camera as shown in Figure 2-3. With an IR camera,
large areas can be scanned quickly. Handheld IR cameras are also employed in
solar PV plants. However, using handheld IR cameras is labour intensive and time
consuming. Therefore, in a typical utility scale PV plant, only a portion of modules is
inspected each year. Using an IR camera to locate defective panels takes
significantly less time than using an IV curve tracer. An IV curve tracer measures the
current and voltage of a PV module from the short circuit condition to the open circuit
condition. The corresponding graph obtained from an IV test is used to determine if
there are any defects in the module. The IR camera picks up hot spots caused by
damaged bypass diodes, cracked cells and failed solder joints (Brearley, 2016).

13
Failures of modules almost always release heat, since defective modules that are not
converting the rated percentage of irradiance into electricity will invariably get hotter
than modules that are converting the rated percentage of irradiance into electricity.
Once the IR camera has identified a defective panel, the IV curve tracer can be used
to analyse the degradation of the module. According to Rob Andrews from
Heliolytics, assessment for a 10 MW PV plant can be completed in 20 minutes using
aerial thermal imagery (Brearley, 2016).
Figure 2-3: IR Thermography
Source: Multirotor (2017)
2.2.2 Tracker maintenance
Solar PV tracker systems require periodic maintenance. Tracker systems may
consist of components such as motors, hydraulic systems, actuators, PLCs, control
systems, inclinometers, relays and global positioning system (GPS) devices. Moving
parts will have to be greased and the operation of the trackers must be checked
daily. A single axis tracker fixed facing the East direction will provide significantly less
energy yield than a fixed system facing North in SA. Therefore, all trackers must be
operational to maximise energy yield.
14
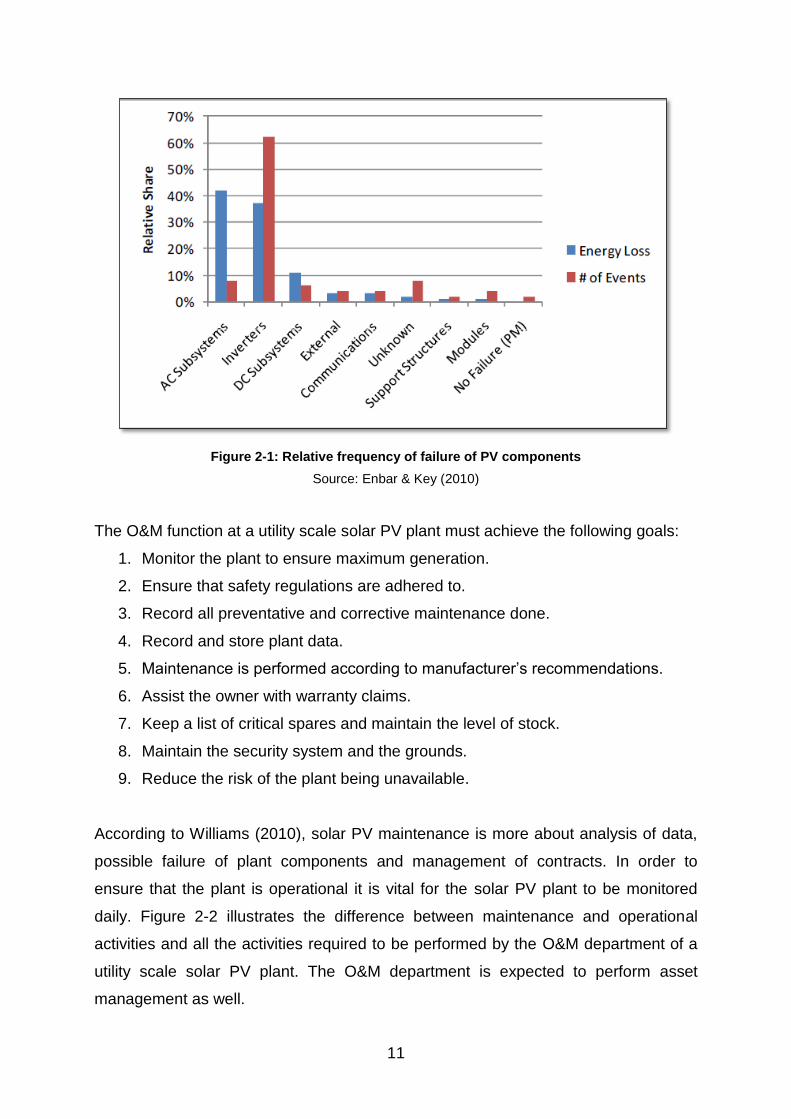
Figure 2-4: Tracker vs Fixed
Source: Missouri Wind and Solar (2017)
Figure 2-4 above shows the additional energy harnessed from a tracker system
compared to a fixed system. This additional energy is prevalent only when the sun is
high in the sky from spring to summer to autumn. Trackers must be checked to see if
they are colliding with the fixed part of the structure or the junction box. Some
components may require calibration. Tracker systems may be single axis or dual
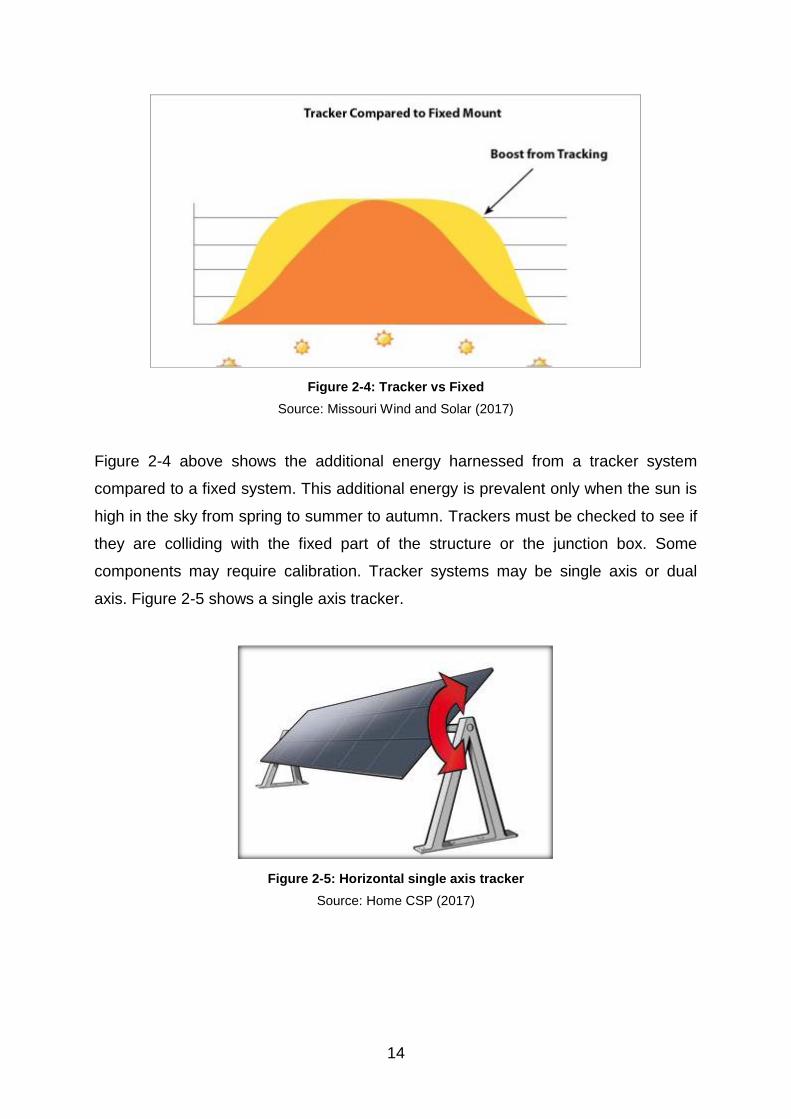
axis. Figure 2-5 shows a single axis tracker.
Figure 2-5: Horizontal single axis tracker
Source: Home CSP (2017)
15
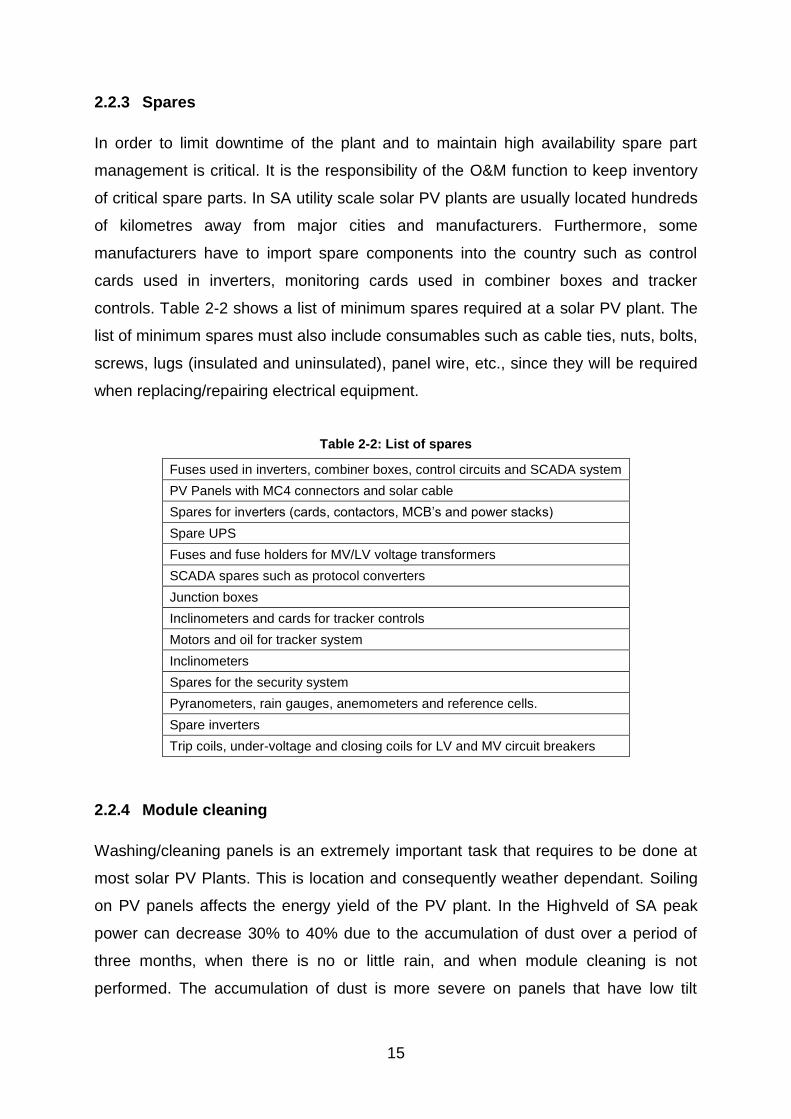
2.2.3 Spares
In order to limit downtime of the plant and to maintain high availability spare part
management is critical. It is the responsibility of the O&M function to keep inventory
of critical spare parts. In SA utility scale solar PV plants are usually located hundreds
of kilometres away from major cities and manufacturers. Furthermore, some
manufacturers have to import spare components into the country such as control
cards used in inverters, monitoring cards used in combiner boxes and tracker
controls. Table 2-2 shows a list of minimum spares required at a solar PV plant. The
list of minimum spares must also include consumables such as cable ties, nuts, bolts,
screws, lugs (insulated and uninsulated), panel wire, etc., since they will be required
when replacing/repairing electrical equipment.
Table 2-2: List of spares
Fuses used in inverters, combiner boxes, control circuits and SCADA system
PV Panels with MC4 connectors and solar cable
Spares for inverters (cards, contactors, MCB’s and power stacks)
Spare UPS
Fuses and fuse holders for MV/LV voltage transformers
SCADA spares such as protocol converters
Junction boxes
Inclinometers and cards for tracker controls
Motors and oil for tracker system
Inclinometers
Spares for the security system
Pyranometers, rain gauges, anemometers and reference cells.
Spare inverters
Trip coils, under-voltage and closing coils for LV and MV circuit breakers
2.2.4 Module cleaning
Washing/cleaning panels is an extremely important task that requires to be done at
most solar PV Plants. This is location and consequently weather dependant. Soiling
on PV panels affects the energy yield of the PV plant. In the Highveld of SA peak
power can decrease 30% to 40% due to the accumulation of dust over a period of
three months, when there is no or little rain, and when module cleaning is not
performed. The accumulation of dust is more severe on panels that have low tilt
16
angles. The degree of soiling depends on environmental conditions such as dusty
conditions, mining activities and agricultural activities, dew, etc. Soiling is now a
crucial part of research for owners and operators to increase performance in solar PV
plants (Rochas, 2016). Furthermore, there is a growing concern amongst PV plant
owners/operators that if soiling is allowed to accumulate it may damage the panel by
causing shading which could lead to hotspots, or the chemical composition of the
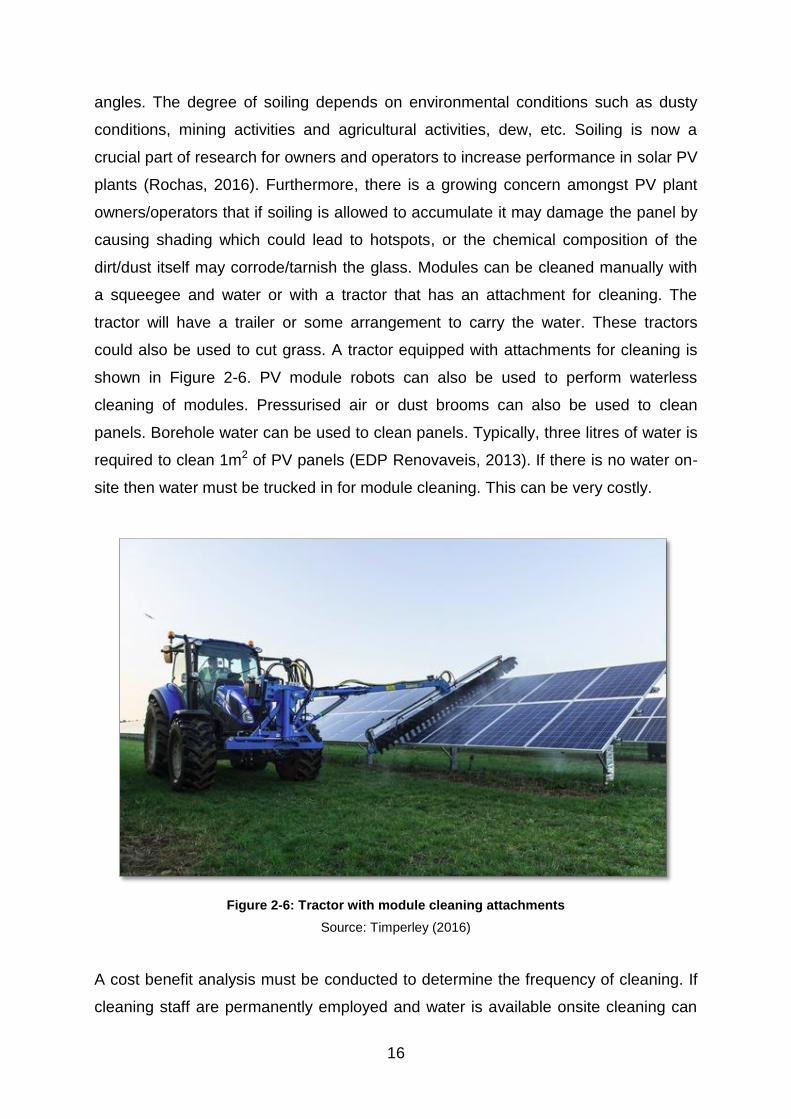
dirt/dust itself may corrode/tarnish the glass. Modules can be cleaned manually with
a squeegee and water or with a tractor that has an attachment for cleaning. The
tractor will have a trailer or some arrangement to carry the water. These tractors
could also be used to cut grass. A tractor equipped with attachments for cleaning is
shown in Figure 2-6. PV module robots can also be used to perform waterless
cleaning of modules. Pressurised air or dust brooms can also be used to clean
panels. Borehole water can be used to clean panels. Typically, three litres of water is
required to clean 1m2 of PV panels (EDP Renovaveis, 2013). If there is no water on-
site then water must be trucked in for module cleaning. This can be very costly.
Figure 2-6: Tractor with module cleaning attachments
Source: Timperley (2016)
A cost benefit analysis must be conducted to determine the frequency of cleaning. If
cleaning staff are permanently employed and water is available onsite cleaning can

17
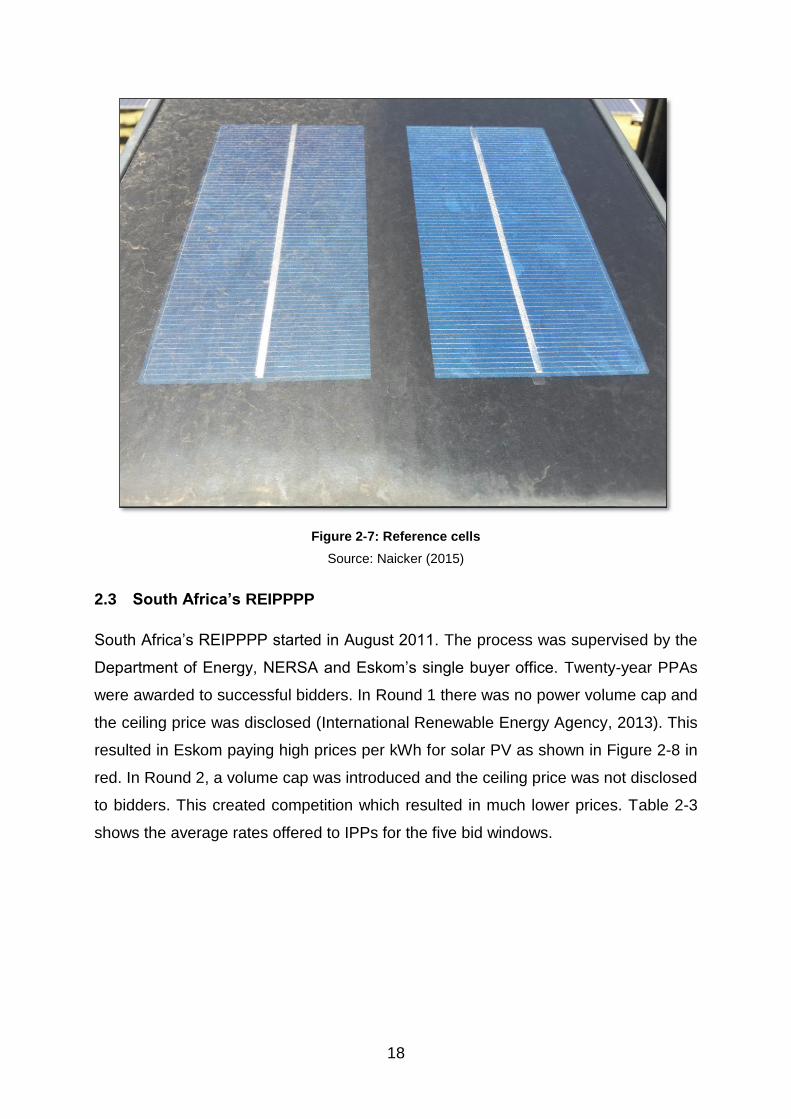
be as frequent as every month during the season when there is no rain. Reference
cells used to measure the irradiance of the sun can be used to verify whether
cleaning is required. As shown in Figure 2-7 below, this involves cleaning one cell
daily and not cleaning the other cell. The measured irradiance from the reference cell
that is not cleaned will give an indication of the soiling on the PV modules. Typically,
if there is a constant difference of greater than 50 W/m2 measured between the two
reference cells then cleaning is required. However, the plant manager must calculate
the loss in revenue versus the cost of cleaning. The 50 W/m2 (difference in irradiation
measurement between reference cells) indicates the irradiance loss due to soiling.
From the irradiance loss the energy loss can be calculated. Before authorising the
washing of panels the plant maintenance manager must check the weather forecast
to verify that there is no rain predicted for the next few days. In SA where the solar
resource is high the benefit of cleaning can be quickly realised, since soiling
decreases the amount of irradiation reaching the solar cells. Another method for
checking the power loss due to soiling is to use an IV-curve tracer to measure the
peak power of a soiled panel vs the peak power of a cleaned panel or a short circuit
test (Shrestha & Taylor, 2016).
Solar panels should ideally be washed in the early morning or late afternoon in order
to prevent thermal fractures of the modules. Chemicals used in the cleaning process
should not cause harm to the glass of the panel nor the environment. Although the
use of de-ionised water is recommended by some panel manufacturers for washing
panels, the following sources of water can possibly be used for cleaning in SA:
1. Borehole water;
2. Borehole water with reverse osmosis plant;
3. Municipal water; and
4. Municipal water with reverse osmosis plant.
Recommendations for cleaning solar PV modules by various manufacturers are
shown in Appendix 2.
18
Figure 2-7: Reference cells
Source: Naicker (2015)
2.3 South Africa’s REIPPPP
South Africa’s REIPPPP started in August 2011. The process was supervised by the
Department of Energy, NERSA and Eskom’s single buyer office. Twenty-year PPAs
were awarded to successful bidders. In Round 1 there was no power volume cap and
the ceiling price was disclosed (International Renewable Energy Agency, 2013). This
resulted in Eskom paying high prices per kWh for solar PV as shown in Figure 2-8 in
red. In Round 2, a volume cap was introduced and the ceiling price was not disclosed
to bidders. This created competition which resulted in much lower prices. Table 2-3
shows the average rates offered to IPPs for the five bid windows.
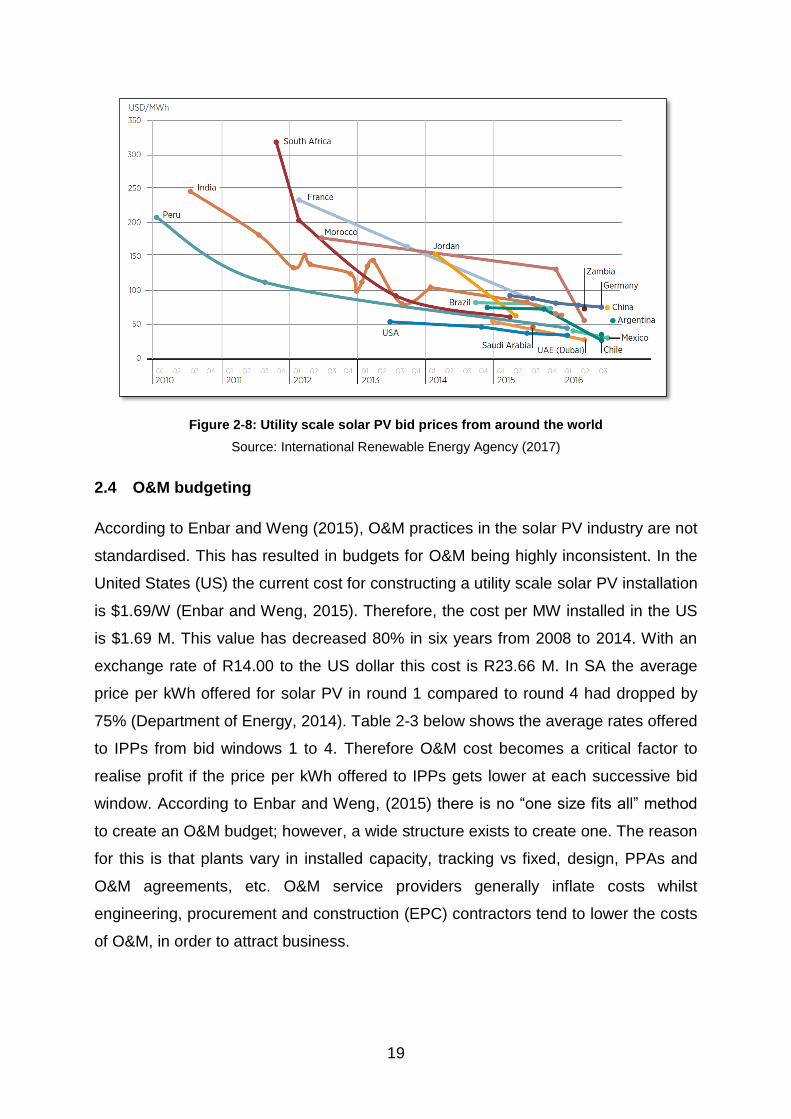
19
Figure 2-8: Utility scale solar PV bid prices from around the world
Source: International Renewable Energy Agency (2017)
2.4 O&M budgeting
According to Enbar and Weng (2015), O&M practices in the solar PV industry are not
standardised. This has resulted in budgets for O&M being highly inconsistent. In the
United States (US) the current cost for constructing a utility scale solar PV installation
is $1.69/W (Enbar and Weng, 2015). Therefore, the cost per MW installed in the US
is $1.69 M. This value has decreased 80% in six years from 2008 to 2014. With an
exchange rate of R14.00 to the US dollar this cost is R23.66 M. In SA the average
price per kWh offered for solar PV in round 1 compared to round 4 had dropped by
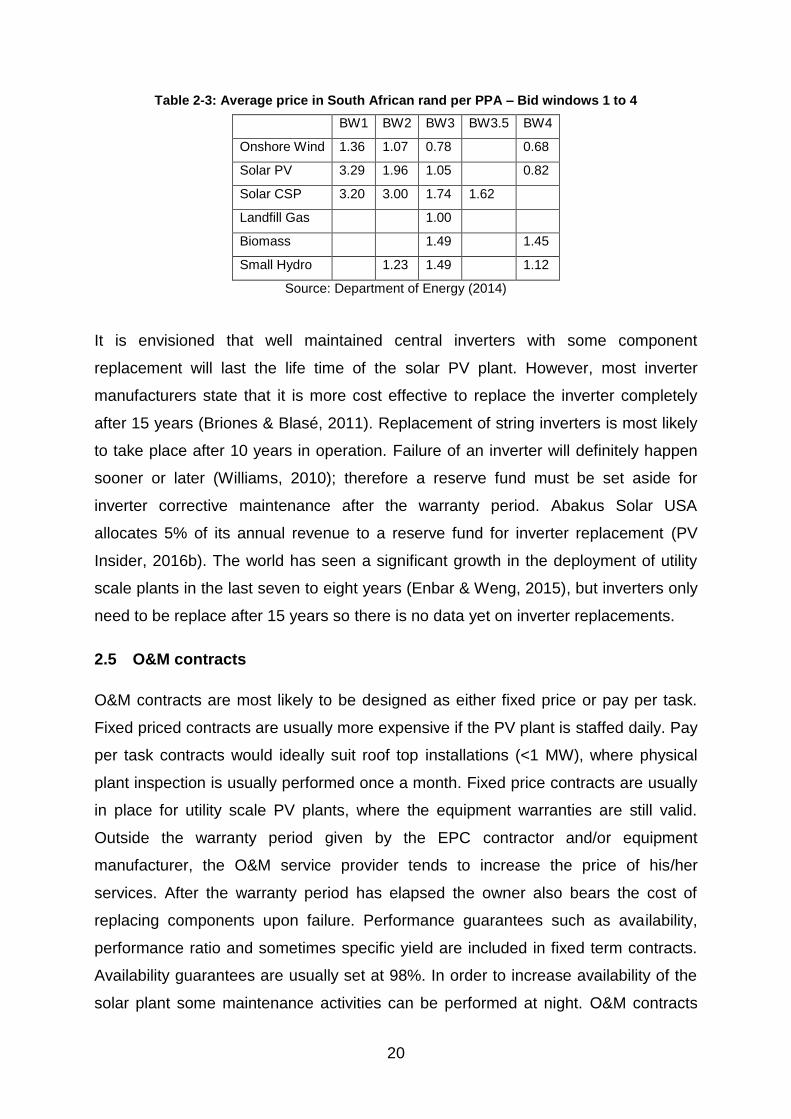
75% (Department of Energy, 2014). Table 2-3 below shows the average rates offered
to IPPs from bid windows 1 to 4. Therefore O&M cost becomes a critical factor to
realise profit if the price per kWh offered to IPPs gets lower at each successive bid
window. According to Enbar and Weng, (2015) there is no “one size fits all” method
to create an O&M budget; however, a wide structure exists to create one. The reason
for this is that plants vary in installed capacity, tracking vs fixed, design, PPAs and
O&M agreements, etc. O&M service providers generally inflate costs whilst
engineering, procurement and construction (EPC) contractors tend to lower the costs
of O&M, in order to attract business.
20
Table 2-3: Average price in South African rand per PPA – Bid windows 1 to 4
BW1 BW2 BW3 BW3.5 BW4
Onshore Wind 1.36 1.07 0.78 0.68
Solar PV 3.29 1.96 1.05 0.82
Solar CSP 3.20 3.00 1.74 1.62
Landfill Gas 1.00
Biomass 1.49 1.45
Small Hydro 1.23 1.49 1.12
Source: Department of Energy (2014)
It is envisioned that well maintained central inverters with some component
replacement will last the life time of the solar PV plant. However, most inverter
manufacturers state that it is more cost effective to replace the inverter completely
after 15 years (Briones & Blasé, 2011). Replacement of string inverters is most likely
to take place after 10 years in operation. Failure of an inverter will definitely happen
sooner or later (Williams, 2010); therefore a reserve fund must be set aside for
inverter corrective maintenance after the warranty period. Abakus Solar USA
allocates 5% of its annual revenue to a reserve fund for inverter replacement (PV
Insider, 2016b). The world has seen a significant growth in the deployment of utility
scale plants in the last seven to eight years (Enbar & Weng, 2015), but inverters only
need to be replace after 15 years so there is no data yet on inverter replacements.
2.5 O&M contracts
O&M contracts are most likely to be designed as either fixed price or pay per task.
Fixed priced contracts are usually more expensive if the PV plant is staffed daily. Pay
per task contracts would ideally suit roof top installations (<1 MW), where physical
plant inspection is usually performed once a month. Fixed price contracts are usually
in place for utility scale PV plants, where the equipment warranties are still valid.
Outside the warranty period given by the EPC contractor and/or equipment
manufacturer, the O&M service provider tends to increase the price of his/her
services. After the warranty period has elapsed the owner also bears the cost of
replacing components upon failure. Performance guarantees such as availability,
performance ratio and sometimes specific yield are included in fixed term contracts.
Availability guarantees are usually set at 98%. In order to increase availability of the
solar plant some maintenance activities can be performed at night. O&M contracts
21
can also include penalties for not meeting performance guarantees or rewards for
exceeding the energy yield. The contract must also include the frequency of
preventative maintenance to be performed on all components. The EPC contractor
usually performs O&M for the first two or three years of operation, since this
coincides with the defects warranty period. Short term contracts (one to three years)
are encouraged for solar PV plant owners to take advantage of the possibility of O&M
costs decreasing and the knowledge gained from operating and maintaining a
specific solar PV site.
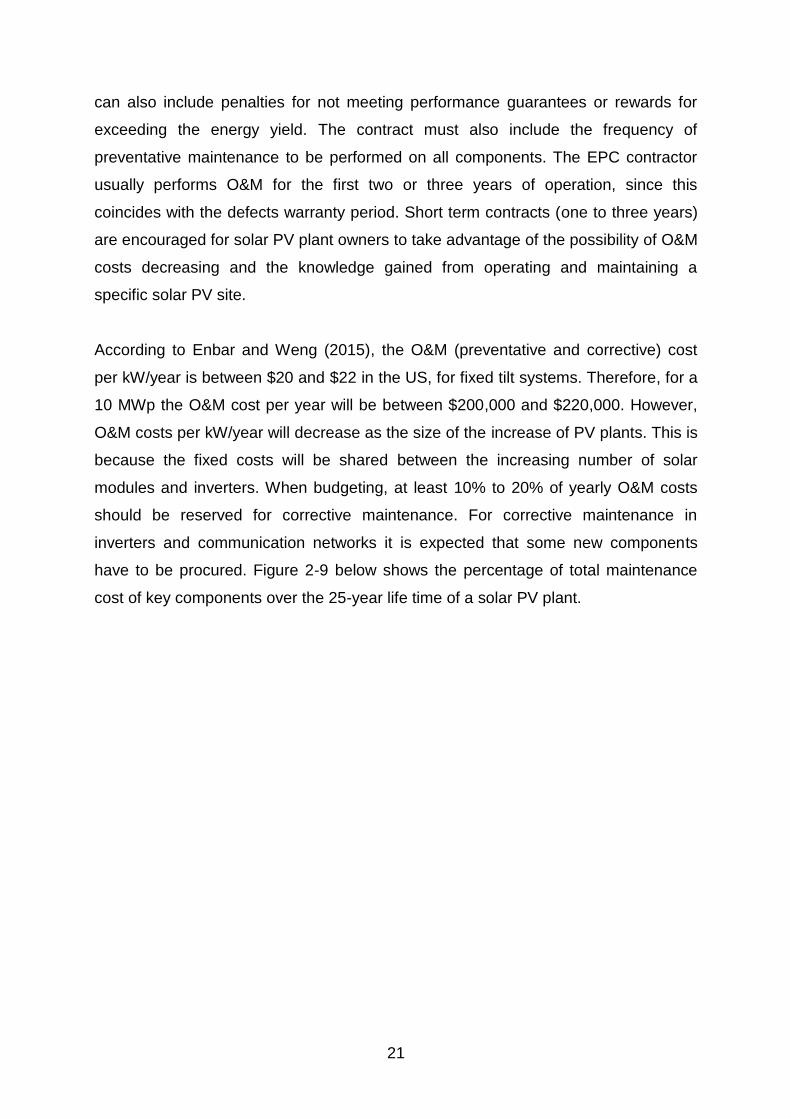
According to Enbar and Weng (2015), the O&M (preventative and corrective) cost
per kW/year is between $20 and $22 in the US, for fixed tilt systems. Therefore, for a
10 MWp the O&M cost per year will be between $200,000 and $220,000. However,
O&M costs per kW/year will decrease as the size of the increase of PV plants. This is
because the fixed costs will be shared between the increasing number of solar
modules and inverters. When budgeting, at least 10% to 20% of yearly O&M costs
should be reserved for corrective maintenance. For corrective maintenance in
inverters and communication networks it is expected that some new components
have to be procured. Figure 2-9 below shows the percentage of total maintenance
cost of key components over the 25-year life time of a solar PV plant.

22
Figure 2-9: Life cycle maintenance costs (% of total)
Source: Enbar and Key (2010b)
Table 2-4 below shows total O&M costs together with reserve amount for inverter
replacement and fixed overheads, for a 10 MW plant in the US. As can be seen for
fixed tilted modules, the costs for preventative maintenance are greater for thin film
modules (CdTe and a-Si) compared to crystalline modules (c-Si). This is because
thin film modules have a lower efficiency than crystalline modules and thus more thin
film modules will be installed per MW when compared to crystalline modules.
Tracking systems require more maintenance than fixed systems. This is because
tracking systems may have motors and hydraulics. Furthermore, inclinometers could
fail periodically.
23
Table 2-4: Utility-scale solar PV plant O&M estimates
O&M costs ($/kW-yr) Fixed Tilt
c-Si
Fixed Tilt
CdTe
Fixed Tilt
a-Si
Tilted Single Axis
Tracking c-Si
Single-Axis
Tracking c-Si
Scheduled
maintenance/cleaning $20 $25 $25 $30 $30
Unscheduled maintenance $2 $2 $2 $5 $5
Inverter replacement
reserve $10 $10 $10 $10 $10
Subtotal O&M $32 $37 $37 $45 $45
Insurance, property taxes,
owner’s cost $15 $15 $15 $15 $15
Total O&M $47 $52 $52 $60 $60
Source: ScottMadden (2010)
An O&M contract must state in detail the following (Miller & Lumby, 2015):
Activities to be performed;
Owner’s responsibilities;
Standards, legislation and guidelines that will be applicable at that site;
Conditions of payment;
Performance guarantees;
Formula used to calculate performance ratio, availability and specific yield;
Formula used to calculate penalties due to under performance;
Legal aspects; and
Terms and conditions.
Most utilities are outsourcing O&M to third party contractors (Stolte, 2010). However,
as the installed capacity of solar increases, the utility will tend to employ in-house
staff. By using in-house staff, the familiarity of the staff with regards to PV
maintenance will increase and quality of the work should increase. Alternatively,
O&M contracts for the initial three to five years must stipulate training of the utility’s
staff by the O&M contractor. Performance guarantees can only be contested when
reliable data is available. Clauses in the agreed upon PPAs allow IPPs to claim
revenue lost from the grid operator when the grid is not available. Without data this
claim would not be honoured. Therefore, the upkeep of the communications system
and data storage is crucial for solar PV plants. Labour cost for a PV plant is generally
a fixed cost, which accounts for the bulk of O&M expenses (Stolte, 2010).
24
2.6 Staffing
The area required to install a ground mounted PV plant comprising crystalline
modules in SA varies between 0.9 and 1.4 hectares per MWp installed (Miller &
Lumby, 2015). Thus, a 5 MWp PV plant will occupy a maximum area of 7 hectares.
According to Relancio and Recuero (2010) two full time persons are required for
O&M at plants employing tracking technology and one full time person is required for
fixed systems having an installed capacity of 5 MW. They also state that for each
additional 5 MW added, two more people are required for tracking systems and one
more person is required for fixed systems.
However, in line with good work safety practices, at least two persons should be
present when work such as isolation of plant is required. At least two technical
controllers should be employed full time. Their duties will include O&M activities.
Another two personnel should be employed to perform vegetation control and module
washing. Therefore, for plants having an installed capacity between 5 MW and
10 MW at least four persons should be employed full time. With two technical
controllers and two general workers, the taking of leave by employees can be
accommodated by the O&M manager. For every additional 10 MW at least one more
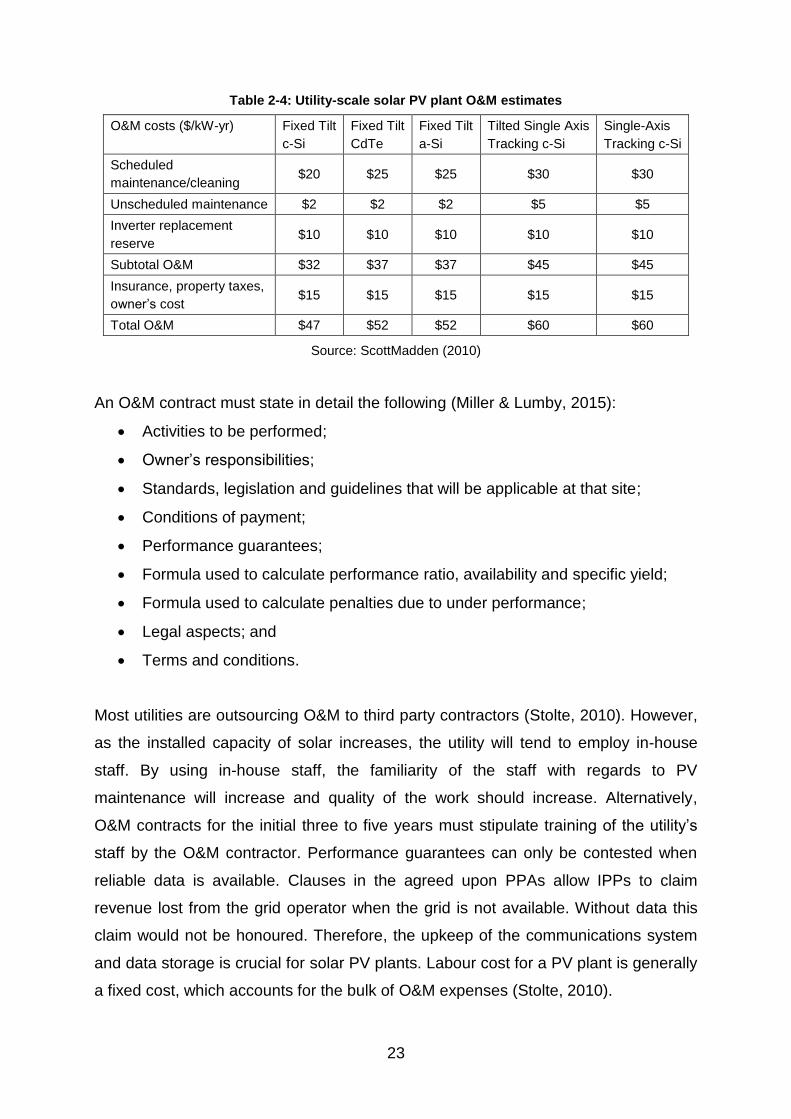
technical controller should be employed. The technical controller must be multi-
skilled and have the expertise shown in Table 2-5.
It is now a general practice to share technically competent staff between various
installations. Furthermore, it is economical to have one O&M manager for many sites.
A skills matrix for O&M staff is shown in Appendix 3.
Table 2-5: Technical controller skills
DC systems CCTV systems
Inverter commissioning Transformer maintenance
Inverter fault finding MV switchgear
SCADA systems LV switchgear
UPS systems Report writing
AC electrical protection HV switchgear
Metering PV systems

25
2.7 Equipment warranties
The section reviews the warranties of solar modules and inverters.
2.7.1 Solar modules
Manufacturers of solar modules provide both a product warranty and a performance
guarantee. A product guarantee protects the buyer of these modules against
manufacturing defects. Most module manufacturers provide a product warranty of 10
years. Manufacturing defects covers faults that are caused by poor quality products
used during manufacturing and poor workmanship such as diode failures, hot spots
and delamination, etc.
A performance guarantee is the guarantee given by the module manufacturer that
the degradation in terms of power output of the panel will not be lower than a stated
percentage of rated power. Guaranteed power output of PV modules is usually 90%
of rated power after 10 years and 80% of rated power after 25 years. The guaranteed
output power is what is expected at standard test conditions (STC) in a lab. In reality
STC conditions are rarely duplicated under field conditions. Polycrystalline modules
typically degrade 3% during the first year of operation and then 0.7% per year for the
next 24 years, which results in approximately 20% degradation over 25 years.
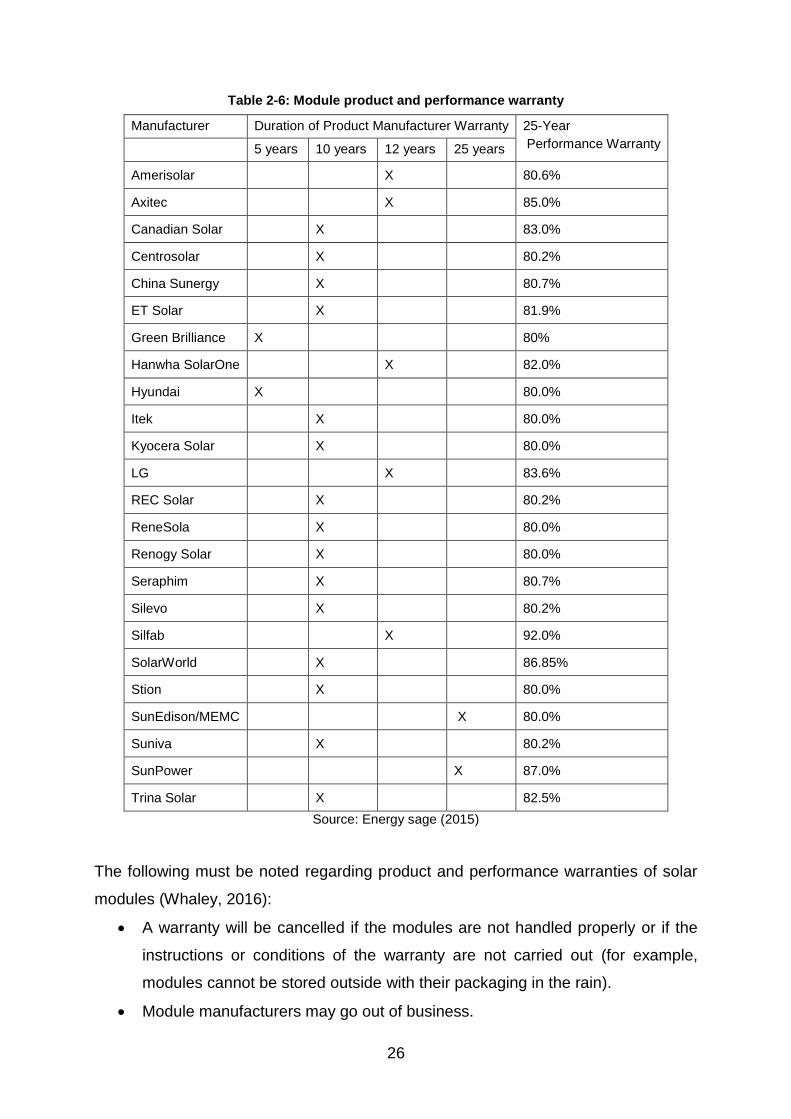
Table 2-6 below shows the product and performance warranties provided by some
manufacturers of solar PV modules.
26
Table 2-6: Module product and performance warranty
Manufacturer Duration of Product Manufacturer Warranty 25-Year
Performance Warranty 5 years 10 years 12 years 25 years
Amerisolar X 80.6%
Axitec X 85.0%
Canadian Solar X 83.0%
Centrosolar X 80.2%
China Sunergy X 80.7%
ET Solar X 81.9%
Green Brilliance X 80%
Hanwha SolarOne X 82.0%
Hyundai X 80.0%
Itek X 80.0%
Kyocera Solar X 80.0%
LG X 83.6%
REC Solar X 80.2%
ReneSola X 80.0%
Renogy Solar X 80.0%
Seraphim X 80.7%
Silevo X 80.2%
Silfab X 92.0%
SolarWorld X 86.85%
Stion X 80.0%
SunEdison/MEMC X 80.0%
Suniva X 80.2%
SunPower X 87.0%
Trina Solar X 82.5%
Source: Energy sage (2015)
The following must be noted regarding product and performance warranties of solar
modules (Whaley, 2016):
A warranty will be cancelled if the modules are not handled properly or if the
instructions or conditions of the warranty are not carried out (for example,
modules cannot be stored outside with their packaging in the rain).
Module manufacturers may go out of business.
27
To prove degradation (power loss) of the module is costly since each module
must be sent to an accredited lab for testing.
Warranty does not cover the shipping of faulty modules to the manufacturer
and the shipping of the replacement modules.
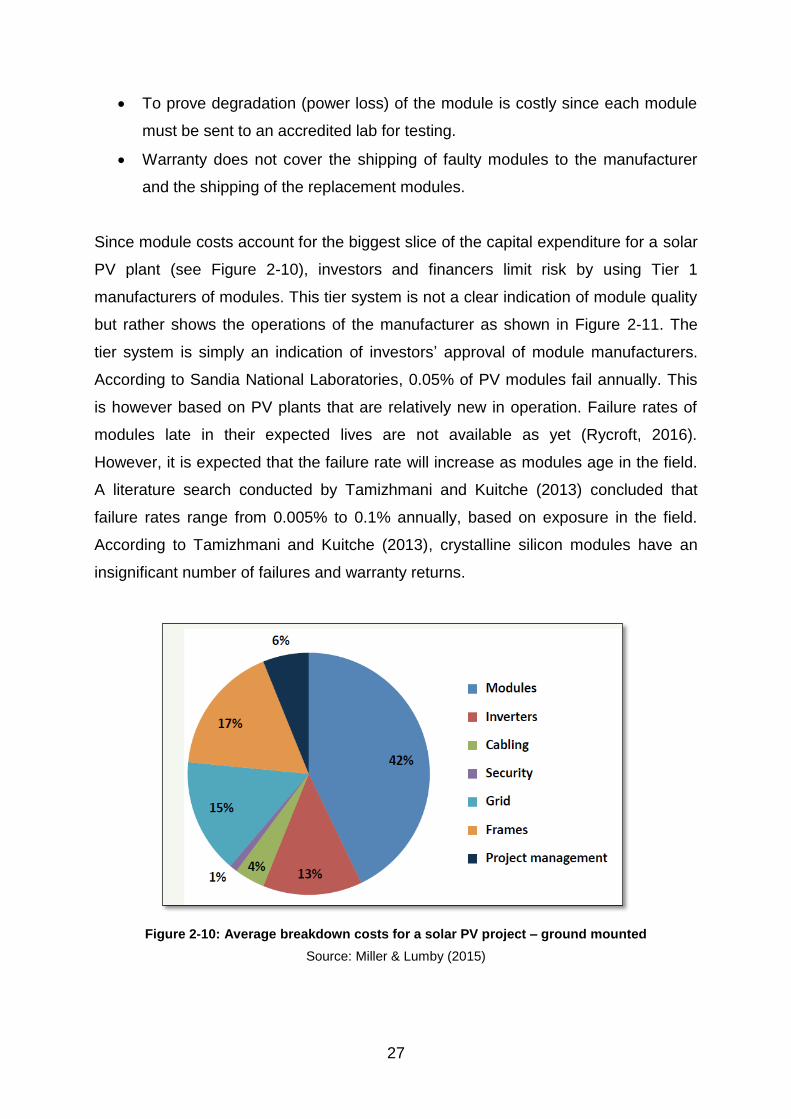
Since module costs account for the biggest slice of the capital expenditure for a solar
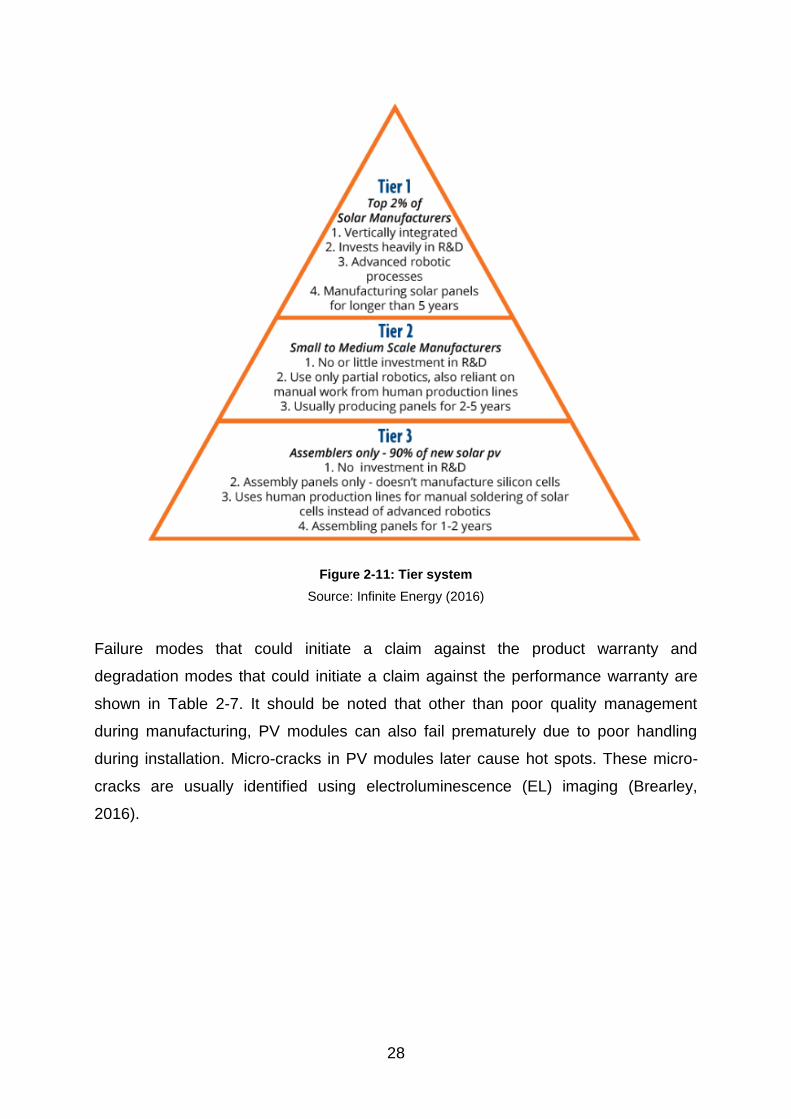
PV plant (see Figure 2-10), investors and financers limit risk by using Tier 1
manufacturers of modules. This tier system is not a clear indication of module quality
but rather shows the operations of the manufacturer as shown in Figure 2-11. The
tier system is simply an indication of investors’ approval of module manufacturers.
According to Sandia National Laboratories, 0.05% of PV modules fail annually. This
is however based on PV plants that are relatively new in operation. Failure rates of
modules late in their expected lives are not available as yet (Rycroft, 2016).
However, it is expected that the failure rate will increase as modules age in the field.
A literature search conducted by Tamizhmani and Kuitche (2013) concluded that
failure rates range from 0.005% to 0.1% annually, based on exposure in the field.
According to Tamizhmani and Kuitche (2013), crystalline silicon modules have an
insignificant number of failures and warranty returns.
Figure 2-10: Average breakdown costs for a solar PV project – ground mounted
Source: Miller & Lumby (2015)
28
Figure 2-11: Tier system
Source: Infinite Energy (2016)
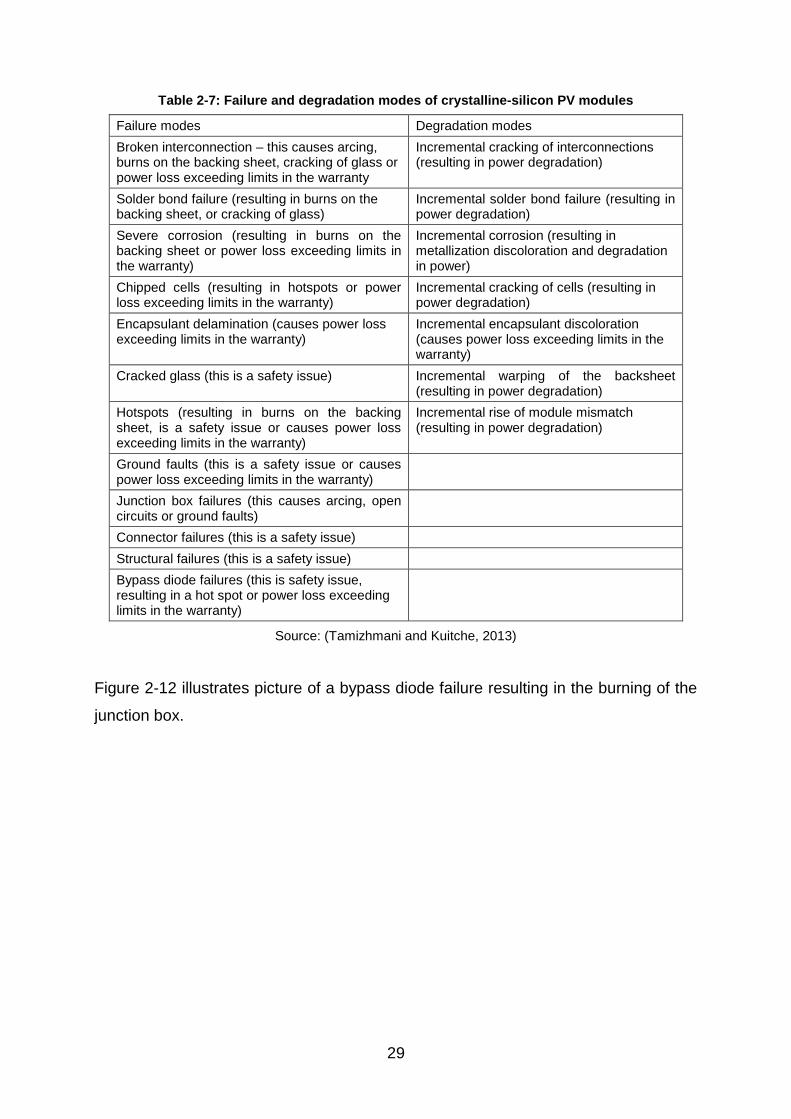
Failure modes that could initiate a claim against the product warranty and
degradation modes that could initiate a claim against the performance warranty are
shown in Table 2-7. It should be noted that other than poor quality management
during manufacturing, PV modules can also fail prematurely due to poor handling
during installation. Micro-cracks in PV modules later cause hot spots. These micro-
cracks are usually identified using electroluminescence (EL) imaging (Brearley,
2016).
29
Table 2-7: Failure and degradation modes of crystalline-silicon PV modules
Failure modes Degradation modes
Broken interconnection – this causes arcing, burns on the backing sheet, cracking of glass or power loss exceeding limits in the warranty
Incremental cracking of interconnections (resulting in power degradation)
Solder bond failure (resulting in burns on the backing sheet, or cracking of glass)
Incremental solder bond failure (resulting in power degradation)
Severe corrosion (resulting in burns on the backing sheet or power loss exceeding limits in the warranty)
Incremental corrosion (resulting in metallization discoloration and degradation in power)
Chipped cells (resulting in hotspots or power loss exceeding limits in the warranty)
Incremental cracking of cells (resulting in power degradation)
Encapsulant delamination (causes power loss exceeding limits in the warranty)
Incremental encapsulant discoloration (causes power loss exceeding limits in the warranty)
Cracked glass (this is a safety issue) Incremental warping of the backsheet (resulting in power degradation)
Hotspots (resulting in burns on the backing sheet, is a safety issue or causes power loss exceeding limits in the warranty)
Incremental rise of module mismatch (resulting in power degradation)
Ground faults (this is a safety issue or causes power loss exceeding limits in the warranty)
Junction box failures (this causes arcing, open circuits or ground faults)
Connector failures (this is a safety issue)
Structural failures (this is a safety issue)
Bypass diode failures (this is safety issue, resulting in a hot spot or power loss exceeding limits in the warranty)
Source: (Tamizhmani and Kuitche, 2013)
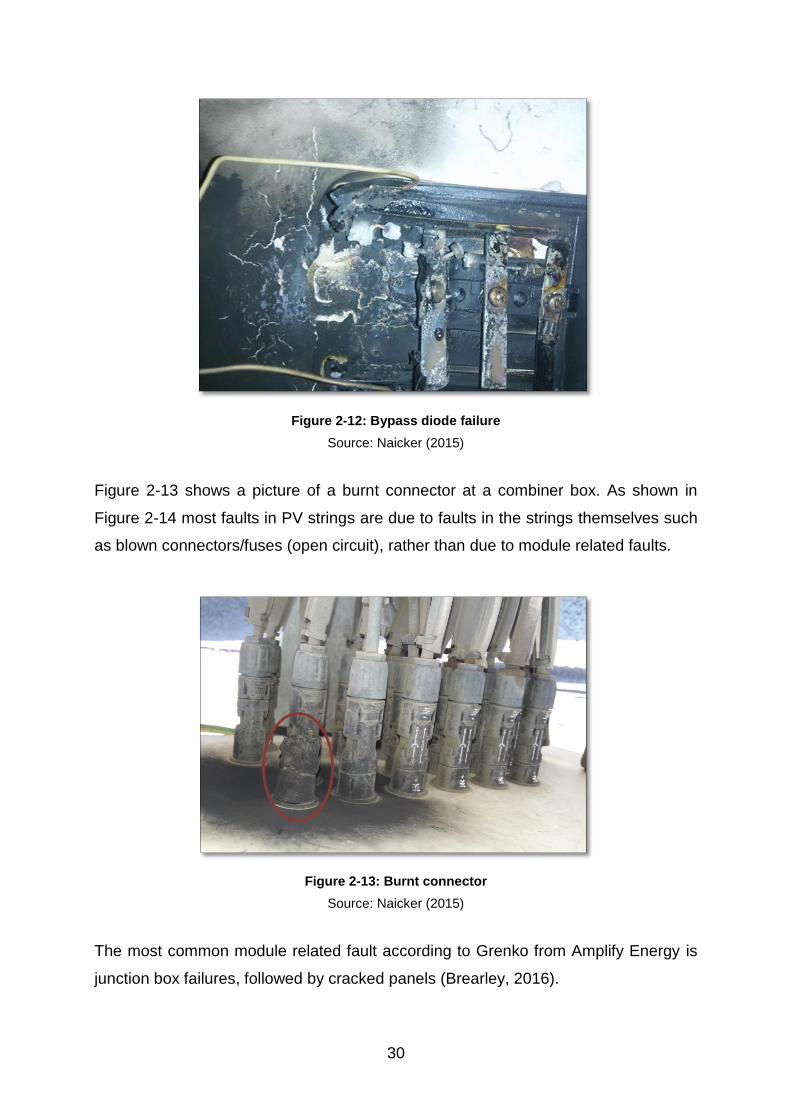
Figure 2-12 illustrates picture of a bypass diode failure resulting in the burning of the
junction box.
30
Figure 2-12: Bypass diode failure
Source: Naicker (2015)
Figure 2-13 shows a picture of a burnt connector at a combiner box. As shown in
Figure 2-14 most faults in PV strings are due to faults in the strings themselves such
as blown connectors/fuses (open circuit), rather than due to module related faults.
Figure 2-13: Burnt connector
Source: Naicker (2015)
The most common module related fault according to Grenko from Amplify Energy is
junction box failures, followed by cracked panels (Brearley, 2016).

31
Figure 2-14: Failures in PV strings
Source: Brearley (2016)
2.7.2 Inverters
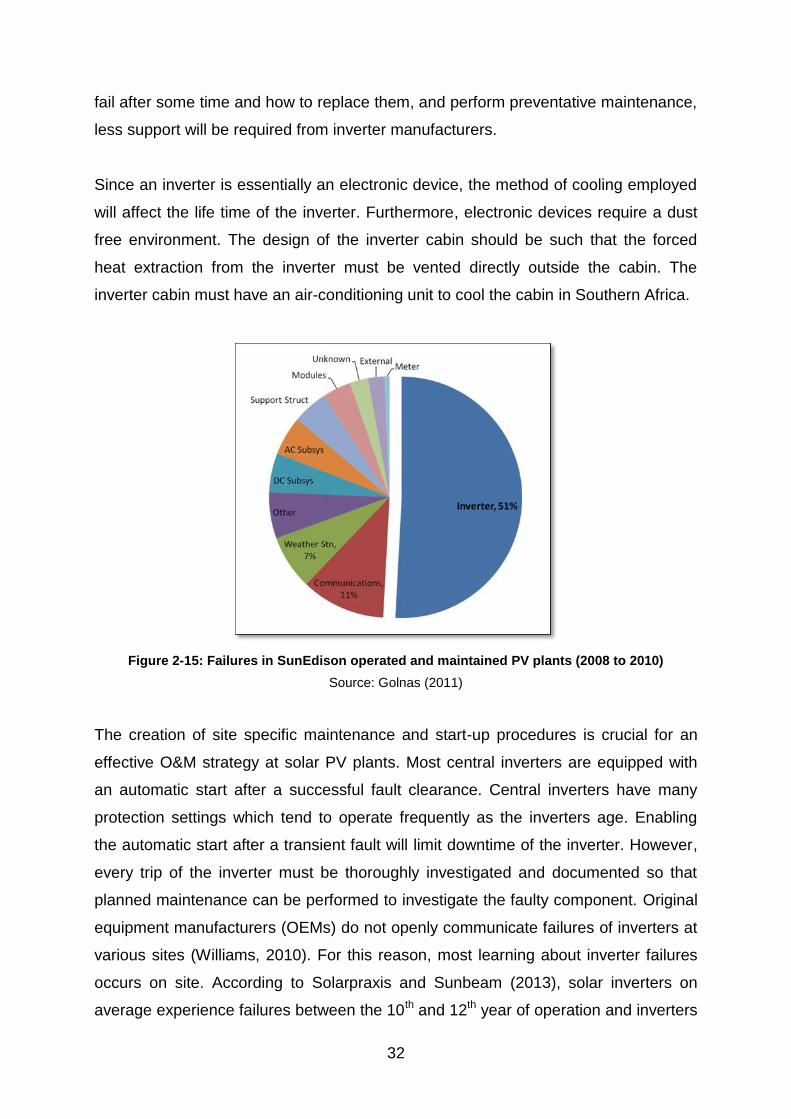
Inverters are major components in a solar PV plant. Of the total amount of reported
failures in a PV plant, 51% are due to hardware or software problems in inverters, as
shown in Figure 2-15. Inverters are the most common device inclined to fail in a solar
PV plant (Thompson, 2011). Therefore, reliability of inverters and the years of
warranty provided by the manufacturer are crucial for the functioning of the PV plant.
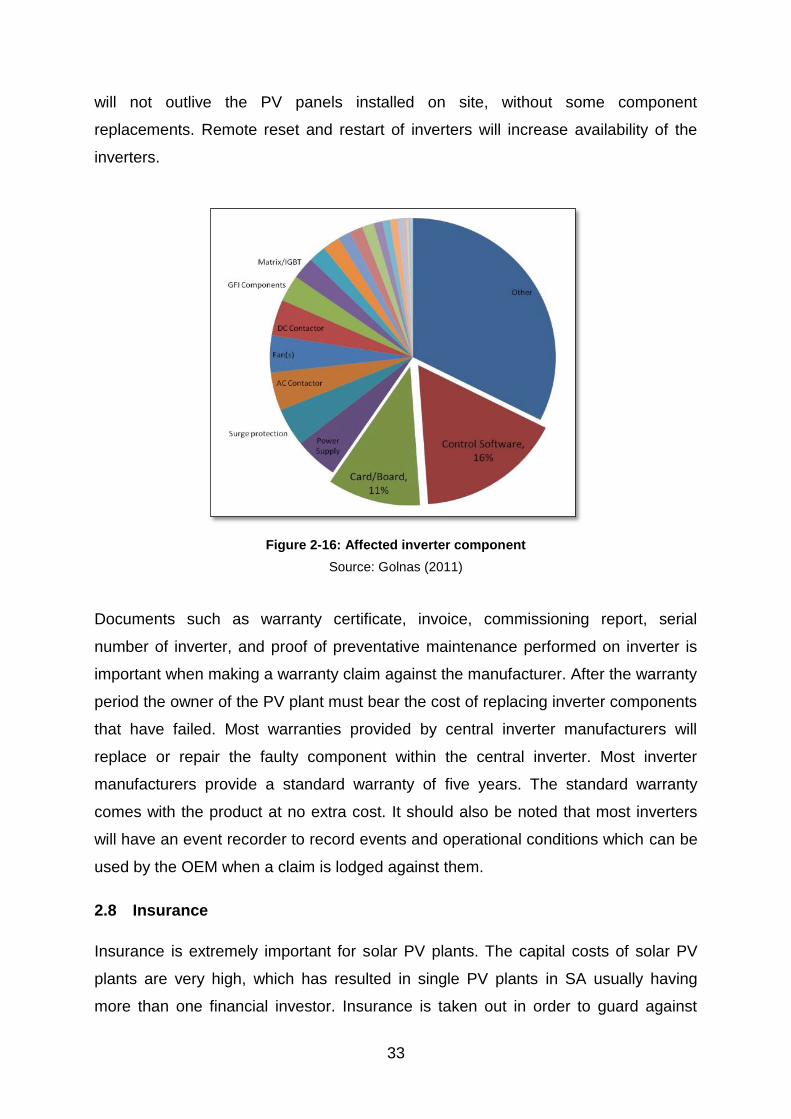
An inverter is an electronic device and components such as capacitors are prone to
failure. Figure 2-16 shows the proportion of inverter components that fail.
Considering that the design life of a solar PV plant is 25 years it is expected that
some components in the central inverter will have to be changed during that time.
According to Golnas (2011), 57% of all inverter failures are caused by failure of parts
and materials.
Support provided by manufacturers of inverters is important so that breakdown time
can be kept at a minimum. Manufacturers should also provide a list of critical inverter
spares that are likely to fail. Cost, years of warranty and performance are some of the
most important factors to consider when choosing an inverter. Most manufacturers of
inverters provide extended warranties as an option of up to 20 years. However, the
cost of an extended warranty must be compared to the actual failure rate and cost of
components in inverters. Once onsite O&M personnel figure out what components
32
fail after some time and how to replace them, and perform preventative maintenance,
less support will be required from inverter manufacturers.
Since an inverter is essentially an electronic device, the method of cooling employed
will affect the life time of the inverter. Furthermore, electronic devices require a dust
free environment. The design of the inverter cabin should be such that the forced
heat extraction from the inverter must be vented directly outside the cabin. The
inverter cabin must have an air-conditioning unit to cool the cabin in Southern Africa.
Figure 2-15: Failures in SunEdison operated and maintained PV plants (2008 to 2010)
Source: Golnas (2011)
The creation of site specific maintenance and start-up procedures is crucial for an
effective O&M strategy at solar PV plants. Most central inverters are equipped with
an automatic start after a successful fault clearance. Central inverters have many
protection settings which tend to operate frequently as the inverters age. Enabling
the automatic start after a transient fault will limit downtime of the inverter. However,
every trip of the inverter must be thoroughly investigated and documented so that
planned maintenance can be performed to investigate the faulty component. Original
equipment manufacturers (OEMs) do not openly communicate failures of inverters at
various sites (Williams, 2010). For this reason, most learning about inverter failures
occurs on site. According to Solarpraxis and Sunbeam (2013), solar inverters on
average experience failures between the 10th and 12th year of operation and inverters
33
will not outlive the PV panels installed on site, without some component
replacements. Remote reset and restart of inverters will increase availability of the
inverters.
Figure 2-16: Affected inverter component
Source: Golnas (2011)
Documents such as warranty certificate, invoice, commissioning report, serial
number of inverter, and proof of preventative maintenance performed on inverter is
important when making a warranty claim against the manufacturer. After the warranty
period the owner of the PV plant must bear the cost of replacing inverter components
that have failed. Most warranties provided by central inverter manufacturers will
replace or repair the faulty component within the central inverter. Most inverter
manufacturers provide a standard warranty of five years. The standard warranty
comes with the product at no extra cost. It should also be noted that most inverters
will have an event recorder to record events and operational conditions which can be
used by the OEM when a claim is lodged against them.
2.8 Insurance
Insurance is extremely important for solar PV plants. The capital costs of solar PV
plants are very high, which has resulted in single PV plants in SA usually having
more than one financial investor. Insurance is taken out in order to guard against

34
natural disasters, theft, force majeure, failure of critical equipment, etc. Insurance
premiums account for roughly 25% of the total yearly O&M expenses of a PV plant in
the US (Spear et al., 2010). Figure 2-17 below indicates the causes and percentage
of total claims for commercial rooftop solar PV plants in Germany, between 2003 and
2008. Figure 2-17 indicates that storms and lightening accounted for 44% of claims.
In Figure 2-17 3% of claims were due to small fury animals called martens which
cause damage by biting equipment. Lightening and storms can also cause damage
at utility scale PV plants. In 2014, 60% of the world’s installed PV systems were
installed on roofs (Patel, 2016).
Figure 2-17: Causes of insurance claims – Germany 2003 to 2008
Source: Moses et al. (2015)
2.9 Levelised cost of electricity
The LCOE equation for a power plant was represented by Equation 1.1. This
calculated value represents the breakeven point between all costs and expected
revenue. The LCOE value depends on the following factors (Wirth, 2014):
Construction and installation costs;
Life time of plant, interest on loans and return on investment for owners;
O&M and insurance costs;
Irradiance expected; and
Annual degradation of PV modules.

35
The LCOE for renewable plants is reducing whilst the LCOE for fossil fuel plants are
increasing (Beetz, 2015). Grid parity is a phrase used to describe the occurrence
when the price of generating electricity using solar PV matches, or is less than, the
price of electricity generated by conventional sources. Grid parity has been achieved
in several countries in the world (Solar century, 2014). The above inflation increases
in grid electricity, high solar irradiation, and the decreasing costs of solar panels has
resulted in solar PV achieving grid parity in SA. The economics of solar PV has
attracted many investors. A solar PV plant has no fuel costs whereas for a
conventional fossil fuel plant the price of coal can only be expected to rise. Table 2-8
below shows the average LCOE for different power generation technologies in
Europe, Middle East and Africa (EMEA) for 2015. The average exchange rate for the
South African rand to the US dollar in 2015 was R13.28 (Internal Revenue Service,
2017).
Table 2-8: LCOE's for EMEA
Technology LCOE (R/MWh)
Onshore Wind 1208
Solar PV 1687
Coal 1394
CCGT 1567
Nuclear 2098
Source: Chestney (2015)
The LCOE of a solar plant is influenced by the total life time expected production.
The capacity factor of solar plants and thus energy produced can be increased by
using trackers and higher efficiency solar modules. The expected years of operation,
discount rate, annual degradation of modules and annual O&M will also affect the
LCOE value (Cambell, 2008).
2.10 Monitoring of solar plants
Utility scale solar PV plants are usually staffed Monday to Friday. The control room
should be equipped with a Human Machine Interface (HMI) that displays various live
parameters and performance elements of the plant. Offsite monitoring and alarming
via sms is recommended to increase availability of the solar plant. If an inverter or a
36
circuit breaker trips the operator needs to be alerted immediately so that technicians
can be sent out to perform corrective maintenance. The SCADA system provides the
status and performance of the plant in real time (Reaugh et al., 2017). A historian is
normally used to store the data that the SCADA system retrieves from the inverters,
combiner boxes, weather stations, transformers, etc. In order for IPP’s to connect to
the national grid they are required to meet the SCADA requirements of the grid
operator. The grid operator requires certain parameters from an IPP in order to
balance the load requirements of the national grid. Data is required to calculate
availability and performance ratio, etc. Appendix 4 shows the SCADA system of a
typical utility scale power plant.
2.11 String level monitoring
String level monitoring measures the current of every string. Whenever any string is
not producing any current an alarm is illuminated on the HMI to alert the operator.
String level monitoring takes place in the combiner box. A combination of RS485 and
fibre optic networks is usually used to communicate the string currents and voltage
from the combiner box to the SCADA system. Without string level monitoring or array
level monitoring it is very difficult for the operator to see if one string is not producing
from the central inverter data. The alternative to string level monitoring is for the
maintenance staff to measure the current of each string manually with a clamp-on
current meter. This is a labour intensive exercise.
2.12 Inverter monitoring
Most utility scale solar plant plants have central inverters. There are some
manufacturers of inverters that recommend string inverters for utility scale
applications. Most central inverters have the ability to communicate live parameters
to the SCADA system. Common live parameters that are displayed on the HMI are
shown in Table 2-9. These parameters inform the operator about the health of the
inverter and its state of operation. The operator can compare the measured values of
one inverter to another inverter, in order to verify deviations. This is condition-based
monitoring (CBM). Furthermore, the SCADA system can be programed to give an
alarm when certain live measured values are not within range, such as high IGBT
temperature.

37
Table 2-9: Inverter monitoring - live parameters
DC Power
AC Power
DC Voltage
AC Voltage
MWh (day)
IGBT temperature
AC Current
DC Current
Table 2-10 shows the advantages and disadvantages of the different levels of
monitoring. Module level monitoring is usually done in relation to micro-inverters or
DC power conditioners (Paul & Bray, 2012).
Table 2-10: Levels of monitoring
Inverter String Module
Benefits Convenience
Low cost
Track inverter condition
and efficiency
Moderate resolution and precision
Identify root cause
of problems to the string
Highest resolution and precision
Identify root cause of problems to the module
Monitor individual panels
Efficiency benefits*
Improved inverter reliability**
Drawbacks Poor resolution
Inability to identify string or module problems
Analytics required
Cost
Increased points of
failure
Analytics required
Cost
Increased points of
failure
* When combined with DC power optimiser or micro inverter
**Only for DC power conditioner
Source: Paul and Bray (2012)
2.13 Layout of solar PV plant
A solar PV plant normally consists of the following buildings:
1. Main control room building consisting of offices and ablution facilities.
2. Switchgear rooms, where one switchgear room will typically house two to four
inverters, a step-up transformer and MV switchgear.
3. Storage and workshop facility.
The solar PV plant should also have a source of water and security fencing. The
layout of the solar PV plant is usually designed in 1 MW (or greater) array blocks as

38
shown in Figure 2-18. The 1 MW of PV panels are connected to the inverters located
in the switchgear room. Appendix 5 shows the typical electrical apparatus found in a
switchgear or inverter cabin room. In Figure 2-18 the white cabins located at the
edge of each array block are the inverter cabin room. The inverter cabin usually
consists of two to four inverters. A single inverter could have a rating of 1 MW.
Recently inverter manufacturers are providing a complete inverter station which
comes with the inverters, MV/LV transformer and MV switchgear, housed in a
weather resistant container.
Figure 2-18: Array blocks
Source: Solar Server (2013)
2.14 Performance Indicators
Plant performance indicators such as availability, performance ratio, energy output,
capacity factor and specific yield are used to measure the status and health of a PV
plant. Many of these indicators are stated in O&M contracts. For example, an owner
of a PV plant may want a guaranteed availability of 98% for the PV plant and an
annual performance ratio of 78%. The availability of a PV plant is a measure of
whether the inverters are online, connected to the grid and ready to deliver power
based on the current irradiation levels. Basically, it is the ratio of how many hours the
inverter was synchronised and how many hours the inverter should have been

39
synchronised. Certain events/situations such as force majeure, grid failure, etc. must
not be considered when calculating availability. The events/situations that will not
affect the availability calculation must be agreed upon between the owner and O&M
contractor.
The performance ratio (PR) of a solar PV plant is an assessment of the efficiency of
the plant in converting solar irradiation into electrical energy. The PR can be used to
compare different utility scale plants irrespective of orientation and location. For the
first five years of operation it is typical to have O&M teams contracted to deliver a PR
between 75% and 80% per annum. Due to the degradation of solar panels where the
modules lose a certain percentage of their power output/annum, it is expected that
the PR of the plant will gradually decrease. During the initial years of operation, it is
common for plants to have an annual PR greater than 80%. Table 2-11 shows the
degradation rate of different modules per year. According to Jordan and Kurtz (2012),
the average module degradation rate per year is 0.8%.
Table 2-11: Degradation rate of modules
PV Module Type Degradation Rate per Year
(%/year)
Amorphous silicon (a-Si) 0.87
Monocrystalline silicon (sc-Si) 0.36
Multicrystalline silicon (mc-Si) 0.64
Cadmium telluride (CdTe) 0.4
Copper indium gallium diselenide (CIGS) 0.96
Concentrator 1.00
Source: Jordan and Kurtz (2012)
2.15 Safety at PV plants
All personnel required to operate on or to perform work in a PV plant must be trained,
and found competent, on the dangers of a solar PV installation. The ‘permit to work’
system shall be enforced to ensure employee safety and prevent unauthorised
operation of electrical apparatus. Personal protection equipment shall be used
according to the hazards of the tasks being performed at the PV plant. Staff must be
educated on the fact that the PV panel is a generator of electricity and will be
electrically alive as long there is light. The Occupational Health and Safety (OHAS)
40
Act requires employers to create and maintain a safe working place for their
employees. Hazards in a PV plant applicable to employees, PV system and aviation
are shown in Appendix 6. Although the owner/employer is ultimately responsible for
ensuring that health, safety and environmental regulations are abided by, the O&M
manager of the solar PV plant is usually responsible for the implementation of the
OHAS Act.
2.16 Training and documentation
Usually the EPC contractor is responsible to compile a maintenance manual and to
train staff that will perform O&M activities after the end of the EPC contract. The
maintenance manual must consist of the following:
a) A detailed description of the purpose of all major components in the PV plant.
b) A maintenance plan/schedule detailing frequency of preventative
maintenance.
c) Procedures to perform maintenance tasks.
d) Procedures to perform operating tasks.
e) Description of failure modes and the corrective actions required.
f) Check lists.
g) A detailed chapter on the SCADA system which explains the communication
networks, and how to troubleshoot the system.
h) List of spares with ratings.
Apart from operator and maintenance training, the owner of the plant must ensure
that software training is provided for the SCADA system, security, UPS and the
inverter. Technicians must be able to communicate with these devices using their
PCs to diagnose faults. The level of training should be such that the technicians must
be competent to commission inverters and add new devices to the SCADA system.
The following documentation should be provided by the EPC contractor to assist
O&M staff in performing their tasks (Seaward Solar, 2012):
a) Permits and licenses.
b) Existing contracts.
c) Installed/Designed AC and DC power ratings of major components.
d) The manufacturer’s name, model and number of PV modules, central
inverters, transformers, batteries, SCADA and all other major components.
41
e) Commissioning reports and test data.
f) The names and contact numbers for the customer/owner, network operator,
system designer, EPC contractor and sub-contractors.
g) A site layout map showing equipment locations.
h) Schematic drawings of all components and for the entire plant.
i) The types, sizes and ratings for all components (data sheets).
j) O&M documentation specific for items of plant such as inverters, trackers, etc.
k) Operating guidelines, safety procedures and maintenance plans.
l) Warranty information for major components such as panels and inverters and
the SCADA system.
m) Software manuals.
Every solar PV plant must have a document management system for the safe
keeping and easy retrieval of as-built documentation, reports and records. All
preventative and corrective maintenance performed on the plant must be recorded
and stored. It is recommended that records be archived both electronically and
physically.
2.17 Summary
Preventative maintenance is required to maximise the energy yield and to extend the
lifetime of the solar PV plant. Inverters must be maintained according to the
manufacturer’s requirements in order to maintain the warranties. Maintenance
schedules ensure that all equipment in a PV plant is inspected periodically. The
component that fails the most often in a PV plant is the inverter. The inverter itself
consists of various components and most of the time a simple “reset” gets the
inverter back into operation. Infra-red cameras can be used to detect defective
modules. Large areas can be scanned relatively quickly compared to visibly checking
if panels are cracked. Trackers are required to be maintained periodically and should
be monitored daily.
One of the O&M functions is to keep an inventory of critical spare parts, especially if
the solar PV plants are located in remote areas hundreds of kilometres away from
major cities and spares manufacturers (as is the case with IPPs in the Northern
Cape). Spare parts are necessary in order to limit downtime of the plant. The

42
cleaning frequency of modules depends on where the PV plant is located and the
local weather conditions. O&M budgets are not standard, varying according to
installed capacity, tracking vs fixed design, PPA and O&M agreements, etc. Inverter
manufacturers claim that the most cost-effective way to maintain a central inverter is
to replace the inverter completely after 15 years. O&M contracts are usually awarded
to the EPC contractor for the first two or three years of operation, since this coincides
with the defects warranty period.
Manufacturers of solar modules typically provide a 10 year product warranty and a 25
year performance warranty. Most inverter manufacturers provide a standard warranty
of five years but this can be extended up to 20 years. Storms and lightening are most
likely to cause the biggest damage in PV plants resulting in insurance claims. Grid
parity had been achieved in several countries in the world including SA. O&M of solar
PV plants comprises corrective maintenance, preventative maintenance and
condition based monitoring.
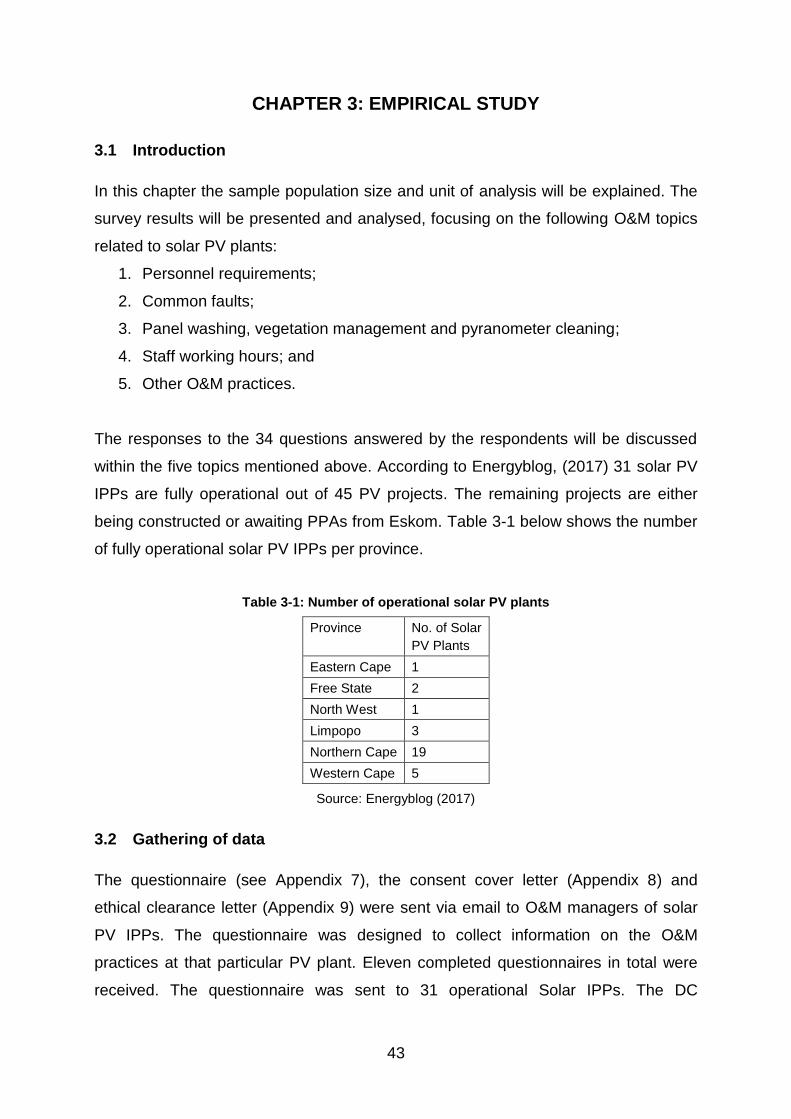
43
CHAPTER 3: EMPIRICAL STUDY
3.1 Introduction
In this chapter the sample population size and unit of analysis will be explained. The
survey results will be presented and analysed, focusing on the following O&M topics
related to solar PV plants:
1. Personnel requirements;
2. Common faults;
3. Panel washing, vegetation management and pyranometer cleaning;
4. Staff working hours; and
5. Other O&M practices.
The responses to the 34 questions answered by the respondents will be discussed
within the five topics mentioned above. According to Energyblog, (2017) 31 solar PV
IPPs are fully operational out of 45 PV projects. The remaining projects are either
being constructed or awaiting PPAs from Eskom. Table 3-1 below shows the number
of fully operational solar PV IPPs per province.
Table 3-1: Number of operational solar PV plants
Province No. of Solar
PV Plants
Eastern Cape 1
Free State 2
North West 1
Limpopo 3
Northern Cape 19
Western Cape 5
Source: Energyblog (2017)
3.2 Gathering of data
The questionnaire (see Appendix 7), the consent cover letter (Appendix 8) and
ethical clearance letter (Appendix 9) were sent via email to O&M managers of solar
PV IPPs. The questionnaire was designed to collect information on the O&M
practices at that particular PV plant. Eleven completed questionnaires in total were
received. The questionnaire was sent to 31 operational Solar IPPs. The DC
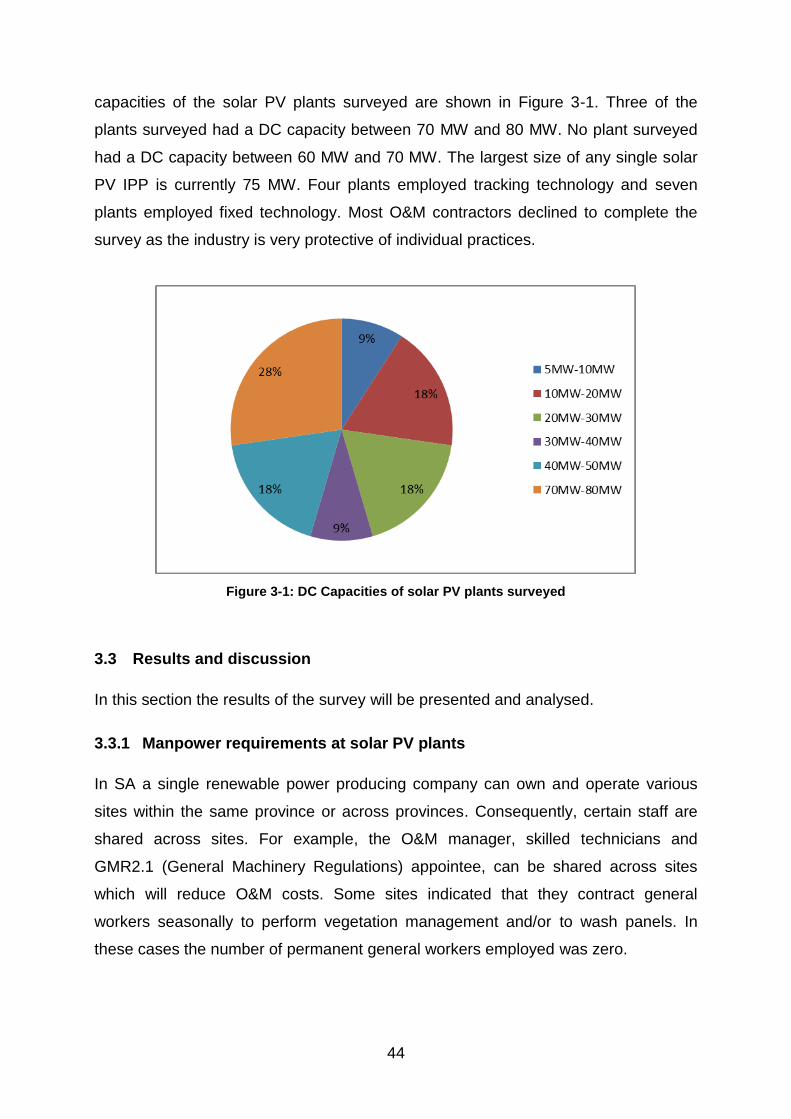
44
capacities of the solar PV plants surveyed are shown in Figure 3-1. Three of the
plants surveyed had a DC capacity between 70 MW and 80 MW. No plant surveyed
had a DC capacity between 60 MW and 70 MW. The largest size of any single solar
PV IPP is currently 75 MW. Four plants employed tracking technology and seven
plants employed fixed technology. Most O&M contractors declined to complete the
survey as the industry is very protective of individual practices.
Figure 3-1: DC Capacities of solar PV plants surveyed
3.3 Results and discussion
In this section the results of the survey will be presented and analysed.
3.3.1 Manpower requirements at solar PV plants
In SA a single renewable power producing company can own and operate various
sites within the same province or across provinces. Consequently, certain staff are
shared across sites. For example, the O&M manager, skilled technicians and
GMR2.1 (General Machinery Regulations) appointee, can be shared across sites
which will reduce O&M costs. Some sites indicated that they contract general
workers seasonally to perform vegetation management and/or to wash panels. In
these cases the number of permanent general workers employed was zero.

45
Table 3-2 shows the number of persons employed at the various sites surveyed
based on the DC capacity of the plant. The total amount of persons on site excludes
security staff. All plants had security staff on duty 24-hours a day. The number of
employees employed full time varies according to the plant size and whether general
workers are contracted or not.
Table 3-2: Personnel requirements at solar PV plants
DC Size
70M
W-8
0M
W
70M
W-8
0M
W
70M
W-8
0M
W
40M
W-
50
MW
40M
W –
50
MW
5050
50
MW
30M
W –
40
MW
20M
W –
30
MW
20M
W –
30
MW
10M
W –
20
MW
10M
W –
20
MW
5M
W –
10M
W
Total amount of employees for O&M
25 25 50 8 8 25 9 9 10 4 3
Electricians 5 5 3 4 4 3 2 3 2 2 2
Technicians 5 5 12 4 2 8 1 0 2 1 0
Plant controller/operators 4 3 2 0 2 1 0 0 2 1 1
General workers 5 5 33 0 0 13 6 6 4 0 0
A good industry standard is one permanent person employed for every 3 MW DC
installed. For plants smaller than 50 MW staff tend to be more multi-skilled. For
example, an electrician can maintain the DC plant, HV plant, SACDA systems,
compile reports and even operate in a 5 MW to 10 MW plant.
All eleven solar PV plants surveyed had contracts for O&M. This means that owners
of PV plants had contracts in place with experienced O&M providers rather than
employing and managing their own O&M personnel. Six of the solar IPPs surveyed
shared the GCC (Government Certificate of Competency) engineer between sites.
3.3.2 Common faults at utility scale PV plants
Respondents were asked to choose three of the most common faults experienced on
the solar PV plant. The results (Figure 3-2) indicate that 28% of the faults
experienced were communication problems between devices and 23% of faults were
due to inverters. Although four of the 11 Solar PV plants had trackers, none of these

46
plants reported that faulty inclinometers are common faults, and only one reported on
the tracker system itself being a common fault. The AC system was not reported as a
common fault.
Figure 3-2: PV plant common faults
Figure 3-3 indicates that the most common defects experienced with solar modules
were cracked glass, hot spots and snail tracks.

47
Figure 3-3: PV module defects
To mitigate long down time, 10 of the participating IPPs keep between 0.06% to 2.5%
of total modules installed as spare parts. The average percentage spare modules
kept for the 10 plants (that responded to this question) is approximately 1% as shown
in Figure 3-4. Because module manufacturers could go out of business, a stock of
spares is necessary to ensure that the plant remains in production for at least 25
years. None of the 11 IPPs that participated reported that blown diodes or
delamination was a common defect. One participant reported that blown diodes in
the junction box was a problem in a commercial-scale fixed ground-mounted PV
plant where the modules were placed in landscape rather than in the usual portrait
orientation. In this case, dirt accumulated at the bottom of the panel due to the panels
not being washed during the dry autumn to winter months on the Highveld. Due to
the presence of the dirt accumulation at the bottom of the panel, only one diode
permanently conducted within the junction box, which resulted in its failure.
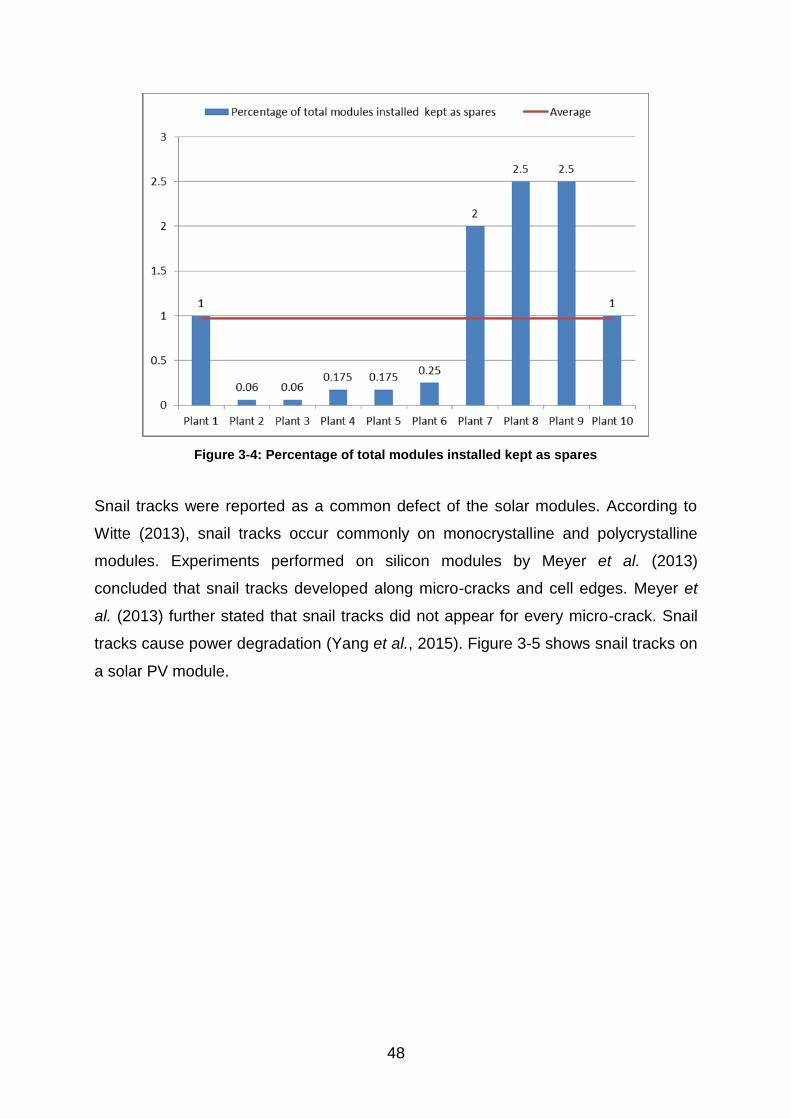
48
Figure 3-4: Percentage of total modules installed kept as spares
Snail tracks were reported as a common defect of the solar modules. According to
Witte (2013), snail tracks occur commonly on monocrystalline and polycrystalline
modules. Experiments performed on silicon modules by Meyer et al. (2013)
concluded that snail tracks developed along micro-cracks and cell edges. Meyer et
al. (2013) further stated that snail tracks did not appear for every micro-crack. Snail
tracks cause power degradation (Yang et al., 2015). Figure 3-5 shows snail tracks on
a solar PV module.

49
Figure 3-5: Snail tracks
Source: Bimble Solar (2012))
The 11 respondents reported that the most common faults on the central inverters
were related to ‘other’, matrix/IGBT, DC contactor and power supply circuitry as
shown in Figure 3-6. None of the respondents reported that cooling fans were giving
problems as yet. However, according to the maintenance requirements of central
inverters, cooling fans should be changed typically once every five years. The fact
that most respondents selected ‘other’ as one of the most common faults in the
inverter indicates that the questionnaire did not cover all the faults that can occur
within an inverter. The inverter consists of many internal components, and requires a
skilled inverter technician for repairs.

50
Figure 3-6: Inverter faults
The average number of central inverters kept on site was approximately two inverters
as shown in Figure 3-7. Some IPPs kept four units as spares and one IPP kept no
spare central inverter. Eight of the 11 IPPs have extended warranty agreements with
inverter manufacturers. The standard warranty period is 5 years; owners of the IPPs
in this study had extended the warranty period to 10 years or more.
Figure 3-7: Number of spare inverters
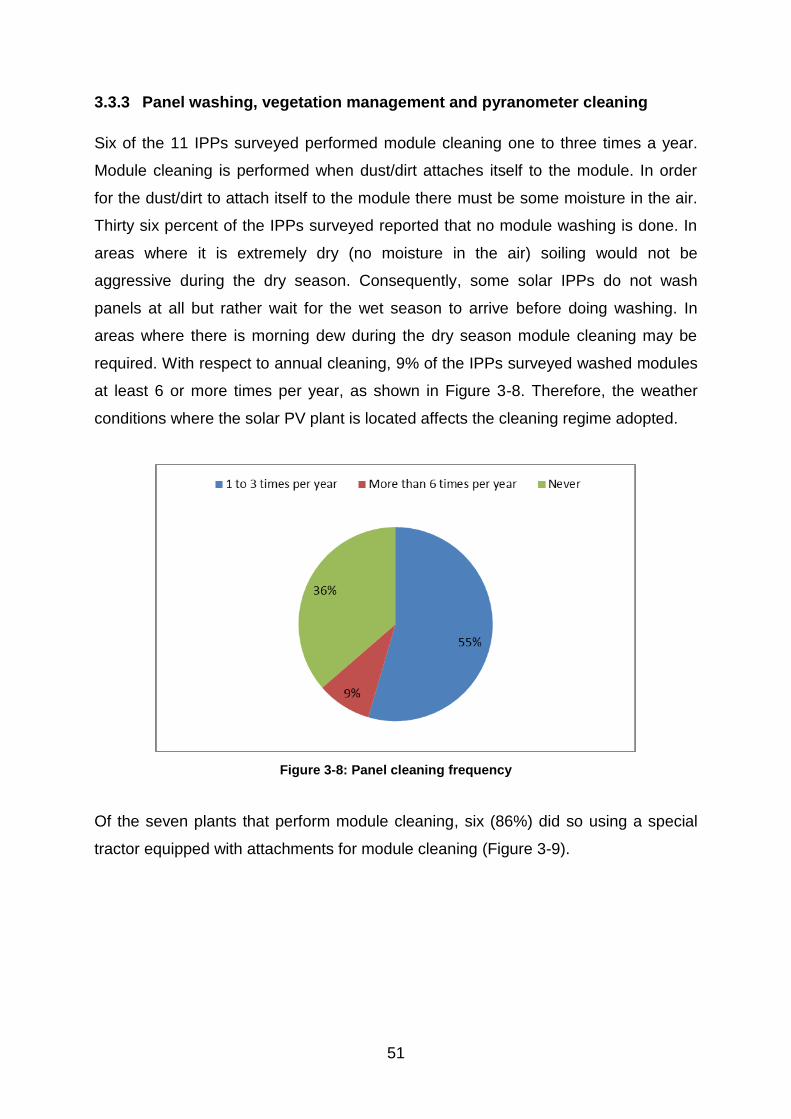
51
3.3.3 Panel washing, vegetation management and pyranometer cleaning
Six of the 11 IPPs surveyed performed module cleaning one to three times a year.
Module cleaning is performed when dust/dirt attaches itself to the module. In order
for the dust/dirt to attach itself to the module there must be some moisture in the air.
Thirty six percent of the IPPs surveyed reported that no module washing is done. In
areas where it is extremely dry (no moisture in the air) soiling would not be
aggressive during the dry season. Consequently, some solar IPPs do not wash
panels at all but rather wait for the wet season to arrive before doing washing. In
areas where there is morning dew during the dry season module cleaning may be
required. With respect to annual cleaning, 9% of the IPPs surveyed washed modules
at least 6 or more times per year, as shown in Figure 3-8. Therefore, the weather
conditions where the solar PV plant is located affects the cleaning regime adopted.
Figure 3-8: Panel cleaning frequency
Of the seven plants that perform module cleaning, six (86%) did so using a special
tractor equipped with attachments for module cleaning (Figure 3-9).

52
Figure 3-9: Module cleaning method
The water used for cleaning is mainly sourced from a bore hole together with a
reverse osmosis plant as shown in Figure 3-10. Since most solar IPPs are located in
the Northern Cape which is sparsely populated and dry, it makes sense that the
source of water is bore holes. All plants surveyed made use of reverse osmosis
plants whether the source was from bore holes or from municipalities. The reverse
osmosis plant removes ions and particles from the water which prevents scaling and
residue forming on the washed panels.
Figure 3-10: Source of water
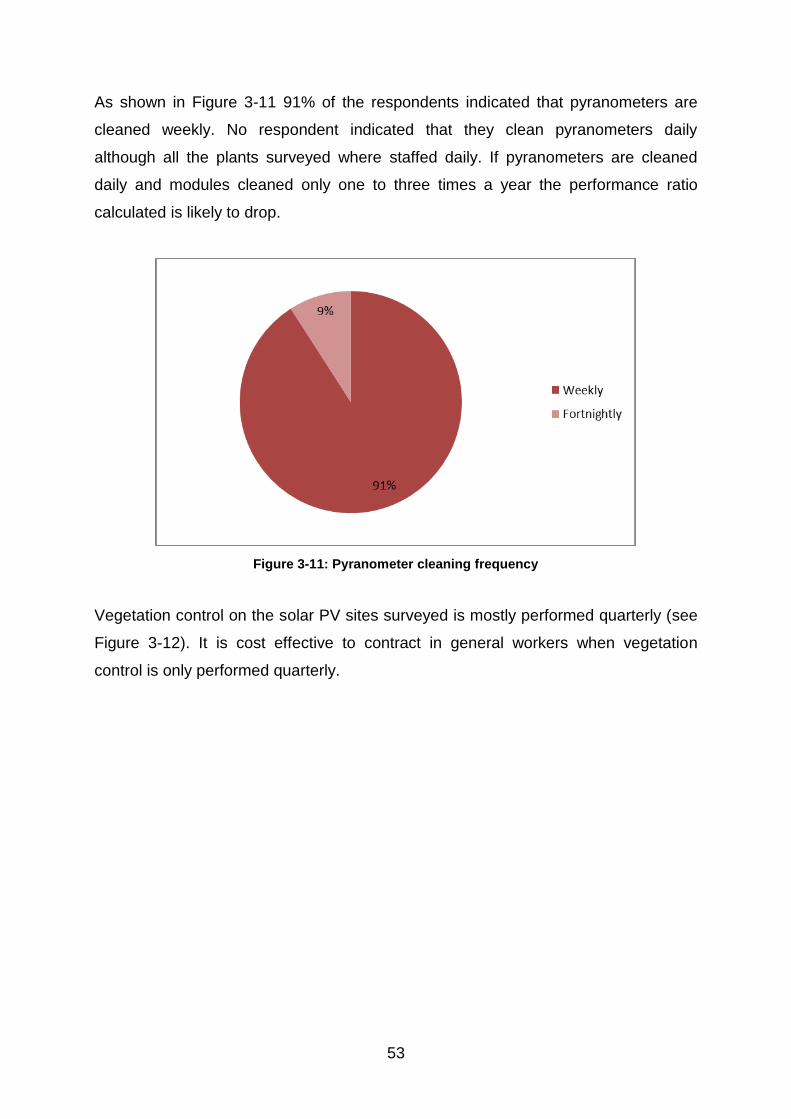
53
As shown in Figure 3-11 91% of the respondents indicated that pyranometers are
cleaned weekly. No respondent indicated that they clean pyranometers daily
although all the plants surveyed where staffed daily. If pyranometers are cleaned
daily and modules cleaned only one to three times a year the performance ratio
calculated is likely to drop.
Figure 3-11: Pyranometer cleaning frequency
Vegetation control on the solar PV sites surveyed is mostly performed quarterly (see
Figure 3-12). It is cost effective to contract in general workers when vegetation
control is only performed quarterly.
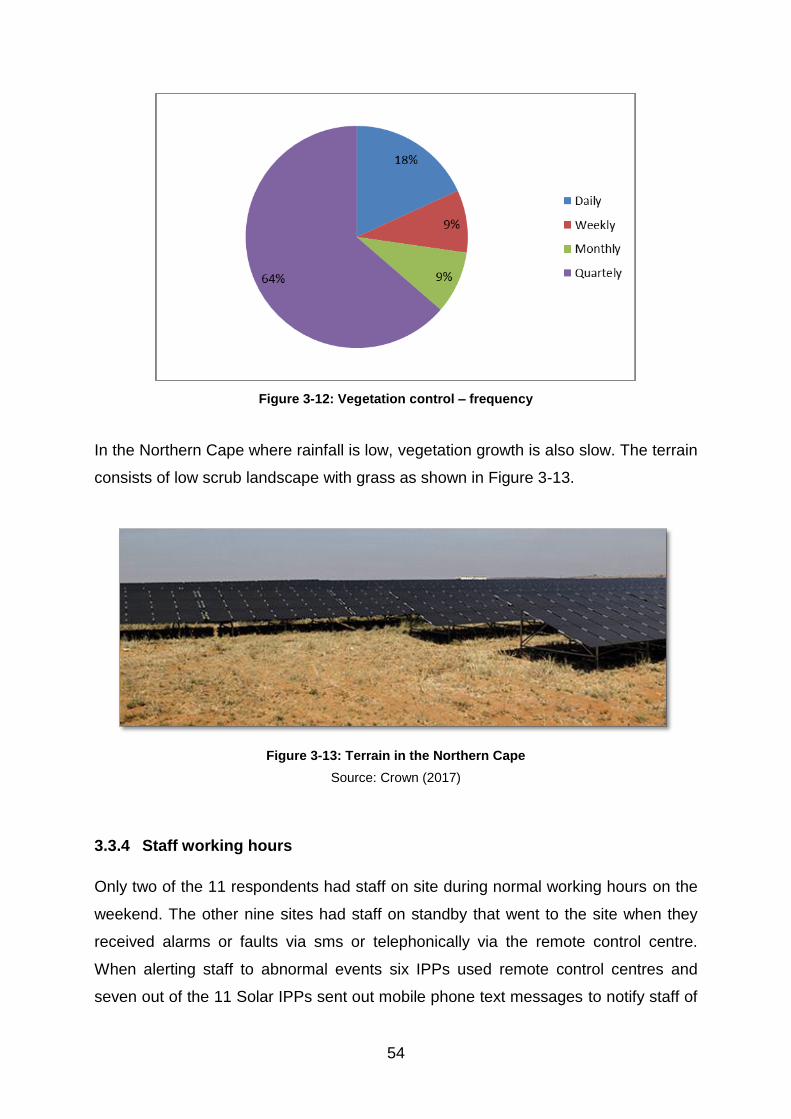
54
Figure 3-12: Vegetation control – frequency
In the Northern Cape where rainfall is low, vegetation growth is also slow. The terrain
consists of low scrub landscape with grass as shown in Figure 3-13.
Figure 3-13: Terrain in the Northern Cape
Source: Crown (2017)
3.3.4 Staff working hours
Only two of the 11 respondents had staff on site during normal working hours on the
weekend. The other nine sites had staff on standby that went to the site when they
received alarms or faults via sms or telephonically via the remote control centre.
When alerting staff to abnormal events six IPPs used remote control centres and
seven out of the 11 Solar IPPs sent out mobile phone text messages to notify staff of

55
alarms or trips. All plants surveyed had staff on standby daily. Figure 3-14 shows that
six plants had staff working eight hours a day. No employee at any plant worked less
than eight hours a day. Four plants had staff working eight to 10 hours per day. One
plant had staff on site up to 12 hours per day.
Figure 3-14: Daily working hours
3.3.5 Other O&M practices
The survey results indicated that all solar PV IPPs that participated performed
infrared thermography on the solar modules. Roughly 60% of respondents replied
that O&M costs per year were less than 1% of the total EPC cost for the solar PV
plant (see Figure 3-15). The other 40% of respondents replied than O&M costs per
annum were greater than 1% of total EPC costs.

56
Figure 3-15: O&M costs per year – percentage of total EPC cost
Figure 3-16 shows that the price of constructing a utility scale PV plant is dropping
annually all over the world. According to Wesoff and Lacey (2017), the fall in cost is
due to the decreasing price of tracker systems, modules, inverters and labour costs.
Since EPC costs are declining the pressure will also be on O&M costs to decline.
Figure 3-16: Historical and forecasted utility PV system pricing
Source: Wesoff and Lacey (2017)

57
As shown in Figure 3-17, 55% of the respondents indicated that the annual
performance ratio of the PV plants was between 79% and 82%and 36% indicated
that the annual performance ratio was greater than 82%. This indicates that 91% of
the respondents have PRs greater than 79%.
Figure 3-17: Annual performance ratio
Only two plants responded to the question “Which costs more: the property insurance
against damage or the liability insurance to protect workers?” These respondents
indicated that property insurance costs more than liability insurance. The reason for
the poor response to this question could be because property insurance is handled
by the owner/project developer and liability insurance is handled by the O&M
contractors, and the surveys were issued to the O&M contractors. However, all
responded to the question “What percentage of annual O&M expense do insurance
premiums account for?” The results indicate that 91% of respondents incur annual
insurance premium costs of between 15% and 25% of total annual O&M cost (Figure
3-18).
9%
55%
36% <75%
79% to 82%
>82%
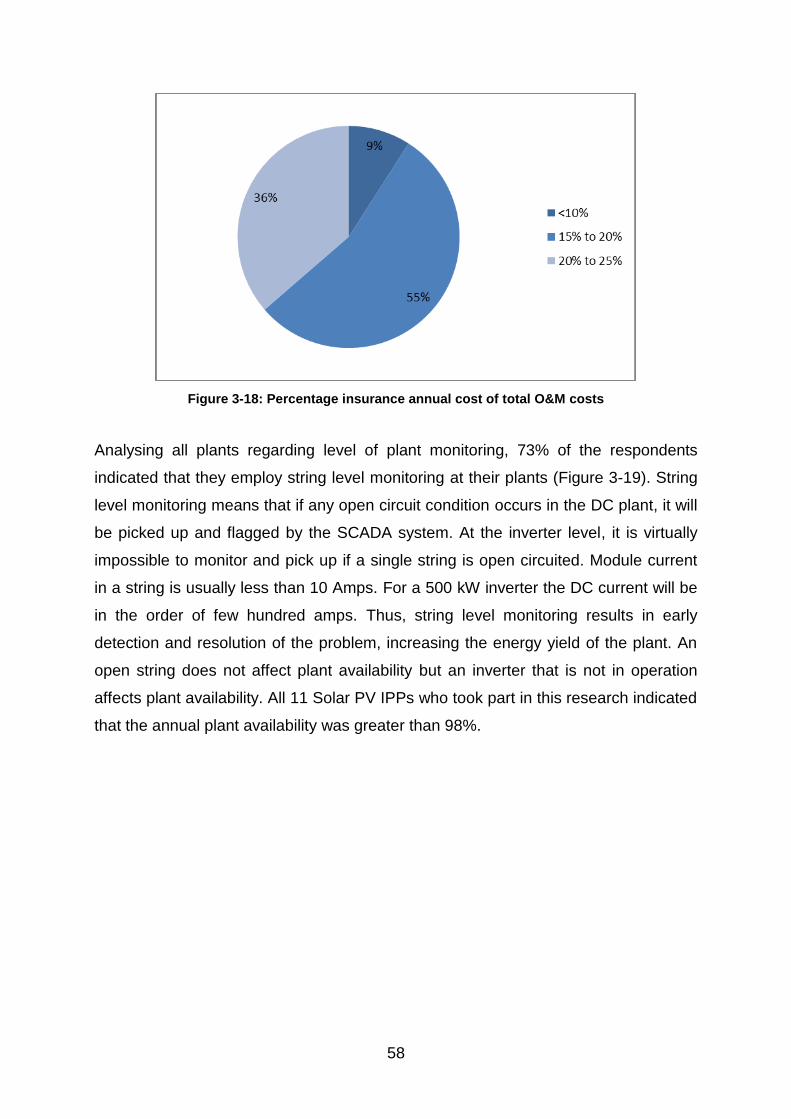
58
Figure 3-18: Percentage insurance annual cost of total O&M costs
Analysing all plants regarding level of plant monitoring, 73% of the respondents
indicated that they employ string level monitoring at their plants (Figure 3-19). String
level monitoring means that if any open circuit condition occurs in the DC plant, it will
be picked up and flagged by the SCADA system. At the inverter level, it is virtually
impossible to monitor and pick up if a single string is open circuited. Module current
in a string is usually less than 10 Amps. For a 500 kW inverter the DC current will be
in the order of few hundred amps. Thus, string level monitoring results in early
detection and resolution of the problem, increasing the energy yield of the plant. An
open string does not affect plant availability but an inverter that is not in operation
affects plant availability. All 11 Solar PV IPPs who took part in this research indicated
that the annual plant availability was greater than 98%.
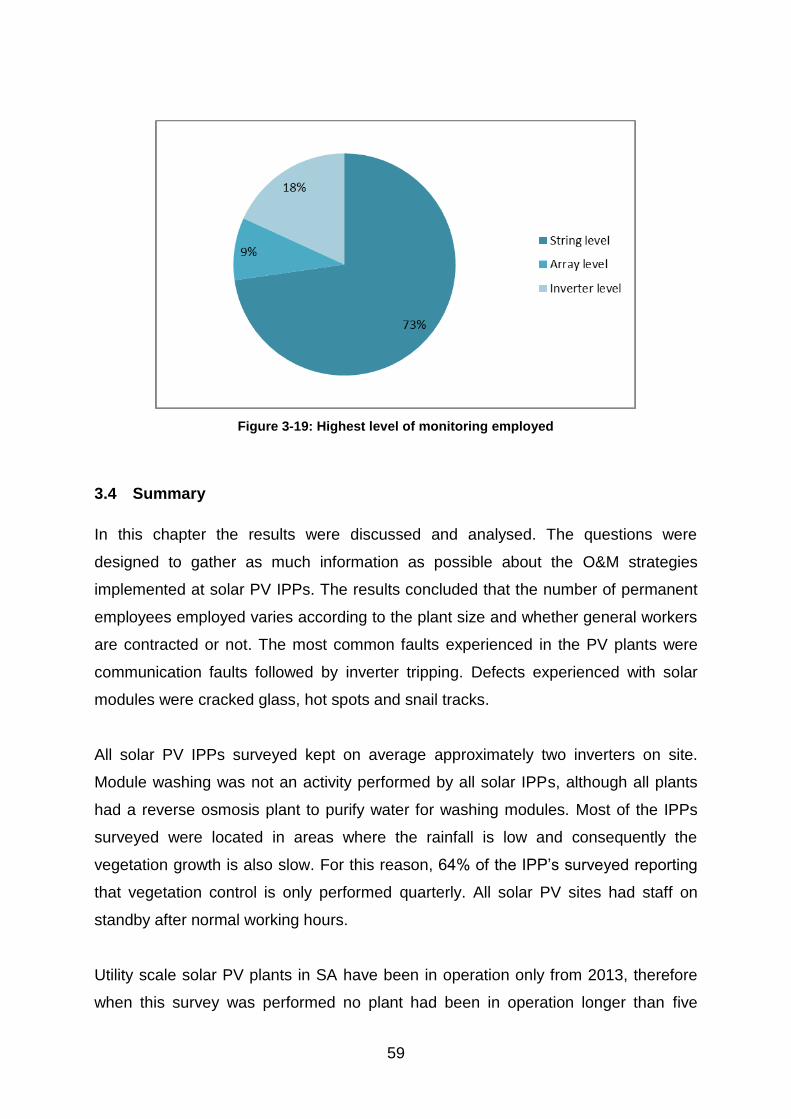
59
Figure 3-19: Highest level of monitoring employed
3.4 Summary
In this chapter the results were discussed and analysed. The questions were
designed to gather as much information as possible about the O&M strategies
implemented at solar PV IPPs. The results concluded that the number of permanent
employees employed varies according to the plant size and whether general workers
are contracted or not. The most common faults experienced in the PV plants were
communication faults followed by inverter tripping. Defects experienced with solar
modules were cracked glass, hot spots and snail tracks.
All solar PV IPPs surveyed kept on average approximately two inverters on site.
Module washing was not an activity performed by all solar IPPs, although all plants
had a reverse osmosis plant to purify water for washing modules. Most of the IPPs
surveyed were located in areas where the rainfall is low and consequently the
vegetation growth is also slow. For this reason, 64% of the IPP’s surveyed reporting
that vegetation control is only performed quarterly. All solar PV sites had staff on
standby after normal working hours.
Utility scale solar PV plants in SA have been in operation only from 2013, therefore
when this survey was performed no plant had been in operation longer than five

60
years. Ninety one percent of the respondents reported annual PRs greater than 79%.
It is expected that the PR will eventually drop as the module degrades. Annual
insurance costs for the PV plant is typically between 15% and 25% of total annual
O&M cost. The annual plant availability for all 11 solar PV IPPs who took part in this
research was greater than 98%.

61
CHAPTER 4: CONCLUSIONS AND RECOMMENDATIONS
4.1 Conclusion and recommendations
Based on the results of the survey the following are best practices for O&M in SA.
1. Due to economies of scale the larger the plant the lower the O&M cost per MW
installed. An O&M company that performs work at various sites can lower costs by
sharing staff between sites. A GCC engineer is an expensive and statutory
requirement and should be shared between sites. Multi-skilled and self-motivated
staff are required for O&M activities in solar PV plants. The number of employees per
site depends on the installed DC capacity of the plant. Table 4-1 shows the
recommended number of employees required per site. Teams consisting of two
people are recommended for rectifying faults in a PV plant. Each team must have a
van for transport and to convey panels, etc. Statutory appointments must be in place.
If panel washing and vegetation control is not conducted monthly, then the number of
permanent general staff can decrease.
Table 4-1: Recommended number of staff per PV site
10MW 20MW 40MW 50MW 70MW 100MW
Technical Operators
4 6 10 12 16 20
General Workers
2 3 5 6 8 10
Total 6 9 15 18 24 30
The duties of the technical operators will be as follows:
Fault finding on all systems in a PV plant;
Maintenance of all systems in a PV plant;
Commissioning of equipment; and
Report writing and operating.
The duties of the general workers will be as follows:
Vegetation management;
Cleaning of panels and other equipment; and
Assisting with all other manual tasks such as panel replacement, etc.
62
2. The plant must have 24-hour security staff. The perimeter around the solar plant
must have at least a two-tier fence. The inner fence must be an electric fence.
Lighting around the perimeter will assist guards whilst doing foot patrols.
3. Owners of solar IPP PV plants should use contractors for the O&M of their plants.
If a utility has more that 100MW installed DC capacity then in-house maintenance
should be exercised (Patel, 2016)
4. The most common faults in the PV plant were due to communication networks and
inverters. This means that electricians/technicians must be skilled in these areas.
The EPC contractor will have experience in commissioning the inverters and
communication systems and this make them ideal candidates for O&M contracts.
The inverter OEM is also an ideal candidate for O&M contracts. Having a skilled
inverter technician trained by the OEM or from the OEM is critical in operating solar
PV plants. As shown in Figure 2-1, inverter faults are the most common issue in solar
PV plants. Maintaining a good relationship with the manufacturer of the inverter is
recommended.
5. Approximately 1% of total modules installed must be kept as spares. PPA
contracts are for 20 years but the module warranty is for 25 years.
6. Cracked glass, snail tracks and hot spots were the most common module faults.
Here the quality of the panel and care during shipping is vital. Batch
electroluminescence testing is recommended to test the quality of panels after
production. This test shows faults in the panels such as micro surface cracks, cell
damage and sub-standard welds that are not visible to the naked eye.
7. It is recommended that at least two complete central inverters be kept as spares,
because manufacturers could change their design or go out of business.
Furthermore, the extended warranty of the inverters should be exercised beyond the
standard 5 years. In the design of the inverter room/cabin one must ensure that the
hot air from the inverter is extracted outside of the room/cabin.

63
8. Frequency of module washing and vegetation control is site specific. Weather
affects module soiling and vegetation growth. Module cleaning should be performed
with a tractor equipped with attachments for washing modules. In SA reverse
osmosis plants are recommended to purify water for washing panels.
9. Pyranometers should be cleaned weekly. Early morning dew on pyranometers can
influence readings.
10. The plant must be remotely monitored 7 days a week during normal working
hours. Site staff should work 5 days a week, 8 hours per day. A team of two persons
should be on standby every week, including the weekend. Mobile phone text
messages must be sent to staff to notify them of trips and alarms.
11. Infrared thermography must be performed on the solar modules.
12. The annual performance ratio of a solar plant should be above 79%, at least for
the first 5 years. Annual availability of a plant should be 98% or above.
13. The O&M Manager must ensure that staff maintain the document management
system. Documents such as proof of maintenance, commissioning report and
invoices are required for warranty claims. The cost of shipping faulty modules to the
manufacturer and the cost of shipping the replacement modules is not paid by the
module manufacturer in most cases. Therefore sourcing PV modules from the
closest Tier 1 manufacturer is important.
This research has provided valuable insights into the world of solar PV plant O&M in
SA. The use of solar panels to generate electricity will continue to grow as the world
becomes more concerned about climate change. Solar panel efficiencies will
increase over time and together with advancement in battery storage technology will
cause people to go off grid and utilities to lean more towards renewable energy
sources. Solar PV O&M cost is the lowest amongst all renewable energy
technologies (Patel, 2016)

64
4.2 Achievement of the objectives of the study
The objective of this study was to unlock the maintenance activities and knowledge
required to operate and maintain a utility scale solar PV plant. The O&M of utility
scale solar PV plants is a relatively new activity in SA. Common strategies for solar
O&M were presented and discussed as obtained from the questionnaires returned by
solar PV O&M managers. The most common inverter faults, module faults and skills
required to operate and maintain a utility scale PV plant were determined and
presented. This research has detailed the activities and knowledge required to
operate and maintain a utility scale solar PV plant.
4.3 Recommendations of future research
When at least 10 years of operation of solar IPPs in South Africa has been achieved,
this research should be conducted again to determine which faults PV plants are
experiencing. What will be the failure and degradation rate of modules? Only time will
tell if modules will actually degrade according to manufacturer’s specifications.
Currently it seems that the annual power degradation of the modules is low, but this
could change.
Will the O&M cost per MW increase or decrease? Will the inverter manufacturers still
be in business? Most inverter manufacturers state that it is more cost effective to
replace the inverter completely after 15 years (Briones & Blasé, 2011). The question
to be asked after 15 years of operation is whether inverters were replaced or what
components have been replaced. String inverters fail more often than central
inverters (Patel, 2016), but will this still be the case in the future.
Will the PV module manufacturer still be in business to honour warranties? These are
questions that can only be answered after the industry has gained more experience
in maintaining inverters and solar modules. Solar PV IPPs who are currently waiting
for a PPA from Eskom will be given a contract not exceeding 77 cents/kWh
(Creamer, 2017). Therefore, O&M costs will be under pressure and an O&M strategy
will be key to keep operating costs as low as possible. The O&M strategy must
consider the number of staff employed, skill levels of staff, warranties of equipment,
spares kept on site, vegetation control, module washing frequency etc.

65
REFERENCES
Ameta, S.C. & Ameta, R. 2016. Solar energy conversion and storage. Boca Raton,
FL: CRC Press.
Beetz, B. 2015. LCOE for renewables decreases, fossil fuels see increase.
https://www.pv-magazine.com/2015/10/06/lcoe-for-renewables-decreases-fossil-
fuels-see-increase_100021404/ Date of access: 01 Oct 2016.
Bimble Solar. 2012. 175w-snail-trails. http://www.bimblesolar.com/image
/data/solar/175w-snail-trails-2.jpg Date of access: 30 September 2017.
Brearley, D. 2016. Fielded PV module reliability and durability. Solar Pro, 9(1):20-
30.
Briones, J.& Blasé, N. 2015. Critical factors and opportunities in solar power
electronics: perspectives from Ontario industry players. Toronto: MaRS Discovery
District.
Bryman, A. & Bell, E. 2015. Research methodology: business and management
contexts. 3rd ed. Cape Town: ABC Press.
Cambell, M. 2008. The drivers of the levelized cost of electricity for utility-scale
photovoltaics. San Jose, CA: SunPower Corporation.
Creamer, T. 2017. Caution creeps in as renewables industry digests implications of
77c/kWh tariff cap. http://www.engineeringnews.co.za/article/caution-creeps-in-as-
renewables-industry-digests-implications-of-77ckwh-tariff-cap-2017-09-04 Date of
access: 21 October 2017.
Crown. 2017. Solar plants in Northern Cape and Free State: in commercial
operation. http://crown.co.za/latest-news/electricity-control-latest-news/3907-solar-
plants-in-northern-cape-and-free-state-in-commercial-operation Date of access: 9
September 2017.
EDP Renovaveis. 2013. O&M procedures: water management for module cleaning.
http://poland.edpr.com/sites/default/files/portal.edpr/documents/expr-glb_tsom-spv-
66
00025-om-procedure-for-pv-water-management-for-module-cleaning.pdf Date of
access: 6 September 2016.
Enbar, N. & Weng, D. 2015. Budgeting for solar PV plant operation and
maintenance: practices and pricing. EPRI White Paper. Palo Alto, CA: Electric
Power Research Institute.
Energy Sage. 2015. What to know about a solar panel warranty.
http://news.energysage.com/ shopping-solar-panels-pay-attention-to-solar-panels-
warranty/ Date of access: 15 September 2016.
Enbar, N. & Key, T. 2010. Addressing solar photovoltaic operations and
maintenance challenges: a survey of current knowledge and practices. EPRI White
Paper. Palo Alto, CA: Electric Power Research Institute.
Energyblog. 2017. Project search. http://www.energy.org.za/knowledge-
tools/project-database Date of access: 9 September 2017.
ESI Africa. 2015. IPP growth thriving in South Africa. http://www.esi-
africa.com/news/ipp-growth-thriving-in-south-africa/ Date of access: 17 Feb. 2016.
Eskom. 2016. The International Climate Change Negotiations: COP 22 Report.
Sunninghill, Sandton. (Unpublished)
Home CSP. 2017. Single axis. https://www.homecsp.com/singleaxis Date of
access: 1 October 2017.
Lumby, B. & McLean, V. 2015. Utility-scale solar photovoltaic power plants: a
project developer’s guide. Washington, DC: International Finance Corporation.
Moses, R., Straubenmueller, O. & Johannes, M. 2015. Commercial rooftop solar:
getting it right! Johannesburg: Hannover Re. http://www.sapvia.co.za/wp-
content/uploads/2015/07/150723-Presentation-Commercial-Rooftop-Solar_final4.pdf
Date of access: 29 Sep. 2016
Miller, A. & Lumby, B. 2012. Utility scale solar power plants: a guide for developers
and investors. New Delhi, India: International Finance Corporation.
67
Independent Entrepreneurship Group. 2015. Fixing our energy crisis.
http://ineng.co.za/fixing-our-energy-crisis/ Date of access: 23 January 2016.
Infinite Energy. 2016. Solar blog. Tier 1 solar panels: what does it really mean?
https://www.infiniteenergy.com.au/the-truth-about-tier-1-solar-panels Date of access:
10 April 2017.
Internal Revenue Service (USA). 2017. Yearly average currency exchange rates.
https://www.irs.gov /individuals/international-taxpayers/yearly-average-currency-
exchange-rates Date of access: 9 September 2017.
International Renewable Energy Agency (IRENA). 2017. Rethinking energy 2017:
accelerating the global energy transformation. Abu Dhabi.
Jager-Waldau, A. 2016. PV Status Report. Ispra, Italy: Joint Research Centre
(JRC), European Commission.
Jordan, D.C. & Kurtz, S.R. 2012. Photovoltaic degradation rates: an analytical
review. Golden, CO: National Renewable Energy Laboratory, US Department of
Energy.
Kamenopoulos, S.N. & Tsoutsos, T. 2015. Assessment of the safe operation and
maintenance of photovoltaic systems. Energy, 93(2):1633-1638.
Madhlopa, A., Keen, S., Sparks, D., Moorlach, M. & Dane, A. 2013. Renewable
energy choices and water requirements in South Africa. Report for the Water
Research Commission. Cape Town: Energy Research Centre, University of Cape
Town.
Maehlum, M.A. 2015. Which solar panel type is best: mono- vs. polycrystalline vs.
thin film. http://energyinformative.org/best-solar-panel-monocrystalline-
polycrystalline-thin-film/ Date of access: 4 September 2016.
Meyer, S., Richter, S., Timmel, S., Glaser, M., Werner, Martina., Swatek, S. &
Hagendorf, C. 2013. Snail trails: root cause analysis and test procedures. Energy
Procedia, 38:498-505.
Milazi, D. & Bischof-Niemz, T. 2015. Update on the REIPPPP, clean coal, nuclear,
natural gas. Sustainable Energy Resource Handbook, vol 6.

68
https://issuu.com/alive2green/docs/sustainable_energy_resource_handboo_51306b7
ac57b0b Date of access: 4 September 2016.
Multirotor. 2017. Thermography. https://www.multirotor.net/en/applications/
thermography Date of access: 23 January 2017.
Missouri Wind and Solar (MWANDS). 2017. Solar panel timed tracker system.
http://mwands.com/store/solar-panel-timed-tracker-system Date of access: 23
January 2017.
Naicker, K. 2015. Training manual for the operation and maintenance of solar PV
plants. Eskom Group Technology. Sandton, SA. (Unpublished).
National Energy Regulator of South Africa (NERSA). 2016. http://www.
nersa.org.za/Admin/Document/Editor/file/Electricity/SustainableEnergy/MONITORIN
G%20RE%20PERFORMANCE%20ISSUE%207%20APRIL_2016.pdf Date of
access: 29 October 2016.
Norton Rose Fullbright. 2015. Financing African solar PV projects.
http://www.nortonrosefulbright.com/knowledge/publications/134660/financing-african-
solar-pv-projects Date of access: 17 October 2017.
Patel, S. 2016. Solar PV O&M best practices in a rapidly changing market. Power,
160. http://www.powermag.com/solar-pv-om-best-practices-rapidly-changing-market/
Date of access: 29 October 2017.
Paul, E. & Bray, D. 2012. Evolution of solar operating practices: advanced O&M
benefits from module-level monitoring. Palo Alta, CA: AltaTerra Research Network.
PV Insider. 2016a. PV in South Africa: project map. http://www.pv-
insider.com/africa/ Date of access: 25 February 2016.
PV Insider. 2016b. USA PV O&M technology monitor 2016. http://events.
newenergyupdate.com/pv-usa/solar-operations-maintenance-technology-monitor-
2016.php Date of access: 5 October 2016.
Quinton Green Freak. 2012. Solar power and solar irradiation in South Africa.
https://quintongreenfreak.wordpress.com/2012/06/04/solar-power-and-solar-
irradiation-in-south-africa-2/ Date of access: 8 July 2017.
69
Reaugh, B., Beckensten, R., Gross, D. & Brearley, D. 2017. SCADA systems for
large-scale PV plants. Solar Pro, 10(3):18-32.
Relancio, J. & Recuero. L. 2010. Photovoltaic systems training: session 4 ‐ plant
maintenance. Generalia Group & Leonardo Energy.
REW. 2009. MEMC To Acquire SunEdison for US $200M.
http://www.renewableenergyworld.com/articles/2009/10/memc-to-acquire-sunedison-
for-us-200m.html Date of access: 22 March 2018
Solarpraxis & Sunbeam. 2013. Inverter, storage and PV system technology. Berlin:
Solarpraxis AG.
Chestney, N. 2015. Onshore wind, solar more competitive with gas, coal-research.
https://af.reuters.com/article/africaTech/idAFL5N1222KX20151006 Date of access:
01 October 2016.
Rochas, A.F. 2016. US solar groups advance soiling analysis to reduce seasonal
risks. New Energy Update: PV. http://www.newenergyupdate.com/pv-insider/us-
solar-groups-advance-soiling-analysis-reduce-seasonal-risks Date of access: 18
January 2017.
Rycroft, M. 2016. Solar PV module faults and failings.
http://www.ee.co.za/article/solar-pv-module-faults-failings.html Date of access: 10
April 2017.
Scott Madden. 2010. Solar photovoltaic plant operating and maintenance costs.
https://www.scottmadden.com/insight/solar-photovoltaic-plant-operating-and-
maintenance-costs/ Date of Access: 12 September 2016.
Seaward Solar. 2012. Photovoltaic system commissioning and testing: a guide for
PV system technicians and engineers. http://www.seaward-groupusa.com/userfiles
/lp-downloads/PV%20System%20 Commissioning%20and%20Testing%20Guide.pdf
Date of access: 26 June 2014.
Shrestha, S. & Taylor, M. 2016. Soiling assessment in large-scale PV arrays. Solar
Pro, 9(6):21-32.

70
Solar Century. 2014. Grid parity. http://www.solarcentury.com/za/solar-
century/4273-2/ Date of access: 24 June 2016.
Solar Choice. 2009. Which solar panel type best suits your needs: monocrystalline,
polycrystalline or amorphous thin film? http://www.solarchoice.net.au/blog/which-
solar-panel-type-best-suits-your-needs-monocrystalline-polycrystalline-or-
amorphous-thin-film/ Date of access: 4 September 2016.
Solar Power Europe. 2016. O&M best practices guidelines: version 1.0. Brussels:
European Photovoltaic Industry Association.
Solar Server. 2013. Solar energy system of the month: Sarnia- the largest
operational PV plant in the world. http://www.solarserver.com/solar-magazine/solar-
energy-system-of-the-month/sarnia-the-largest-operational-pv-plant-in-the-world.html
Date of access: 25 March 2017.
South Africa. Department of Energy. 2014. Renewable Energy IPP Procurement
Programme (REIPPPP) for South Africa. Pretoria: Government Printer.
Spear, B., Mendelsohn, M. & Cory, K. 2010. Insuring Solar Photovoltaics: Challenges
and Possible Solutions. Golden, CO: National Renewable Energy Laboratory
(NREL), US Department of Energy.
Stolte, W.J. 2010. Engineering and economic evaluation of central-station solar
photovoltaic power plants. EPRI Technical Report. Palo Alto, CA: Electric Power
Research Institute.
Golnas, T. 2011. Owner/operator perspective on reliability customer needs and field
data. Sandia National Laboratories Utility-Scale Grid-Tied PV Inverter Reliability
Technical Workshop. http://energy.sandia.gov/wp-content/gallery/uploads/Golnas-
SunEdison_Operator.pdf
Tamizhmani, G. & Kuitche, J. 2013. Accelerated lifetime testing of photovoltaic
modules. Solar America Board for Codes and Standards, U.S. Department of
Energy. http://www.solarabcs.org/about/publications/reports/
acceleratedtesting/pdfs/SolarABCs-33-2013.pdf
71
Thompson, C.S. 2011. Inverter risk factors: what to consider beyond MTBF
numbers. www.eaton.com/ecm/idcplg?IdcService=GET_FILE&dID=439719 Date of
access: 19 September 2016.
Timperley, J. 2016. Lightsource unveils new solar panel cleaning technology.
https://www.businessgreen.com/bg/news/2453861/lightsource-unveils-new-solar-
panel-cleaning-technology Date of access: 19 September 2016.
Wesoff, E. & Lacey, S. 2017. Solar costs are hitting jaw-dropping lows in every
region of the world. https://www.greentechmedia.com/articles/read/solar-costs-are-
hitting-jaw-dropping-lows-in-every-region-of-the-world#gs.SZZz41E Date of access:
30 September 2017.
Whaley, C. 2016. Best practices in photovoltaic system operations and
maintenance. 2nd ed. Golden, CO: National Renewable Energy Laboratory (NREL),
US Department of Energy.
Williams, D. 2010. Large scale PV operations and maintenance. Solar Pro, 3(4):48-
52. http://solarprofessional.com/articles/operations-maintenance/large-scale-pv-
operations-and-maintenance#.WfBkMzdx3IU Date of access: 16 February 2016.
Wirth, H. 2014. Recent facts about photovoltaics in Germany. Freiburg, Germany:
Fraunhofer ISE.
https://www.ise.fraunhofer.de/content/dam/ise/en/documents/publications/studies/rec
ent-facts-about-photovoltaics-in-germany.pdf
Witte, A. 2013. Snail tracks on photovoltaic modules. http://www.data-
solar.de/snail-tracks-on-photovoltaic-modules/ Date of access: 9 September 2017.
Yang, H., Chang, J., Wang, He. & Song, D. 2015. Power degradation caused by
snail trails in urban photovoltaic energy systems. Energy Procedia, 88:422-428.
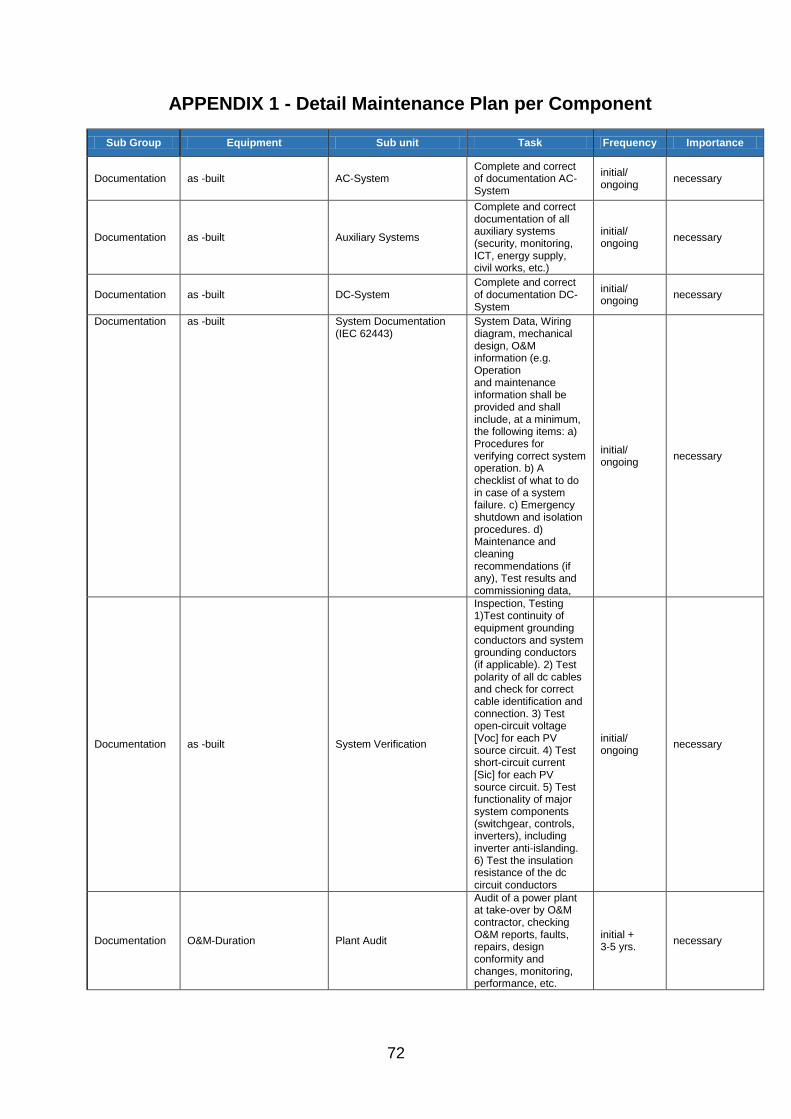
72
APPENDIX 1 - Detail Maintenance Plan per Component
Sub Group Equipment Sub unit Task Frequency Importance
Documentation as -built AC-System Complete and correct of documentation AC-System
initial/ ongoing
necessary
Documentation as -built Auxiliary Systems
Complete and correct documentation of all auxiliary systems (security, monitoring, ICT, energy supply, civil works, etc.)
initial/ ongoing
necessary
Documentation as -built DC-System Complete and correct of documentation DC-System
initial/ ongoing
necessary
Documentation as -built System Documentation (IEC 62443)
System Data, Wiring diagram, mechanical design, O&M information (e.g. Operation and maintenance information shall be provided and shall include, at a minimum, the following items: a) Procedures for verifying correct system operation. b) A checklist of what to do in case of a system failure. c) Emergency shutdown and isolation procedures. d) Maintenance and cleaning recommendations (if any), Test results and commissioning data,
initial/ ongoing
necessary
Documentation as -built System Verification
Inspection, Testing 1)Test continuity of equipment grounding conductors and system grounding conductors (if applicable). 2) Test polarity of all dc cables and check for correct cable identification and connection. 3) Test open-circuit voltage [Voc] for each PV source circuit. 4) Test short-circuit current [Sic] for each PV source circuit. 5) Test functionality of major system components (switchgear, controls, inverters), including inverter anti-islanding. 6) Test the insulation resistance of the dc circuit conductors
initial/ ongoing
necessary
Documentation O&M-Duration Plant Audit
Audit of a power plant at take-over by O&M contractor, checking O&M reports, faults, repairs, design conformity and changes, monitoring, performance, etc.
initial + 3-5 yrs.
necessary
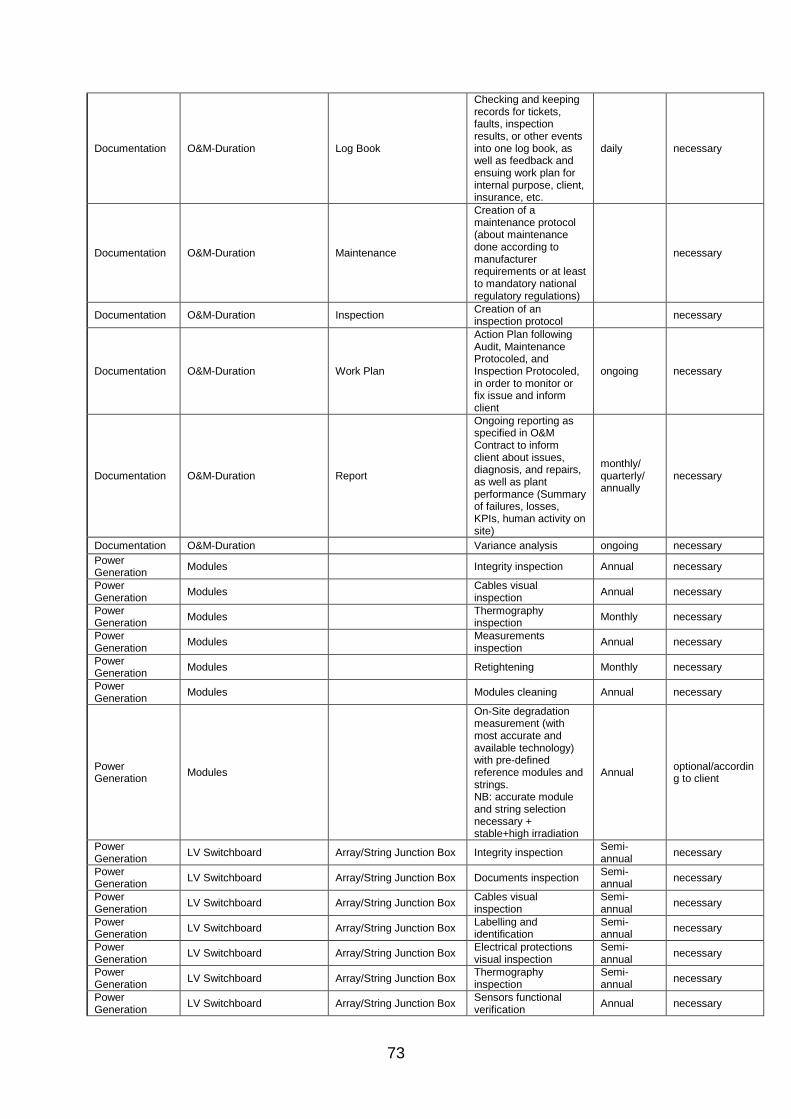
73
Documentation O&M-Duration Log Book
Checking and keeping records for tickets, faults, inspection results, or other events into one log book, as well as feedback and ensuing work plan for internal purpose, client, insurance, etc.
daily necessary
Documentation O&M-Duration Maintenance
Creation of a maintenance protocol (about maintenance done according to manufacturer requirements or at least to mandatory national regulatory regulations)
necessary
Documentation O&M-Duration Inspection Creation of an inspection protocol
necessary
Documentation O&M-Duration Work Plan
Action Plan following Audit, Maintenance Protocoled, and Inspection Protocoled, in order to monitor or fix issue and inform client
ongoing necessary
Documentation O&M-Duration Report
Ongoing reporting as specified in O&M Contract to inform client about issues, diagnosis, and repairs, as well as plant performance (Summary of failures, losses, KPIs, human activity on site)
monthly/ quarterly/ annually
necessary
Documentation O&M-Duration Variance analysis ongoing necessary
Power Generation
Modules Integrity inspection Annual necessary
Power Generation
Modules Cables visual inspection
Annual necessary
Power Generation
Modules Thermography inspection
Monthly necessary
Power Generation
Modules Measurements inspection
Annual necessary
Power Generation
Modules Retightening Monthly necessary
Power Generation
Modules Modules cleaning Annual necessary
Power Generation
Modules
On-Site degradation measurement (with most accurate and available technology) with pre-defined reference modules and strings. NB: accurate module and string selection necessary + stable+high irradiation
Annual optional/according to client
Power Generation
LV Switchboard Array/String Junction Box Integrity inspection Semi-annual
necessary
Power Generation
LV Switchboard Array/String Junction Box Documents inspection Semi-annual
necessary
Power Generation
LV Switchboard Array/String Junction Box Cables visual inspection
Semi-annual
necessary
Power Generation
LV Switchboard Array/String Junction Box Labelling and identification
Semi-annual
necessary
Power Generation
LV Switchboard Array/String Junction Box Electrical protections visual inspection
Semi-annual
necessary
Power Generation
LV Switchboard Array/String Junction Box Thermography inspection
Semi-annual
necessary
Power Generation
LV Switchboard Array/String Junction Box Sensors functional verification
Annual necessary

74
Power Generation
LV Switchboard Array/String Junction Box Measurements inspection
Semi-annual
necessary
Power Generation
LV Switchboard Array/String Junction Box Check correct operation
Semi-annual
necessary
Power Generation
LV Switchboard Array/String Junction Box Electrical protection correct operation
Semi-annual
necessary
Power Generation
LV Switchboard Array/String Junction Box Check fuse status Semi-annual
necessary
Power Generation
LV Switchboard Array/String Junction Box Monitoring operation test
Annual necessary
Power Generation
LV Switchboard Array/String Junction Box Check cables terminals Semi-annual
necessary
Power Generation
LV Switchboard Array/String Junction Box General cleaning Semi-annual
necessary
Power Generation
LV Switchboard Generator Junction Box Integrity inspection Annual necessary
Power Generation
LV Switchboard Generator Junction Box Documents inspection Annual necessary
Power Generation
LV Switchboard Generator Junction Box Cables visual inspection
Annual necessary
Power Generation
LV Switchboard Generator Junction Box Labelling and identification
Annual necessary
Power Generation
LV Switchboard Generator Junction Box Electrical protections visual inspection
Annual necessary
Power Generation
LV Switchboard Generator Junction Box Thermography inspection
Semi-annual
necessary
Power Generation
LV Switchboard Generator Junction Box Sensors functional verification
Semi-annual
necessary
Power Generation
LV Switchboard Generator Junction Box Measurements inspection
Annual necessary
Power Generation
LV Switchboard Generator Junction Box Electrical protection correct operation
Monthly necessary
Power Generation
LV Switchboard Generator Junction Box Check fuse status Annual necessary
Power Generation
LV Switchboard Generator Junction Box Monitoring operation test
Semi-annual
necessary
Power Generation
LV Switchboard Generator Junction Box Check cables terminals Annual necessary
Power Generation
LV Switchboard Generator Junction Box General cleaning Annual necessary
Power Generation
LV Switchboard AC Combiner Switchboard
Integrity inspection Semi-annual
necessary
Power Generation
LV Switchboard AC Combiner Switchboard
Documents inspection Semi-annual
necessary
Power Generation
LV Switchboard AC Combiner Switchboard
Cables visual inspection
Annual necessary
Power Generation
LV Switchboard AC Combiner Switchboard
Labelling and identification
Annual necessary
Power Generation
LV Switchboard AC Combiner Switchboard
Electrical protections visual inspection
Semi-annual
necessary
Power Generation
LV Switchboard AC Combiner Switchboard
Thermography inspection
Semi-annual
necessary
Power Generation
LV Switchboard AC Combiner Switchboard
Sensors functional verification
Annual necessary
Power Generation
LV Switchboard AC Combiner Switchboard
Measurements inspection
Semi-annual
necessary
Power Generation
LV Switchboard AC Combiner Switchboard
Check correct operation
Annual necessary
Power Generation
LV Switchboard AC Combiner Switchboard
Electrical protection correct operation
Annual necessary
Power Generation
LV Switchboard AC Combiner Switchboard
Check fuse status Annual necessary
Power Generation
LV Switchboard AC Combiner Switchboard
Check cables terminals Monthly necessary
Power Generation
LV Switchboard AC Combiner Switchboard
General cleaning Annual necessary
Power Generation
LV Switchboard AUX Switchboard Integrity inspection Semi-annual
necessary
Power Generation
LV Switchboard AUX Switchboard Documents inspection Semi-annual
necessary
Power Generation
LV Switchboard AUX Switchboard Cables visual inspection
Semi-annual
necessary
Power Generation
LV Switchboard AUX Switchboard Labelling and identification
Semi-annual
necessary

75
Power Generation
LV Switchboard AUX Switchboard Electrical protections visual inspection
Semi-annual
necessary
Power Generation
LV Switchboard AUX Switchboard Thermography inspection
Semi-annual
necessary
Power Generation
LV Switchboard AUX Switchboard Measurements inspection
Semi-annual
necessary
Power Generation
LV Switchboard AUX Switchboard Electrical protection correct operation
Semi-annual
necessary
Power Generation
LV Switchboard AUX Switchboard Check fuse status Semi-annual
necessary
Power Generation
LV Switchboard AUX Switchboard Check cables terminals Semi-annual
necessary
Power Generation
LV Switchboard AUX Switchboard General cleaning Semi-annual
necessary
Power Generation
Cables DC Cables Integrity inspection Semi-annual
necessary
Power Generation
Cables DC Cables Cables visual inspection
Annual necessary
Power Generation
Cables DC Cables Labelling and identification
Annual necessary
Power Generation
Cables AC Cables Cables visual inspection
Semi-annual
necessary
Power Generation
Cables AC Cables Labelling and identification
Annual necessary
Power Generation
Cables AC Cables Measurements inspection
Semi-annual
necessary
Power Generation
Inverters Central Inverters Safety equipment inspection
Annual necessary
Power Generation
Inverters Central Inverters Integrity inspection Semi-annual
necessary
Power Generation
Inverters Central Inverters Documents inspection Semi-annual
necessary
Power Generation
Inverters Central Inverters Cables visual inspection
Annual necessary
Power Generation
Inverters Central Inverters Labelling and identification
Annual necessary
Power Generation
Inverters Central Inverters Electrical protections visual inspection
Semi-annual
necessary
Power Generation
Inverters Central Inverters Thermography inspection
Annual necessary
Power Generation
Inverters Central Inverters Sensors functional verification
Annual necessary
Power Generation
Inverters Central Inverters Measurements inspection
Annual necessary
Power Generation
Inverters Central Inverters Parameters check Semi-annual
necessary
Power Generation
Inverters Central Inverters Electrical protection correct operation
Semi-annual
necessary
Power Generation
Inverters Central Inverters Check ventilation system operation
Annual necessary
Power Generation
Inverters Central Inverters Check fuse status Annual necessary
Power Generation
Inverters Central Inverters Check cables terminals Semi-annual
necessary
Power Generation
Inverters Central Inverters Battery replacement Every five years
According to manufacturer’s recommendations
Power Generation
Inverters Central Inverters Fans replacement Every five years
According to manufacturer’s recommendations
Power Generation
Inverters Central Inverters General cleaning Semi-annual
necessary
Power Generation
Inverters Central Inverters Ventilation cleaning Annual necessary
Power Generation
Inverters String Inverters Safety equipment inspection
Semi-annual
necessary
Power Generation
Inverters String Inverters Integrity inspection Semi-annual
necessary
Power Inverters String Inverters Cables visual Annual necessary

76
Generation inspection
Power Generation
Inverters String Inverters Labelling and identification
Semi-annual
necessary
Power Generation
Inverters String Inverters Electrical protections visual inspection
Semi-annual
necessary
Power Generation
Inverters String Inverters Thermography inspection
Annual necessary
Power Generation
Inverters String Inverters Measurements inspection
Semi-annual
necessary
Power Generation
Inverters String Inverters Parameters check Annual necessary
Power Generation
Inverters String Inverters Electrical protection correct operation
Annual necessary
Power Generation
Inverters String Inverters Check ventilation system operation
Semi-annual
necessary
Power Generation
Inverters String Inverters Check cables terminals Annual necessary
Power Generation
Inverters String Inverters Battery replacement Every five years
According to manufacturer’s recommendations
Power Generation
Inverters String Inverters Fans replacement Every five years
According to manufacturer’s recommendations
Power Generation
Inverters String Inverters General cleaning Annual necessary
Power Generation
Inverters String Inverters Ventilation cleaning Semi-annual
necessary
HV Systems Cables HV Cables Cables visual inspection
Semi-annual
necessary
HV Systems Cables HV Cables Labelling and identification
Semi-annual
necessary
HV Systems Power Transformer Integrity inspection Semi-annual
necessary
HV Systems Power Transformer Cables visual inspection
Annual necessary
HV Systems Power Transformer Mechanical visual inspection
Annual necessary
HV Systems Power Transformer Labelling and identification
Annual necessary
HV Systems Power Transformer Thermography inspection
Semi-annual
necessary
HV Systems Power Transformer Sensors functional verification
Semi-annual
necessary
HV Systems Power Transformer Measurements inspection
Semi-annual
necessary
HV Systems Power Transformer Parameters check Annual necessary
HV Systems Power Transformer Check correct operation
Semi-annual
necessary
HV Systems Power Transformer Check cables terminals Semi-annual
necessary
HV Systems Power Transformer Power transformer cleaning
Semi-annual
necessary
HV Systems HV Switchgear Integrity inspection Annual necessary
HV Systems HV Switchgear Cables visual inspection
Annual necessary
HV Systems HV Switchgear Mechanical visual inspection
Semi-annual
necessary
HV Systems HV Switchgear Labelling and identification
Annual necessary
HV Systems HV Switchgear Electrical protections visual inspection
Semi-annual
necessary
HV Systems HV Switchgear Thermography inspection
Semi-annual
necessary
HV Systems HV Switchgear Sensors functional verification
Annual necessary
HV Systems HV Switchgear Measurements inspection
Annual necessary
HV Systems HV Switchgear Check correct operation
Annual necessary

77
HV Systems HV Switchgear Check fuse status Annual necessary
HV Systems HV Switchgear Check cables terminals Semi-annual
necessary
HV Systems HV Switchgear General cleaning Annual necessary
HV Systems HV Switchgear Mechanical lubrication Semi-annual
necessary
HV Systems Main Switchboard Main AUX Switchboard Integrity inspection Annual necessary
HV Systems Main Switchboard Main AUX Switchboard Documents inspection Annual necessary
HV Systems Main Switchboard Main AUX Switchboard Cables visual inspection
Annual necessary
HV Systems Main Switchboard Main AUX Switchboard Labelling and identification
Annual necessary
HV Systems Main Switchboard Main AUX Switchboard Electrical protections visual inspection
Annual necessary
HV Systems Main Switchboard Main AUX Switchboard Thermography inspection
Annual necessary
HV Systems Main Switchboard Main AUX Switchboard Sensors functional verification
Semi-annual
necessary
HV Systems Main Switchboard Main AUX Switchboard Measurements inspection
Semi-annual
necessary
HV Systems Main Switchboard Main AUX Switchboard Parameters check Annual necessary
HV Systems Main Switchboard Main AUX Switchboard Check correct operation
Semi-annual
necessary
HV Systems Main Switchboard Main AUX Switchboard Electrical protection correct operation
Annual necessary
HV Systems Main Switchboard Main AUX Switchboard Check fuse status Annual necessary
HV Systems Main Switchboard Main AUX Switchboard Software maintenance Annual necessary
HV Systems Main Switchboard Main AUX Switchboard Monitoring operation test
Annual necessary
HV Systems Main Switchboard Main AUX Switchboard Check cables terminals Annual necessary
HV Systems Main Switchboard Main AUX Switchboard Battery replacement Every five years
According to manufacturer’s recommendations
HV Systems Main Switchboard Main AUX Switchboard General cleaning Annual necessary
HV Systems Main Switchboard Main AC Switchboard Integrity inspection Annual necessary
HV Systems Main Switchboard Main AC Switchboard Documents inspection Semi-annual
necessary
HV Systems Main Switchboard Main AC Switchboard Cables visual inspection
Annual necessary
HV Systems Main Switchboard Main AC Switchboard Labelling and identification
Annual necessary
HV Systems Main Switchboard Main AC Switchboard Electrical protections visual inspection
Annual necessary
HV Systems Main Switchboard Main AC Switchboard Thermography inspection
Semi-annual
necessary
HV Systems Main Switchboard Main AC Switchboard Sensors functional verification
Annual necessary
HV Systems Main Switchboard Main AC Switchboard Measurements inspection
Annual necessary
HV Systems Main Switchboard Main AC Switchboard Check correct operation
Annual necessary
HV Systems Main Switchboard Main AC Switchboard Electrical protection correct operation
Annual necessary
HV Systems Main Switchboard Main AC Switchboard Check fuse status Annual necessary
HV Systems Main Switchboard Main AC Switchboard Check cables terminals Semi-annual
necessary
HV Systems Main Switchboard Main AC Switchboard General cleaning Annual necessary
HV Systems Power Monitoring Power Analyser Battery replacement Every five years
According to manufacturer’s recommendations
HV Systems Power Monitoring Power Analyser Cables visual inspection
Annual necessary
HV Systems Power Monitoring Power Analyser Labelling and identification
Annual necessary
HV Systems Power Monitoring Power Analyser Measurements inspection
Annual necessary
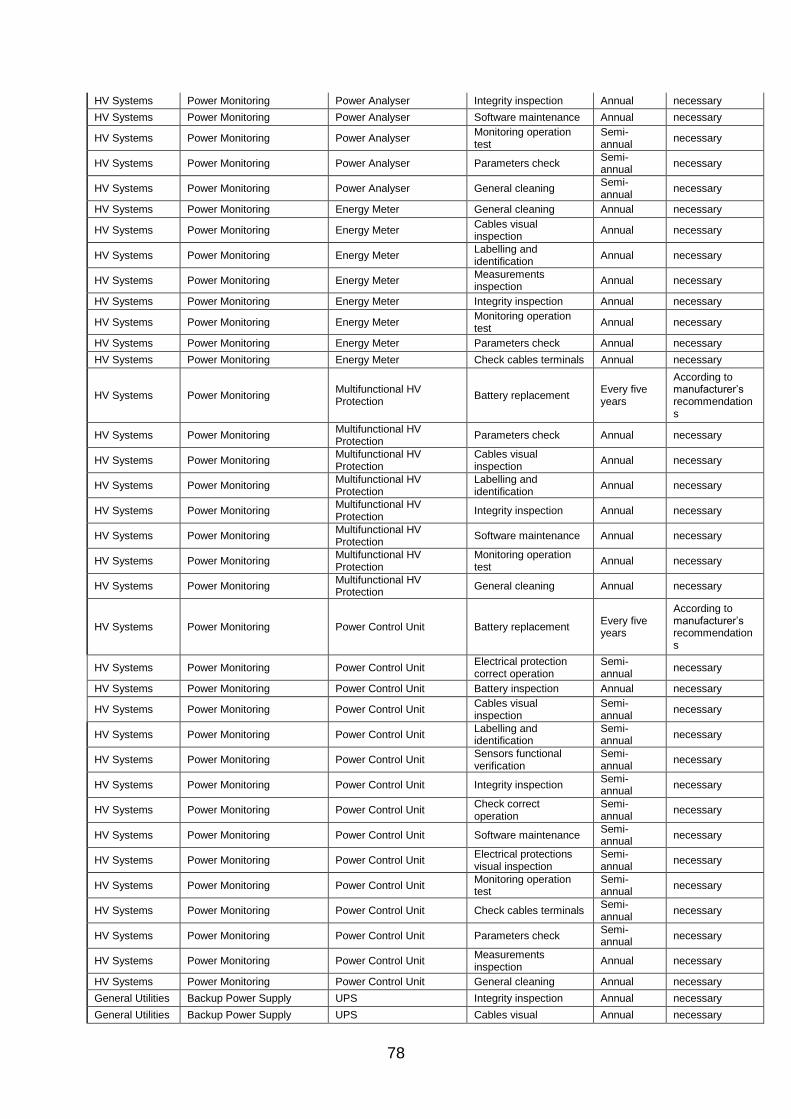
78
HV Systems Power Monitoring Power Analyser Integrity inspection Annual necessary
HV Systems Power Monitoring Power Analyser Software maintenance Annual necessary
HV Systems Power Monitoring Power Analyser Monitoring operation test
Semi-annual
necessary
HV Systems Power Monitoring Power Analyser Parameters check Semi-annual
necessary
HV Systems Power Monitoring Power Analyser General cleaning Semi-annual
necessary
HV Systems Power Monitoring Energy Meter General cleaning Annual necessary
HV Systems Power Monitoring Energy Meter Cables visual inspection
Annual necessary
HV Systems Power Monitoring Energy Meter Labelling and identification
Annual necessary
HV Systems Power Monitoring Energy Meter Measurements inspection
Annual necessary
HV Systems Power Monitoring Energy Meter Integrity inspection Annual necessary
HV Systems Power Monitoring Energy Meter Monitoring operation test
Annual necessary
HV Systems Power Monitoring Energy Meter Parameters check Annual necessary
HV Systems Power Monitoring Energy Meter Check cables terminals Annual necessary
HV Systems Power Monitoring Multifunctional HV Protection
Battery replacement Every five years
According to manufacturer’s recommendations
HV Systems Power Monitoring Multifunctional HV Protection
Parameters check Annual necessary
HV Systems Power Monitoring Multifunctional HV Protection
Cables visual inspection
Annual necessary
HV Systems Power Monitoring Multifunctional HV Protection
Labelling and identification
Annual necessary
HV Systems Power Monitoring Multifunctional HV Protection
Integrity inspection Annual necessary
HV Systems Power Monitoring Multifunctional HV Protection
Software maintenance Annual necessary
HV Systems Power Monitoring Multifunctional HV Protection
Monitoring operation test
Annual necessary
HV Systems Power Monitoring Multifunctional HV Protection
General cleaning Annual necessary
HV Systems Power Monitoring Power Control Unit Battery replacement Every five years
According to manufacturer’s recommendations
HV Systems Power Monitoring Power Control Unit Electrical protection correct operation
Semi-annual
necessary
HV Systems Power Monitoring Power Control Unit Battery inspection Annual necessary
HV Systems Power Monitoring Power Control Unit Cables visual inspection
Semi-annual
necessary
HV Systems Power Monitoring Power Control Unit Labelling and identification
Semi-annual
necessary
HV Systems Power Monitoring Power Control Unit Sensors functional verification
Semi-annual
necessary
HV Systems Power Monitoring Power Control Unit Integrity inspection Semi-annual
necessary
HV Systems Power Monitoring Power Control Unit Check correct operation
Semi-annual
necessary
HV Systems Power Monitoring Power Control Unit Software maintenance Semi-annual
necessary
HV Systems Power Monitoring Power Control Unit Electrical protections visual inspection
Semi-annual
necessary
HV Systems Power Monitoring Power Control Unit Monitoring operation test
Semi-annual
necessary
HV Systems Power Monitoring Power Control Unit Check cables terminals Semi-annual
necessary
HV Systems Power Monitoring Power Control Unit Parameters check Semi-annual
necessary
HV Systems Power Monitoring Power Control Unit Measurements inspection
Annual necessary
HV Systems Power Monitoring Power Control Unit General cleaning Annual necessary
General Utilities Backup Power Supply UPS Integrity inspection Annual necessary
General Utilities Backup Power Supply UPS Cables visual Annual necessary
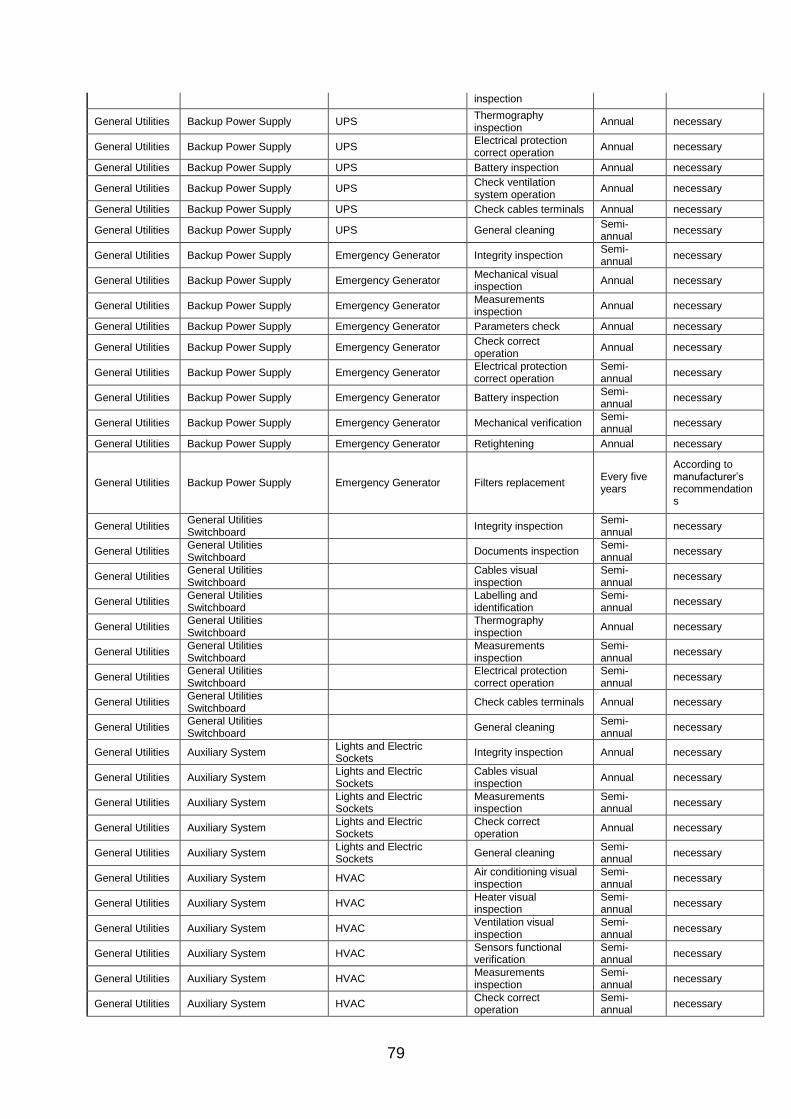
79
inspection
General Utilities Backup Power Supply UPS Thermography inspection
Annual necessary
General Utilities Backup Power Supply UPS Electrical protection correct operation
Annual necessary
General Utilities Backup Power Supply UPS Battery inspection Annual necessary
General Utilities Backup Power Supply UPS Check ventilation system operation
Annual necessary
General Utilities Backup Power Supply UPS Check cables terminals Annual necessary
General Utilities Backup Power Supply UPS General cleaning Semi-annual
necessary
General Utilities Backup Power Supply Emergency Generator Integrity inspection Semi-annual
necessary
General Utilities Backup Power Supply Emergency Generator Mechanical visual inspection
Annual necessary
General Utilities Backup Power Supply Emergency Generator Measurements inspection
Annual necessary
General Utilities Backup Power Supply Emergency Generator Parameters check Annual necessary
General Utilities Backup Power Supply Emergency Generator Check correct operation
Annual necessary
General Utilities Backup Power Supply Emergency Generator Electrical protection correct operation
Semi-annual
necessary
General Utilities Backup Power Supply Emergency Generator Battery inspection Semi-annual
necessary
General Utilities Backup Power Supply Emergency Generator Mechanical verification Semi-annual
necessary
General Utilities Backup Power Supply Emergency Generator Retightening Annual necessary
General Utilities Backup Power Supply Emergency Generator Filters replacement Every five years
According to manufacturer’s recommendations
General Utilities General Utilities Switchboard
Integrity inspection Semi-annual
necessary
General Utilities General Utilities Switchboard
Documents inspection Semi-annual
necessary
General Utilities General Utilities Switchboard
Cables visual inspection
Semi-annual
necessary
General Utilities General Utilities Switchboard
Labelling and identification
Semi-annual
necessary
General Utilities General Utilities Switchboard
Thermography inspection
Annual necessary
General Utilities General Utilities Switchboard
Measurements inspection
Semi-annual
necessary
General Utilities General Utilities Switchboard
Electrical protection correct operation
Semi-annual
necessary
General Utilities General Utilities Switchboard
Check cables terminals Annual necessary
General Utilities General Utilities Switchboard
General cleaning Semi-annual
necessary
General Utilities Auxiliary System Lights and Electric Sockets
Integrity inspection Annual necessary
General Utilities Auxiliary System Lights and Electric Sockets
Cables visual inspection
Annual necessary
General Utilities Auxiliary System Lights and Electric Sockets
Measurements inspection
Semi-annual
necessary
General Utilities Auxiliary System Lights and Electric Sockets
Check correct operation
Annual necessary
General Utilities Auxiliary System Lights and Electric Sockets
General cleaning Semi-annual
necessary
General Utilities Auxiliary System HVAC Air conditioning visual inspection
Semi-annual
necessary
General Utilities Auxiliary System HVAC Heater visual inspection
Semi-annual
necessary
General Utilities Auxiliary System HVAC Ventilation visual inspection
Semi-annual
necessary
General Utilities Auxiliary System HVAC Sensors functional verification
Semi-annual
necessary
General Utilities Auxiliary System HVAC Measurements inspection
Semi-annual
necessary
General Utilities Auxiliary System HVAC Check correct operation
Semi-annual
necessary

80
General Utilities Auxiliary System HVAC Check ventilation system operation
Semi-annual
necessary
General Utilities Auxiliary System HVAC Air conditioning cleaning
Semi-annual
necessary
General Utilities Auxiliary System HVAC Ventilation cleaning Semi-annual
necessary
General Utilities Auxiliary System HVAC Heater cleaning Semi-annual
necessary
General Utilities Water Supply System Integrity inspection Annual necessary
General Utilities Fire Detection Central Sensors functional verification
Semi-annual
necessary
General Utilities Fire Detection Central Check correct operation
Semi-annual
necessary
General Utilities Fire Detection Central Electrical protection correct operation
Semi-annual
necessary
General Utilities Fire Detection Central Battery inspection Semi-annual
necessary
General Utilities Fire Detection Central General cleaning Annual necessary
General Utilities Fire Detection Central Cameras & Sensors cleaning
Semi-annual
necessary
General Utilities Lightning Protection Integrity inspection Annual necessary
General Utilities Low Voltage Power Transformer
Integrity inspection Semi-annual
necessary
General Utilities Low Voltage Power Transformer
Cables visual inspection
Semi-annual
necessary
General Utilities Low Voltage Power Transformer
Mechanical visual inspection
Semi-annual
necessary
General Utilities Low Voltage Power Transformer
Labelling and identification
Annual necessary
General Utilities Low Voltage Power Transformer
Thermography inspection
Annual necessary
General Utilities Low Voltage Power Transformer
Sensors functional verification
Semi-annual
necessary
General Utilities Low Voltage Power Transformer
Measurements inspection
Semi-annual
necessary
General Utilities Low Voltage Power Transformer
Parameters check Semi-annual
necessary
General Utilities Low Voltage Power Transformer
Check correct operation
Semi-annual
necessary
General Utilities Low Voltage Power Transformer
Check cables terminals Semi-annual
necessary
General Utilities Low Voltage Power Transformer
Power transformer cleaning
Semi-annual
necessary
Infrastructure Field Fence Integrity inspection Annual necessary
Infrastructure Field Fence Mechanical lubrication Annual necessary
Infrastructure Field Vegetation Vegetation clearing Semi-annual
necessary
Infrastructure Field Paths Integrity inspection Semi-annual
necessary
Infrastructure Field Paths Vegetation clearing Semi-annual
necessary
Infrastructure Field Drainage System General cleaning Annual necessary
Infrastructure Field Manholes Integrity inspection Semi-annual
necessary
Infrastructure Buildings Integrity inspection Annual necessary
Infrastructure Buildings Documents inspection Annual necessary
Infrastructure Buildings General cleaning Annual necessary
Infrastructure Safety Safety equipment inspection
Annual necessary
Infrastructure Safety Check correct operation
Semi-annual
necessary
Infrastructure PV Support Structure Fixed Structure Integrity inspection Semi-annual
necessary
Infrastructure PV Support Structure Fixed Structure Retightening Semi-annual
necessary
Infrastructure PV Support Structure Solar Tracker Integrity inspection Annual necessary
Infrastructure PV Support Structure Solar Tracker Cables visual inspection
Semi-annual
necessary
Infrastructure PV Support Structure Solar Tracker Mechanical visual inspection
Semi-annual
necessary

81
Infrastructure PV Support Structure Solar Tracker Labelling and identification
Annual necessary
Infrastructure PV Support Structure Solar Tracker Thermography inspection
Annual necessary
Infrastructure PV Support Structure Solar Tracker Measurements inspection
Semi-annual
necessary
Infrastructure PV Support Structure Solar Tracker Parameters check Semi-annual
necessary
Infrastructure PV Support Structure Solar Tracker Check correct operation
Annual necessary
Infrastructure PV Support Structure Solar Tracker Electrical protection correct operation
Semi-annual
necessary
Infrastructure PV Support Structure Solar Tracker Monitoring operation test
Annual necessary
Infrastructure PV Support Structure Solar Tracker Check cables terminals Semi-annual
necessary
Infrastructure PV Support Structure Solar Tracker Retightening Semi-annual
necessary
Infrastructure PV Support Structure Solar Tracker Battery replacement Every five years
According to manufacturer’s recommendations
Infrastructure PV Support Structure Solar Tracker General cleaning Semi-annual
necessary
Infrastructure PV Support Structure Solar Tracker Mechanical lubrication Annual necessary
Monitoring System
Weather Station Integrity inspection Annual necessary
Monitoring System
Weather Station Cables visual inspection
Annual necessary
Monitoring System
Weather Station Sensors functional verification
Annual necessary
Monitoring System
Weather Station Measurements inspection
Annual necessary
Monitoring System
Weather Station Check correct operation
Semi-annual
necessary
Monitoring System
Weather Station Electrical protection correct operation
Annual necessary
Monitoring System
Weather Station Battery inspection Annual necessary
Monitoring System
Weather Station Monitoring operation test
Semi-annual
necessary
Monitoring System
Weather Station General cleaning Annual necessary
Monitoring System
Weather Station Cameras & Sensors cleaning
Annual necessary
Monitoring System
Weather Station Irradiation Sensors Integrity inspection Annual necessary
Monitoring System
Weather Station Irradiation Sensors Cables visual inspection
Semi-annual
necessary
Monitoring System
Weather Station Irradiation Sensors Sensors functional verification
Semi-annual
necessary
Monitoring System
Weather Station Irradiation Sensors Sensors calibration Annual necessary
Monitoring System
Weather Station Irradiation Sensors Cameras & Sensors cleaning
Annual necessary
Monitoring System
Monitoring System Cabling Cables visual inspection
Semi-annual
necessary
Monitoring System
Monitoring System Cabling Labelling and identification
Semi-annual
necessary
Monitoring System
Monitoring System Cabling Monitoring operation test
Semi-annual
necessary
Monitoring System
Communication Board Integrity inspection Annual necessary
Monitoring System
Communication Board Documents inspection Annual necessary
Monitoring System
Communication Board Cables visual inspection
Annual necessary
Monitoring System
Communication Board Electrical protection correct operation
Annual necessary
Monitoring System
Communication Board Battery inspection Annual necessary
Monitoring System
Communication Board Check ventilation system operation
Annual necessary
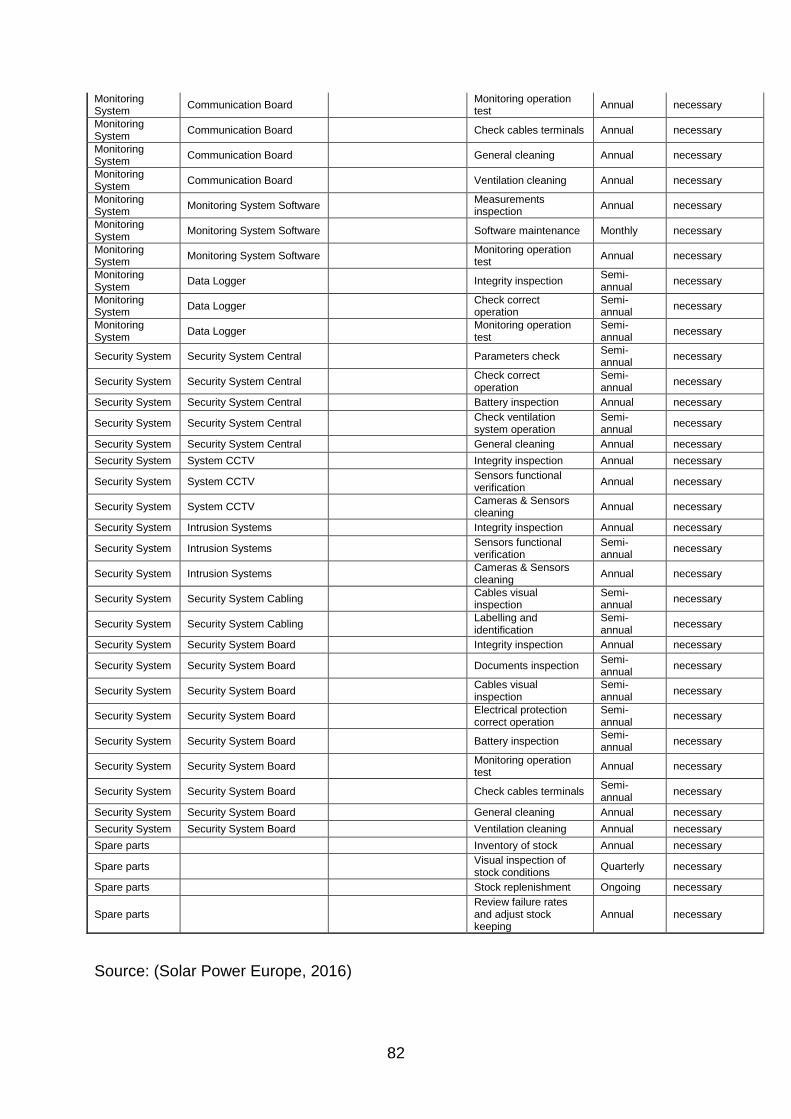
82
Monitoring System
Communication Board Monitoring operation test
Annual necessary
Monitoring System
Communication Board Check cables terminals Annual necessary
Monitoring System
Communication Board General cleaning Annual necessary
Monitoring System
Communication Board Ventilation cleaning Annual necessary
Monitoring System
Monitoring System Software Measurements inspection
Annual necessary
Monitoring System
Monitoring System Software Software maintenance Monthly necessary
Monitoring System
Monitoring System Software Monitoring operation test
Annual necessary
Monitoring System
Data Logger Integrity inspection Semi-annual
necessary
Monitoring System
Data Logger Check correct operation
Semi-annual
necessary
Monitoring System
Data Logger Monitoring operation test
Semi-annual
necessary
Security System Security System Central Parameters check Semi-annual
necessary
Security System Security System Central Check correct operation
Semi-annual
necessary
Security System Security System Central Battery inspection Annual necessary
Security System Security System Central Check ventilation system operation
Semi-annual
necessary
Security System Security System Central General cleaning Annual necessary
Security System System CCTV Integrity inspection Annual necessary
Security System System CCTV Sensors functional verification
Annual necessary
Security System System CCTV Cameras & Sensors cleaning
Annual necessary
Security System Intrusion Systems Integrity inspection Annual necessary
Security System Intrusion Systems Sensors functional verification
Semi-annual
necessary
Security System Intrusion Systems Cameras & Sensors cleaning
Annual necessary
Security System Security System Cabling Cables visual inspection
Semi-annual
necessary
Security System Security System Cabling Labelling and identification
Semi-annual
necessary
Security System Security System Board Integrity inspection Annual necessary
Security System Security System Board Documents inspection Semi-annual
necessary
Security System Security System Board Cables visual inspection
Semi-annual
necessary
Security System Security System Board Electrical protection correct operation
Semi-annual
necessary
Security System Security System Board Battery inspection Semi-annual
necessary
Security System Security System Board Monitoring operation test
Annual necessary
Security System Security System Board Check cables terminals Semi-annual
necessary
Security System Security System Board General cleaning Annual necessary
Security System Security System Board Ventilation cleaning Annual necessary
Spare parts Inventory of stock Annual necessary
Spare parts Visual inspection of stock conditions
Quarterly necessary
Spare parts Stock replenishment Ongoing necessary
Spare parts Review failure rates and adjust stock keeping
Annual necessary
Source: (Solar Power Europe, 2016)
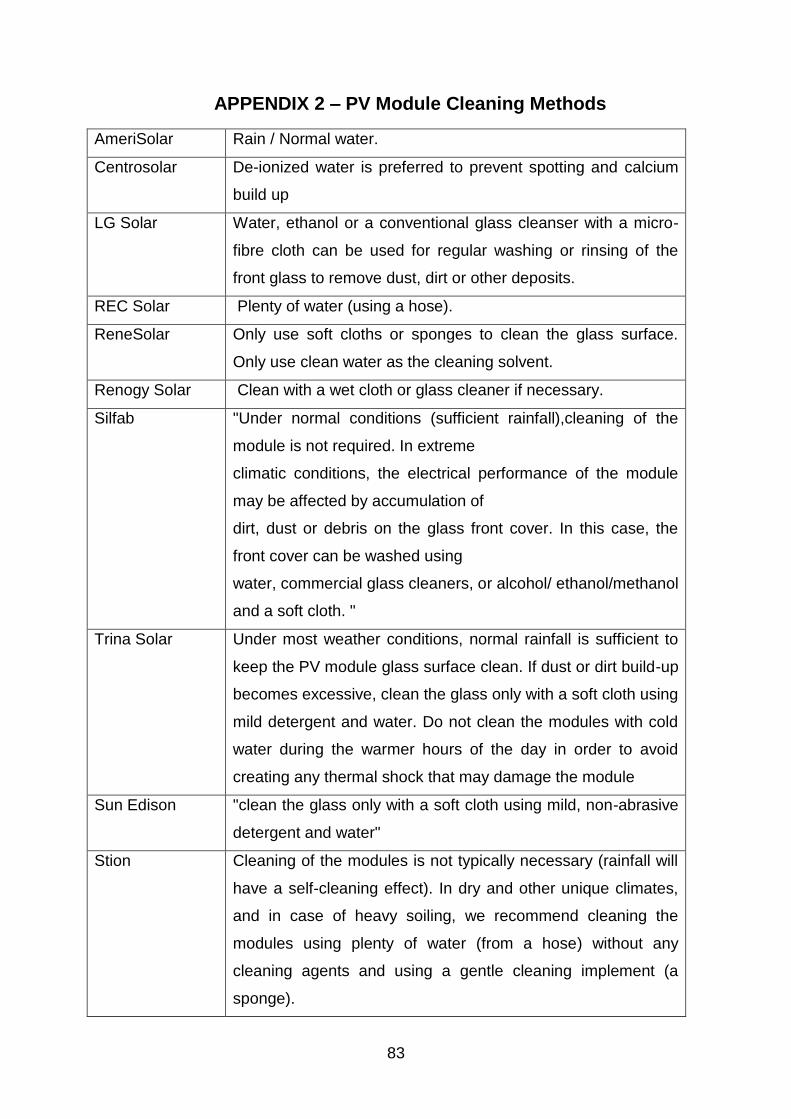
83
APPENDIX 2 – PV Module Cleaning Methods
AmeriSolar Rain / Normal water.
Centrosolar De-ionized water is preferred to prevent spotting and calcium
build up
LG Solar Water, ethanol or a conventional glass cleanser with a micro-
fibre cloth can be used for regular washing or rinsing of the
front glass to remove dust, dirt or other deposits.
REC Solar Plenty of water (using a hose).
ReneSolar Only use soft cloths or sponges to clean the glass surface.
Only use clean water as the cleaning solvent.
Renogy Solar Clean with a wet cloth or glass cleaner if necessary.
Silfab "Under normal conditions (sufficient rainfall),cleaning of the
module is not required. In extreme
climatic conditions, the electrical performance of the module
may be affected by accumulation of
dirt, dust or debris on the glass front cover. In this case, the
front cover can be washed using
water, commercial glass cleaners, or alcohol/ ethanol/methanol
and a soft cloth. "
Trina Solar Under most weather conditions, normal rainfall is sufficient to
keep the PV module glass surface clean. If dust or dirt build-up
becomes excessive, clean the glass only with a soft cloth using
mild detergent and water. Do not clean the modules with cold
water during the warmer hours of the day in order to avoid
creating any thermal shock that may damage the module
Sun Edison "clean the glass only with a soft cloth using mild, non-abrasive
detergent and water"
Stion Cleaning of the modules is not typically necessary (rainfall will
have a self-cleaning effect). In dry and other unique climates,
and in case of heavy soiling, we recommend cleaning the
modules using plenty of water (from a hose) without any
cleaning agents and using a gentle cleaning implement (a
sponge).

84
Hyundai Clean the module surface and remove dirt and contaminants
with tap water.
Silevo Periodically clean the module surface with water and a soft
cloth or sponge. Fingerprints may be removed with standard
glass cleaner.
China sunenergy Clean the panel(s) preferably once per annum if possible
(dependant on site conditions) using a soft cloth dry or damp,
as necessary. Never use abrasive material under any
circumstances
Astroenergy It is not generally necessary to clean the modules (rainfall will
have a self-cleaning effect). In case of heavy soiling (which will
result in output reductions), we recommend cleaning the
modules using plenty of water (from a hose) without cleaning
agents and using a gentle cleaning implement (a sponge).
ET solar Use water and a soft sponge or cloth for cleaning. A mild, non-
abrasive cleaning agent can be used if necessary. Do not use
dishwasher detergent
Solar World Given a sufficient tilt (at least 15°), it is generally not necessary
to clean the modules (rainfall will have a self-cleaning effect).
Sun Power Rinse them down with your garden hose.
Suniva Clean the surface with water and a soft cloth or sponge. Never
clean the module in the middles of the day when the glass is
hot to avoid injury.
Itek Typically water and a soft, non-abrasive brush will be adequate
to clean the modules.
Kyocera Normal rainfall is sufficient to keep the module glass surface
clean. If dirt build-up becomes excessive, clean the glass
surface only with a soft cloth using mild detergent and water
Hanhwa solarone Hanwha SolarOne modules have a self-cleaning function
under rainfall weather condition. Module with a mounted tilt
angle more than 15°is more effective than other mounting
angle. If heavy soiling build-up is excessive on module glass,
use a soft cloth and water for cleaning
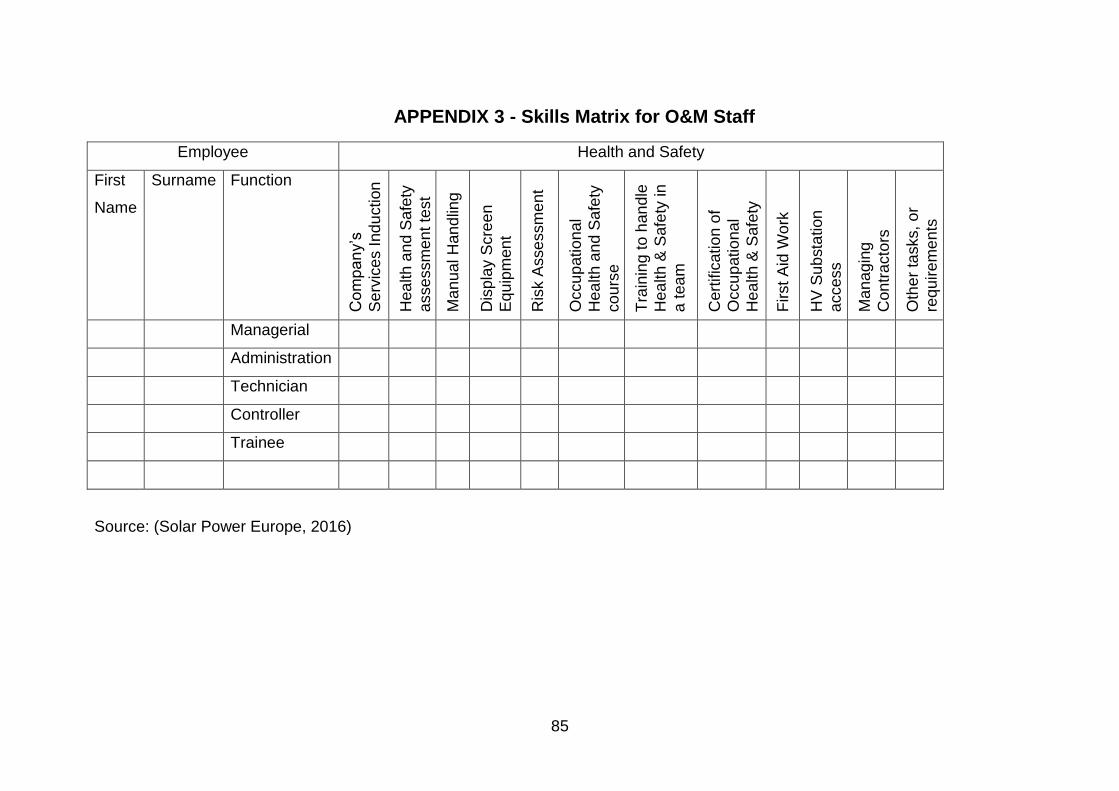
85
APPENDIX 3 - Skills Matrix for O&M Staff
Employee Health and Safety
First
Name
Surname Function
Com
pa
ny’s
Se
rvic
es I
nd
uction
Hea
lth
an
d S
afe
ty
asse
ssm
en
t te
st
Ma
nu
al H
an
dlin
g
Dis
pla
y S
cre
en
Eq
uip
men
t
Ris
k A
sse
ssm
en
t
Occu
patio
na
l
Hea
lth
an
d S
afe
ty
co
urs
e
Tra
inin
g to
han
dle
Hea
lth
& S
afe
ty in
a t
ea
m
Cert
ific
ation
of
Occu
patio
na
l
Hea
lth
& S
afe
ty
First
Aid
Wo
rk
HV
Su
bsta
tion
acce
ss
Ma
na
gin
g
Con
tracto
rs
Oth
er
tasks,
or
req
uire
me
nts
Managerial
Administration
Technician
Controller
Trainee
Source: (Solar Power Europe, 2016)
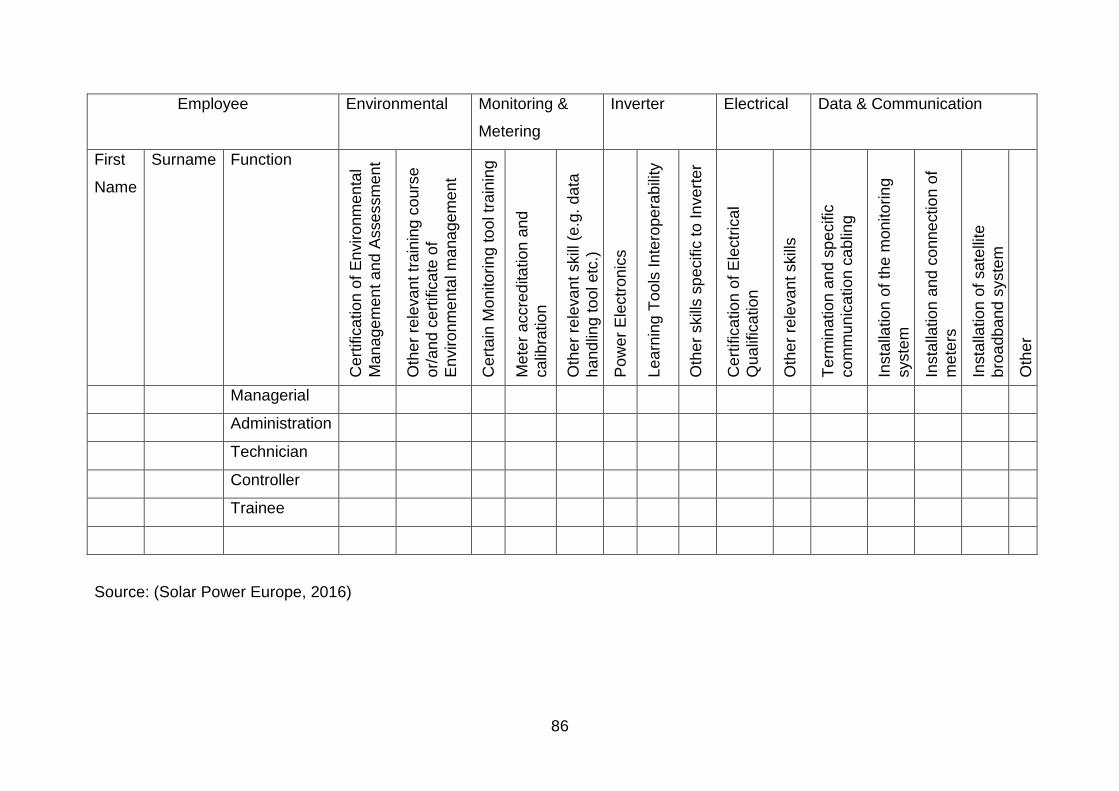
86
Employee Environmental Monitoring &
Metering
Inverter Electrical Data & Communication
First
Name
Surname Function
Cert
ific
ation
of
En
viro
nm
en
tal
Ma
na
ge
me
nt a
nd
Asse
ssm
en
t
Oth
er
rele
va
nt tr
ain
ing
co
urs
e
or/
an
d c
ert
ific
ate
of
En
viro
nm
enta
l m
ana
ge
me
nt
Cert
ain
Mo
nito
rin
g to
ol tr
ain
ing
Me
ter
accre
dita
tion
and
ca
libra
tio
n
Oth
er
rele
va
nt skill
(e.g
. da
ta
ha
nd
ling
to
ol etc
.)
Po
wer
Ele
ctr
on
ics
Le
arn
ing
Too
ls In
tero
pe
rab
ility
Oth
er
skill
s s
pe
cific
to
In
ve
rter
Cert
ific
ation
of
Ele
ctr
ical
Qu
alif
ica
tion
Oth
er
rele
va
nt skill
s
Term
ina
tio
n a
nd s
pe
cific
co
mm
un
ication c
ab
ling
Insta
llatio
n o
f th
e m
on
ito
rin
g
syste
m
Insta
llatio
n a
nd
co
nn
ectio
n o
f
me
ters
Insta
llatio
n o
f sate
llite
bro
adb
and
syste
m
Oth
er
Managerial
Administration
Technician
Controller
Trainee
Source: (Solar Power Europe, 2016)

87
APPENDIX 4 – SCADA System
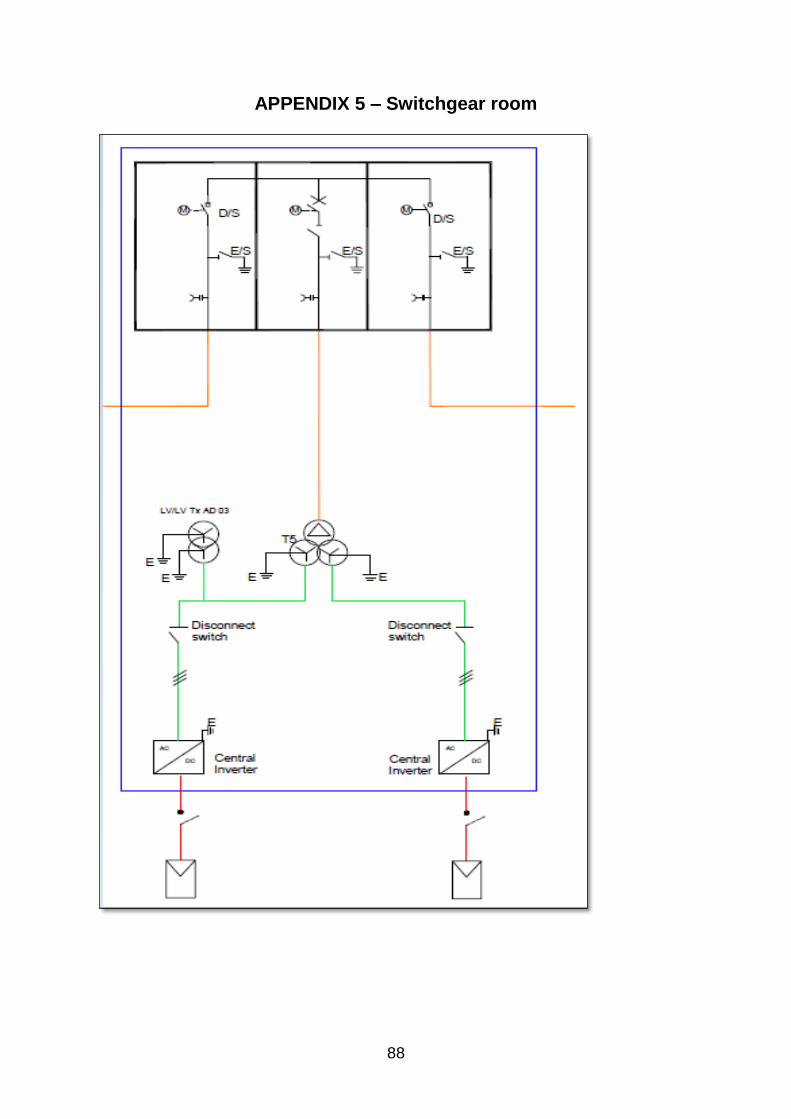
88
APPENDIX 5 – Switchgear room

89
APPENDIX 6 - Hazards in a PV Plant
Hazard source Hazard Effect to
Electrical
current/electricity
Electrocution, short-circuit P/V system &
employees
Fire Damage of the P/V system,
mishaps, burns
P/V system &
employees, emergency
responders
Contact with sharp
surfaces
Mishaps (cuts, bruises etc.) Employees
Contact with hot
surfaces
Burns Employees
Fall from height Mishaps, death Employees
Batteries (oxides) Burns, respiratory problems,
environmental
Employees,
environment
Non-ionizing radiation Health hazard Employees
PVP system Communication systems
interference
Aviation
Panels Reflection/glare Aviation
PVP system Airspace penetration Aviation
Debris on airfield's
runway
Aircraft engine suck a foreign
object (FOD)
Aviation
PVP system Aircraft's evacuation difficulties Passengers, emergency
responders
PVP system Aircraft's rescuing difficulties Passengers, emergency
responders
Natural hazards
Lightning Lightning Damage of the P/V
system, death
P/V system &
employees
Strong winds Damage of the P/V system
(snatch), mishaps
P/V system &
employees & third
parties
Dust Damage of the P/V system, low
energy productivity
P/V system, energy
productivity
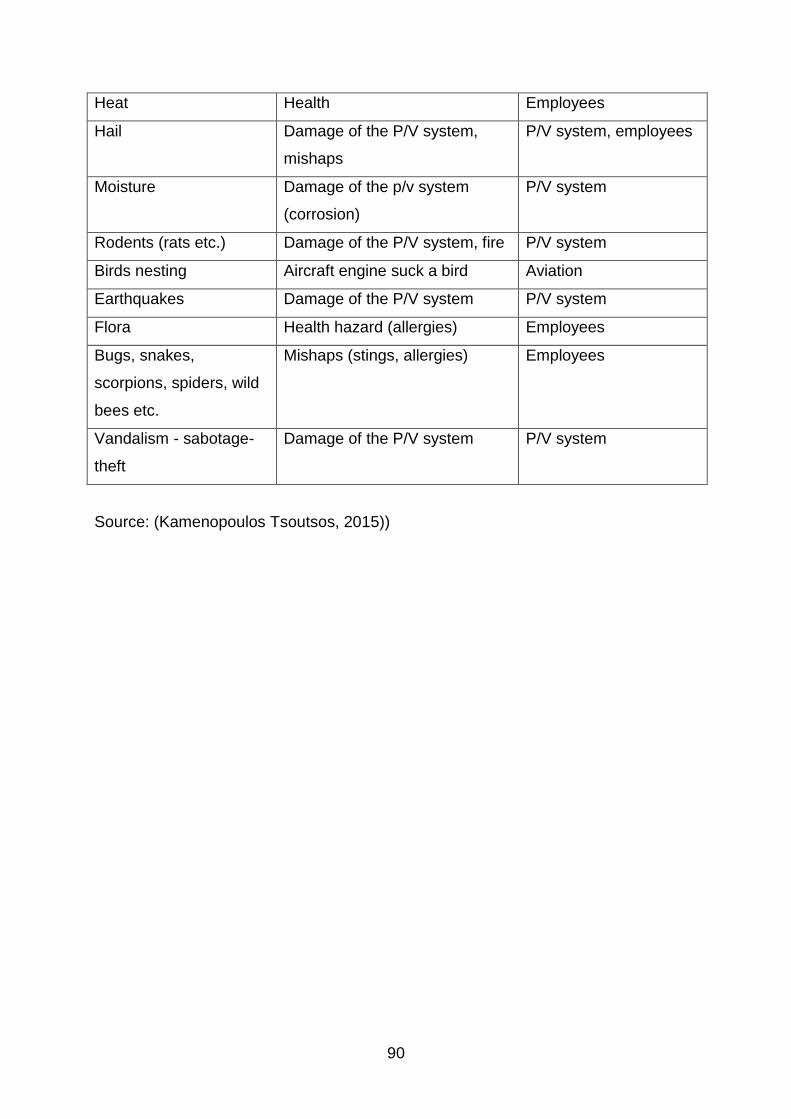
90
Heat Health Employees
Hail Damage of the P/V system,
mishaps
P/V system, employees
Moisture Damage of the p/v system
(corrosion)
P/V system
Rodents (rats etc.) Damage of the P/V system, fire P/V system
Birds nesting Aircraft engine suck a bird Aviation
Earthquakes Damage of the P/V system P/V system
Flora Health hazard (allergies) Employees
Bugs, snakes,
scorpions, spiders, wild
bees etc.
Mishaps (stings, allergies) Employees
Vandalism - sabotage-
theft
Damage of the P/V system P/V system
Source: (Kamenopoulos Tsoutsos, 2015))
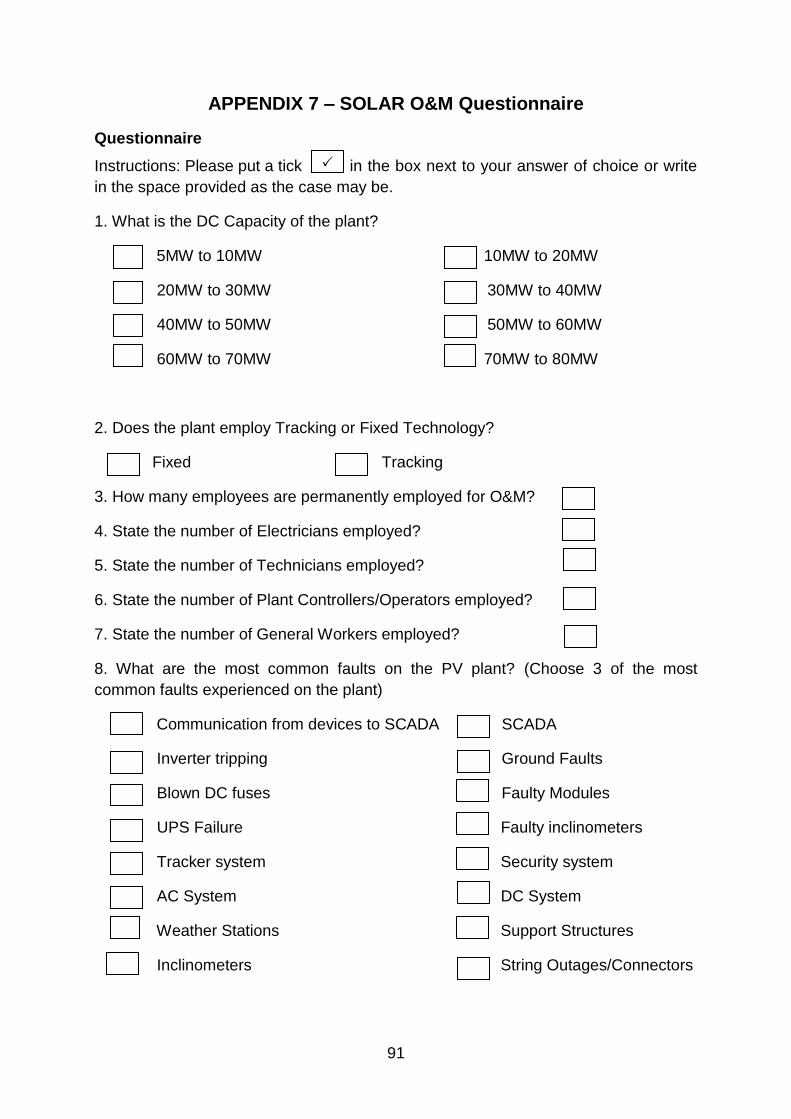
91
APPENDIX 7 – SOLAR O&M Questionnaire
Questionnaire
Instructions: Please put a tick in the box next to your answer of choice or write
in the space provided as the case may be.
1. What is the DC Capacity of the plant?
5MW to 10MW 10MW to 20MW
20MW to 30MW 30MW to 40MW
40MW to 50MW 50MW to 60MW
60MW to 70MW 70MW to 80MW
2. Does the plant employ Tracking or Fixed Technology?
Fixed Tracking
3. How many employees are permanently employed for O&M?
4. State the number of Electricians employed?
5. State the number of Technicians employed?
6. State the number of Plant Controllers/Operators employed?
7. State the number of General Workers employed?
8. What are the most common faults on the PV plant? (Choose 3 of the most
common faults experienced on the plant)
Communication from devices to SCADA SCADA
Inverter tripping Ground Faults
Blown DC fuses Faulty Modules
UPS Failure Faulty inclinometers
Tracker system Security system
AC System DC System
Weather Stations Support Structures
Inclinometers String Outages/Connectors

92
9. How often are panels washed in a year?
1 to 3 times per year 4 to 6 times per year
More than 6 times per year Never
Whenever irradiance measurement from an uncleaned reference cell is
lower than a cleaned reference cell by a predetermine value.
10. How are panels washed? More than one option can be selected.
Manually using hose and squeegee
Using a special tractor equipped with attachments for module cleaning
Portable firefighting equipment with petro/diesel pump
11. What are the most common panel defects on the PV plant? (Choose 3 of the
most common faults experienced on the plant)
Cracked glass Blown diodes
Hotspots Snail tracks
Blown connectors Failed Solar cell
Delamination Backing sheet damage
Bad connections in Junction box Insulation faults
Bad connections within module
12. How often is vegetation control performed / scheduled?
Daily Weekly
Fortnightly Monthly
Quarterly As required
13. How often are the pyranometers cleaned?
Daily Weekly
Fortnightly Monthly
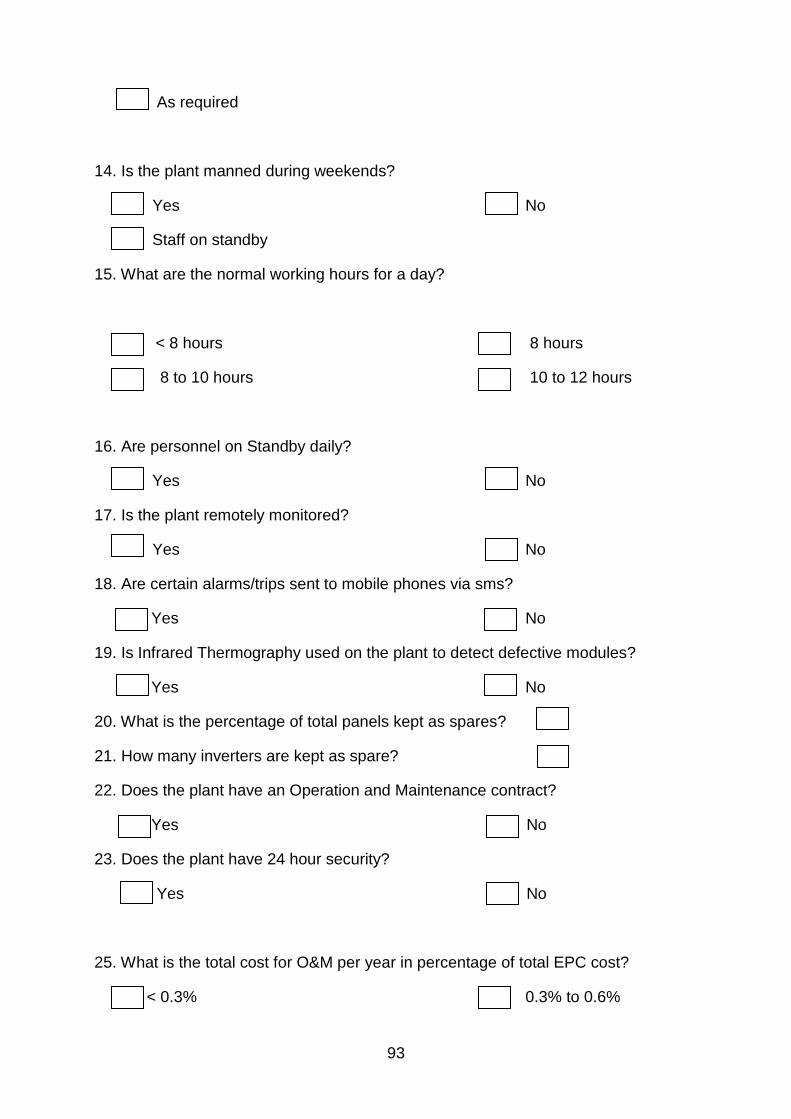
93
As required
14. Is the plant manned during weekends?
Yes No
Staff on standby
15. What are the normal working hours for a day?
< 8 hours 8 hours
8 to 10 hours 10 to 12 hours
16. Are personnel on Standby daily?
Yes No
17. Is the plant remotely monitored?
Yes No
18. Are certain alarms/trips sent to mobile phones via sms?
Yes No
19. Is Infrared Thermography used on the plant to detect defective modules?
Yes No
20. What is the percentage of total panels kept as spares?
21. How many inverters are kept as spare?
22. Does the plant have an Operation and Maintenance contract?
Yes No
23. Does the plant have 24 hour security?
Yes No
25. What is the total cost for O&M per year in percentage of total EPC cost?
< 0.3% 0.3% to 0.6%

94
0.7% to 1% > than 1%
26. What is the current annual performance ratio of the plant?
< 75% 75% to 78%
79% to 82% > 82%
27. Is the GCC Engineer permanently employed on site?
Yes No
Shared between sites
29. Has the option for inverter extended warranty been exercised with the
manufacturer?
Yes No
30. Which costs more: the property insurance against damage or the liability
insurance to protect workers?
Property insurance Liability insurance
31. What percentage of annual O&M expenses do insurance premiums account for?
< 10% 10% to 15%
15% to 20% 20% to 25%
32. What are the most frequent inverter component that fails or are problematic?
(Choose a maximum of 3 of the most common faults experienced on the plant)
Matrix/IGBT DC Contactor
Fans Ground Fault Detection Components
Surge protection AC Contactor
Power Supply Boards/Cards

95
Software Other
32. Highest level of monitoring employed (highest resolution)?
String level Array level
Inverter level Block level
33. Annual availability of the PV plant?
>98% 95% to 97%
90% to 94% <90%
34. What is the source of the water used to wash panels?
Borehole Borehole & Reverse osmosis plant
Municipal Municipal & Reverse osmosis plant

96
APPENDIX 8 – Consent Cover Letter

97
APPENDIX 9 – Ethical Clearance