investigating soybeans market situation in western kenya ... report... · in western kenya:...
TRANSCRIPT

Picture: Members of Butere SRC
Investigating soybean market situation in Western Kenya: constraints and
opportunities for smallholder producers
Author: R.N. Collombet Date: June 2013


Investigating soybean market situation in Western Kenya: constraints and
opportunities for smallholder producers
Minor thesis in Plant Production Systems: PPS - 80424
R.N. Collombet 920731-160-050
Wageningen University
June 2013
Supervisors
Dr. Frederick Baijukya
E. Ronner
Examiners
Prof. K.E. Giller
E. Ronner


Abstract
Soybean (Glycine max.) is one of the world’s major crops. It is cultivated for its high oil and proteins content and for its ability to increase soil fertility through biological nitrogen fixation. Since 2009, the N2Africa project has been promoting soybean in Western Kenya in order to increase productivity of the farming systems and to improve the livelihoods of smallholder farmers. Promotion has been realized through cooperative farmer groups known as soybean resource centres (SRCs). Their goal was to diffuse knowledge and inputs as well as provide a collective market output for farmers’ produce. The failure of many projects to promote soybean in Kenya has often been attributed to the lack of emphasis to market resulting in difficulties for farmers to sell surplus production. With N2Africa’s interventions focusing also on market, it is possible that this constraint no longer plays a significant role after its 3 years of operation. The goal of this study was to assess the current situation of soybean production and market by analysing the existing constraints and opportunities at both levels. For this purpose interviews have been realized with several actors of the soybean value chain: farmers, SRCs, boarding schools, local supermarkets and industrial processors. Results indicated that 40% of farmers had very low annual soybean production leading to net profit below Ksh 1,500 per year. This was mainly due to yields being half the attainable yields and the small areas under cultivation. Input rates were also less than recommended and delay in supply was some areas an issue. However farmers with high yields were generally enthusiastic about soybean production and could constitute a great potential to settle a sustainable production of soybean in the region. Net profit was on average Ksh 7 389 per year with high variability among farmers. Findings indicated that yields and individual production can be increased by addressing a few constraints (input availability, increase seed and fertilizer rate, increase farmer motivation) and by focusing on a limited number of farmers to make the best use of available resources. The principal market for farmers was the SRC and the major part of the soybean crop was sold to a unique industrial processor, Promasidor. Boarding schools (primary and secondary) appeared to be promising and accessible market (through school feeding program) while there were more constraints for accessing local supermarkets. Market output and profitability of SRCs can be increased by assisting them to become autonomous and proactive cooperatives for production and marketing.


- 1 -
Table of contents
Table of contents ................................................................................................................................................ - 1 -
Acknowledgments ............................................................................................................................................... - 3 -
1. Introduction ............................................................................................................................................... - 5 -
2. Background information ............................................................................................................................ - 7 -
2.1 Kenyan production, yield and surface of soybean ........................................................................ - 7 -
2.2 Soybean market in Kenya .............................................................................................................. - 7 -
2.3 Actors in the soybean market value chain in Kenya ...................................................................... - 8 -
2.4 National consumption of soybean ................................................................................................ - 9 -
3. Material and methods ............................................................................................................................. - 11 -
3.1 Study region ................................................................................................................................ - 11 -
3.2 Data collection ............................................................................................................................ - 12 -
3.3 Data analysis................................................................................................................................ - 13 -
3.4 Characteristics of the studied population ................................................................................... - 14 -
4. Results ........................................................................................................................................................... - 17 -
4.1 Production and market at farm level ......................................................................................... - 17 -
4.1.1 Total production and yield ................................................................................................. - 17 -
4.1.2 Delivery to SRC ................................................................................................................... - 19 -
4.1.3 Different scenarios on the total annual soybean production............................................. - 19 -
4.1.4 Production techniques, objectives and inputs ................................................................... - 20 -
4.1.5 Changes in production with the grouping project .............................................................. - 21 -
4.1.6 Production cost................................................................................................................... - 21 -
4.1.7 Market ................................................................................................................................ - 23 -
4.1.8 Farmer views on project improvement .............................................................................. - 25 -
4.2 Market and activities at SRC level ............................................................................................... - 27 -
4.2.1 SRCs activities and volume treated .................................................................................... - 27 -
4.2.2 Market ................................................................................................................................ - 28 -
4.2.3 Farmer groups views on project improvement .................................................................. - 29 -
4.3 Local market for processed products .......................................................................................... - 30 -
4.3.1 Schools ................................................................................................................................ - 30 -
4.3.2 Local supermarkets............................................................................................................. - 32 -
4.4 National industrial market .......................................................................................................... - 33 -
5. Discussion ...................................................................................................................................................... - 35 -
5.1 Constraints and opportunities at the production level ............................................................... - 35 -
5.2 Constraints and opportunities at the market level ..................................................................... - 37 -
6. Conclusion ..................................................................................................................................................... - 39 -
8. Bibliography .................................................................................................................................................. - 41 -
Table of appendix .............................................................................................................................................. - 43 -

- 2 -

- 3 -
Acknowledgments
I would like to thank Dr. Frederick Baijukya, Esther Ronner and Dr. Ken Giller for making this great opportunity of internship possible and for their precious assistance and comments during the research and writing phases of this report. I also thank Franklin Mairura for his skilled assistance with preliminary data analysis and Josephine Olwal for helping with logistics. I acknowledge teams of enumerators from MUDIFESOF and MDG and especially Pamela Atieng for her work as lead enumerator and Stephen Kasamani for his help in data collection. Finally I want to thank Edgar Kadenge for hosting us during this internship and for the precious help he provided at all steps.

- 4 -

- 5 -
1. Introduction
Soybean (Glycine max), one of the world’s major crops, has been cultivated by men since nearly 5000 years because of its agronomic and nutritional value. Soybean is a source of edible oil (second most consumed oil in the world after palm oil) and is used to produce livestock feed. Many other products with a soya basis are also directly used for human consumption (soymilk, soy yogurt, snacks, soya sauce, protein extract and concentrates, etc.). Major soybean producing countries are in order of importance; USA, Brazil and Argentina, while major consuming countries are USA, Canada, China and the European Union (FAO, 2011). Soybean production in Kenya is estimated at 4335 MT accounting for around 0.7 % of world production (FAO, 2011). Meanwhile soybean consumption in Kenya is constantly growing, the imported volumes increased from 50 000 MT in 2008 to 120 000 MT in 2011.
Soybean grain is known to have a protein content of about 40% of its mass (Duranti and Gius, 1997) whereas other legumes usually contain around 20% proteins. Moreover Jagwe and Owuor (2004) estimated the retail price of one kilogram of soybean protein to be Ksh 75 while it was Ksh 125 for common beans and Ksh 600 for beef. Apart from the nutrition value soybean has a great potential for improving soil fertility through its biological nitrogen fixation potential. Soybean N fixation is estimated to range between 44 and 103 kg N.ha-1
(Sanginga et al., 2003). The above properties make soybean an important crop to provide an affordable protein source and contribute to increased farm productivity in a country like Kenya where protein-energy malnutrition (PEM) is a major issue and soil fertility continues to decline (Ngare and Muttunga, 1999).
N2Africa project selected soybean along with common beans (Phaseolus vulgaris) for increasing the use of legumes in Kenyan farming systems. The goal is to harness N input through “biological nitrogen fixation”, to increase farming system productivity and to increase livelihood of smallholder farmers. In 2009 the project began to promote the cultivation of soybean through the diffusion of a technological package including improved varieties, inoculants, P fertilizers and cultural practices. Activities consisted of creating structures called soybean resource centres (SRCs), some of them were based on previously existing farmer group or development groups. SRCs represented a group of farmers growing soybean in a particular area. Their role consisted of capacity building of farmer through knowledge diffusion, demonstration field and farmer fielddays as well as providing input for soybean cultivation.. They were also involved in collective marketing and soybean processing activities for value addition. Another objective of N2Africa was to increase the total production of soybeans and common beans by increasing the cultivated area and improving yields. The production surplus was assumed to be absorbed by the local market since the annual domestic production accounts for less than 5% of consumption (Chianu et al., 2008).
Karuga and Gachanja (2004) attribute failure of many projects to promote soybean in Kenya to the lack of emphasis given to market organization resulting in difficulties for farmer to sell surplus production. With N2Africa intervention efforts focusing also on market, it is possible that this constraint no longer plays a significant role after its 3 years of operation.

- 6 -
The objective of this study was to assess soybean production and markets for smallholders in Western Kenya. Emphasis was put on evaluating constraints and opportunities at both the production and marketing levels. Indeed an estimation of the constraints and costs of local soybean production, of the attainable production as well as the potential of every market (local and national) is necessary to develop a strategy for further actions. For this purpose a series of interviews were conducted with farmers, soybean resource centres and local and national potential buyers.

- 7 -
0
10000
20000
30000
40000
50000
60000
70000
80000
90000
100000
1998 2000 2002 2004 2006 2008 2010
Qu
anti
ty o
f so
ybe
an p
rod
uct
s tr
ade
d (
t)
Total Import
Total Production
2. Background information
2.1 Kenyan production, yield and surface of soybean
Annual domestic soybean production between 2000 and 2010 was on average 2 425 MT (FAO, 2011). The yield ranged between 715 and 1 010 kg ha-1 with an average harvested area of 2 759 ha. The FAO data from 2011 shows a rise in production and yield up to the astonishing value of 2.5 t ha-1 (Table. 1). A recent experiment carried out by CIAT-Maseno (2013) found a potential yield of up to 3.5 t ha-1 for most improved varieties and 2.6 t ha-1 for the variety SB 19 (TGx 1740-2F) (CIAT-Maseno, 2013).
Table 1. Total production, harvested area and yield of soybean in Kenya from 2000 to 2011 (FAOSTAT, 2011).
Year 2000 2002 2004 2006 2007 2008 2009 2010 2011
Area harvested (ha) 2610 3008 3214 2513 2500 2615 2950 1621 1734
Production (t) 2384 2589 3246 2077 2100 2042 2110 1540 4335
Yield (kg /ha) 913 860 1010 826 840 780 715 950 2500
2.2 Soybean market in Kenya
Estimations of annual consumption of all soybean products (grain, cake, oil) in Kenya are in the range of 100 000 MT (Tinsley, 2009) to 150 000 M (Jagwe and Owuor, 2004). Meanwhile, domestic production accounts for a maximum of 5 000 MT. This situation leads to a national production deficit of around 95%, which is covered by importation (Figure 1).
Fig 1. Volume of soybean product imported and produced by Kenya (FAO (2011)). World price of soybean is dependent on the demand of soybean from the 3 main
consumers EU, China, North America and the production from USA, Brazil and Argentina. Demand is expected to increase in the coming decade due to growing population, higher meat consumption in emerging economies and biodiesel use. Meanwhile the production should follow and even outpace demand thanks to increase in the south American surface and yield improvement (Jagwe and Owuor, 2004).

- 8 -
The price of soybean, which has reached a record price in 2012, is expected to decrease slightly in the coming decade but will probably not come back to its previous level of before 2007 (World Bank, 2013).
Table 2. Price of one kilogramme of soybean in Kenyan Shillings at Rotterdam port
(Adapted from World Bank (2013) with 1 USD = 83 KSH).
Forecast
Year 2000 2005 2007 2008 2009 2010 2011 2012 2013 2015 2020
Price (Ksh.kg) 18,0 23,3 32,6 44,4 37,1 38,2 46,0 50,3 48,5 44,2 43,8
2.3 Actors in the soybean market value chain in Kenya
Some activities to improve soybean market have been conducted in the scope of N2Africa and a sister project Tropical Legumes Two (TL2), to deal with the low level of market organization. The activities relied on the three tiers approach as successfully experimented with in Nigeria and Zimbabwe (Chianu et al., 2009). This approach is based on the action on three levels of actors. The first tier focuses on increasing household production and consumption by diffusing agronomic techniques and inputs as well as processing techniques and recipes. The second tier focuses on the community level for absorbing production surplus by the means of grouping projects for marketing and processing of products. The third tier is the development of an industrial level market for soybean and involves large scale processors to absorb the entire production by substituting importation by local supply. This approach is supported by three pillars: strategic alliance of stakeholders along the soybean value chain, awareness creation and capacity building of stakeholders.
Fig 2. Current structure of soybean market value chain in Kenya
Local level
National level
National supermarkets
Local supermarkets
Soybean Resource centre
Large scale producers
Small producers
Industrial processors
Open air markets
Animal production
International level
International production
International organizations (WFP UNICEF)

- 9 -
15%
10%
75%
Human consumption
Internationalorganizations
Animal feed
All soybean resource centres are involved in technology and input diffusion and marketing of the production. On average SRCs have reached between 1 000 and 3 000 farmers who constitute their network. Among these farmers between 150 and 600 farmers are planting soybeans per season and per SRC. A small group of people (around 10 per SRC) takes care of the organization functioning. SRCs can sell up to 250 MT of soybean per year.
The latest attempt by the N2Africa project to improving the output market of soybean for farmers was to reach the market of national processing industry which produces oil, animal feed, human food and industrial material. The problem was that most of the factories were not ready to buy such small quantities of soybean and preferred to rely on importation. So as long as the production was too small the industry would not want to buy and as long as the market was restricted farmers would not produce more. Finally, to exit this vicious circle, a solution was found with Promasidor, a company that processes soybean into textured soybean protein. Promasidor agreed to buy soybeans at the farm gate at any quantities that farmers would produce and also agreed to provide loans (without interest) before the cropping season to help farmers to invest in fertilizers and inoculants. The interest of the company is to invest in local production to have a safe local and affordable supply of raw material and to be protected against international market fluctuation.
2.4 National consumption of soybean National consumption is divided between human consumption and livestock feed production (Figure 3). There is no recent official data on soybean consumption, the following paragraph is based on estimations made by Chianu et al. (2008). The market of livestock is growing fast and represents the primary utilization of soybean in Kenya, the main consumer being the poultry industry followed by dairy cattle. Human consumption accounts for 10 – 15% of total soybean requirements. The processing of soybean is dominated by national scale industrial processors (98 99%) among which are BIDCO, Promasidor and Proctor & Allan. The household and local human consumption market is very limited because of two factors: lack of awareness on nutritional content and on soybean preparation, the expensive and time consuming method for heating treatment of soybean (heating treatment is mandatory to deactivate trypsine inhibitors compound contained in soybean grain) (Chianu et al., 2009). Unlike other grain legumes such as common bean, groundnut or cowpea, soybean is not part of the traditional diet of Kenyans. International organisations like the World Food Program or UNICEF also require soybean. Their demand fluctuates and can constitute up to 10% of the total Kenyan consumption. Products demanded by these organisations include blended flours for domestic consumption and Unimix (a flour blend composed of 80% maize and 20% soybean used for emergency nutrition in refugee camps).
Fig 3. Percentage of the national soybean consumption by different sectors

- 10 -

- 11 -
3. Materials and methods
3.1 Study region
The study was carried out in Western Kenya, a region which accounts for more than 90% of the total Kenyan soybean production (Tinsley, 2009). Western Kenya is a particularly densely populated and productive agricultural region with an average land area of 1.6 ha per household. Main cultivated crops are: maize, beans, sugar cane and tea. The area suitable for soybean cultivation in Kenya is estimated at 224 000 ha. Nyanza and Western provinces are the most suitable places for soybean and they comprise 15% and 13% of this area respectively (Chianu et al., 2008).
The study area covered Kakamega and Busia districts. These are highly populated areas with 544 people per km² in Kakamega, and 430 people per km² in Busia (CRA, 2011). The agroecological zone is midlands/upper midlands with relatively high potential for agriculture and altitude ranges between 1 300 and 1 500 m. Rainfall is approximately 1 700 mm per year, the mean temperature is 20 °C and the growing period is long, between 300 and 330 days (Franke et al., 2011). Dominant types of soil are Acrisols, Nitisols and Lixisols. Soil fertility has declined over time because of the high population density and farming systems dominated by maize of sugarcane monoculture leading to soil erosion and diminution of nutrient and organic matter contents. Farmers in Kakamega district have access to town markets (Kakamega town, Kisumu) and Busia is situated at 2 hour drive from Kisumu but is right on the Ugandan border and it is a highly active commodity exchange area.
Fig 4. Map showing the location of studied area within Western Kenya (Source: maps.google.com)
- 12 -
3.2 Data collection
For the purpose of this study, five types of actors of the soybean market were been interviewed: - In order to obtain data on soybean production and market at farm level a representative
sample of 300 farmers growing soybean for at least 3 seasons was randomly selected from subscription lists provided by MUDIFESOF and MDG SRCs (see a description of these groups in the next paragraph). The sample was equally divided between the two SRCs, and as much as possible between male and female farmers. Wealth categories were determined by enumerators based on the resource endowment of farmers. Tables 4 to 6 in section 3.5 describe the composition of samples finally obtained.
- A group of representatives of four SRCs were interviewed as they represented an important part of N2Africa action and were responsible for technology diffusion and marketing. The Muungano Development Gateways (MDG) is located in Busia near the Ugandan border and has a good access to cross border markets, it represents around 1 300 farmer. It was established with support from CIAT in 2011 (first harvest in short rains 2011) and is only involved in technology/input diffusion and marketing. The Mumias District Federation of Soybean Farmers (MUDIFEOSF) located in Ekero near Mumias town, represents around 1 500 soybean farmers and has a lower access to markets. It has been active since the beginning of 2007 and besides technology and input diffusion it is also involved in processing of soybean into different products (soy milk, soy beverage, soy nuts, soy yogurt and blended flours). The Butere Soya Cooperative Society ltd (BUSCO) is located in Butere, it has a network of 400 active farmers and also processes soybean. The Teso SRC is situated in Teso, part of Busia district. Its acronym is OKOA. It was established with support from CIAT in 2011 and it is involved in technology/input diffusion and marketing.
- Western Kenya province has started a school feeding program which its goal is to attract children into the scholar system by providing healthy meals. As a consequence primary and secondary schools represent an important potential market for soybean. Seven school directors or head teachers from schools disposed to represent a market for soybean products were interviewed (Table. 3). Schools were located at less than 10 minutes by car from MUDIFESOF. Table 3. List of schools interviewed.
School name Number of student Public private Type
Shitoto Primary school 904 Public Mixed day boarding Maraba Primary school 787 Public Day school St. Stephens Secondary school 108 Public Mixed day boarding Lubinu Primary school 1600 Public Mixed day boarding St. Mathews Secondary school 856 Public Mixed day boarding Marsi Field of Life Primary school 255 Public Mixed day boarding Mumias academy Secondary school 320 Private Mixed day boarding
- Local supermarkets and small shops represent potential distributors of soybean
processed products. Two managers from two medium sized supermarkets around

- 13 -
Mumias town were interviewed. These were located at a distance of about 5 km from MUDIFESOF and their names areFrankmatt supermarket and Mama Watoto supermarket. Supermarkets of similar size can be found in principal rural towns of Western districts (e.g. Busia, Butere Bungoma, Kakamega, etc.). Two smaller supermarkets of Luanda town were visited to check the availability of soybean products.
- Finally industrial level processors represent a large market for soybean. Four large scale processors were contacted by e-mail. Processors chosen represented major sectors of soybean industry: BIDCO (oil and animal feed), Proctor and Allan (human food), Soyafric (UNIMIX), Promasidor (soybean textured proteins, human food).
Farmer and SRCs surveys were divided in three sections in order to collect information on: characteristics of the respondents, soybean production and soybean output market. Data collected were quantitative and qualitative. Survey forms are available in appendix I to V.
Survey tools for farmers and farmer groups were tested from April 3rd to April 5th and consequently rectified. The first series of interviews with farmers were conducted from April 15th to April 19th by 10 trained enumerators (5 per SRC) supervised by a lead enumerator. Chair members of SRCs were interviewed by the researcher from April 15th to April 19th.
Surveys for schools and supermarkets were conceived to be short (less than 15 minutes) and were meant to collect information about: current use/retail of soybean, knowledge on soybean, current use/retail of products substitutable by soybean products (milk, yoghurt, maize flour, beans). All schools and supermarket interviews were conducted on May 31st.
3.3 Data analysis
Data from the 300 farmer survey forms wereanalyzed with the statistical package for social science (SPSS 20.0) and Microsoft Excel. Relationships with a numerical variable and categorical factors (mostly SRC, wealth category and gender) where analyzed using ANOVAs with a significance level of P=0.05. Means were compared using uncorrected pairwise comparisons at 95% confidence interval. Finally a categorical logistic binary regression was used to test the relationship between a dichotomous variable and categorical regressors at a significance level of 55. All SPSS outputs for ANOVA are available in appendix VII to XII plus appendix XVIII. In the first table one can find the number of missing values for each ANOVA.
The annual production (year 2012) was divided by the area planted to convert the yield to kg ha-1. If farmers had planted soybean in the long rains and shorts rains it was assumed that they planted the same area. Annual production and planted area were not measured, they are farmers’ estimates. The following formula was used to estimate season yields:
The total production of all farmers involved in MDG and MUDIFESOF were estimated
using the following formula (e.g. for MDG):

- 14 -
( )
For an estimate of the current production every parameter of the equation was taken
from sample means at the lower bound of the 95% confidence interval (Appendix VI). Different scenarios were tested by making assumptions on the value of different parameters of the equation.
The delivery rate of soybean to SRCs was estimated with the following formula:
As farmers could not estimate the rate of input use but only the quantity of input used, the rate was calculated by dividing the declared volume of input used by the declared planted area.
Partial production costs were calculated for one hectare of soybean. This calculation included the cost of fertilizer, inoculants and seeds based on the estimated rate and the declared price. As many farmers did not know the application rate they used for biocide it was assumed that this was the recommended rate of 750 ml per hectare (reference..).
The input costs per kg of soybean have been derived from the input costs per hectare and the yield.
3.4 Characteristics of the studied population
Table 4. Composition of farmer sample studied in MDG.
Gender Wealth category
Poor Average Total Male 16 76 92 Female 37 17 54 Total 53 93 146
Table 5. Composition of farmer sample studied in MUDIFESOF.
Gender Wealth category
Missing Poor Average Rich Total Male 4 24 31 8 67 Female 1 27 21 4 53 Missing 0 5 19 7 31 Total 5 56 71 19 151

- 15 -
Table 6. Average age of the household head, time since they are involved in SB
production, available workforce in MDG and MUDIFESOF.
SRC
Wealth
category
Farm area
(ha)
Age of the household
head
Years of SB production
Available
workforce1
Busia Poor 1.17 37.9 2.0 3.85 Medium 1.2 41.4 1.9 4.4
Mumias
Poor 0.7 47.7 3.0 4.9
Medium 1.4 48.3 3.7 5.7
Rich 2.2 55.6 4.4 6.8 1 Person present on the farm aged from 12 to 60.
.

- 16 -

- 17 -
4. Results
4.1 Production and market at farm level
4.1.1 Total production and yield
The total production in 2012 for the 300 studied farmers was 87.3 t, which represented on average 294 kg per farmer per year (Table 7). This data is based on farmers’ estimates. Average production had a standard deviation of 338 kg with 40% of farmers producing less than 100 kg. There was a significant interaction between wealth category and SRC for the quantity of soybean produced per farmer (P<0.001) (Appendix VII). In MDG the quantity produced by poor resource endowed farmer was lower than the quantity produced by medium farmers. There was no significant difference between medium and poor resource endowed farmers in MUDIFESOF. The average production per capita was higher in MDG (P=0.017) with 343 kg than in MUDIFESOF with 249 kg.
Table 7. Average soybean production (kg) in MDG and MUDIFESOF. Different letters indicate significant differences between means (P=0.05).
SRC Wealth category Total
Poor Medium Rich MDG 41.6 a 542.1 c - … MUDIFESOF 189.4 ab 227.9 b 527.6 c …
51% of the farmers only produced soybean one season per year (in almost all cases during
the short rains) while the other half produced during both short and long rains. 4% of farmers intercropped soybean with maize or sugarcane.
The absolute value of the land committed to soybean cultivation depended on the SRC, and the wealth category (P<0.001) (Appendix. XVIII) (table. 8), it was on average 0.23 ha per farm except for poor farmer of Busia who committed 0.035 ha. In total 67.5 ha were under soybean cultivation in 2012. However, interactions between SRC and wealth category for the percentage of the land committed to soybean production were significant (P<0.001) (Appendix VIII). Poor resource endowed farmers committed a lower percentage of their land to soybean than medium farmer in MDG. Whereas in MUDIFESOF, poor resource endowed farmer committed a higher percentage of their land to soybean production than medium and rich farmers.
Table 8. Average percentage of land committed to soybean cultivation by farmers of
different wealth category, SRC and gender. Different letters indicate significant differences between means (P=0.05).
SRC Wealth category
Poor Medium Rich MDG 9.3 a 40.9 b - MUDIFESOF 56.7 c 34.3 b 24.4 ab

- 18 -
0
200
400
600
800
1000
1200
1400
MDG MUDIFESOF
Yie
ld (
kg,h
a-1)
Male
Female
a
b
b
b
The estimated average yield was 922 kg h-1. Average yield was lower for poor resource endowed farmers with 768 kg ha-1 compared with 1045 kg ha-1 for average farmers (P<0.001) (Appendix. IX). The group of rich farmers had an average yield of 981 k.ha-1 but a standard error three times higher than other groups, therefore it was not s tatistically different from other groups. 65% of farmers had a yield lower than 1 000 kg ha-1 and only 4% had a yield higher than 2 000 kg.ha-1 (fig. 6). The interaction between gender and SRC was significant (P=0.037). Yields were significantly lower for MUDIFESOF poor resource endowed farmers than for all other groups (Figure 5). Beside yields were no significantly correlated with the total number of seasons farmers had grown soybean or with the age of the household head (Appendix XIII).
Figure 5. Average soybean yield for Male and Female farmers in the SRCs of MDG and
MUDIFESOF. Different letters indicate significant differences between means (P=0.05).
Figure 6. Distribution of yields among respondents.
0%
5%
10%
15%
20%
25%
30%
35%
40%
0 - 500 501 - 1000 1001 - 1500 1500 - 2000 2000 - max
Yield (kg.ha-1)

- 19 -
4.1.2 Soybean delivery to SRCs The estimated total production in year 2012 by farmers who were members of SRCs was 79.8 t for MDG and 40.6 t for MUDIFESOF. The delivery in year 2012 to MDG and MUDIFESOF was 37 t and 30 t respectively. The apparent delivery rate (ratio: estimated production / actual delivery to SRC) was 46% and 74%. The estimated delivery rate from the sample population (ratio: sample declared production/ sample declared delivery) (Table 9) was 90% in MDG and 75% in MUDIFESOF. There was a gap between the apparent delivery rate and the delivery rate estimated from the sample in MDG.
Table 9. Apparent and estimated delivery rate for both SRCs.
SRC
Estimated production
(t)
Real delivery
(t)
Delivery rate
Sample declared
production(t)
Sample declared
delivery(t)
Sample delivery
rate
MDG 79.8 37 46% 49.7 42.7 90% MUDIFESOF 40.6 30 74% 37.6 28.2 75%
4.1.3 Different scenarios on the total annual soybean production
Three scenarios have been tested to evaluate the potential production of each SRC (Table10). The first scenario represents the 2012 situation based on farmer estimates. In the second scenario all farmers of SRC’s network planted soybean with the current (2012) estimated average yield and surface. In scenario three the current number of farmers planted soybean but assuming they had a higher yield. Yield estimates used are from the confidence interval of the sample means (Appendix VI) (in MUDIFESOF the upper bound was the female farmer’s yield as it was substantially higher than male farmer to set an optimistic target). In scenario four every farmers of each network produced this higher yield.
Table 10. Different scenario of total annual production of farmers involved in MDG and MUDIFESOF SRCs.
SRC Scenario Number of
farmer planting Farmer planting
twice a year SB land
Estimated yield
(kg /ha)
Annual production (t)
MDG
Current 300 41% 0.17 971 79.8 All farmers plant 1 300 41% 0.17 971 302.6 Higher yield 300 41% 0.17 1 128 81.1 Potential prod 1 300 41% 0.17 1 128 351.5
MUDIFESOF
Current 220 45% 0.21 606 40.6
All farmers plant 1500 45% 0.21 606 276.8
Higher yield 220 45% 0.21 1 110 74.4 Potential prod 1500 45% 0.21 1 110 699.3

- 20 -
0%10%20%30%40%50%60%70%80%
SB19 Samba SB3 Other (SB20,SB25, Squire)
4.1.4 Production techniques, objectives and inputs
Planting and harvesting technique were similar among respondents. Soybean was cultivated in pure stand at the beginning of the rainy season and takes 3 to 3 ½ months to mature. It was sown in lines drilled in furrows opened a distance of45 cm between lines and 5 cm within lines. It was harvested either by uprooting or cutting followed by shelling though beating with sticks. Shelled soybean was then winnowed and sun dried. The most planted variety was SB19 (68% of farmers) as it is the variety most preferred by Promasidor (Figure 7) as it meets the factory requirements (high protein content, protein/oil ratio of 2/1)
Figure 7. Percentage of interviewed farmers using different soybean varieties.
Reasons for cultivating soybean were ranked by farmers on a 1 to 5 scale (Table 11). The overall most important reason for production of soybean appeared to be income generation, with 60% of the farmer placing it in first position and 20% in second resulting in an average rank of 1.77. The other three principal reasons (increasing soil fertility, household consumption and nutritional value) had a very similar rank. The interaction between wealth category and SRC for the average rank of income generation was significant (P=0.001) (Appendix. X). In MDG poor resource endowed farmers were less interested in income generation with a response of 3.1 than medium farmers with 1.1. In MUDIFESOF the place given to income generation did not differ among wealth class and was lower than medium farmers of MDG. In MDG poor resource endowed farmers gave a higher importance to household consumption and nutrition. Farmers that did not use SB19 had a lower interest in income generation with an average rank of 2.07 while farmer that used SB19 gave an average rank of 1.62.
Table 11. Average rank of reasons to produce soybean for farmers of different wealth
categories in MDG and MUDIFESOF. Different letter indicate significant difference between means according to the confidence interval comparison (P=0.05).
Reason MDG MUDIFESOF Overall
Poor Medium Poor Medium Rich Income 3.08 c 1.10 a 1.62 b 1.86 b 1.72 b 1.77 Soil fertility. 2.72 2.65 2.75 2.61 2.72 2.68 Household cons.1 1.64 3.06 2.89 2.97 3.17 2.76 Nutritional value1 2.55 3.19 2.80 2.56 2.61 2.82
1 Answers household consumption and nutritional value were both proposed to farmers but indicate more
or less the same idea.

- 21 -
The interaction between wealth category and the quantity of seed used per ha was significant for MDG only (P=0.005) (Appendix. XI). In MDG poor resource endowed farmers used less seed per ha than medium farmers. There were no particular patterns in fertilizer, inoculants or biocide use according to gender or wealth class. However the rate of use of these inputs differed among SRCs. Table 12 shows the average rate of inputs and the frequency of input use in MUDIFESOF and MDG in comparison with the recommended rates. In MDG all farmers apply biocides thanks to teams of sprayers supervised by the SRC going from farm to farm.
Table 12. Average rate of inputs and percentage of user in MUDIFESOF and MDG.
Input MDG
MUDIFESOF
Recommended
Rate Users
Rate Users
Rate
Fertilizer1 (kg.ha-1) 59 97%
109 99%
120
Inoculant (g.ha-1) 270 96%
442 97%
750
Biocides (ml.ha-1) 2862 100%
1052 71%
750
Seed (kg.ha-1) 43 100%
52 100%
75 1 Sympal fertilizer (0 - 23 - 16+ ).
2 This value has been calculated with only 7 individuals.
The great majority of farmers are supplied by soybean resource centres. When this is the case, the SRC always provides inputs recommended by N2Africa: Sympal fertilizer, MEA Biofix and Amistar Xtra fungicide. A few farmers buy their own fertilizer (DAP) and biocide from agrovet dealers at a higher price than when supplied by the SRC.
4.1.5 Changes in production with the grouping project
The main difficulties encountered by farmers for soybean cultivation were linked to climatic events (heavy rainfall, hailstones), to disease and to a high workload. Some farmer also mentioned a laborious post-harvest treatment due to irritating dusts.
When asked what has changed in soybean cultivation since the grouping project with SRC exists (Appendix XIV), 74% of farmers in MDG mention an adoption of BNF technology (access to Biofix, Sympal and new varieties and implementation of new techniques) while farmers of MUDIFESOF refer to a better access to inputs thanks to loan. 67% of farmers mentions a higher soil fertility resulting in a higher production of other crops, greener leaves of maize as well as lower striga infestation. 51% of farmers declare having increased their surface of soybean and 77% has increased their production thanks to SRC, 5% plan to increase their planted area even more. Finally some farmers mentioned other benefits like the possibility to pay school fees for their children (5%) or a greater involvement in soybean cultivation thanks to group monitoring (2%).
4.1.6 Production cost
Production costs have been calculated per ha taking into account fertilizer, seed, inoculants and biocide costs. The estimated cost of biocide was higher in MDG because MUDIFESOF manages to negotiate the price on volumes to get it at 3 800 Ksh per litre while Busia SRC buys it at 5 600 Ksh per litre.
The cost of seed was higher in MDG mostly because they use a system where for each kg of seeds loaned to a farmer at the beginning of the season, 2 kg of seeds must be returned. This resulted in a cost of 100 Ksh per kg while in MUDIFESOF farmers had to pay back 78 Ksh
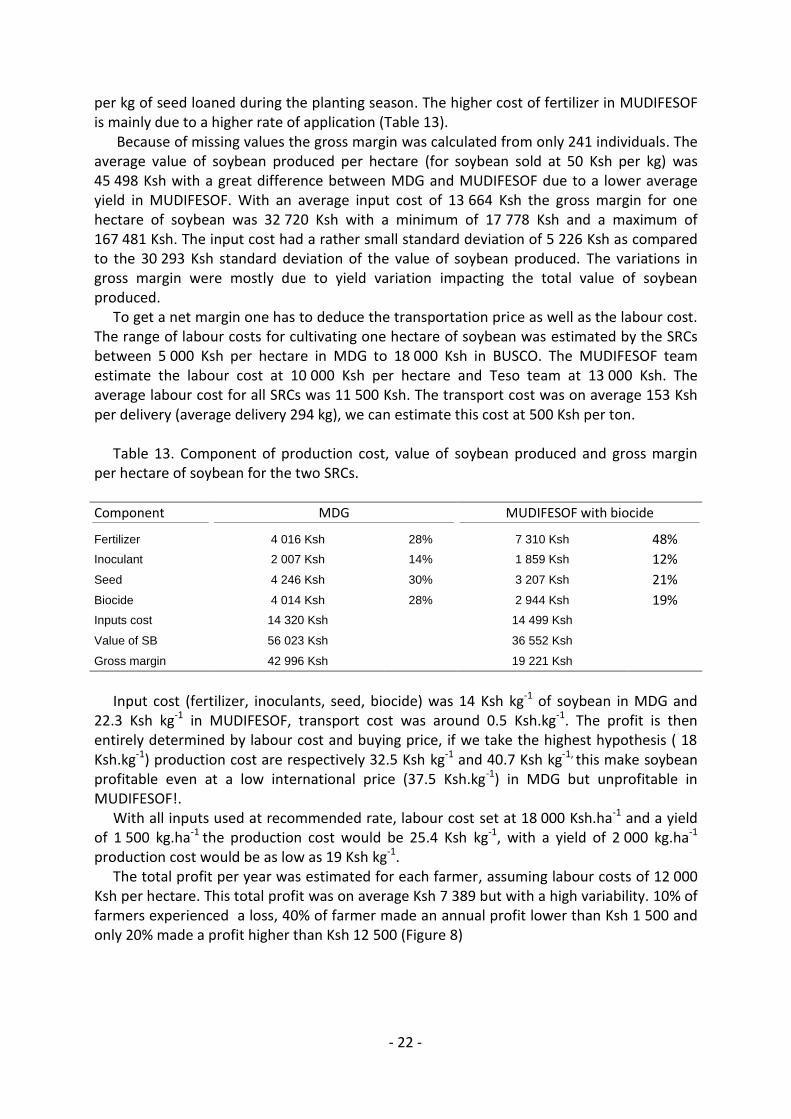
- 22 -
per kg of seed loaned during the planting season. The higher cost of fertilizer in MUDIFESOF is mainly due to a higher rate of application (Table 13).
Because of missing values the gross margin was calculated from only 241 individuals. The average value of soybean produced per hectare (for soybean sold at 50 Ksh per kg) was 45 498 Ksh with a great difference between MDG and MUDIFESOF due to a lower average yield in MUDIFESOF. With an average input cost of 13 664 Ksh the gross margin for one hectare of soybean was 32 720 Ksh with a minimum of 17 778 Ksh and a maximum of 167 481 Ksh. The input cost had a rather small standard deviation of 5 226 Ksh as compared to the 30 293 Ksh standard deviation of the value of soybean produced. The variations in gross margin were mostly due to yield variation impacting the total value of soybean produced.
To get a net margin one has to deduce the transportation price as well as the labour cost. The range of labour costs for cultivating one hectare of soybean was estimated by the SRCs between 5 000 Ksh per hectare in MDG to 18 000 Ksh in BUSCO. The MUDIFESOF team estimate the labour cost at 10 000 Ksh per hectare and Teso team at 13 000 Ksh. The average labour cost for all SRCs was 11 500 Ksh. The transport cost was on average 153 Ksh per delivery (average delivery 294 kg), we can estimate this cost at 500 Ksh per ton.
Table 13. Component of production cost, value of soybean produced and gross margin
per hectare of soybean for the two SRCs.
Component MDG MUDIFESOF with biocide
Fertilizer 4 016 Ksh 28% 7 310 Ksh 48%
Inoculant 2 007 Ksh 14% 1 859 Ksh 12%
Seed 4 246 Ksh 30% 3 207 Ksh 21%
Biocide 4 014 Ksh 28% 2 944 Ksh 19%
Inputs cost 14 320 Ksh
14 499 Ksh
Value of SB 56 023 Ksh 36 552 Ksh
Gross margin 42 996 Ksh 19 221 Ksh
Input cost (fertilizer, inoculants, seed, biocide) was 14 Ksh kg-1 of soybean in MDG and
22.3 Ksh kg-1 in MUDIFESOF, transport cost was around 0.5 Ksh.kg-1. The profit is then entirely determined by labour cost and buying price, if we take the highest hypothesis ( 18 Ksh.kg-1) production cost are respectively 32.5 Ksh kg-1 and 40.7 Ksh kg-1, this make soybean profitable even at a low international price (37.5 Ksh.kg-1) in MDG but unprofitable in MUDIFESOF!.
With all inputs used at recommended rate, labour cost set at 18 000 Ksh.ha-1 and a yield of 1 500 kg.ha-1 the production cost would be 25.4 Ksh kg-1, with a yield of 2 000 kg.ha-1 production cost would be as low as 19 Ksh kg-1.
The total profit per year was estimated for each farmer, assuming labour costs of 12 000 Ksh per hectare. This total profit was on average Ksh 7 389 but with a high variability. 10% of farmers experienced a loss, 40% of farmer made an annual profit lower than Ksh 1 500 and only 20% made a profit higher than Ksh 12 500 (Figure 8)

- 23 -
Fig 8. Percentage of farmer in categories of estimated annual soybean profit (in
Ksh/farmer/year???). Farmer’s annual income from soybean (table. 14) was affected by the interaction
between wealth category and SRC (P<0.001 ) (Appendix XII). Income from soybean was lower for poor resource endowed farmers than for average farmers in MDG while there was no significant difference between wealth categories in MUDIFESOF. The income was the highest for average farmers of MDG and rich farmer of MUDIFESOF, which is mostly explained by the highest yields achieved by these groups of farmers.
Table 14. Average income (in KSh per year) from soybean production in the SRCs of MDG
and MUDIFESOF. Different letters indicate significant differences between means (P=0.05).
Poor Medium Rich MDG 1 918 a 26 019 c - MUDIFESOF 7 995 ab 9 211 b 22 742 c
4.1.7 Market
The findings of this survey suggest that SRCs are the primary market for smallholder farmers, 74% sold their production exclusively to SRCs and 89.7% sold at least part of their production to SRCs. 85.5% of the total volume of soybean produced was sold to SRCs, the remaining was sold to open air markets (2.5%) or domestically consumed (9.7%) or directly sold to an industrial processor, Promasidor. This last case was mentioned for only one farmer with a volume of 1.9 t that represented 2.3% of the total volume produced. One fifth of farmers sold a part of their production to local open air markets, when they sold both to SRC and local market the proportion was 14% to open air market and the rest to SRCs.
The categorical binary logistic regression to determine the effect of wealth category, SRC and gender on the likeliness to sell soybean in open air market was not significant (Appendix XIII).
Soybean price paid to farmers were the same in both SRCs at 50 Ksh per kg, but it was 79 Ksh per kg and 70 Ksh in open air markets and to middlemen respectively.
The major factor that influenced the choice of the market was the price, with 90% and 66% of answers in MDG and in MUDIFESOF respectively. Other factors like market
0
5
10
15
20
25
30
-7 7
00
- 0
1 - 1
50
0
1 5
01
- 30
00
3 0
01
- 10
00
0
10
00
1 - 3
00
00
30
00
1 - 4
00
00
40
00
1 - 5
00
00
50
00
1 - 6
00
00
60
00
0 - 7
07
00

- 24 -
0%
10%
20%
30%
40%
50%
Collectivemarketing
Take bigquantitiesall at once
Reliablemarket
Pay cash Stable price
Advantages - SRC
0%
10%
20%
30%
40%
50%
SRC lack ofressources
Latepayment
Buy late Strict rules Low price
Disadvantages - SRC
0%
20%
40%
60%
80%
High price Market on your own
Advantages - Open air market
0%
20%
40%
60%
80%
Smallvolume
Take a longtime
Rainfalls Pricevariability
Distance
Disadvantages - Open air market
availability, distance and the quantity to be sold influence the choice of market (more than 15% of answers for each of these factors, see Appendix XIV).
93% of farmers sold their production directly after harvest, reasons mentioned are: the market is ready to buy (I have no reason to wait) (46%), I need cash to pay school fees or other household expenses (21%), this is the rule of SRC (10%), to avoid loss due to storage (10%), to have time and money to prepare the next crop (10%). These results indicate that the role of providing fast cash for different needs is important for soybean with around 30% of the answers. Farmers that stocked soybean to sell it later (7%) did this to get higher prices and most of the time awaited the next planting season because of higher demand at this period.
Farmers were asked to indicate constraints and opportunities of different markets (Figure 9). Answers about industrial processors will not be treated here as farmers do not have a direct relationship with Promasidor but through the intermediary of SRCs. Only a third of farmers gave their opinion on constraints encountered with middle men, in 95% of the cases the low price was mentioned (for advantages mentioned for middlemen see Appendix XV). Open air markets were largely liked for the high price they offer (88%). The major constraint mentioned was the small volumes one can sell/lack of customers (68%).
Fig 9. Frequencies of answers of farmer to questions on advantages and inconvenient of
SRC market and open air markets.

- 25 -
Major advantages of SRCs were the possibility to sell in big quantities “all at once” and to get paid only once (29%) and the collective marketing (this answer consists of: gathering of produce, advantages of the group in terms of support, large market, possibility to meet other farmers) (52%). The major constraint was the late payment with two to three months delay. The answer “lack of resources of the SRC (30%)” was only found in MDG and can be interpreted has a lack of supply of inputs because of a too high number of farmers. The answer “price is too low” (20%) was very frequent in MUDIFESOF with 39% of occurrence while only 5% in MDG, although farmers received the same price for their produce in both SRCs.
Concerning the change in soybean market since the grouping project exist the most common answers were: the transport cost reduced (61%), the price stabilized (52%) and prices are higher (30%). 12% of farmers, all situated in MUDIFESOF, answered that the transport cost is higher or has not changed since Promasidor does not take care of collection points anymore.
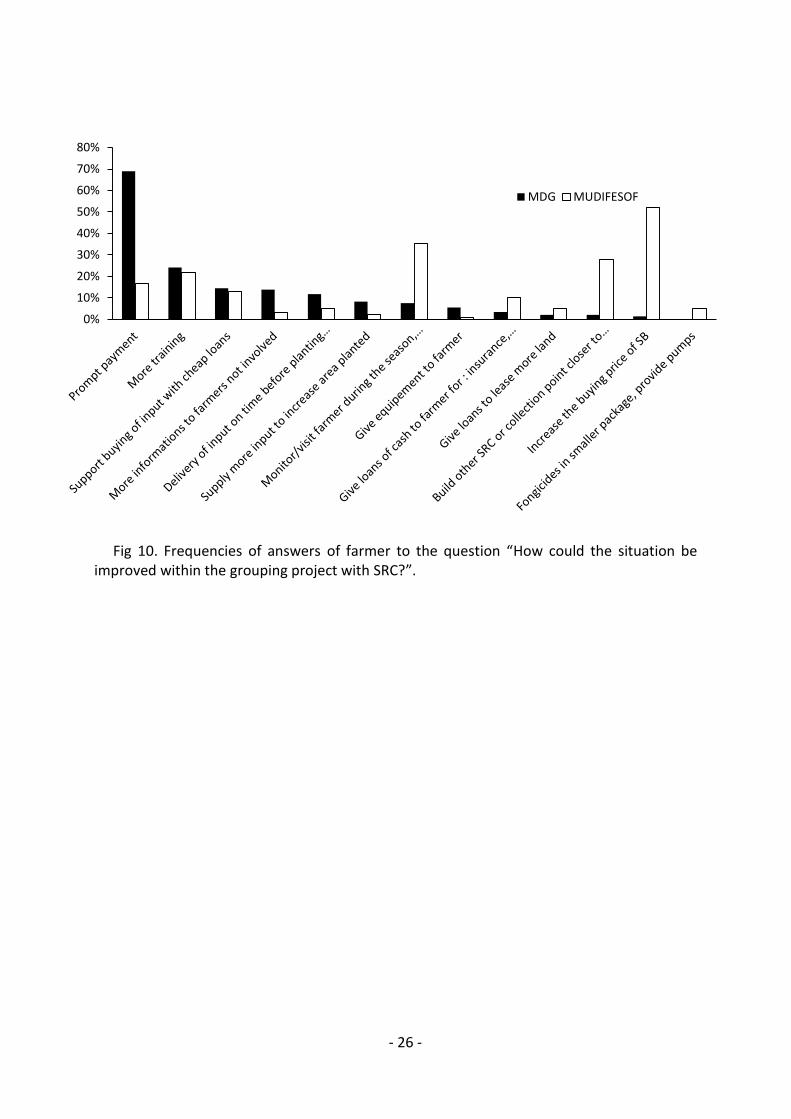
4.1.8 Farmer views on project improvement
Farmers were asked how the situation could be improved within the grouping project (Figure 10) (Appendix XVI). To receive prompt payment after soybean delivery was the strongest concern of farmers (44%) and seemed more important in MDG (69%) than in MUDIFESOF (17%). To increase the buying price of soybean was the second most frequent answer (24%), with almost all answers coming from MUDIFESOF farmers. Be trained and monitored with regular check-ups during season was also often mentioned. The support for purchasing inputs was already the case in MUDIFESOF until recently; they are now switching to loans provided by bank because of non-recovery issues.
In MUDIFESOF farmers also requestedfor spraying pumps and smaller packaging for pesticides adapted to the small acreage. 8% of farmers asked for a delivery of input on time before the planting season and 9% asked for a higher quantity of input to plant more land (the quantity of input per farmer is sometimes limited to divide the available amount equally between farmers, particularly in MDG). 3% asked for loans to lease more land for soybean. 3% of farmer asked for equipment for soybean cultivation (trampolines, fungicide sprayers, etc.) and even for a bicycle with a soybean sticker to promote cultivation. However, these suggestions only came from one enumerator with a really standardized answer and this is possibly a bias introduced by him. Some 7% of the farmers, mostly from MUDIFESOF, asked for loans to support farmers in their living expenses like school fees, health insurance, etc.
- 26 -
0%
10%
20%
30%
40%
50%
60%
70%
80%
MDG MUDIFESOF
Fig 10. Frequencies of answers of farmer to the question “How could the situation be
improved within the grouping project with SRC?”.

- 27 -
4.2 Market and activities at SRC level
4.3.1 SRCs activities and volume treated
All SRCs were involved in inputs and seed supply, technology diffusion and marketing. MUDIFESOF and BUSCO also processed soybean into various products: soymilk, soy nuts, soy flour, soy beverage, soy yoghurt, soy cake/mandazi. MDG has encountered a very fast expansion from 50 kg in 2011 to 37 t in 2012 with a very limited number of farmers in the network (340) but 300 active farmers. BUSCO produced on average 40 t per year, MUDIFESOF 30 t and OKOA 12 t. MUDIFESOF had a network of 1 500 farmers with around 200 farmers active per season, BUSCO had more than 400 farmers and OKOA had 2 000 farmers with 300 active per season.
Average delivery per farmer was estimated by SRC members at 200 kg per farmer in MUDIFESOF and 300 kg in MDG. BUSCO only gave an estimation of the yield at between 400 to 500 kg per acre or 988 to 1235 kg per ha. Teso declared an average delivery of 100 kg per farmer, if we estimate the production of each farmer to be on average 100 kg, the total production should be around 60 t per year but Teso treated 12 t which makes a potential gap of 48 tons. This indicates that from the 600 farmers per year that received inputs in Teso only around 120 actually delivered soybean to the SRC. Apparently a great number of farmers from this SRC took seeds and inputs at the beginning of planting seasons but never returned any soybean. When enquired by members of the SRC they often gave as pretext that the harvest had been entirely spoiled by climatic events (hailstones, drought, heavy rains) or pests. This might be partially true but it is also likely that some farmers sold soybean on informal markets or traded with Uganda (Teso is close to the border). It is however hard to estimate the potential gap, farmers that did not deliver may have had a lower or a higher production that the one that did delivered. In 2012 OKOA delivered 5 t of fertilizer, which was enough to produce 39.5 t of soybean if used at the recommended rate of 120 kg ha-1 and with a yield of 0.95 t ha-1.
Data collected on the distribution of inputs by SRCs shows incoherencies in MDG. For example, last year MDG had distributed 10 t of fertilizer and 7 t of seeds. However, considering that farmers committed 0.245 ha per season, that 58% of farmers grow soybean both seasons and that the fertilizer rate is 70 kg ha-1 and seed rate 49 kg.ha-1, the consumption of fertilizer should have been 8.1 t and seeds 5 t (every parameter used in this calculation is the upper bound of the 95% confidence interval of estimated population mean). These differences can be explained by incorrect data given by MDG or higher input rates than previously estimated (due to data collection and treatment bias). In MUDIFESOF the quantity of input distributed fitted in estimation intervals. Besides if we estimate the amount of land that should be cultivated with inputs provided by SRCs it appears that inputs are not given in the right proportions (Appendix XVII). In MDG the quantity of Biofix distributed is 4 times lower than it should be. This is also true in BUSCO where it is 6 to 7 times lower than it should be.
Fertilizer prices differed from one SRC to another, with 60 Ksh kg-1 in Teso, 75 Ksh.kg-1 in MDG, 78 Ksh.kg-1 and 80 Ksh kg-1 in BUSCO. Biofix was always sold at 400 Ksh per 100 g packet. Finally the seed price differed also a lot with 80 Ksh in MUDIFESOF, 60 in BUSCO and MDG had a system of 2 kg given back for 1 kg loaned or an actual price of 100 Ksh kg-1.
When asked about constraints of soybean cultivation members of SRC mentioned climatic events (hailstones, drought, and flood), problems with leaf rust root rot and labour related issues. According to them, soybean is labour intensive for farmer, the labour price and input

- 28 -
price is higher than for other crops. Farmers also complain about post-harvest treatment (crushing, washing) to be too labour intensive. BUSCO members also point out a lack of packaging material (bags) and drying material (tarpaulins).
MDG had issues with supply of inputs, they have been facing delay in delivery of input (fertilizer and seeds) by Promasidor leading to a shift in planting time causing lower yields. Besides, their financial capacity does not allow them to buy enough fertilizer and seeds to supply all farmers and they have to limit the cultivated surface per farmer. Biocide supply (Amistar Xtra) is also an issue in all SRCs because of delay in delivery and the large size of packages, not adapted to farmers’ needs.
4.3.2 Market
The price paid to farmers for 1 kg of soybean was 50 Ksh for grain and 60 Ksh for seeds in all SRCs. In BUSCO and MUDIFESOF Promasidor represented 37.5% and 43% of sales respectively, and 90% in Teso and 97% in MDG. Promasidor is considered as the only entirely reliable market though MUDIFESOF had expressed reservations on the future of negotiations and relations with Promasidor when N2Africa will not play the intermediary anymore. All SRCs sold around 1 t of seed to other farmer groups and individual farmers of local markets. This represented the only other market in Teso and MDG. Other markets for MUDIFESOF and BUSCO were: - Seeds: to other institutional organization like KARI (Kenyan Agricultural Research
Institute) at a price of 60 Ksh. This market has been described as pretty stable though there is no possibility for an increase in volume.
- Grain: to a UNIDO processing plant in Kisumu (5.5 t for MUDIFESOF and 2 t for BUSCO). This market is decreasing and unstable according to BUSCO. MUDIFESOF considered this market as an achievement and a proof of the capacity of their SRC to find other markets since they made this contract in autonomy from the beginning. However this UNIDO project had stopped before marketing structures were set up and this market is unpredictable by now.
- BUSCO sold 1 t to BIDCO at 37.5 Ksh per kg, though the price and volume are very low this contract proves it is possible to interest industrial processor into local supply.
- Local market for processed products (everything is sold at the SRC headquarter), representing 50% of BUSCO’s soybean (20 t)1 and 6% of MUDIFESOF’s soybean (1.8 t). Preferred products were soymilk, soy cake, soy mix flour and soy beverage. Both SRCs think there is a good potential market and they have the capacity to increase processing (up to 6 t for MUDIFESOF). The major problem is that until nowadays they did not have the necessary certification for processing and packaging to sell their products to commercial (supermarkets) or institutional entities (schools, health centres, etc.). They expect to have these certifications soon and plan to increase processing a lot thanks to these new markets. The major constraint expressed by farmer groups at the marketing level is the delay of
payment from Promasidor (2 to 3 months) and the collection late after harvest which forces them to store soybeans. MUDIFESOF has a really low storage capacity and has to store soybean in very poor condition while waiting for Promasidor. The fact that the transportation system shifted from multiple collection sites to only SRCs puts another financial burden on farmer groups that now have to pay for the transportation from
1 This figure may have been overestimated by BUSCO SRC members.
- 29 -
collection sites to their headquarter. These additional costs have taken their entire margin (1.5 Ksh per kg) and leads to losses for SRCs in the case of MUDIFESOF and BUSCO.
OKOA and MDG were also concerned by the lack of diversification in there buyers and think that competition between buyers would be beneficial for the group.
4.3.3 Farmer groups views on project improvement
From the production point of view SRCs were unanimous to say there is progress to accomplish. Farmers still do not have enough interest in producing soybean, MUDIFESOF and BUSCO even said that most of farmers were “not serious” with soybean and that it is not a crop “for lazy persons”. According to them soybean suffers competition for land and for attention from sugarcane and bush beans. Farmers neglect soybean production for other staple food and produce in very little quantity, not enough to be profitable. Those who make profit are the ones that invest in production and cultivate according to best agronomic practices.
To address these problems SRCs first said that a higher price would be a good incentive for farmers to interest them in soybean production. They also recognized that with the current price soybean can already be very profitable. There are constraints mainly in the quantity of inputs available and on the time of delivery, production could be better if fertilizer, seeds, biofix and biocide were supplied in quantity and on time. Finding an effective system of loans was also important because SRCs can no longer afford to handle loans by themselves, they wanted to outsource loans through banks. Farmers still lack knowledge on crop management practices and more training would be necessary. Besides, all SRCs agreed on the fact that regular monitoring and follow-up of farmers, as practiced in the sugar cane industry, would help a lot to motivate farmers and improve yields. On this particular topic the MUDIFESOF director said that better management practices should be applied to the personnel of SRCs, especially with master farmers/ trainers. He said they could be interested in training, monitoring and recruiting of farmers if they would have a remuneration of 1 Ksh per kg produced in their subscription. MDG evoked a similar idea, but oriented to farmers, with a premium price or certification for those who produced high quantities with a good yield.
Concerning markets, all SRCs pointed out the delay of payment by Promasidor as being the number one issue. Farmers cultivate soybean as a cash crop and put a lot of expectations in it. They want to receive cash on delivery to pay school fees, medical care or even to buy commodities they did not produce because of soybean. Delay in payment discourages farmers and prevents them from continuing to grow soybean. Farmer groups claimed for financial autonomy to be able to pay farmers cash on delivery and also to have stocks of inputs. Issues of transport have also to be addressed in MUDIFESOF and BUSCO to reduce the cost, proper collection points with storage facilities would also be needed to prevent loss of soybean at farm level.
All farmer groups seemed confident in the future market with Promasidor as long as the constraint of payments can be addressed. However MUDIFESOF and Tesso raised concerns on their ability to contact and to communicate with the firm since N2Africa is currently the intermediary and since their only contact in Promasidor is very hard to reach. MDG and Tesso only rely on Promasidor but think that a diversification of buyers is needed for sustainability of the project. But the fact that Promasidor buys everything does not really force any of them to find other markets even though MUDIFESOF and BUSCO think that processing could be a profitable market.

- 30 -
4.4 Local market for processed products
4.5.1 Schools
Among the seven schools interviewed six were mixed day and boarding school (where students have accommodation on school) and Maraba primary school was a day school only. Six schools were public and the MUDIFESOF academy secondary school was private. Boarder students were a minority in mixed schools, from 10 to 40%. In three mixed schools day students were offered a snack at 10 o’clock and a lunch.
Menus encountered always followed the same pattern, a breakfast with porridge or tea and bread/mandazi, sometimes a tea and a snack at the 10 o’clock break, lunch composed of a maize bean mixture and a dinner with ugali, sukuma wiki (kale), with sometimes beef or fish.
All schools attached importance to the quality of the food they purchase to compose a balanced menu, five schools declared having instructions and control from the Kenyan ministry of education on the quality of food and diet. All schools interviewed had never included soybean in their meal. The awareness of existing soybean products was also very limited, most of the time only soy beverage or soy meat was known (these items are available in local supermarkets). However every director interviewed was aware of the high nutritional value of soybean and its high protein content. They all answered positively to the question: if soybean products were easily available, would you use it for children meals. The answer to the question: why would you use soybean, was in all cases “because it has a good nutritional value/it is rich in protein”. These answers do not constitute a proof in itself that school would be ready to replace part of their food supply with soybean. Three directors indeed mentioned that they would have to test soybean products first to see if it meets student’s tastes and other standards (easy to cook and to store). Besides, four school directors asked for samples of products to try it and to see its quality.
In every public mixed school, except Shitoto primary school, food was bought on the local market every month with a contract on three months or on a year basis (table. 16). Contracts were attributed on proposal and suppliers had to meet requirements on quantity available (enough for one to three months), reliability and quality. In the day school maize and beans were supplied by parents. The private school had a contract with a unique retailer in MDG (50 km) for supply every three months.
In every school directors said they were satisfied with the actual menu because it was already balanced. Indeed, calculation on balance of the diet of St. Stephens secondary school shows a low amount of energy (but calculations do not include cooking fat and vegetables) but a fairly good amount of proteins (Table 15). Information on food quantity was the most accurate in St. Stephens school. In other schools the amount of food consumed seems very low sometimes. This can be due to inaccuracy in consumption statements; directors might not have had the right figures. Besides, the ratio beans/maize is often lower than in St. Stephen (lower than 0.5), as beans represent the principal protein intake, this could lead to protein deficits in some diets.
The meal that was most likely to include soybean was the lunch. Directors thought of replacing beans partly by soybeans. In some schools the lunch would also concern day students. In schools that gave porridge to children for breakfast the possibility of using soy/maize blend flour was also discussed.

- 31 -
As the budget for food is limited it appeared very unlikely that schools purchase high value added soybean products like soymilk or soy yogurt. The market would be limited to soy flour and whole grain. If we take as a generous hypothesis that schools replace 50% of bean by soybeans and 10% of maize by soy flour, the potential market would be 6.5 t per year (table. 16). This last hypothesis is based on the monthly bean consumption declared by schools (not available for Marsi FOL).
Table 15. Average daily nutritional intake and nutritional requirement in St. Stephens
secondary school.
Table 16. Characteristics of schools interviewed, maize and beans consumption per month.
School
Number of
students
Number of
boarders
Bean consumption (kg.month-1)
Maize consumption (kg.month-1)
Supply
Shitoto Prim. 904 90 120 480 Food brought by parents Maraba Prim. 787 0 120 240 Food brought by parents
St. Stephens Sec. 108 60 200 400 Proposal for a year, supply
every month
Lubinu Prim. 1600 400 400 1200 Proposal for a term, supply
every month
St. Mathews Sec.* 856 224 120 400 Proposal for a year (in
November), supply every month.
Marsi FOL * Prim. 255 58 - - -
Mumias academy Sec. *
320 80 80 240 Arranged contract with one
supplier in MDG, supply every 3 months
Annual consumption 1 8 320 23 680
Potential market 2 4 160 2 368 * In these schools day students receive a meal and a snack at the 10 o’clock break. 1
For 8 month of school, sum of all schools except Marsi FOL. 2 For 50% beans replacement and 10% maize replacement.
Type of food
Daily intake (g)
Energy content (Kcal for 100g)1
Protein content (g for 100g)1
Energy intake (Kcal)
Protein intake (g)
Maize 222 364 8.75 809 19.4 Beans 111 337 22.5 374 25.0 Meat 13 124 21.9 17 2.9 Wheat flour 67 332 9.6 221 6.4
Total 1421 53.7 Daily requirements2 1900 32.2
1 (Beltsville Human Nutrition Research Center, 2012)
2 For a 10 year old boy of 32.2 kg (FAO/WHO/UNU, 1985), average value, may vary according to level of activity
and mass of children.

- 32 -
4.5.2 Local supermarkets
All four supermarkets visited sold soy beverage and soy meat (Sossi, a Promasidor product). In the supermarkets in Mumias between 50 and 70 soy meat packages (of 90 g) were sold per week, which represent a maximum of 28 kg of product sold per month. The quantity of soy beverage sold was not known. Awareness of other available soybean products was null. Both supermarket managers declared being open to the sale of soybean product like soy milk, soy yogurt, soy beverage and soy blended flour. According to them if the product was available they could try it in a first phase to test the potential market and prepare consumers.
Requirements on packaging and delivery are very strict, the product has to be presented in a similar package as the existing products (bags for milk and plastic pot of 500 ml for yoghurt). Besides, managers made clear that to sell a product in their supermarket the supply has to be reliable, consistent and constant as they have seen many products introduced to consumers in a test phase and then vanish.
Contracts are made on several aspects that have to be negotiated and determined: volume, delivery frequency, quality, packaging, price and management of unsold products (who bears the loss, who takes care of disposal, etc.). In addition suppliers have to comply with administration rules and present documents and authorizations. Both managers said that depending on the ratio quality/price the market of soybean products could eventually grow fast after a first period of introduction to consumers. Table 17 gives the average quantities of milk, yogurt and maize flour sold in one month in these supermarkets, all of these products could be replaced by soybean products (in various proportions). The price of milk was 96 Ksh per liter and yogurt was between 120 and 180 Ksh per liter.
Table 17. Average quantity of milk, yogurt and maize sold in Mumias supermarkets.
Supermarket Milk (l) Yogurt (l) Maize flour (kg)
Frankmatt 4 800 81 2 400 Mama Watoto 3 750 750 10 000

- 33 -
4.6 National industrial market
Unfortunately Soyafric was the only processor to answer the questionnaire. As a consequence, data on other national human food processors for soybean consumption have not been collected.
Soyafric processes 4 800 MT of soybean per year to produce oil and cake for the animal feed industry. The monthly delivery to their factory is 400 M at a price ranging from 42 to 44 Ksh per kg. Their supply comes from Uganda, Tanzania and DR Congo. They stated that the minimum amount of soybean they would be ready to buy from smallholder organizations was 300 M, with strict requirements on quality (protein and oil content, moisture, impurities) and at the same price as from large scale producers.
Reliable data on the total quantity of soybean consumed by the industrial sector could not be found. In their 2008 report, Chianu et al. stated that the livestock feed industry consumed 437 000 MT of soybean in 2002. However this data appears not consistent with the data on import of soybean products in Kenya (150 000 MT). Tinsley (2009) found that the World Food Program (WFP) imported 15 000 MT of soybean per year and that they would be willing to source it locally if the price was similar to the international price.
The domestic demand is far from being met through domestic production and Kenya imports large quantities of soybean mostly soya cake or meal. Soybean is imported from India (85%) but also from Uganda, Rwanda and DR Congo. However, the installed capacity for oil extraction (and soy meal production) is about 265 000 MT/year and is largely underutilized. Kenya has enough capacity to process a large part of soy meal demand from raw soybean. Thus the industrial market appears to be a huge potential market.

- 34 -

- 35 -
5. Discussion
5.1 Constraints and opportunities at the production level
First, it is important to indicate that most of the data reported in section 4.1 (farm level) were based on farmer declarations and estimations on the annual volume produced, the quantity of input used and the area under cultivation. Besides, some enumerators had highly similar and standardized answers within their questionnaires. Thus calculated data such as input rates and total production may not be totally accurate and have to be seen as estimates. However yields found seemed to match with the result obtained from the farmer adaptation trial realized by the CIAT.
Soybean was grown by farmers principally as a cash crop (Table 11), as also indicated by the fact that only 10% of the soybean was consumed by the household and that 93% of the production was sold directly after harvest. However the potential of soybean to generate substantial cash revenue was impacted by two facts: 40% of farmers produced less than 100 kg of soybean per year, and relatively high production costs combined with relatively low yield led to a net profit margin between Ksh 10 and Ksh 20 per kg of soybean. 40% of the farmers had an annual net profit from soybean lower than Ksh 1 500. However, estimation of production costs showed that with 1 acre of land cultivated with soybean during the short rains (or 0.5 acres cultivated twice a year) and a yield of 1 500 kg.ha-1, annual profit could be Ksh 17 625.
In MDG the low amount of soybean produced was mainly the problem of poor resource endowed farmers (Table 7). This is the result of MDG’s input distribution system. They indeed provide input as package of either 1 kg or 10 kg of seeds whereas MUDIFESOF delivers packages of inputs with the quantity of seed desired by farmers. Poor resource endowed farmer could not afford the 10 kg package. As a consequence the land they committed to soybean, in absolute acreage as well as in percentage of their total land, was much lower than for any other farmer category (Table 8). This segmentation of the input limits the land committed to soybean by poor resource endowed farmers in MDG whereas results in MUDIFESOF seemed to indicate that poor resource endowed farmers would be willing to dedicate a higher percentage of their land to soybean than other wealth categories (Table 8).
Low yield was the principal factor impacting the profitability of soybean cultivation. A lower seed rate in MDG was the only factor explaining lower yields for poor resource endowed farmers while no differences were found in the means of production (inputs, workforce, experience) in MUDIFESOF. However no data were collected concerning the number and nature of interventions on soya fields. The amount of work put into soybean cultivation could explain a lot of the variation in yields as poor resource endowed farmers might not have enough money to hire workforce.
Despite the wide use of BNF technology (Table 12) (Biofix, improved fertilizers), of improved varieties (Figure 6) and adequate planting techniques the average yield of soybean was more than 50% lower than the potential yield. The low rate of inputs (Table 12) as well as the delay in availability for seeds and biocide can partially explain these low yields. According to members of SRCs the limiting factors for attaining good yields is that many farmers do not put a lot of attention and do not invest in soybean cultivation (surveillance and field work). Serious farmers that invested in production were satisfied and managed to obtain substantial profit, 10% of farmers indeed obtain yield higher than 1.5 t ha-1 (Figure. 5).

- 36 -
Issues mentioned above must be addressed to achieve high yield and thus high profitability of soybean. The availability of inputs in adequate quantity and in time is not yet achieved in both SRCs. According to SRC members this is mainly due to financial issues: SRCs did not have the financial capacity to buy (or to keep) enough seeds, biocide and fertilizers. They also encountered supply issues since Promasidor did not supply biocide on time and agrovets did not have sufficient quantities in stock. The access to affordable loans for farmers was also very important and an agreement has to be found with a micro credit bank to provide loans as SRCs did not have the financial and managerial capacity to do so. The issue of low interest of farmers for soybean cultivation lies in the lack of monitoring of farmers and the delay of payment that discourages farmers. Monitoring was requested by a substantial number of farmers and suggested by SRC members, it was not in place in MDG, and MUDIFESOF had too few master farmers and personnel to ensure an adequate follow-up of every farmers. Farmers that were followed and monitored during cropping season declared to be more concerned about soybean cultivation. Remuneration of master farmers by SRC was suggested and could be a good way to promote soybean among farmers and to ensure serious engagement of farmers into soybean cultivation. The delay of payment could be addressed either by renegotiating terms of the contract with Promasidor or by providing adequate financial capacity to SRCs.
Renegotiating the contract with Promasidor would be an easy way to pay everyone on time. At this occasion, the issue of timely input delivery could also be addressed. However it would not be wise/possible to put too many charges and constraints on this company since it already buys at a price higher than the international market and ensures transportation.
Providing financial capacity to SRC’s either through bank loans or through grant money also has some advantages. According to SRCs, adequate financial capacity would allow them to buy inputs in sufficient quantity and on time, but above all it would allow them to pay farmers straight at the delivery of soybean. With adequate financing SRCs would become autonomous commercial cooperatives and would fully endorse their role of production supporter and market suppliers. However a substantial amount of money is needed to fulfil SRC’s financial requirement. The solution of providing loans through banks would require a strong demonstration of project viability and would also engage SRC’s responsibility.
Improvement of soybean profitability can also be found directly in production techniques. For example the fungicide molecule found in Amistar Xtra (cyproconazole) can be found in many other commercial formulations at a lower cost and more easily available. Using these alternative fungicides would help reduce production cost and avoid losses due to delay in spraying. MDG had a very efficient system to control diseases with a team of sprayers going from farm to farm. This system had the advantage of sharing costs of spraying pumps, eliminating the issue of the maladapted package size of biocides, but also being ensured of skills for spraying and for quantities to be applied. This system was not in place in MUDIFESOF and should be applied. Labour cost estimation was highly variable from SRC to SRC representing from 30% to 50% of total costs. Chianu et al. (2009) found that labour costs accounted for 75% to 84% of the total costs. They also stated that “a judicious and efficient application of labor is a sure way of increasing the net returns” and added that labor cost were relatively lower for big plots. This indicates that SRCs should promote an up-scaling of production by helping farmer that are ready to plant at least half an acre of soybean per season. Further research would be needed on the critical land size to be profitable, best management practices of the field and the way to reduce labor costs.

- 37 -
Results suggest that soybean met the objective of increasing soil fertility for a majority of farmers. Two thirds of farmers saw an improvement in the yield or vitality of crops cultivated after soybean. Rotational benefits of soybean may mitigate the lower financial results of soybean, but it is hard to quantify the real monetary added value of this higher soil fertility.
The scenario approach developed in section 4.1.3 suggested that the best way to increase the total production of soybean was to increase the number of farmers planting soybean (Table 10). Nonetheless, problems mentioned above indicate that farmers are not likely to sustainably adopt soybean if its cultivation does not meet their primary concern: cash income. One can fear that when grant and input access facilitation will stop, a lot of farmers would stop cultivating soybean. Besides, long term viability of SRCs is threatened by the lack of financial resources. The profit margin on soybean sold to Promasidor is null or negative due to organization and transport costs. Emphasis should be put on yield and production cost improvement first, to increase the number of farmers involved in the project. A core of productive and convinced farmers should be created to strengthen SRC’s skills and financial position to provide a wealthy basis for further growth and expansion.
5.2 Constraints and opportunities at the market level
A great majority of the soybean produced by farmers appeared to be sold to SRCs. Farmers did not mention open air markets as an important alternative market. However estimates by MDG and OKOA (Table 9) lead to think that an important part of the estimated production (up to 50%) might be sold to alternative markets, most probably open air markets or cross-border trading. However this estimation is based on extrapolation of the quantity of soybean produced which itself is based on low accuracy data. The quantity actually produced by farmers involved in these SRCs might be much lower than estimated as well as the proportion of soybean sold to alternative market. In addition open air market appeared not to constitute an important competitor of the SRC market. Indeed 80% of farmers thought that open air markets did not allow selling soybean in large volume and are really time consuming. Meanwhile SRCs were the only markets offering to buy large quantities at once and that took care of transportation. At the current low production levels the temptation for farmers to sell soybean on open air market might be important but as soon as the individual quantity produced will rise open air market will no longer be a valuable option.
MDG and OKOA almost exclusively relied on Promasidor to buy their production. Though they recognized that a diversification of buyers would be needed, none of them undertook proactive measures to reach alternative markets. The situation is slightly better for BUSCO and MUDIFESOF that managed to find small contracts with large scale processors or governmental organizations. However they also mainly relied on Promasidor even though their contractual agreement with this society does not entirely satisfy their needs (late payment, low price leading to no margin). It appeared that these SRCs were more focused on increasing production by technology diffusion and farmer recruitment, thanks to grant money and help of NGOs, rather than on providing valuable market outputs. This last role had been relegated to N2Africa project and CIAT. Chianu et al. (2009) found that processing of soybean could increase the financial output by 4 to 14 times while providing employment at processing level. Thus finding high value added market for SRCs appears to be important for the financial sustainability of these structures as well as for attractiveness of soybean production. The lack of entrepreneurship of SRCs hampers soybean market development while, as the results of section 4.3 suggested, the local market for soybean is substantial, and it could gradually be reached by SRCs by following the steps below:

- 38 -
- The first market that could be accessed without too many constraints are boarding
schools close to SRCs. Schools interviewed manifested interest only for simple soybean products like soybean grain for maize bean stew and soy/maize blended flour for morning porridge. These products would not need particular packaging or preservation measures and as a consequence this market is immediately available for SRCs. A team of demonstrators from SRCs could simply make appointments with schools and bring samples for testing in children’s meals as every schools stated to be open to a trial. Budget and balance of diet are important issues for schools and soybean answers to both of these preoccupations: it is twice as cheap as beans per kilogramme but contains twice as much proteins of better quality. With such an argumentation school directors should be convinced, the only unknown parameter being the proportion of soybean that would fit to children’s taste. The market for MUDIFESOF, assuming a proportion of half soybean half bean in children lunch, would be substantial with 4 t a month in total for the seven schools interviewed. In order to have a reliable supply throughout the year SRC should have adapted storage facilities. This was the case for three of SRC interviewed (not in MUDIFESOF). Reaching this first market would allow SRCs to secure their market and to make a small profit to be reinvested in production assuming a selling price of Ksh 55 to Ksh 60 per kg.
- A second step to reach is local supermarket. This study did not allow evaluating precisely the size of this market. However it showed that supermarkets would be willing to sell soybean products in their supermarket after a testing phase to familiarize consumers. Constraints of packaging and legal barriers have to be addressed but SRCs declared to be working on it, they were planning to have accreditations for long rains 2014. Products packaging and shelf life should basically be similar to mainstream products for milk and yogurt. This market would require much more marketing skills for the SRC members as contracts with supermarkets involve negotiation on numerous aspects, among which the management of unsold products and the supply. A proper training on marketing issues of at least one member of each SRC might be necessary to be able to reach this market. The higher difficulty for reaching this market has to be seen relative to the possible benefits, as the added value of soymilk and yogurt is very important. Alternatively, dry soybean products that do not require complex packaging or cooled storage like soy beverage, mandazi mix, chapatti mix and blended flour could be sold to small local shops. These shops would allow SRCs to reach isolated markets in villages located far from their headquarter. It would also familiarize consumers with soybean products. In addition, making contracts with these shops would provide a learning basis for further contracts with more demanding markets.
- A last step to reach would be large scale processors. Thanks to N2Africa and CIAT this step has already been reached with Promasidor and is nowadays the principal market output for soybean. However consequent delays for payment and bulking transportation costs assumed by SRCs make this market not entirely fitted to the needs of farmers and SRCs. Maintaining an agreement and good communication with Promasidor is crucial for SRCs but for long term sustainability a diversification of buyers would be needed. Hopefully high international costs makes locally produced soybean more attractive for large scale processors. If the production of SRCs continues to increase there might be an opportunity to develop a contract with a UNIMIX industrial processor called Soyafric by grouping the production of several SRCs.
- 39 -
6. Conclusion This study allowed drawing the following conclusions:
- Soybean production of individual farmers is still low. This is due to yields below the attainable yield. Delays in access to inputs, low rate of use of inputs, low attention and work provided to the crop can explain these low yields.
- Soybean profitability is not a reality for every farmer with 40% of farmer realizing an annual net profit lower than Ksh 1 500. This low profitability is not due to low price or high production cost but to low yield achieved. Further research on production cost, critical yield and area to be cultivated to achieve profitability is needed. SRCs should focus on increasing input availability and enhance productivity to create a core of productive farmers which is an essential basis for their further development.
- SRCs should provide monitoring and assistance to a limited number of farmer to make the best use of resources available and motivate farmers for soybean cultivation. These farmers should have at least half an acre available for soybean and should be selected on their motivation to cultivate soybean. Issues of delay in payment are an important concern for farmers and must be solved either through an agreement with Promasidor or with SRCs financing.
- SRCs are not yet proactive actors of soybean markets. They should receive adequate trainings and directives to increase their entrepreneurship toward the creation of fully autonomous cooperatives for production and marketing.
- The market of schools represents a great potential in terms of volume and stability and must be reached as soon as possible.
- Small shops can sell long shelf life soybean products and increase the pool of consumers of soybean products by reaching isolated areas.
- Local supermarkets could represent a market for high value added soybean products. However it would require an important marketing prospecting from SRCs as well as investments in the processing machinery. This market should be reached after a phase of consolidation of SRCs.
- The large scale processor market can possibly absorb a minimum production of 300 t but at international price and in bulk. This and can represent a solution in case of further production increase.

- 40 -

- 41 -
8. Bibliography
Beltsville Human Nutrition Research Center, N.D.L., 2012. Composition of Foods Raw, Processed, Prepared USDA National Nutrient Database for Standard Reference, Release 25. U.S. Department of Agriculture Agricultural Research Service.
Chianu, J., Vanlauwe, B., Mahasi, J.M., Katungi, E., Akech, C., Mairura, F.S., Chianu Justina, N., Sanginga, N., 2008. Soybean situation and outlook analysis: the case of Kenya.
Chianu, J.N., Ohiokpehai, O., Vanlauwe, B., Adesina, A., De Groote, H., Sanginga, N., 2009. Promoting a versatile but yet minor crop: Soybean in the farming systems of Kenya. Journal of Sustainable Development in Africa 10, 324–344.
CIAT-Maseno, 2013. Potential soybean yield analysis. Internal CIAT documentation. Commission on Revenue Allocation, 2011. Kenya County Fact Sheet. Duranti, M., Gius, C., 1997. Legume seeds: protein content and nutritional value. Field Crops
Research 53, 31–45. FAO, 2011. FAOSTAT. URL http://faostat.fao.org/ (accessed 4.5.13). FAO/WHO/UNU, 1985. Energy and protein requirements: report of a Joint FAO/WHO/UNU
Expert Consultation, Technical report series / World Health Organization. World Health Organization ; WHO Publications Center USA [distributor], Geneva : Albany, NY.
Jagwe, J., Owuor, G., 2004. Evaluating the marketing opportunities for soybean and its products in the East African countries of ASARECA: Kenya Report. International Institute of Tropical Agriculture-FOODNET.
Karuga, S., Gachanja, J., 2004. Soybeans development study: Final report prepared by market economies development for Japan International Cooperation Agency (JICA), Nairobi, Kenya.
Ngare, D.K., Muttunga, J.N., 1999. Prevalence of malnutrition in Kenya. East Afr Med J 76, 376–380.
Sanginga, N., Dashiell, K.., Diels, J., Vanlauwe, B., Lyasse, O., Carsky, R.., Tarawali, S., Asafo-Adjei, B., Menkir, A., Schulz, S., Singh, B.., Chikoye, D., Keatinge, D., Ortiz, R., 2003. Sustainable resource management coupled to resilient germplasm to provide new intensive cereal–grain–legume–livestock systems in the dry savanna. Agriculture, Ecosystems & Environment 100, 305–314.
Tinsley, R.L., 2009. Assessing the Soybean Value Chain Analysis in Kenya. CNFA Farmer to Farmer Program, November–December. Colorado State University, Fort Collins, Colorado.
World Bank, D.P.G., 2013. Commodity price forecast. World Bank.

- 42 -

- 43 -
Table of appendices
APPENDIX. I: Survey soybean production and market for farmer groups ................................. ii
APPENDIX. II: Survey soybean production and market for farmers .......................................... iv
APPENDIX. III: Survey soybean production and market for farmer groups .............................. vii
APPENDIX. IV: Survey for schools ............................................................................................. viii
APPENDIX. V: Survey for supermarkets ................................................................................... viii
APPENDIX. VI .............................................................................................................................. ix
APPENDIX. VII: ANOVA – Quantity of soybean produced ........................................................... x
APPENDIX. VIII: ANOVA – Percentage of area under soybean cultivation ............................... xii
APPENDIX. IX: ANOVA – Estimated yield.................................................................................. xiv
APPENDIX. X: ANOVA – Rank of income generation ................................................................ xvi
APPENDIX. XI: ANOVA – Quantity of seed ............................................................................. xviii
APPENDIX. XII: ANOVA – Annual income from soybean .......................................................... xix
APPENDIX. XIII: Logistic regression - Open air market ............................................................. xxi
APPENDIX. XIV: Frequency of answers of farmers to several qualitative questions. ............ xxiii
APPENDIX. XV: Frequency of answers of farmers to the question on advantages/disadvantages of several markets. ..................................................................... xxiv
APPENDIX. XVI: Frequency of answers of farmers to the question : How could the situation be improved within the grouping project with SRC? .............................................. xxiv
APPENDIX. XVII: Comparison of quantity of input distributed by SRC’s ................................. xxv
APPENDIX. XVIII: ANOVA – Area cultivated with soybean ..................................................... xxvi

i

ii
Appendices
APPENDIX I: Survey soybean production and market for farmer groups
Date of interview: _____/______/2012
Enumerator: ________________________
Action site (District/County/…): __________________
Village: _____________________
Introduction Introduce yourself and the purpose of this survey. A. General information A.1.How many farmers constitute this group:____________________________
A.2. How much land individual farmers have committed to produce soybean: ___
A.3. What activities are undertaken by this group/association:
Activity Tick
1. Marketing
2. Technology diffusion
3. Seed diffusion
4. Input supply
5. Processsing
A.5. What is the annual volume of soybean treated by the organisation: ____ A.5. What is the annual volume of soybean processed: ___________________ A.6 What type of products are processed by the organisation (production cost,
technology): B. Soybean market B.1. What is the average volume delivered by farmer: ____________________ B.2. What is the average price farmers receive: __________________ B.3. How does the price vary through the year:
B.4. What factors influence the price (quality, other): B.5. Which kind of clients do you have and what volume and income do they represent:
Client Volume Income
1.
2.
3.
4.
5.
6.

iii
B.6. What is the trend of demand for soybean in these different markets: B.7. What are constraints in these different markets: B.8. What are opportunities in these different markets: B.9. Do you have contract with your clients? If yes, what king of contract: C. Soybean cultivation C.1. How much input is sold/supplied to soybean producers, at what price:
Input type Volume Price
1.
2.
3.
4.
5.
6.
C.2. What is the estimate labour cost of producing one ton of soybean:________ C.3. What are the constraints of soybean cultivation (association level, farmer level): C.4. What would make you produce more soybean? (Or what is the limiting factor for
soybean production): D. Grouping project with D.1. What have changed for farmer of the group in the soybean market since the
grouping exist? D.2. What have changed for farmer of the group in the soybean cultivation since the
grouping exist? D.3. How could the situation could be improved within this project? Please thank the farmer for his/her time and check if he/she has any question.

iv
APPENDIX II: Survey soybean production and market for farmers
Date of interview: _____/______/2012
Enumerator: ________________________
Action site (District/County/…): __________________
Village: _____________________
Introduction Introduce yourself and the purpose of this survey. A. General information A.1.Name of respondent: _________________________________
A.2. Gender of the household head: Male____ / Female____
A.3. Age of the household head: _________
A.4. Person present on the farm:
Age class Number
1. Below 12
2. 12 to 17
3. 18 to 60
4. Above 60
A.5. What is your annual income from farming: _____________________ A.6 What is your annual income from soybean: _____________________ A.7. Size of the farm:___________________________________(planted area) B. Soybean cultivation B.1. Since how long do you grow soybean: _______________ B.2. Why do you cultivate soybean (if several, could you categorize these reasons):
Tick
1) Income
2) Improving soil fertility
3) Household consumption
4) Because of good nutritional value
5) Other, precise: ___________________
B.3. On what kind of field do you grow soybean, why? B.4. What input do you use for soybean cultivation, how much (rate), where was they
obtained and at what price:
Input Rate Supply Price

v
B.5 What is the surface cultivated with soybean: ____________ ____________ B.6. What is the planting technique: B.7. What is the harvest technique and post harvest treatment: B.8. When do you plant soybean, what is the maturation time: B.9. What variety(ies) of soybean do you grow: B.10. How much soya do you produce per year: _____________ Yield_______ B.11. What problems do you encounter in soybean production: C. Soybean market C.0. How much soybean do you keep for household consumption : C.1. To whom do you sell soybean and what is the annual volume, price, cost of transport
and mean of transport (insist on all market to find out every market used):
Op
en
air m
arket
Ind
us
trial
pro
cessor
Local
pro
cessor (co
ttage)
Farmer
grou
p/o
rgan
isatio
n
Mid
dl
emen
Mark
et
Nam
e o
f p
lace
Vo
lum
e
Price
Co
st of
transp
ort/D
istance
Mean
of
transp
or
t
vi
C.3. What determines where to sell? (or why do you sell soybean on this or this market): C.4 When do you sell soybeans? _________________________________Why? C.8 What are constraint and advantages/opportunities of different available markets
(categorize):
Type of market
Constraint Advantages opportunity
- -
- -
- -
- -
- -
- -
- -
- -
D. Grouping project with SRC D.1. What have changed for you in the soybean market since the grouping (SRC and
Promasidor) exist? (price, production, transport) D.2. What have changed for you in the soybean cultivation since the grouping exist (SRC
and Promasidor)? (use of input, land used, other crops) D.3. How could the situation be improved within this project (SRC and Promasidor)? Please thank the farmer for his/her time and check if he/she has any question.

vii
APPENDIX III: Survey soybean production and market for farmer groups
Date of interview: _____/______/2012
Enumerator: ________________________
Action site (District/County/…): __________________
Village: _____________________
A. General information A.1.How many employee do you have:____________________________ A.2. What kind of product do you make, what is the technology, what is the annual olume
processed:
Product Technology Volume
1.
2.
3.
4.
5.
A.3. What is the capacity of your factory:________________________________ A.4. What is the average volume of soybean you buy from your suppliers (or what is their
average delivery to your factory) : B. Soybean market B.1. Where do you get your supply in soybean: B.2. What is the average price: B.3. Do you encounter price variation through the year:
B.4. What factors influence the price: B.5. What minimum volume of soybean are you ready to buy from local smallholder
farmer: B.6. What are the quality requirements for soybean: B.7. To whom (which kind of client) do you sell your products, what volume and income
they represent:
Client Volume Income
1.
2.
3.
4.
5.
6.
B.9. What kind of contract do you have with your smallholders farmer or group of farmers? Why ?
C. Local production C.1. Do local production satisfy your needs in volume, quality, price, other? C.2. What would trigger increased supply of locally produced soybean?

viii
APPENDIX IV: Survey for schools Name of the school : Place : Type of school : Number of students : What is the feeding pattern (breakfast, meal, everything)? What is a typical meal (quantities, quality)? How do you prepare food? Where do you get your food supply? Who are your contractors? When do you call for proposals for supply of food to your school? What are the most important aspects in the choice of meal ingredients? Do you have recommendation for food from any organization? How much quantity of product do you buy per month/week, what is the price of these
products? Have you ever included soybean in your meals? Yes/No If yes, what meals? What do you know about nutritional value of soybean? What different soybean foods do you know Would you be interested in using soybean products in children Yes/No If yes, which products? Why would you decide to use soybean products? At what price would you be willing to
buy it and what quantity?
APPENDIX V: Survey for supermarkets Name of the supermarket: Place: Do you currently sell soybean products in your super market? Which one? Are soybean products preferred? What volume do you sell? Do you know any other products made from soybean? If they were available would you sell them in your supermarket? What would be your requirements (quality, packaging, delivery, volume, price)? What is the volume of milk/flour/beverage/yoghurt you sell, what is the price? How big do you think this market could be (in terms of replacement of other products)?

ix
APPENDIX VI Means and confidence interval at 95% for several parameters from the 300 farmers of the
sample population.
Variable/Modality Mean/ Frequency
Lower Bound Upper Bound
Estimated yield MDG (kg.ha-1) 1049 971 1128
Soybean area MDG (ha) 0,21 0,17 0,25
Cultivated in both season MDG 0,5 0,41 0,58
Estimated yield MUDIFESOF (kg.ha-1) 679 606 751
Soybean area MUDIFESOF (ha) 0,25 0,21 0,28
Cultivated in both season MUDIFESOF 0,53 0,45 0,61

x
APPENDIX VII: ANOVA – Quantity of soybean produced
Between-Subjects Factors
N
Wealth_class
a 160
p 108
r 17
Village Busia 145
Mumias 140
GenderHH f 118
m 167
Tests of Between-Subjects Effects
Dependent Variable: SB_production
Source Type III Sum of
Squares
df Mean Square F Sig.
Corrected Model 9803593,694a 9 1089288,188 12,622 ,000
Intercept 14451990,493 1 14451990,493 167,465 ,000
Wealth_class 5129522,649 2 2564761,324 29,720 ,000
Village 375545,010 1 375545,010 4,352 ,038
GenderHH 13065,748 1 13065,748 ,151 ,698
Wealth_class * Village 2892836,739 1 2892836,739 33,521 ,000
Wealth_class * GenderHH 9425,532 2 4712,766 ,055 ,947
Village * GenderHH 39466,837 1 39466,837 ,457 ,499
Wealth_class * Village *
GenderHH 44733,405 1 44733,405 ,518 ,472
Error 23732083,618 275 86298,486
Total 58717434,000 285
Corrected Total 33535677,312 284
a. R Squared = ,292 (Adjusted R Squared = ,269)

xi
Estimated Marginal Means
Wealth class * Village
Dependent Variable: SB_production
Wealth_class Village Mean Std. Error 95% Confidence Interval
Lower Bound Upper Bound
a Busia 542,144 39,456 464,470 619,818
Mumias 227,910 36,016 157,008 298,812
p Busia 41,582 43,949 -44,937 128,101
Mumias 189,353 39,776 111,049 267,658
r Busia .
a . . .
Mumias 527,625 78,184 373,709 681,541
a. This level combination of factors is not observed, thus the corresponding
population marginal mean is not estimable.

xii
APPENDIX VIII: ANOVA – Percentage of area under soybean cultivation
Between-Subjects Factors
N
Wealth_class
a 154
p 105
r 17
Village Busia 144
Mumias 132
GenderHH f 113
m 163
Tests of Between-Subjects Effects
Dependent Variable: Percentage area with SB
Source Type III Sum
of Squares
df Mean
Square
F Sig.
Corrected Model 7,016a 9 ,780 8,843 ,000
Intercept 12,576 1 12,576 142,659 ,000
Wealth_class ,679 2 ,340 3,853 ,022
Village 2,181 1 2,181 24,741 ,000
GenderHH ,132 1 ,132 1,502 ,222
Wealth_class * Village 3,830 1 3,830 43,443 ,000
Wealth_class * GenderHH ,654 2 ,327 3,711 ,260
Village * GenderHH ,112 1 ,112 1,273 ,260
Wealth_class * Village *
GenderHH ,006 1 ,006 ,065 ,799
Error 23,448 266 ,088
Total 60,608 276
Corrected Total 30,464 275
a. R Squared = ,230 (Adjusted R Squared = ,204)

xiii
Estimated Marginal Means
1. Wealth_class * Village
Dependent Variable: Percentage area with SB
Wealth_class Village Mean Std. Error 95% Confidence Interval
Lower Bound Upper Bound
a Busia ,409 ,040 ,331 ,488
Mumias ,343 ,038 ,268 ,418
p Busia ,093 ,044 ,006 ,181
Mumias ,567 ,041 ,486 ,648
r Busia .
a . . .
Mumias ,244 ,079 ,088 ,400
a. This level combination of factors is not observed, thus the corresponding
population marginal mean is not estimable.

xiv
APPENDIX IX: ANOVA – Estimated yield
Between-Subjects Factors
N
Wealth_class
a 156
p 108
r 17
Village Busia 143
Mumias 138
GenderHH f 117
m 164
Tests of Between-Subjects Effects
Dependent Variable: Actual estimated yield
Source Type III Sum
of Squares
df Mean
Square
F Sig.
Corrected Model 20293574,829a 9 2254841,648 7,256 ,000
Intercept 123247454,141 1 123247454,141 396,593 ,000
Wealth_class 5018950,819 2 2509475,409 8,075 ,000
Village 8885951,462 1 8885951,462 28,594 ,000
GenderHH 227979,304 1 227979,304 ,734 ,392
Wealth_class * Village 247926,485 1 247926,485 ,798 ,373
Wealth_class * GenderHH 1670783,081 2 835391,540 2,688 ,070
Village * GenderHH 1361865,822 1 1361865,822 4,382 ,037
Wealth_class * Village *
GenderHH 516492,536 1 516492,536 1,662 ,198
Error 84217374,835 271 310765,221
Total 341841913,005 281
Corrected Total 104510949,665 280
a. R Squared = ,194 (Adjusted R Squared = ,167)
Estimated Marginal Means
1. Grand Mean
Dependent Variable: Actual estimated yield
Mean Std. Error 95% Confidence Interval
Lower Bound Upper Bound
921,737a 42,482 838,099 1005,374
a. Based on modified population marginal mean.

xv
2. Wealth_class
Dependent Variable: Actual estimated yield
Wealth_class Mean Std. Error 95% Confidence Interval
Lower Bound Upper Bound
a 1045,073 51,121 944,427 1145,718
p 768,468 56,242 657,741 879,196
r 981,602a 148,366 689,505 1273,699
a. Based on modified population marginal mean.
3. Village * GenderHH
Dependent Variable: Actual estimated yield
Village GenderHH Mean Std. Error 95% Confidence Interval
Lower Bound Upper Bound
Busia f 1032,089
a 81,669 871,303 1192,876
m 1187,868a 76,941 1036,389 1339,347
Mumias f 920,032 96,385 730,274 1109,791
m 672,452 71,884 530,930 813,974
a. Based on modified population marginal mean.

xvi
APPENDIX X: ANOVA – Rank of income generation
Between-Subjects Factors
N
Wealth_class
a 158
p 105
r 16
Village Busia 145
Mumias 134
GenderHH f 114
m 165
Tests of Between-Subjects Effects
Dependent Variable: Percentage income from SB
Source Type III Sum of
Squares
df Mean Square F Sig.
Corrected Model 20,817a 9 2,313 7,881 ,000
Intercept 11,471 1 11,471 39,085 ,000
Wealth_class 3,894 2 1,947 6,634 ,002
Village 6,073 1 6,073 20,692 ,000
GenderHH ,000 1 ,000 ,001 ,974
Wealth_class * Village 2,653 1 2,653 9,039 ,003
Wealth_class * GenderHH ,123 2 ,062 ,210 ,811
Village * GenderHH ,001 1 ,001 ,004 ,947
Wealth_class * Village *
GenderHH ,007 1 ,007 ,024 ,878
Error 78,951 269 ,293
Total 140,261 279
Corrected Total 99,768 278
a. R Squared = ,209 (Adjusted R Squared = ,182)

xvii
Estimated Marginal Means
1. Wealth_class * Village
Dependent Variable: Percentage income from SB
Wealth_class Village Mean Std. Error 95% Confidence Interval
Lower Bound Upper Bound
a Busia ,747 ,073 ,603 ,890
Mumias ,185 ,067 ,052 ,318
p Busia ,253 ,081 ,094 ,413
Mumias ,139 ,075 -,010 ,287
r Busia .
a . . .
Mumias ,134 ,156 -,174 ,442
a. This level combination of factors is not observed, thus the corresponding
population marginal mean is not estimable.

xviii
APPENDIX XI: ANOVA – Quantity of seed
Tests of Between-Subjects Effects
Dependent Variable: Seed rate
Source Type III Sum of
Squares
df Mean Square F Sig.
Corrected Model 20658,322a 9 2295,369 3,732 ,000
Intercept 134663,427 1 134663,427 218,961 ,000
Wealth_class 8510,096 2 4255,048 6,919 ,001
Village 3773,083 1 3773,083 6,135 ,014
GenderHH 156,670 1 156,670 ,255 ,614
Wealth_class * Village 5137,434 1 5137,434 8,353 ,004
Wealth_class * GenderHH 1150,720 2 575,360 ,936 ,394
Village * GenderHH 1232,659 1 1232,659 2,004 ,158
Wealth_class * Village *
GenderHH ,004 1 ,004 ,000 ,998
Error 143297,801 233 615,012
Total 673449,756 243
Corrected Total 163956,123 242
a. R Squared = ,126 (Adjusted R Squared = ,092)
Estimated Marginal Means
Wealth_class * Village
Dependent Variable: Seed rate
Wealth_class Village Mean Std. Error 95% Confidence Interval
Lower Bound Upper Bound
a Busia 53,313 3,335 46,742 59,883
Mumias 51,828 3,688 44,562 59,094
p Busia 30,233 3,710 22,924 37,543
Mumias 49,515 3,625 42,374 56,657
r Busia .
a . . .
Mumias 38,422 10,124 18,475 58,369
a. This level combination of factors is not observed, thus the corresponding
population marginal mean is not estimable.
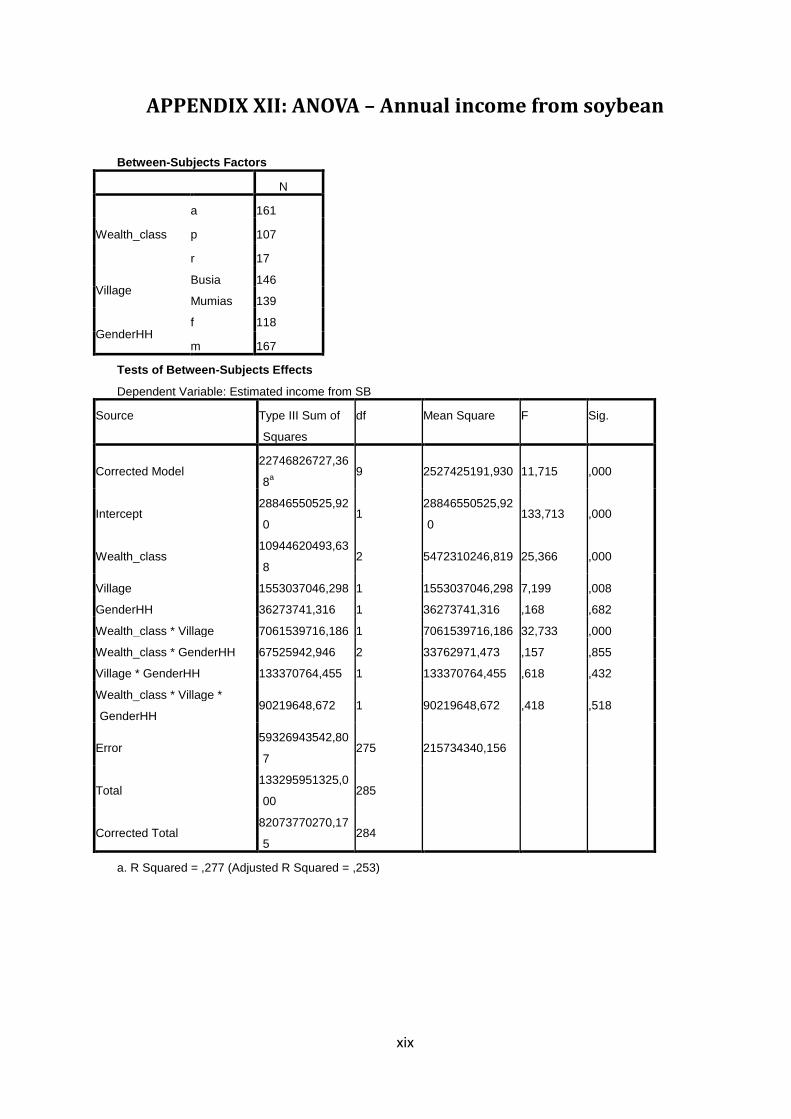
xix
APPENDIX XII: ANOVA – Annual income from soybean
Between-Subjects Factors
N
Wealth_class
a 161
p 107
r 17
Village Busia 146
Mumias 139
GenderHH f 118
m 167
Tests of Between-Subjects Effects
Dependent Variable: Estimated income from SB
Source Type III Sum of
Squares
df Mean Square F Sig.
Corrected Model 22746826727,36
8a
9 2527425191,930 11,715 ,000
Intercept 28846550525,92
0 1
28846550525,92
0 133,713 ,000
Wealth_class 10944620493,63
8 2 5472310246,819 25,366 ,000
Village 1553037046,298 1 1553037046,298 7,199 ,008
GenderHH 36273741,316 1 36273741,316 ,168 ,682
Wealth_class * Village 7061539716,186 1 7061539716,186 32,733 ,000
Wealth_class * GenderHH 67525942,946 2 33762971,473 ,157 ,855
Village * GenderHH 133370764,455 1 133370764,455 ,618 ,432
Wealth_class * Village *
GenderHH 90219648,672 1 90219648,672 ,418 ,518
Error 59326943542,80
7 275 215734340,156
Total 133295951325,0
00 285
Corrected Total 82073770270,17
5 284
a. R Squared = ,277 (Adjusted R Squared = ,253)

xx
Estimated Marginal Means
Wealth_class * Village
Dependent Variable: Estimated income from SB
Wealth_class Village Mean Std. Error 95% Confidence Interval
Lower Bound Upper Bound
a Busia 26019,245 1970,334 22140,391 29898,100
Mumias 9211,457 1800,747 5666,455 12756,458
p Busia 1918,742 2197,388 -2407,097 6244,581
Mumias 7994,792 2011,223 4035,442 11954,142
r Busia .
a . . .
Mumias 22741,667 3909,115 15046,073 30437,260
a. This level combination of factors is not observed, thus the corresponding population
marginal mean is not estimable.

xxi
APPENDIX XIII: Logistic regression - Open air market
Case Processing Summary
Unweighted Casesa N Percent
Selected Cases
Included in Analysis 267 97,8
Missing Cases 6 2,2
Total 273 100,0
Unselected Cases 0 ,0
Total 273 100,0
a. If weight is in effect, see classification table for the total
number of cases.
Dependent Variable
Encoding (Open air market)
Original
Value
Internal
Value
0 0
1 1
Categorical Variables Codings
Frequency Parameter
coding
(1)
GenderHH f 113 1,000
m 154 ,000
Village Busia 144 1,000
Mumias 123 ,000
Wealth_class a 159 1,000
p 108 ,000
Block 0: Beginning Block
Classification Tablea,b
Observed Predicted
Openairmarket Percentage
Correct 0 1
Step 0
Openairmark
et
0 211 0 100,0
1 56 0 ,0
Overall Percentage 79,0
a. Constant is included in the model.
b. The cut value is ,500

xxii
Variables in the Equation
B S.E. Wald df Sig. Exp(B)
Step 0 Constant -1,327 ,150 77,871 1 ,000 ,265
Block 1: Method = Enter
Omnibus Tests of Model Coefficients
Chi-square df Sig.
Step 1
Step 13,979 3 ,003
Block 13,979 3 ,003
Model 13,979 3 ,003
Model Summary
Step -2 Log likelihood Cox & Snell R
Square
Nagelkerke R
Square
1 260,288a ,051 ,079
a. Estimation terminated at iteration number 5 because
parameter estimates changed by less than ,001.
Classification Tablea
Observed Predicted
Openairmarket Percentage
Correct 0 1
Step 1 Openairmarket
0 211 0 100,0
1 56 0 ,0
Overall Percentage 79,0
a. The cut value is ,500
Variables in the Equation
B S.E. Wald df Sig. Exp(B)
Step 1a
Wealth_class(1) ,103 ,342 ,090 1 ,764 1,108
Village(1) 1,121 ,337 11,060 1 ,001 3,068
GenderHH(1) ,569 ,340 2,804 1 ,094 1,766
Constant -2,334 ,427 29,879 1 ,000 ,097
a. Variable(s) entered on step 1: Wealth_class, Village, GenderHH.

xxiii
APPENDIX XIV: Frequency of answers of farmers to several qualitative questions.
Question Answer modality Number Percentage Number Percentage Number Percentage
Price 130 92% 97 66% 227 80%
Market availability 29 21% 37 25% 66 23%
Distance 58 41% 0 0% 58 21%
Quantity 10 7% 36 25% 46 16%
Demand 30 21% 13 9% 43 15%
Payment terms 0 0% 25 17% 25 9%
Transport cost 31 22% 4 3% 35 12%
Quality 0 0% 0% 22 8%
Directly after harverst - - - - 272 93%
Delayed - - - - 19 7%
Ready market - - - - 130 46%
Need cash - - - - 60 21%
To avoid losses - - - - 28 10%
Higher price - - - - 17 6%
Rules of collective marketing - - - - 28 10%
To prepare next crop - - - - 27 10%
Need space - - - - 7 2%
Stable price 115 83% 21 18% 136 52%
Higher price 9 7% 70 59% 79 30%
Reduced transport cost 102 74% 58 49% 160 61%
Transport cost same or higher 0 0% 31 26% 31 12%
Production has increased 117 85% 86 72% 203 77%
Adoption of BNF technology 105 74% 13 10% 118 44%
I increased my SB surface 92 65% 44 35% 136 51%
I plan to increase SB surface 13 9% 0 0% 13 5%
Higher soil fertility, other crop perform better 69 49% 110 88% 179 67%
Access to inputs on loan 1 1% 86 69% 87 33%
Group monitoring makes me work harder 0 0% 6 5% 6 2%
I have money for paying school fee 5 4% 7 6% 12 5%
Village
What have
change for
you in SB
market ?
What have
change for
you in SB
cultivation
?
Why ?
(Relatively
to previous
question)
Busia Mumias Total
What are
your criteria
to choose a
market?
When do yo
sell
soybean?

xxiv
APPENDIX XV: Frequency of answers of farmers to the question on advantages/disadvantages of several markets.
APPENDIX XVI: Frequency of answers of farmers to the question : How could the situation be improved within the
grouping project with SRC?
Question Answer modality Number Percentage Number Percentage Number Percentage
Low price - - - - 119 95%
Take long time - - - - 3 2%
Not reliable - - - - 3 2%
pay cash - - - - 4 22%
take risks - - - - 7 39%
work on my behalf - - - - 7 39%
SRC lack of ressources 81 57% 0 81 30%
Late payment - - - - 105 39%
Buy late - - - - 14 5%
Strict rules - - - - 10 4%
Low price 7 5% 47 39% 54 20%
Collective marketing - - - - 132 52%
Take big quantities all at once - - - - 75 29%
Reliable market - - - - 25 10%
Pay cash - - - - 15 6%
Stable price - - - - 7 3%
Small volume - - - - 116 68%
Take a long time - - - - 20 12%
Rainfalls - - - - 12 7%
Price variability - - - - 7 4%
Distance - - - - 7 4%
High price - - - - 135 88%
Market on your own - - - - 18 12%
Advantages
Open air
markets
Inconvenie
nts middle
men
Advantages
middle men
Inconvenie
nts farmer
groups
Advantages
farmer
group
Inconvenie
nts Open air
markets
Village
Busia Mumias Total
Question Answer modality Number Percentage Number Percentage Number Percentage
More training 35 24% 27 22% 62 23%
Give loans to lease more land 3 2% 6 5% 9 3%
Prompt payment 100 69% 21 17% 121 44%
More informations to farmers not involved 20 14% 4 3% 24 9%
Delivery of input on time before planting season 17 12% 6 5% 23 8%
Monitor/visit farmer during the season, check-up11 8% 44 35% 55 20%
Give equipement to farmer 8 6% 1 1% 9 3%
Fongicides in smaller package, provide pumps 0 0% 6 5% 6 2%
Supply more input to increase area planted 12 8% 3 2% 15 5%
Support buying of input with cheap loans 21 14% 16 13% 37 13%
7%
Build other SRC or collection point closer to farmers3 2% 35 28% 38 14%
Increase the buying price of SB 2 1% 65 52% 67 24%
5 3% 13 10% 18
Village
How could
the
situation be
improved
within the
grouping
project with
SRC ? Give loans
of cash to
Busia Mumias Total

xxv
APPENDIX XII: Comparison of quantity of input distributed by SRC’s
Input Quantity distributed
Land cultivable with recommended rate (ha)
Village
Busia
Fertilizer (t) 10 83
Biofix (kg) 15 20
Seeds (t) 7 93
Biocide (l) 60 80
Mumias
Fertilizer (t) 10 83
Biofix (kg) 50 67
Seeds (t) 4 53
Biocide (l) 40 53
Butere
Fertilizer (t) 13 108
Biofix (kg) 7,8 10
Seeds (t) 5 67
Biocide (l) 0 0
Tesso
Fertilizer (t) 5 42
Biofix (kg) 180 240
Seeds (t) - -
Biocide (l) - -

xxvi
APPENDIX http://www.pierreetvacances.com/resorts/fr-fr/location-ete-landes-moliets_MLL-
E_fp?hc=MLB15&duree=7&dated=2013-08-31 XIII: ANOVA – Area cultivated with soybean
Between-Subjects Factors
N
Wealth_class
a 159
p 108
r 17
Village Busia 146
Mumias 138
GenderHH f 117
m 167
Tests of Between-Subjects Effects
Dependent Variable: SB_area_ha
Source Type III Sum of
Squares
df Mean Square F Sig.
Corrected Model 3,269a 9 ,363 7,658 ,000
Intercept 7,358 1 7,358 155,139 ,000
Wealth_class ,906 2 ,453 9,549 ,000
Village ,296 1 ,296 6,247 ,013
GenderHH ,156 1 ,156 3,284 ,071
Wealth_class * Village ,968 1 ,968 20,399 ,000
Wealth_class * GenderHH ,053 2 ,027 ,561 ,571
Village * GenderHH ,004 1 ,004 ,087 ,768
Wealth_class * Village *
GenderHH ,017 1 ,017 ,361 ,548
Error 12,996 274 ,047
Total 31,205 284
Corrected Total 16,265 283
a. R Squared = ,201 (Adjusted R Squared = ,175)

xxvii
Estimated Marginal Means
Wealth_class * Village
Dependent Variable: SB_area_ha
Wealth_class Village Mean Std. Error 95% Confidence Interval
Lower Bound Upper Bound
a Busia ,280 ,029 ,222 ,337
Mumias ,220 ,027 ,167 ,273
p Busia ,035 ,033 -,029 ,099
Mumias ,243 ,029 ,185 ,301
r Busia .
a . . .
Mumias ,375 ,058 ,261 ,489
a. This level combination of factors is not observed, thus the corresponding
population marginal mean is not estimable.